

Abstract
Mitochondrial defects within substantia nigra (SN) neurons are implicated in the pathogenesis of Parkinson's disease. SN neurons show increased mitochondrial defects, mitochondrial DNA deletion levels, and susceptibility to such dysfunction, although the role of mitochondria in neuronal degeneration remains uncertain. In this study, we addressed this important question by exploring changes within the mitochondria of SN neurons from patients with primary mitochondrial diseases to determine whether mitochondrial dysfunction leads directly to neuronal cell loss. We counted the pigmented neurons and quantified mitochondrial respiratory activity, deficiencies in mitochondrial proteins, and the percentage of pathogenic mutations in single neurons. We found evidence of defects of both complex I and complex IV of the respiratory chain in all patients. We found that marked neuronal cell loss was only observed in a few patients with mitochondrial disease and that all these patients had mutations in polymerase gamma (POLG), which leads to the formation of multiple mitochondrial DNA deletions over time, similar to aging and Parkinson's disease. Interestingly, we detected α-synuclein pathology in two mitochondrial patients with POLG mutations. Our observations highlight the complex relationship between mitochondrial dysfunction and the susceptibility of SN neurons to degeneration and α-synuclein pathology. Our finding that the loss of SN neurons was only severe in patients with POLG mutations suggests that acquired mitochondrial defects may be less well tolerated by SN neurons than by inherited ones.
Introduction
Mitochondrial dysfunction is thought to play a role in several different neurodegenerative diseases, including Parkinson's disease (PD) and other synucleinopathies (Abou-Sleiman et al., 2006; Schapira, 2007; Surmeier et al., 2011; Vives-Bauza and Przedborski, 2011). Several explanations for the increased sensitivity of substantia nigra (SN) neurons to mitochondrial dysfunction have been proposed, including increased levels of iron and calcium metabolism within this brain region. A role for this dysfunction in the pathogenesis of PD has been strengthened over the past few years by the discovery that several of the genes responsible for early onset familial forms of these diseases have a role associated with mitochondrial function, including Pink1 (PARK6 [MIM 608309]), parkin (PARK2 [MIM 602544]; Narendra et al., 2008, 2010), and DJ-1 (PARK7 [MIM 602533]; Mitsumoto and Nakagawa, 2001), whereas α-synuclein (PARK1 [MIM 168601]) is thought to damage mitochondria directly (Devi et al., 2008; Parihar et al., 2008). In addition, high levels of respiratory deficiency and mitochondrial DNA (mtDNA) deletions are found within the neurons of the SN both in patients with PD and in normal aging (Bender et al., 2006; Kraytsberg et al., 2006). mtDNA mutations have also been implicated as being important for PD based upon cybrid studies (Swerdlow et al., 1996; Gu et al., 1998). Previous studies have shown reduced activity of mitochondrial complex I in SN neurons and PD-like symptoms in response to various drugs and toxins, including MPTP and rotenone (Burns et al., 1983; Langston et al., 1983; Schapira et al., 1989; Betarbet et al., 2000). Despite evidence suggesting a role for mitochondrial dysfunction in the loss of SN neurons, there remains considerable uncertainty about the mechanisms involved.
Mutations within mtDNA also cause a group of diseases termed the mitochondrial disorders, which have a minimum prevalence of clinical manifestation in 1 in 5000 people (Schaefer et al., 2008). Neurological defects including ataxia, seizures, dementia, and stroke-like episodes are common in patients with mitochondrial disorders, reflecting the reliance of neurons on mitochondrial function. Cell loss in clinically relevant brain regions such as the cerebellum is correlated with changes in mitochondrial protein levels and cell densities (Tanji et al., 1999a,b; Lax et al., 2012a,b). Pathogenic mutations within mtDNA can be point mutations or large-scale deletions. Multiple mtDNA deletions also occur as a result of mutations in nuclear genes, including polymerase gamma (POLG; Hudson and Chinnery, 2006), and Parkinsonism has been reported in some patients with POLG mutations (Luoma et al., 2004; Mancuso et al., 2004; Davidzon et al., 2006; Pagnamenta et al., 2006; Tzoulis et al., 2006; Hudson et al., 2007; Galassi et al., 2008; Invernizzi et al., 2008; Remes et al., 2008; Betts-Henderson et al., 2009; Sato et al., 2011). To gain further insights into the sensitivity of SN neurons to mitochondrial dysfunction and the effects of this dysfunction on neuronal survival, we investigated the prevalence of mitochondrial defects within the SN of patients with four different mtDNA disorders caused by both point mutations and deletions. The single large-scale mtDNA deletions and point mutations are present throughout life, whereas multiple mtDNA deletions caused by POLG mutations accumulate over time, similar to the situation in aging and in patients with PD (Taylor and Turnbull, 2005). Therefore, our selection of patients also enabled us to compare the effects of inherited mtDNA mutations with those of acquired mutations on SN neurons.
Materials and Methods
Mitochondrial disease patients
A total of 11 patients with clinically and neuropathologically confirmed mitochondrial disease were included. All patients were severely affected with mitochondrial disease and some had been previously included in a study examining the pathology of cerebellar ataxia in patients with mitochondrial disease (Table 1 and Lax et al., 2012a). Due to the limited number of single large-scale deletion patients within the Newcastle Brain Tissue Resource (NBTR), we acquired sections from a patient with a single large-scale mtDNA deletion from Dr K. Tanji (Columbia University, New York, NY). Details of this patient have been described previously (Shanske et al., 1990).
Table 1.
Summary of the patient cohort used for this study including age, sex, genotype, major neurological features, the presence of extrapyramidal involvement and neuropathology of the SN
| MELAS 1 (m.3243 A>G) | MELAS 2 (m.3243 A>G) | MERRF 1 (m.8344A>G) | MERRF 2 (m.8344 A>G) | Single deletion 1 | Single deletion 2 | POLG 1 | POLG 2 | POLG 3 | POLG 4 | POLG 5 | |
|---|---|---|---|---|---|---|---|---|---|---|---|
| Age (years) | 20 | 59 | 42 | 58 | 40 | 22 | 50 | 24 | 59 | 79 | 55 |
| Sex | Female | Female | Female | Male | Female | Female | Male | Female | Male | Male | Male |
| Genotype | m.3243A>G | m.3243A>G | m.8344A>G | m.8344A>G | m.11756-15636 | m.8469-13447 | p.stop1240Gln and p.Ala467Thr with multiple mtDNA deletions | p.Ala467Thr and p.Trp748Ser with multiple mtDNA deletions | p.Gly848Ser and p.Ser1104Cys with multiple mtDNA deletions | p.Thr251Ile and p.Ala467Thr with multiple mtDNA deletions | p.Trp748Ser and p.Arg1096Cys multiple mtDNA deletions |
| Disease duration (years) | 10 | 33 | 24 | 18 | 37 | 18 | 22 | 4 | 37 | 26 | 40 |
| Major neurological features | Ataxia, stroke-like episodes, cognitive impairment, deafness, encephalopathy | Ataxia, stroke-like episodes, epilepsy, dementia, deafness, encephalopathy, migraine, depression | Ataxia, deafness, myopathy, myoclonus, depression | Ataxia, epilepsy, peripheral neuropathy, myoclonus, areflexia | Ataxia, dementia, encephalopathy, depression, myopathy, CPEO, heart block | Ataxia, seizures, intention tremor | Ataxia, epilepsy, dementia, peripheral neuropathy, myoclonus, encephalopathy, CPEO, myopathy, depression | Ataxia, epilepsy, dementia, encephalopathy, myoclonus, depression | Ataxia, dementia, peripheral neuropathy, areflexia, depression | Ataxia, myopathy, CPEO, dysphagia | Ataxia, cognitive decline, CPEO, myopathy, neuropathy, myoclonus, psychosis |
| SN pathology | Normal neuronal density; pale neuromelanin in pigmented cells; α-Syn/LB: none | Intact neuronal population α-Syn/LB: none | Moderate loss of neurons in LMB, less pronounced in the UMB; α-Syn/LB: none | Intact neuronal population, mild to moderate neuropil microvacuolation; α-Syn/LB: none | Intact neuronal populations; mild to moderate vacuolation; α-Syn/LB: none | Unknown | Severe neuronal loss; α-Syn/LB: none | Moderately severe neuronal loss; α-Syn/LB: none | Moderately severe neuronal loss; α-Syn/LB: extensive | Mild focally moderate cell loss; α-Syn/LB: extensive | Severe loss of UMB SN neurons; α-Syn/LB: none |
| Presence of extrapyramidal involvement | No | No | No | No | No | No | No | No | Parkinsonian symptoms | No | No |
| Patient numbera | Patient 6 | Patient 1 | Patient 8 | N/A | Patient 11 | N/A subjectb | Patient 14 | Patient 12 | Patient 13 | N/A | N/A |
α-Syn, Synuclein; LB, Lewy body; LMB, lower midbrain; UMB, upper midbrain; CPEO, chronic progressive external ophthalmoplegia.
aFrom Lax et al. (2012a,b).
bReported in Shanske et al. (1990).
Table 1 shows neurological features of these 11 patients and the presence of any extrapyramidal features that were present, as well as details of mutations within both mitochondrial and nuclear genes. This study encompassed patients harboring different mtDNA mutations with different syndromes, including two patients with mitochondrial encephalomyopathy, lactic acidosis, and stroke-like episodes (MELAS) due to the m.3243A>G mutation, two patients with myoclonic epilepsy with ragged red fibers (MERRF) due to the m.8344A>G mutation, two patients with Kearns–Sayre syndrome (KSS) due to single large-scale mtDNA deletions, and five patients with autosomal recessive mutations in POLG with multiple mtDNA deletions. Table 2 shows a summary of control patients used in this study, including age, sex, post mortem delay, cause of death, and histopathological features in the SN.
Table 2.
Summary of control cases used in this study, including age, sex, post mortem delay, cause of death, and summary of the neuropathology report regarding the SN
| Case | Sex | Age (years) | Post mortem delay (h) | Cause of death | SN pathology |
|---|---|---|---|---|---|
| Control 1 | Male | 48 | — | — | — |
| Control 2 | Male | 53 | — | Left ventricular failure due to ischemic heart disease | Normal |
| Control 3 | Female | 56 | — | — | — |
| Control 4 | Female | 58 | — | Lung cancer and Cushing's disease | Normal pigmentation with a small amount of extraneuronal neuromelanin |
| Control 5 | Female | 59 | — | Bowel cancer | Normal |
| Control 6 | Female | 59 | — | — | Mild neuronal loss with reduced neuromelanin |
| Control 7 | Male | 64 | 64 | — | Normal |
| Control 8 | Male | 70 | 72 | Metastatic prostate cancer | Mild age associated neuronal loss with some age related Lewy body pathology |
| Control 9 | Female | 69 | 16 | Gastric cancer | Normal pigmentation with a small amount of extraneuronal neuromelanin |
| Control 10 | Male | 65 | 28 | Respiratory failure due to acute bronchial asthma | Normal |
| Control 11 | Male | 55 | 41 | Liver cancer | Normal |
| Control 12 | Male | 50 | 7 | Coronary artery thrombosis | Normal |
Tissue
All midbrain tissue for this study (with the exception of single deletion case 2; Shanske et al., 1990) was obtained from the NBTR. The collection and use of all human tissue in this study was approved by the appropriate local research ethics committee and conformed to the United Kingdom Medical Research Council's guidelines on the use of tissue in medical research. The midbrain tissue from mitochondrial disease cases was matched to an appropriate control. Patients ranged in age from 20 to 79 years (mean, 46.2) and included 6 females and 5 males. Table 1 shows relevant clinical data for all of the mitochondrial patients used within this study. Control subjects ranged in age from 48 to 70 years (mean, 56) and included 7 males and 5 females. Details of these control subjects, including the cause of death, can be found in Table 2. An age-matched control was found for the majority of patients; however, finding exact matches to the younger mitochondrial disease cases proved more difficult.
Histology and immunohistochemistry
With the exception of the second single large-scale mtDNA deletion case (single deletion 2), all tissue was treated identically. Due to the limited number of single large-scale deletion cases available within the NBTR, we were limited in the available tissue sections for this second single deletion case. Two 20-μm-thick sections of formalin-fixed paraffin-embedded upper midbrain were taken from each case at the start and end of the cutting series. These thick sections were stained using cresyl fast violet (CFV) and were used for neuronal counting. Immunohistochemistry for five mitochondrial proteins (porin, complex II [succinate dehydrogenase]) 70 kDa subunit, complex I (NADH:CoQ oxidoreductase) 19 kDa subunit, complex I 20 kDa (CI20) subunit, and complex IV (cytochrome c oxidase [COX]) subunit I (Mitosciences), α-synuclein (Novacastra), and tyrosine hydroxylase (TH; Sigma) was performed on 5 μm formalin-fixed paraffin-embedded sections, as described previously (Lax et al., 2012a; Reeve et al., 2012) on tissue from 10 cases, including single deletion 2. The cells within the SN were then counted as described below. Deficient cells were those with an absence of immunoreactivity for the mitochondrial protein of interest. From the patients from whom frozen material was available (controls 7, 8, 11, and 12 and all mitochondrial disease cases with the exception of POLG1 and 2), 5 μm sections were stained for activity in complexes IV (COX) and II (succinate dehydrogenase [SDH]), using the previously reported COX/SDH assay (Betts et al., 2006).
Neuronal cell counts in SN
The extent of nigral neuron loss in the 10 patients with mitochondrial disease and the 10 age-matched controls (obtained from the NBTR) could not be determined from dissector counts in serial sections of the whole nigral nucleus because these were unavailable. Instead, a counting method was devised based on the findings of Ma et al. (1995a, 1995b) that dissector counts show good correlation with single two-dimensional counts if the rostrocaudal level of the SN in the section is well defined and the section thickness is kept constant.
Two-dimensional neuronal cell counts in the patients with mitochondrial disorders and the age-matched controls were performed as described previously (Lax et al., 2012a). For each case, two 20 μm sections were cut and stained with CFV to allow identification of the SN neuronal population and the rostrocaudal level of the SN. The SN was outlined at low magnification (2×), and then a meander scan was performed at a higher magnification (40×). This feature scans the whole region of interest, allowing the absolute cell number to be determined. Cells with a defined nucleus and nucleolus and that also contained neuromelanin were counted. Each CFV section used in this study was then matched to the appropriate rostrocaudal level within the control where serial sections of the midbrain were available. The neuron count was then calculated as a percentage of the neuron count at the same level within this control.
The rostrocaudal levels of the SN were defined from 16 levels of serially cut 20-μm-thick CFV-, Loyez-, and hematoxylin/eosin-stained sections of upper and lower midbrain from one normal control patient 74 years of age. The definitions of the levels were based on relative positions and shape of myelin fiber tracts, including cranial nerve III, medial longitudinal fasciculus, medial lemniscus and its subdivisions, and decussation of brachium conjunctivum in relation to the dorsal and ventral tiers of the SN.
For the second single large-scale mtDNA deletion patient, only 5 μm sections were available. The cell counts could not be compared in the same manner as above because the orientation of the section did not allow comparison with any of the levels in the control. Therefore, the density of the neurons within the SN was calculated based on the area of the SN and compared with the density of neurons within a similar 5 μm section from the first single mtDNA deletion case and controls.
Determination of percentage level mutated mtDNA to wild-type mtDNA
Sample preparation for molecular analysis.
For both point mutation and deletion level analysis, cryostat sections of upper midbrain (20 μm thick) were mounted onto PEN-membrane slides (Leica Microsystems) and COX/SDH histochemistry was performed. Single COX-positive neurons were dissected from the SN, collected, and lysed (LMD 6000; Leica Microsystems). Briefly, cells to be dissected are drawn around in the software and the laser then cuts out the individual cell. To limit contamination, we took care to cut as close to the cell boundary as possible so that we did not remove matter from the neuropil. Single cells were cut into 500 μl tubes and the tube caps inspected to verify the presence of only one cell per tube. To limit the risk of contamination, neurons were cut into tubes that had been UV sterilized before each session of cutting. DNA extraction was performed at 55°C using a standard lysis buffer for a minimum of 3 h, with a proteinase K inactivation step of 10 min at 95°C.
Pyrosequencing for point mutations.
The quantification of mtDNA mutation load in single SN neurons was performed as described previously (Lax et al., 2012a). For this study, two pyrosequencing assays were used: one for m.3243A>G and the other for the m.8344A>G mutation. The quantification of heteroplasmy levels for mtDNA point mutations has been validated previously (White et al., 2005). Pyrosequencing was performed as per the manufacturer's protocol (Qiagen) using a mutation-specific pyrosequencing primer. Pyromark Q24 software (Qiagen) was used to quantify mutated mtDNA heteroplasmy levels by comparing directly the relevant peak heights of both wild-type and mutant mtDNA at this site.
Real-time PCR for mtDNA deletions.
A multiplex real-time PCR MT-ND1/MT-ND4 assay was used to quantify the levels of mtDNA deletions in individual SN neurons, as described previously (Krishnan et al., 2007; Lax et al., 2012a). This assay detects deletions that occur within the major arc of mtDNA, and the majority of mtDNA deletions are thought to occur within this region in both disease and aging (Samuels et al., 2004). A total of 2 μl of sample was used and run in triplicate in a 96-well plate. Each run also included known deletion-level standards and a blood control, also run in triplicate.
Statistical analysis.
An unpaired t test was used to compare mutation loads between patients and controls.
Results
Lewy body pathology
All cases and controls used in this study were stained for α-synuclein (for clinical and pathological data, please refer to Tables 1 and 2). The presence of α-synuclein immunoreactive Lewy bodies, pre-Lewy bodies, and cytoplasmic granular inclusions in pigmented SN neurons was used as evidence of Lewy body pathology. None of the controls showed any immunoreactivity for α-synuclein within the SN. α-Synuclein immunoreactivity was also absent from the m.8344A>G MERRF, m.3243A>G MELAS, and KSS single large-scale mtDNA deletion cases despite the potential effects that mitochondrial dysfunction could have on the ubiquitin proteasome system (for review, see Livnat-Levanon and Glickman, 2011). α-Synuclein-positive Lewy body pathology was, however, found in two of the five POLG cases (POLG 3 and 4) used in this study, one of which has been described previously (Betts-Henderson et al., 2009; Fig. 1). Lewy body pathology in these two cases included Lewy bodies and neurites plus cytoplasmic granular staining of SN neurons. It is particularly interesting that POLG patient 4 showed little cell loss above that associated with normal aging and yet showed severe α-synuclein pathology.
Figure 1.
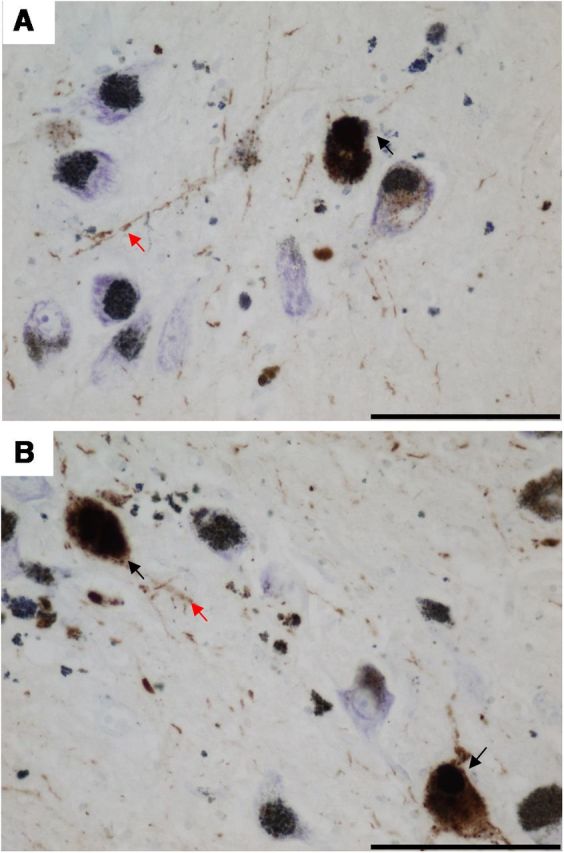
α-Synuclein immunoreactivity in SN of POLG patients, a marker of Lewy body pathology. A, B, Two of the five POLG/multiple deletion patients studied (A, POLG 3; B, POLG 4) showed α-synuclein-positive Lewy body pathology within pigmented SN neurons. Pathology included Lewy bodies, pre Lewy bodies, cytoplasmic granular inclusions (black arrows), and Lewy neurites (red arrows). Sections were counterstained with CFV. Images were taken at a 40× magnification. Scale bar, 100 μm.
Deficiency of mitochondrial proteins in SN neurons
In this study, we examined the levels of 5 mitochondrial proteins within SN neurons in 10 patients with mitochondrial disease and 8 controls (POLG 1 and 2 of the controls were excluded from this analysis due to an extremely long fixation time severely affecting immunohistochemistry). We examined two subunits of complex I of the electron transport chain [complex I 19 kDa (CI19) and complex I 20 kDa (CI20)] because deficiencies of this protein have been reported in patients with mtDNA disease and in both elderly individuals and PD cases (Schapira et al., 1989; Distelmaier et al., 2009; Lax et al., 2012a; Reeve et al., 2012). We also examined levels of complex IV subunit I (COXI), which has been reported previously to be correlated with activity in this complex (Mahad et al., 2009). Complex II (CII70) was also studied because it is fully encoded by the nuclear genome and preserved in the presence of mtDNA disease. To assess changes in mitochondrial density within SN neurons, we used porin, a protein on the mitochondrial outer membrane. For complexes I and IV, the number of SN neurons within a 5 μm section with clearly defined nuclei were counted and the number of deficient cells calculated.
Porin and CII70 immunohistochemistry did not reveal any difference in mitochondrial density within SN neurons between patients with mitochondrial disease and controls (Fig. 2). There were no neurons that showed a deficiency of complex II or porin.
Figure 2.

Porin immunoreactivity in SN neurons, a marker of mitochondrial density. All pigmented SN neurons in patients with mitochondrial disorders showed a uniform density of mitochondria, similar to controls. A–D, Shown is KSS/single large-scale deletion patient 1 (A), m.8344 A>G point mutation patient (B), POLG/multiple deletion patients (C), and controls (D). A also highlights the microvacuolation that was widespread throughout the brain and mild to moderate within the SN of this case. Images were taken at a 40× magnification. Scale bar, 100 μm.
Control cases (n = 8) showed low levels of complex I deficiency for both subunits (Fig. 3D,H). For CI20, on average, 6.7 ± 3.6% (mean ± SD; range, 1.5–12.5%) of control SN neurons were deficient, whereas for CI19, this value was 5.7 ± 2.0% (range, 1.5–8.0%; Fig. 3I). For the mitochondrial disease cases, the level of deficiency was within the control range for the m.3243A>G MELAS cases for both CI20 (6.4% MELAS1 and 4.6% MELAS2) and CI19 (4.8% MELAS1 and 5.5% MELAS2). For the m.8344A>G MERRF cases, MERRF1 showed a level of deficiency that fell within the control range for both CI20 (5.1%) and CI19 (3.0%), whereas MERRF2 had a higher level of deficiency for both proteins (CI20, 22.0%; CI19, 16.3%). In tissue from patients with POLG deficiency and multiple deletions, the level of deficiency was significantly higher (CI20, 30.5 ± 10.2%; CI19, 20.8 ± 2.9%). The highest level of complex I deficiency, however, was found in a patient with a single large-scale mtDNA deletion who had a level of 44% for CI20 and 31% for CI19; another single deletion patient showed levels of complex I deficiency similar to the point mutation patients (CI20, 13.75%; CI19, 8.27%).
Figure 3.
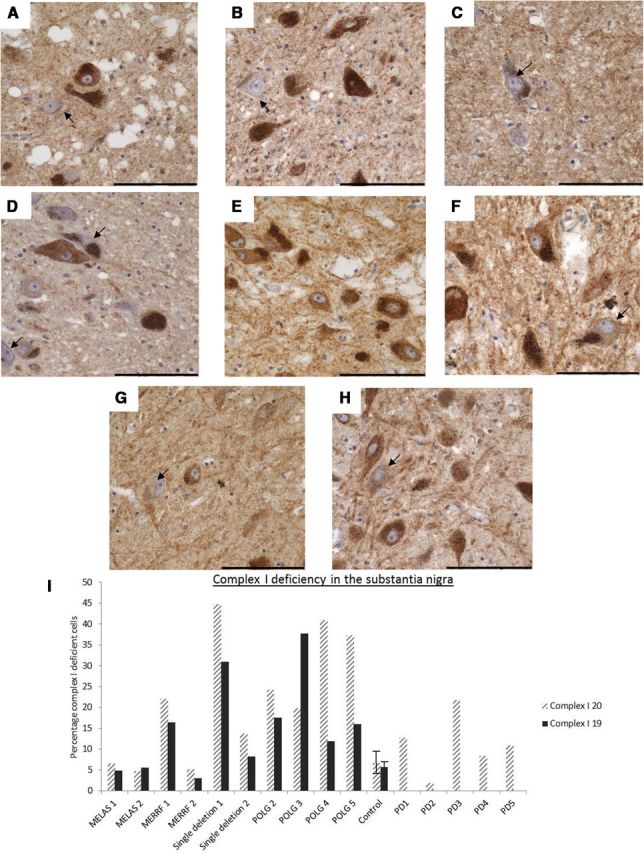
Complex I immunohistochemistry showing the variable degree of protein deficiency in SN neurons. Pigmented SN neurons with a deficiency in complex I subunits (arrows) were found in all cases and controls; however, the level of deficiency varied. A–H, Images show staining for CI20 (A–D) and CI19 (E–H), and the arrows indicate neurons showing deficiencies for these proteins. for these proteins. Deficiencies in the expression of these proteins were found in patients with point mutation (B, F), POLG/multiple deletions (C, G), and controls (D, H). Images were taken at a 40× magnification. Scale bar, 100 μm. I, The number of complex I-deficient neurons was then expressed as a percentage of the total counted neurons. Error bars show SD of controls (n = 10) and PD cases (n = 5).
For COXI (Figs. 4, 5E), controls again showed the lowest levels of deficiencies (4.2 ± 2.2% range, 1.1–8.0%), with cases MELAS1 (4.08%) and MERRF2 (3.18%) falling within this range. MELAS2 had a slightly higher level of deficiency (8.23%), followed by tissue from MERRF2 (22.9%). The patients with POLG deficiency and multiple deletions showed high levels of deficiency for this protein (14.8 ± 5.9%). Interestingly, the single mtDNA deletion patients exhibited the lowest levels of COXI deficiency at 0.9% and 2.7%, respectively.
Figure 4.

COXI immunohistochemistry showing the variable degree of deficiency in SN neurons. Pigmented SN neurons with a deficiency in COXI protein (arrows) were found in all patients with mitochondrial disease and controls, but the levels varied between cases. A–D, The single deletion patient (A) showed negligible levels of deficiency, whereas levels of deficiency were higher in in point mutation patients (B), POLG/multiple deletion patients (C), and controls (D). Images were taken at a 40× magnification. Scale bar, 100 μm.
Figure 5.
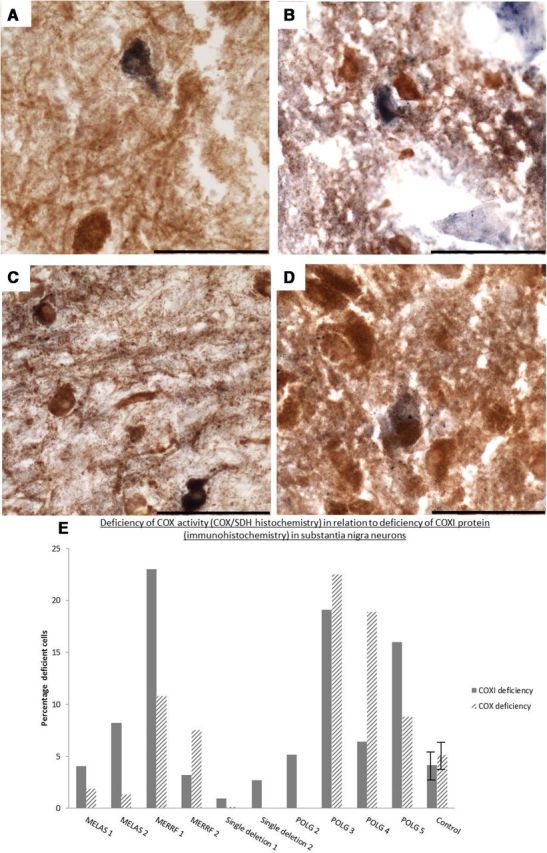
Deficiency in COX activity within SN neurons revealed by COX/SDH histochemistry. Respiratory (COX)-deficient neurons were found in the SN of all patients with mitochondrial disease and controls used within this study. However, the COX-deficient neurons (blue) were sparse in patients with KSS/single large-scale deletion (this patient had only one COX-deficient neuron; A) and point mutations (B). POLG/multiple deletion patients (C) generally showed higher levels of COX deficiency than the patients with inherited defects. Few COX-deficient neurons were present in the controls (D). Images were taken at a 40× magnification. Scale bar, 100 μm. E, Percentage of respiratory/COX-deficient neurons in patients with mitochondrial diseases and controls compared with data from COXI immunohistochemistry. Error bars show SD of controls (n = 10). Due to a lack of tissue availability, we were unable to perform COX/SDH histochemistry on all patients.
Neurons with deficiencies of complex IV activity are more common in patients with POLG mutations
For some cases, frozen midbrain tissue was available, allowing not only the study of mutation loads but also a comparison between the immunohistochemistry and the activity of complex IV using COX/SDH histochemistry. This assay allows the detection of cells with defects in the activity of complex IV (Fig. 5). The results from this assay replicated those from the immunohistochemistry. Controls and patients with point mutations showed low levels of COX deficiency (Fig. 5E, patterned columns; controls, 5.5 ± 4.5%; MELAS1, 1.9%; MELAS2, 1.3%; MERRF1, 7.6%; and MERRF2, 10.8%), whereas patients harboring POLG mutations and multiple mtDNA deletions showed the highest levels (20.7 ± 7.1%). Single deletion patient 1 exhibited very low levels of COX deficiency at 0.15%, which equated to the presence of only one COX deficient neuron shown in Figure 5.
mtDNA mutation levels are high in the SN of patients with mitochondrial disorders
To examine the effect of the pathogenic mtDNA mutations on SN neurons, we examined the overall heteroplasmy levels of mutations in single neurons. Consistent with previous reports, we found that mtDNA deletions were present in control neurons (mean for 3 cases, 25.6 ± 4.2%; Fig. 6A) and that the percentage level of these deletions rarely reached >60% (Bender et al., 2006; Kraytsberg et al., 2006).
Figure 6.
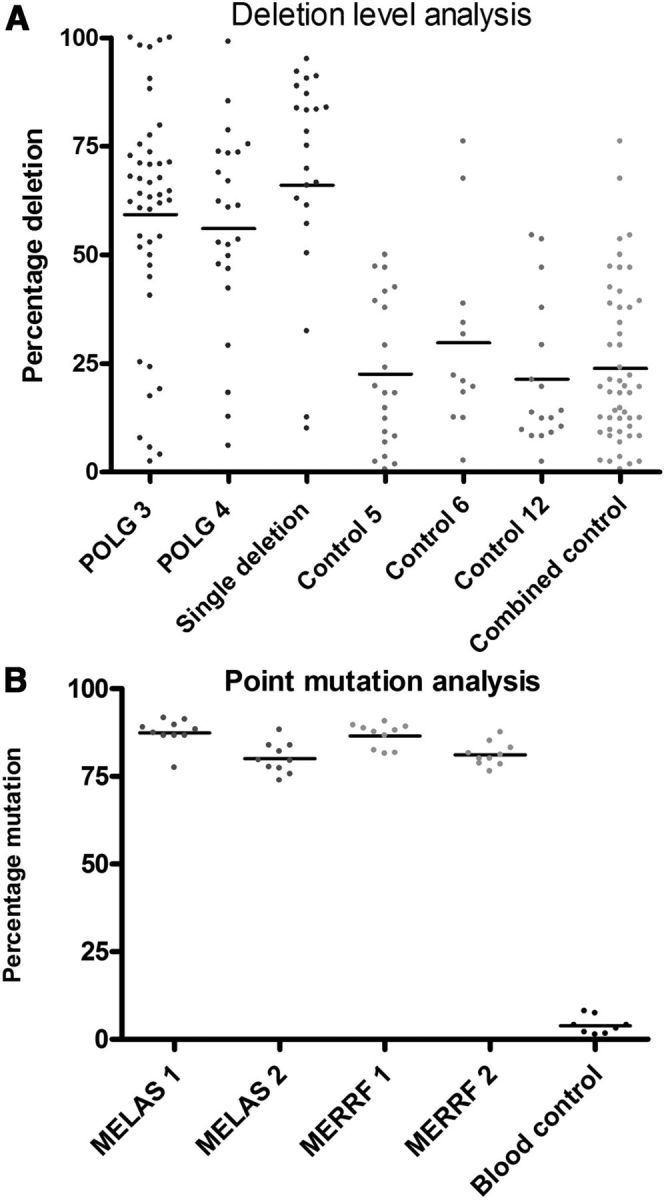
SN neurons of patients with mitochondrial disorders show high threshold levels for mtDNA mutations. A, Deletion levels within single SN neurons from POLG 3 (n = 45), POLG 4 (n = 23), and the KSS/single large-scale deletion patient 1 (n = 23) compared with controls (n = 21, 12, and 17, respectively). B, Point mutation threshold levels for m.3243 A>G MELAS and m.8344 A>G MERRF patients were measured in single SN neurons and in blood cells of a normal control using pyrosequencing (n = 10).
mtDNA deletion levels within the POLG and single large-scale mtDNA deletion KSS patients' neurons, however, were much higher than control neurons. For single large-scale mtDNA deletion patient 1, the mean deletion level was 69.5 ± 23.3%. For the POLG patients, the mean deletion level was 57.7 ± 2.3%. These results show that the SN cells of patients with mtDNA disease have a significantly (p < 0.0001) higher level of mtDNA deletions than controls.
The percentage levels of pathogenic point mutations were also measured using mutation specific pyrosequencing assays. High percentage levels of mutation were found in the majority of single neurons (Fig. 6B), with a mean mutation load of >80% for both the m.3243A>G (MELAS) and the m.8344A>G (MERRF) patients. The heteroplasmy levels for both mtDNA deletions and point mutations within SN neurons of these patients are comparable to the levels recently described within the cerebellar neurons of patients with mtDNA disease (Table 3; Lax et al., 2012a), an area of the brain where extensive cell loss is associated with respiratory deficiencies caused by the pathogenic mtDNA mutation.
Table 3.
Comparison of the mean SN neuronal mutation load to those within the neurons of the dentate nucleus and inferior olivary nucleus and the Purkinje cells of the cerebellum (Lax et al., 2012a)
| Patient | Purkinje cell mutation load (%) | Inferior olivary nucleus mutation load (%) | Dentate nucleus mutation load (%) | SN mutation load (%) |
|---|---|---|---|---|
| POLG 3 | 50.7 | — | 24.9 | 59.0 |
| Single deletion | 68.1 | 67.9 | 43.9 | 69.0 |
| MELAS 1 m.3243 A>G | 83 | — | 84 | 87.4 |
| MELAS 2 m.3243A>G | 90 | 93.0 | 77.5 | 80.1 |
| MERRF 1 m.8344 A>G | 91.9 | 86.1 | 87.4 | 81.3 |
In COX-positive normal neurons within the SN, we found levels of mtDNA mutations comparable to those seen within the cerebellar neurons (Table 3). It is interesting that these mutation levels were associated with cell loss in both the cerebellum and the SN in the patient POLG3, but in the patients with inherited defects, the levels of mtDNA mutation within the SN comparable to levels within the cerebellum were not associated with cell loss.
Neuronal loss within the SN of patients with mtDNA disorders
For each patient with mitochondrial disease and each control used for this study, two 20 μm (with the exception of single deletion 2), CFV-stained sections of midbrain were counted using the stereological microscope and the average of the two counts obtained. Although there was some variation among individuals, the mean neuron count from 10 controls expressed as a percentage of the count from the corresponding rostrocaudal level of SN from the normal serially sectioned midbrain was 96 ± 31% (Fig. 7). This variation would be expected based on the variability between controls from other studies (Fearnley and Lees, 1991). In addition, age-related loss of SN neurons is known to occur in normal individuals at a rate of 4.7% per decade (Fearnley and Lees, 1991), although the age range of the control cases used in this study was relatively narrow (48–70 years; mean, 58 ± 6.9 years; n = 10). The availability of tissue from younger individuals was much lower than for the elderly individuals, so finding an appropriate match for MELAS 1 and POLG 2 was particularly difficult. MELAS patients who harbored the m.3243A>G pathogenic point mutation showed variable changes, with one patient showing moderate loss of the SN neurons and the other showing a greater number of SN neurons than controls, whereas both m.8344A>G MERRF patients showed moderate cell loss (Fig. 7). There was evidence of only mild SN neuron loss in the patient with KSS due to a single large-scale deletion despite the very high levels of complex I deficiency (COXI protein levels and COX activity levels were normal). Although we could not use the same method to examine neuronal loss in the second single deletion patient because we had only thin sections, the density of pigmented neurons within the SN (10.35 cells per mm2) was comparable to that of the other single deletion patient 1 (7.96 cells per mm2). This suggested that, in both cases, the cell loss was minimal compared with controls (mean cell density, 8.49 ± 2.55 cells per mm2 for 6 control cases). The most severe SN neuron loss was seen in three of the five POLG cases (POLG 2, POLG 3, and POLG 5), in whom SN neuron counts were <30% of controls and more comparable to the SN neuron loss seen in patients with PD/dementia with Lewy bodies (DLB; Fig. 7A). This neuron loss is particularly dramatic when the age of the patients is taken into consideration and could represent an acceleration of the amount of SN neuron loss that occurs with normal aging. However, the moderate neuron loss in POLG 1 and absence of any apparent neuron loss in POLG 4 suggest that more complex factors are involved. In addition, the presence of α-synuclein-positive Lewy body pathology in the SN in two of the five POLG cases, one with severe loss of SN neurons (POLG 3) and the other without any neuron loss (POLG 4), indicates that vulnerability of SN neurons to degeneration and susceptibility to PD/DLB α-synuclein pathology are not simple.
Figure 7.

Pigmented neuron loss within the SN of patients with mitochondrial disorders. A, When expressed as a percentage neuron count at the same rostrocaudal level of SN from the serially sectioned control midbrain, some degree of cell loss was seen in all patients with mitochondrial disease. Three of five of the POLG/multiple deletion patients showed the most severe loss, whereas patients with KSS/single large-scale deletion and point mutations showed milder loss. For the group of controls used in this study, the mean cell count expressed as a percentage of the count at the same rostrocaudal level of the SN was 96 ± 31%. All cases fell around the control value of 100% as anticipated. B, Number of TH-positive neurons in a number of cases compared with a control mean (n = 3).
In a number of our patients (8/11, both m.3243A>G MELAS and m.8344A>G MERRF cases, both single deletion cases, POLG 4, POLG 5, and controls 2, 4, and 8), we performed TH staining and found that in all patients except POLG 5, between 80% and 100% of pigmented cells were TH positive. These data also confirm the high correlation between the two methods used for estimating cell loss within the SN. In POLG 5, the percentage of positive cells was only 60%, confirming the severe loss of dopaminergic cells in this case (Fig. 7B).
Extrapyramidal features in patients with mitochondrial disease
Data from this study show that cell loss does occur within the SN of some patients with mitochondrial disease, particularly those harboring POLG mutations. Observing extrapyramidal involvement in patients with complex neurological symptoms is difficult. POLG 3 had clear parkinsonian signs and the presence of α-synuclein-positive Lewy bodies (Betts-Henderson et al., 2009) and Parkinsonian symptoms are well documented in patients with POLG mutations (Luoma et al., 2004; Mancuso et al., 2004; Davidzon et al., 2006; Pagnamenta et al., 2006; Tzoulis et al., 2006; Hudson et al., 2007; Galassi et al., 2008; Invernizzi et al., 2008; Remes et al., 2008; Sato et al., 2011). A lack of obvious extrapyramidal features in the patients does not necessarily mean that they were not present or that the loss of neurons within the SN was not detrimental; it may be that these features were masked by other more prominent symptoms such as ataxia and encephalopathy.
Discussion
The primary objective of this study was to investigate how inherent mitochondrial defects affect mitochondrial function and SN neuronal survival in a group of patients with mutations known to cause cell loss and dysfunction in other brain regions and tissues. We have shown that the neurons of the SN are affected by mitochondrial dysfunction in patients with a variety of genetically determined primary mitochondrial diseases. The level of respiratory chain deficiency was marked in some patients, but severe neuron loss appeared to be more frequent in patients with mutations in POLG. This is reflected in the clinical observations that Parkinsonism is a feature repeatedly reported in patients with POLG (Luoma et al., 2004; Mancuso et al., 2004; Davidzon et al., 2006; Pagnamenta et al., 2006; Tzoulis et al., 2006; Hudson et al., 2007; Galassi et al., 2008; Invernizzi et al., 2008; Remes et al., 2008; Betts-Henderson et al., 2009; Sato et al., 2011). Deficiency of complex I occurs in many patients, but is most severe in those patients harboring mtDNA deletions. Changes in both the activity and level of complex IV proteins are less pronounced than for complex I, but, again, occur in many patients and are most severe in those with POLG mutations. Similar to other brain regions, complex I deficiency in the SN, while potentially causing cell dysfunction, does not immediately produce marked cell loss. Similar to the cerebellum, the consequences of complex IV deficiency seem to be much less well tolerated and there is likely to be a progression from complex I to complex IV deficiency; it is this more severe deficiency that has major consequences for disease (Lax et al., 2012a).
We believe our findings shed some further light on the pathogenesis of Parkinson's disease and other synucleinopathies; for example, how the mitochondrial defect and α-synuclein aggregation might interact with each other. We only saw α-synuclein accumulation in two patients, both with POLG mutations, and we did not detect any α-synuclein pathology in the other cases despite marked respiratory chain deficiency in some cases. Therefore, although both mitochondrial defects and α-synuclein are linked to the pathogenesis of PD/DLB, the mitochondrial defect alone is not responsible for the accumulation of α-synuclein. This is entirely compatible with our previous observations in patients with PD/DLB in which the mitochondrial defects were seen in neurons without α-synuclein pathology (Reeve et al., 2012).
The observation that mitochondrial defects are likely to play a role in PD is built upon strong genetic, toxin, and animal model studies. It is also quite striking how some patients with POLG mutations develop clear extrapyramidal features and associated loss of SN neurons, yet such features are not prominent in many other patients with mitochondrial disease. In addition, as seen even in this relatively small cohort of patients, SN involvement was not a universal feature in all patients with POLG mutations. Indeed, one of our patients who had both POLG mutations and fairly extensive α-synuclein pathology had little neuron loss in the SN, confirming the variation seen in mitochondrial disease.
Do SN neurons exposed to mitochondrial dysfunction from early life adapt to survive?
Our data suggest that there may be differences in the severity of SN changes seen in mitochondrial patients depending on whether their mitochondrial defect develops with advancing age (in the case of POLG/multiple deletion patients) or if it is present from early development (single large-scale mtDNA deletion and point mutation patients). Cell loss and moderate levels of deficiency in complex I and complex IV seem to be associated with the age-related accumulation of a defect, whereas very high mutation levels, mitochondrial deficiencies, and relatively mild cell loss are associated with both the single large-scale mtDNA deletion patients and those patients with mtDNA point mutations. In the latter group of patients, the defect had been present since birth, which raises the intriguing hypothesis that SN neurons, which are subjected to mitochondrial dysfunction from an early stage, could have an ability to adapt to mitochondrial dysfunction to survive and maintain function. Those neurons in which a defect develops later in life are less able to adapt and therefore are more susceptible to the dysfunction and might be lost.
Among the possibilities to explain this phenomenon is the possibility of an early switch to glycolysis to maintain cellular function. Studies with trans-mitochondrial cybrids have suggest that high levels of mitochondrial dysfunction can cause the cells to reverse ATP synthase to maintain both mitochondrial membrane potential and ATP generation (Abramov et al., 2010) or can switch to glycolysis (Pallotti et al., 2004). A shift to glycolysis and increases in Krebs cycle flux have also been reported in Drosophila in response to mitochondrial dysfunction caused by various mutations (Celotto et al., 2011), whereas changes in protein expression within metabolic pathways have also been shown to occur in PD (Mandel et al., 2005; Zhang et al., 2005; Elstner et al., 2011). These studies show a decrease in oxidative phosphorylation genes, tricarboxylic acid cycle, and glycolytic genes; however, Elstner et al. (2011) showed that the expression of most genes is stable with aging and that decreases occur specifically in PD. Therefore, in patients with inherited pathogenic mtDNA mutations that occur in early development, a switch to a different energy generation could occur, allowing the developing SN neurons to survive despite harboring mitochondrial dysfunction, whereas with aging and in patients with acquired defects, this change does not occur.
Another possibility is a switch in the pacemaker channels over time. The subtle and intriguing balance between calcium handling and mitochondrial function has been studied in depth by Surmeier et al. (Chan et al., 2007; Surmeier, 2007; Surmeier et al., 2011). SN neurons contain an almost unique calcium channel (CaV 1.3 L type) that modulates the pacemaking activity of these neurons (Chan et al., 2009). Under experimental conditions, blocking these calcium channels caused SN neurons to revert to a juvenile form of channel that maintains this pacemaking activity through the movement of sodium ions (Chan et al., 2007). This switch to the juvenile channels also protects the neurons against oxidative stress and rotenone. It is possible that SN neurons that carry mitochondrial dysfunction from early life maintain their juvenile channels and their pacemaking activity through sodium rather than calcium. This would protect them against oxidative dysfunction within the SN, preventing neuron loss. This possibility remains to be investigated.
Conclusions
Mitochondrial dysfunction is common and varied within the SN of patients with mitochondrial disorders. The accumulation of mutations over time may be more detrimental for neuronal survival than the presence of mitochondrial dysfunction throughout life. These findings suggest intriguing possibilities that might unlock new therapeutic avenues to protect cells against mitochondrial dysfunction within this important brain region.
Footnotes
This work was supported by the Newcastle University Centre for Brain Ageing and Vitality (supported by the Biotechnology and Biological Sciences Research Council, Engineering and Physical Sciences Research Council, Economic and Social Research Council and Medical Research Council Grant #G0700718), The Wellcome Trust Centre for Mitochondrial Research (Grant #G906919), and the National Institute for Health Research Newcastle Biomedical Research Centre in Ageing and Chronic Diseases (award to the Newcastle upon Tyne Hospitals National Health Service Foundation Trust). Tissue for this study was provided by the Newcastle Brain Tissue Resource, which is funded by the Medical Research Council (Grant #G0400074), and the Alzheimer's Society and Alzheimer's Research Trust as part of the Brains for Dementia Research Project.
The authors declare no competing financial interests.
References
- Abou-Sleiman PM, Muqit MM, Wood NW. Expanding insights of mitochondrial dysfunction in Parkinson's disease. Nat Rev Neurosci. 2006;7:207–219. doi: 10.1038/nrn1868. [DOI] [PubMed] [Google Scholar]
- Abramov AY, Smulders-Srinivasan TK, Kirby DM, Acin-Perez R, Enriquez JA, Lightowlers RN, Duchen MR, Turnbull DM. Mechanism of neurodegeneration of neurons with mitochondrial DNA mutations. Brain. 2010;133:797–807. doi: 10.1093/brain/awq015. [DOI] [PMC free article] [PubMed] [Google Scholar]
- Bender A, Krishnan KJ, Morris CM, Taylor GA, Reeve AK, Perry RH, Jaros E, Hersheson JS, Betts J, Klopstock T, Taylor RW, Turnbull DM. High levels of mitochondrial DNA deletions in substantia nigra neurons in aging and Parkinson disease. Nat Genet. 2006;38:515–517. doi: 10.1038/ng1769. [DOI] [PubMed] [Google Scholar]
- Betarbet R, Sherer TB, MacKenzie G, Garcia-Osuna M, Panov AV, Greenamyre JT. Chronic systemic pesticide exposure reproduces features of Parkinson's disease. Nat Neurosci. 2000;3:1301–1306. doi: 10.1038/81834. [DOI] [PubMed] [Google Scholar]
- Betts J, Jaros E, Perry RH, Schaefer AM, Taylor RW, Abdel-All Z, Lightowlers RN, Turnbull DM. Molecular neuropathology of MELAS: level of heteroplasmy in individual neurones and evidence of extensive vascular involvement. Neuropathol Appl Neurobiol. 2006;32:359–373. doi: 10.1111/j.1365-2990.2006.00731.x. [DOI] [PubMed] [Google Scholar]
- Betts-Henderson J, Jaros E, Krishnan KJ, Perry RH, Reeve AK, Schaefer AM, Taylor RW, Turnbull DM. Alpha-synuclein pathology and Parkinsonism associated with POLG1 mutations and multiple mitochondrial DNA deletions. Neuropathol Appl Neurobiol. 2009;35:120–124. doi: 10.1111/j.1365-2990.2008.00981.x. [DOI] [PubMed] [Google Scholar]
- Burns RS, Chiueh CC, Markey SP, Ebert MH, Jacobowitz DM, Kopin IJ. A primate model of parkinsonism: selective destruction of dopaminergic neurons in the pars compacta of the substantia nigra by N-methyl-4-phenyl-1,2,3,6-tetrahydropyridine. Proc Natl Acad Sci U S A. 1983;80:4546–4550. doi: 10.1073/pnas.80.14.4546. [DOI] [PMC free article] [PubMed] [Google Scholar]
- Celotto AM, Chiu WK, Van Voorhies W, Palladino MJ. Modes of metabolic compensation during mitochondrial disease using the Drosophila model of ATP6 dysfunction. PLoS One. 2011;6:e25823. doi: 10.1371/journal.pone.0025823. [DOI] [PMC free article] [PubMed] [Google Scholar]
- Chan CS, Guzman JN, Ilijic E, Mercer JN, Rick C, Tkatch T, Meredith GE, Surmeier DJ. ‘Rejuvenation’ protects neurons in mouse models of Parkinson's disease. Nature. 2007;447:1081–1086. doi: 10.1038/nature05865. [DOI] [PubMed] [Google Scholar]
- Chan CS, Gertler TS, Surmeier DJ. Calcium homeostasis, selective vulnerability and Parkinson's disease. Trends Neurosci. 2009;32:249–256. doi: 10.1016/j.tins.2009.01.006. [DOI] [PMC free article] [PubMed] [Google Scholar]
- Davidzon G, Greene P, Mancuso M, Klos KJ, Ahlskog JE, Hirano M, DiMauro S. Early-onset familial parkinsonism due to POLG mutations. Ann Neurol. 2006;59:859–862. doi: 10.1002/ana.20831. [DOI] [PubMed] [Google Scholar]
- Devi L, Raghavendran V, Prabhu BM, Avadhani NG, Anandatheerthavarada HK. Mitochondrial import and accumulation of alpha-synuclein impair complex I in human dopaminergic neuronal cultures and Parkinson disease brain. J Biol Chem. 2008;283:9089–9100. doi: 10.1074/jbc.M710012200. [DOI] [PMC free article] [PubMed] [Google Scholar]
- Distelmaier F, Koopman WJ, van den Heuvel LP, Rodenburg RJ, Mayatepek E, Willems PH, Smeitink JA. Mitochondrial complex I deficiency: from organelle dysfunction to clinical disease. Brain. 2009;132:833–842. doi: 10.1093/brain/awp058. [DOI] [PubMed] [Google Scholar]
- Elstner M, Morris CM, Heim K, Bender A, Mehta D, Jaros E, Klopstock T, Meitinger T, Turnbull DM, Prokisch H. Expression analysis of dopaminergic neurons in Parkinson's disease and aging links transcriptional dysregulation of energy metabolism to cell death. Acta Neuropathol. 2011;122:75–86. doi: 10.1007/s00401-011-0828-9. [DOI] [PubMed] [Google Scholar]
- Fearnley JM, Lees AJ. Ageing and Parkinson's disease: substantia nigra regional selectivity. Brain. 1991;114:2283–2301. doi: 10.1093/brain/114.5.2283. [DOI] [PubMed] [Google Scholar]
- Galassi G, Lamantea E, Invernizzi F, Tavani F, Pisano I, Ferrero I, Palmieri L, Zeviani M. Additive effects of POLG1 and ANT1 mutations in a complex encephalomyopathy. Neuromuscul Disord. 2008;18:465–470. doi: 10.1016/j.nmd.2008.03.013. [DOI] [PubMed] [Google Scholar]
- Gu M, Cooper JM, Taanman JW, Schapira AH. Mitochondrial DNA transmission of the mitochondrial defect in Parkinson's disease. Ann Neurol. 1998;44:177–186. doi: 10.1002/ana.410440207. [DOI] [PubMed] [Google Scholar]
- Hudson G, Chinnery PF. Mitochondrial DNA polymerase-gamma and human disease. Hum Mol Genet. 2006;15:R244–R252. doi: 10.1093/hmg/ddl233. [DOI] [PubMed] [Google Scholar]
- Hudson G, Schaefer AM, Taylor RW, Tiangyou W, Gibson A, Venables G, Griffiths P, Burn DJ, Turnbull DM, Chinnery PF. Mutation of the linker region of the polymerase gamma-1 (POLG1) gene associated with progressive external ophthalmoplegia and Parkinsonism. Arch Neurol. 2007;64:553–557. doi: 10.1001/archneur.64.4.553. [DOI] [PubMed] [Google Scholar]
- Invernizzi F, Varanese S, Thomas A, Carrara F, Onofrj M, Zeviani M. Two novel POLG1 mutations in a patient with progressive external ophthalmoplegia, levodopa-responsive pseudo-orthostatic tremor and parkinsonism. Neuromuscul Disord. 2008;18:460–464. doi: 10.1016/j.nmd.2008.04.005. [DOI] [PubMed] [Google Scholar]
- Kraytsberg Y, Kudryavtseva E, McKee AC, Geula C, Kowall NW, Khrapko K. Mitochondrial DNA deletions are abundant and cause functional impairment in aged human substantia nigra neurons. Nat Genet. 2006;38:518–520. doi: 10.1038/ng1778. [DOI] [PubMed] [Google Scholar]
- Krishnan KJ, Bender A, Taylor RW, Turnbull DM. A multiplex real-time PCR method to detect and quantify mitochondrial DNA deletions in individual cells. Anal Biochem. 2007;370:127–129. doi: 10.1016/j.ab.2007.06.024. [DOI] [PubMed] [Google Scholar]
- Langston JW, Ballard P, Tetrud JW, Irwin I. Chronic Parkinsonism in humans due to a product of meperidine-analog synthesis. Science. 1983;219:979–980. doi: 10.1126/science.6823561. [DOI] [PubMed] [Google Scholar]
- Lax NZ, Hepplewhite PD, Reeve AK, Nesbitt V, McFarland R, Jaros E, Taylor RW, Turnbull DM. Cerebellar ataxia in patients with mitochondrial DNA disease: a molecular clinicopathological study. J Neuropathol Exp Neurol. 2012a;71:148–161. doi: 10.1097/NEN.0b013e318244477d. [DOI] [PMC free article] [PubMed] [Google Scholar]
- Lax NZ, Whittaker RG, Hepplewhite PD, Reeve AK, Blakely EL, Jaros E, Ince PG, Taylor RW, Fawcett PR, Turnbull DM. Sensory neuronopathy in patients harbouring recessive polymerase gamma mutations. Brain. 2012b;135:62–71. doi: 10.1093/brain/awr326. [DOI] [PMC free article] [PubMed] [Google Scholar]
- Livnat-Levanon N, Glickman MH. Ubiquitin-proteasome system and mitochondria - reciprocity. Biochim Biophys Acta. 2011;1809:80–87. doi: 10.1016/j.bbagrm.2010.07.005. [DOI] [PubMed] [Google Scholar]
- Luoma P, Melberg A, Rinne JO, Kaukonen JA, Nupponen NN, Chalmers RM, Oldfors A, Rautakorpi I, Peltonen L, Majamaa K, Somer H, Suomalainen A. Parkinsonism, premature menopause, and mitochondrial DNA polymerase gamma mutations: clinical and molecular genetic study. Lancet. 2004;364:875–882. doi: 10.1016/S0140-6736(04)16983-3. [DOI] [PubMed] [Google Scholar]
- Ma SY, Collan Y, Röyttä M, Rinne JO, Rinne UK. Cell counts in the substantia nigra: a comparison of single section counts and disector counts in patients with Parkinson's disease and in controls. Neuropathol Appl Neurobiol. 1995a;21:10–17. doi: 10.1111/j.1365-2990.1995.tb01023.x. [DOI] [PubMed] [Google Scholar]
- Ma SY, Röyttä M, Rinne JO, Collan Y, Rinne UK. Single section and disector counts in evaluating neuronal loss from the substantia nigra in patients with Parkinson's disease. Neuropathol Appl Neurobiol. 1995b;21:341–343. doi: 10.1111/j.1365-2990.1995.tb01068.x. [DOI] [PubMed] [Google Scholar]
- Mahad DJ, Ziabreva I, Campbell G, Laulund F, Murphy JL, Reeve AK, Greaves L, Smith KJ, Turnbull DM. Detection of cytochrome c oxidase activity and mitochondrial proteins in single cells. J Neurosci Methods. 2009;184:310–319. doi: 10.1016/j.jneumeth.2009.08.020. [DOI] [PubMed] [Google Scholar]
- Mancuso M, Filosto M, Oh SJ, DiMauro S. A novel polymerase gamma mutation in a family with ophthalmoplegia, neuropathy, and Parkinsonism. Arch Neurol. 2004;61:1777–1779. doi: 10.1001/archneur.61.11.1777. [DOI] [PubMed] [Google Scholar]
- Mandel S, Grunblatt E, Riederer P, Amariglio N, Jacob-Hirsch J, Rechavi G, Youdim MB. Gene expression profiling of sporadic Parkinson's disease substantia nigra pars compacta reveals impairment of ubiquitin-proteasome subunits, SKP1A, aldehyde dehydrogenase, and chaperone HSC-70. Ann N Y Acad Sci. 2005;1053:356–375. doi: 10.1196/annals.1344.031. [DOI] [PubMed] [Google Scholar]
- Mitsumoto A, Nakagawa Y. DJ-1 is an indicator for endogenous reactive oxygen species elicited by endotoxin. Free Radic Res. 2001;35:885–893. doi: 10.1080/10715760100301381. [DOI] [PubMed] [Google Scholar]
- Narendra D, Tanaka A, Suen DF, Youle RJ. Parkin is recruited selectively to impaired mitochondria and promotes their autophagy. J Cell Biol. 2008;183:795–803. doi: 10.1083/jcb.200809125. [DOI] [PMC free article] [PubMed] [Google Scholar]
- Narendra DP, Jin SM, Tanaka A, Suen DF, Gautier CA, Shen J, Cookson MR, Youle RJ. PINK1 is selectively stabilized on impaired mitochondria to activate Parkin. PLoS Biol. 2010;8:e1000298. doi: 10.1371/journal.pbio.1000298. [DOI] [PMC free article] [PubMed] [Google Scholar]
- Pagnamenta AT, Taanman JW, Wilson CJ, Anderson NE, Marotta R, Duncan AJ, Bitner-Glindzicz M, Taylor RW, Laskowski A, Thorburn DR, Rahman S. Dominant inheritance of premature ovarian failure associated with mutant mitochondrial DNA polymerase gamma. Hum Reprod. 2006;21:2467–2473. doi: 10.1093/humrep/del076. [DOI] [PubMed] [Google Scholar]
- Pallotti F, Baracca A, Hernandez-Rosa E, Walker WF, Solaini G, Lenaz G, Melzi D'Eril GV, Dimauro S, Schon EA, Davidson MM. Biochemical analysis of respiratory function in cybrid cell lines harbouring mitochondrial DNA mutations. Biochem J. 2004;384:287–293. doi: 10.1042/BJ20040561. [DOI] [PMC free article] [PubMed] [Google Scholar]
- Parihar MS, Parihar A, Fujita M, Hashimoto M, Ghafourifar P. Mitochondrial association of alpha-synuclein causes oxidative stress. Cell Mol Life Sci. 2008;65:1272–1284. doi: 10.1007/s00018-008-7589-1. [DOI] [PMC free article] [PubMed] [Google Scholar]
- Reeve AK, Park TK, Jaros E, Campbell GR, Lax NZ, Hepplewhite PD, Krishnan KJ, Elson JL, Morris CM, McKeith IG, Turnbull DM. Relationship between mitochondria and alpha-synuclein: a study of single substantia nigra neurons. Arch Neurol. 2012;69:385–393. doi: 10.1001/archneurol.2011.2675. [DOI] [PubMed] [Google Scholar]
- Remes AM, Hinttala R, Kärppä M, Soini H, Takalo R, Uusimaa J, Majamaa K. Parkinsonism associated with the homozygous W748S mutation in the POLG1 gene. Parkinsonism Relat Disord. 2008;14:652–654. doi: 10.1016/j.parkreldis.2008.01.009. [DOI] [PubMed] [Google Scholar]
- Samuels DC, Schon EA, Chinnery PF. Two direct repeats cause most human mtDNA deletions. Trends Genet. 2004;20:393–398. doi: 10.1016/j.tig.2004.07.003. [DOI] [PubMed] [Google Scholar]
- Sato K, Yabe I, Yaguchi H, Nakano F, Kunieda Y, Saitoh S, Sasaki H. Genetic analysis of two Japanese families with progressive external ophthalmoplegia and parkinsonism. J Neurol. 2011;258:1327–1332. doi: 10.1007/s00415-011-5936-x. [DOI] [PubMed] [Google Scholar]
- Schaefer AM, McFarland R, Blakely EL, He L, Whittaker RG, Taylor RW, Chinnery PF, Turnbull DM. Prevalence of mitochondrial DNA disease in adults. Ann Neurol. 2008;63:35–39. doi: 10.1002/ana.21217. [DOI] [PubMed] [Google Scholar]
- Schapira AH. Mitochondrial dysfunction in Parkinson's disease. Cell Death Differ. 2007;14:1261–1266. doi: 10.1038/sj.cdd.4402160. [DOI] [PubMed] [Google Scholar]
- Schapira AH, Cooper JM, Dexter D, Jenner P, Clark JB, Marsden CD. Mitochondrial complex I deficiency in Parkinson's disease. Lancet. 1989;1:1269. doi: 10.1016/s0140-6736(89)92366-0. [DOI] [PubMed] [Google Scholar]
- Shanske S, Moraes CT, Lombes A, Miranda AF, Bonilla E, Lewis P, Whelan MA, Ellsworth CA, DiMauro S. Widespread tissue distribution of mitochondrial DNA deletions in Kearns-Sayre syndrome. Neurology. 1990;40:24–28. doi: 10.1212/WNL.40.1.24. [DOI] [PubMed] [Google Scholar]
- Surmeier DJ. Calcium, ageing, and neuronal vulnerability in Parkinson's disease. Lancet Neurol. 2007;6:933–938. doi: 10.1016/S1474-4422(07)70246-6. [DOI] [PubMed] [Google Scholar]
- Surmeier DJ, Guzman JN, Sanchez-Padilla J, Schumacker PT. The role of calcium and mitochondrial oxidant stress in the loss of substantia nigra pars compacta dopaminergic neurons in Parkinson's disease. Neuroscience. 2011;198:221–231. doi: 10.1016/j.neuroscience.2011.08.045. [DOI] [PMC free article] [PubMed] [Google Scholar]
- Swerdlow RH, Parks JK, Miller SW, Tuttle JB, Trimmer PA, Sheehan JP, Bennett JP, Jr, Davis RE, Parker WD., Jr Origin and functional consequences of the complex I defect in Parkinson's disease. Ann Neurol. 1996;40:663–671. doi: 10.1002/ana.410400417. [DOI] [PubMed] [Google Scholar]
- Tanji K, DiMauro S, Bonilla E. Disconnection of cerebellar Purkinje cells in Kearns-Sayre syndrome. J Neurol Sci. 1999a;166:64–70. doi: 10.1016/S0022-510X(99)00114-8. [DOI] [PubMed] [Google Scholar]
- Tanji K, Vu TH, Schon EA, DiMauro S, Bonilla E. Kearns-Sayre syndrome: unusual pattern of expression of subunits of the respiratory chain in the cerebellar system. Ann Neurol. 1999b;45:377–383. doi: 10.1002/1531-8249(199903)45:3<377::AID-ANA14>3.0.CO;2-M. [DOI] [PubMed] [Google Scholar]
- Taylor RW, Turnbull DM. Mitochondrial DNA mutations in human disease. Nat Rev Genet. 2005;6:389–402. doi: 10.1038/nrg1606. [DOI] [PMC free article] [PubMed] [Google Scholar]
- Tzoulis C, Engelsen BA, Telstad W, Aasly J, Zeviani M, Winterthun S, Ferrari G, Aarseth JH, Bindoff LA. The spectrum of clinical disease caused by the A467T and W748S POLG mutations: a study of 26 cases. Brain. 2006;129:1685–1692. doi: 10.1093/brain/awl097. [DOI] [PubMed] [Google Scholar]
- Vives-Bauza C, Przedborski S. Mitophagy: the latest problem for Parkinson's disease. Trends Mol Med. 2011;17:158–165. doi: 10.1016/j.molmed.2010.11.002. [DOI] [PubMed] [Google Scholar]
- White HE, Durston VJ, Seller A, Fratter C, Harvey JF, Cross NC. Accurate detection and quantitation of heteroplasmic mitochondrial point mutations by pyrosequencing. Genet Test. 2005;9:190–199. doi: 10.1089/gte.2005.9.190. [DOI] [PubMed] [Google Scholar]
- Zhang Y, James M, Middleton FA, Davis RL. Transcriptional analysis of multiple brain regions in Parkinson's disease supports the involvement of specific protein processing, energy metabolism, and signaling pathways, and suggests novel disease mechanisms. Am J Med Genet B Neuropsychiatr Genet. 2005;137B:5–16. doi: 10.1002/ajmg.b.30195. [DOI] [PubMed] [Google Scholar]