

Abstract
The defensive peripersonal space represents a “safety margin” advantageous for survival. Its spatial extension and the possible relationship with personality traits have never been investigated. Here, in a population of 15 healthy human participants, we show that the defensive peripersonal space has a sharp boundary, located between 20 and 40 cm from the face, and that within such space there is a thin, “highest-risk area” closest to the face (i.e., an “ultra-near” defensive space). Single-subject analysis revealed clear interindividual differences in the extension of such peripersonal space. These differences are positively related to individual variability in trait anxiety. These findings point to the potential for measuring a range of defensive behaviors in relation to individual levels of anxiety. Such measures will allow developing procedures to test risk assessment abilities, particularly in professions that require reacting quickly to aversive stimuli near the body, such as firemen, policemen, and military officers. This may also lead to possible interventions to improve their performance under pressure.
Introduction
The defensive peripersonal space (DPPS) is a vital “safety margin” surrounding the body (Cooke and Graziano, 2003; Graziano and Cooke, 2006). The DPPS has been recently identified in humans by recording the enhancement of the blink reflex elicited by hand stimulation (hand-blink reflex [HBR]) when the hand is located close to the face (Sambo et al., 2012a, b). The DPPS has a crucial role for survival: whenever a salient and potentially dangerous stimulus approaches or enters it, the individual engages in more efficient actions aimed at self-protection (Cooke and Graziano, 2003).
Such defensive actions are modulated by the magnitude of the perceived danger that the stimulus represents. This magnitude is crucially determined not only by the nature of the stimulus, but also by the distance between the stimulus and the body. Thus, stimuli closer to the body are perceived as more threatening and result in enhanced defensive responses (Cooke and Graziano, 2003; Combe and Fujii, 2011). Furthermore, the magnitude of perceived threat is also determined by anxiety and fear. Anxious and fearful individuals may misrepresent the spatial location of the threatening stimulus, judging it closer to the body than it actually is (McNaughton and Corr, 2004; Clerkin et al., 2009). Thus, they may display enhanced defensive behaviors compared with normal individuals when the threatening stimulus is located at the same distance from the body.
We have suggested that the perceived threat of electrical stimuli is increased when the hand is near the face, thus resulting in a larger HBR (Sambo et al., 2012a, b). Indeed, in this condition, the electrical stimulation of the hand may be perceived as a sensory event potentially dangerous for the eye and thus may trigger an increased defensive response. Accordingly, higher-level cortical areas involved in representing the peripersonal space (Fogassi et al., 1996; Macaluso and Maravita, 2010; Legrain, 2011) and in detecting potentially dangerous stimuli near the body (Cooke and Graziano, 2003; Lloyd et al., 2006) preset the brainstem circuits mediating the HBR to respond more vigorously when the hand is inside the peripersonal space of the face (Sambo et al., 2012b). Importantly, because in our previous studies (Sambo et al., 2012a, b) the electrical stimuli were delivered with the hand placed in only two positions (one near and one far from the face), we could not establish whether the DPPS has clear boundaries and, if so, their spatial location.
Here we addressed three main questions by recording the HBR elicited by the stimulation of the hand placed at four different distances from the face. First, we tested whether the HBR increase by hand–face proximity is gradual or abrupt. This information allows defining whether the DPPS has sharp boundaries. Second, we measured the DPPS extension and tested their interindividual differences. Third, we tested whether possible individual variability in the size of the DPPS relates to differences in personality traits (trait anxiety and claustrophobic fear).
Materials and Methods
Participants.
Fifteen healthy volunteers (seven women), 20–37 years of age (mean ± SD, 27.4 ± 5.7 years), participated in this experiment. They were identified as “responders” (i.e., participants showing a reproducible HBR) from a pool of 25 volunteers that were initially screened for the presence of the HBR (Sambo et al., 2012b). Thus, the percentage of HBR responders was 60%, which is slightly larger than previous reports (42.8% in Miwa et al., 1998; and 27.3% in Alvarez-Blanco et al., 2009). All participants were right-handed. Participants gave written informed consent before taking part in the study. The study was approved by the local ethics committee.
Stimulation and recording.
Electrical stimuli were delivered to the median nerve at the wrist using a surface bipolar electrode attached on the participants' wrist with a velcro strap. As the stimulator provided constant current pulses, the trial-to-trial variability of the intensity of stimulation was negligible. The stimulus intensity was adjusted in each participant to elicit a clear HBR in three consecutive trials (mean, 42.3 mA; ranging between 13 and 53 times the individual perceptive threshold, mean 28) (Sambo et al., 2012b). None of the participants reported painful sensations elicited by the stimulation, even at high stimulus intensities. The stimulus duration was 200 μs, and the interval between successive stimuli was ∼30 s.
EMG activity was recorded from the orbicularis oculi muscle bilaterally, using pairs of surface electrodes with the active electrode over the mid lower eyelid and the reference electrode a few centimeters laterally to the outer canthus. Signals were amplified and digitized at a sampling rate of 8192 Hz (ISA 1004, Micromed), and stored for off-line analysis.
Procedures.
We recorded HBR responses while the participants' stimulated hand was placed at four distances from their eyes (“ultra-far,” 60 cm; “far,” 40 cm; “near,” 20 cm; “ultra-near,” 4 cm).
Participants were sitting on a comfortable armchair with a table placed in front of them. In the “ultra-far” position, participants kept their forearm on the table, at ∼120 degrees in respect to the arm; in the “ultra-near” position (4 cm), participants were sitting with their arm resting on the table, the forearm at ∼75 degrees in respect to the arm, and the hand at a distance of ∼4 cm from the ipsilateral side of their face. The positions corresponding to the two intermediate distances (“far” and “near”) were determined for each participant and marked with adhesive tape on a wooden panel placed on the side of the participant. On each trial, the experimenter called the number corresponding to one of the four distances (1 for the “ultra-far,” 2 and 3 for the “far” and “near,” and 4 for the “ultra-near”), and participants had to place their arm in the corresponding position, as instructed before the start of the experiment. Even at the nearest distance, the fingers, the hand, the wrist, or any other part of the upper limb were never touching the participants' face or head. The hand not undergoing the postural manipulation was kept on the table throughout the duration of the experiment. Throughout each block, participants were instructed to keep their gaze on a small fixation cross (1.5 × 1.5 cm) placed at ∼30 cm from the eyes, and 45 degrees below eye level. The experimenter ensured that the participant kept their gaze on the fixation cross before delivering each stimulus. White noise was played throughout the experiment to mask any sound possibly arising from the stimulation procedure. Before the start of the experiment, the experimenter ensured that the participants could clearly hear the verbal instructions about where to place the hand.
The experiment consisted of two blocks. In each block, stimuli were delivered to either the right or the left wrist (i.e., the wrist of the arm undergoing the postural manipulation). The order of blocks was balanced across participants. In each block, 32 electrical stimuli were delivered: eight for each of the four hand–face distances. The data for the two blocks were pooled, resulting in a total of 16 stimuli per condition. The stimuli were delivered in pseudo-random order, with the constraint that no more than two consecutive stimuli were delivered for the same hand–face distance.
Self-report psychometric measures.
After the experiment, all participants completed two self-report questionnaires: the “trait” subscale of the State-Trait Anxiety Inventory (STAI; Spielberg et al., 1970) and the claustrophobia questionnaire (CLQ; Radomsky et al., 2001). The STAI-Trait is a 20-item questionnaire measuring trait anxiety in adults and comprises both items related to the presence of anxiety (e.g., “I worry too much over something that really does not matter”) and items related to the absence of anxiety (e.g., “I am a steady person”). Participants rated each item in terms of how often they feel as described, on a scale of 1–4, with 1 indicating “almost never” and 4 indicating “almost always” (items indicating absence of anxiety are reverse-scored). The CLQ is a 26-item questionnaire, including two subscales: suffocation (e.g., “Swimming while wearing a nose plug”) and restriction (e.g., “Handcuffed for 15 min”). Participants rated each item in terms of how anxious they would feel in that place or situation, on a scale of 0–4, with 0 indicating “not at all anxious” and 4 indicating “extremely anxious.”
Data analysis and statistics.
EMG signals were analyzed using Letswave (http://nocions.webnode.com/letswave/) (Mouraux and Iannetti, 2008), as described by Sambo et al. (2012b). EMG signals from each participant were high-pass filtered (55 Hz) and full-wave rectified. Data were averaged across ipsilateral and contralateral recording sides. HBR responses were averaged separately for the four positions (“ultra-far,” “far,” “near,” and “ultra-near”), resulting in four HBR average waveforms for each subject.
We performed three types of analysis, one for each of the three aims of the study.
(1) To investigate whether the increase of the HBR magnitude by hand–face proximity was gradual or abrupt (i.e., whether the DPPS has sharp boundaries), a one-way repeated-measures ANOVA was first performed on HBR magnitude, as measured by the area under the curve (AUC), using “hand position” (four levels, each corresponding to one of the four distances: “ultra-far,” “far,” “near,” and “ultra-near”) as experimental factor. Furthermore, to investigate the time course of the possible effect of “hand position,” we performed the same repeated-measures ANOVA but using each time point of the averaged HBR (as implemented in Letswave) (Mouraux and Iannetti, 2008). This point-by-point ANOVA yielded a waveform expressing the significance of the effect of “hand position” across time course of the HBR response. A consecutivity threshold of 10 ms was chosen to account for multiple comparisons, as in Sambo et al. (2012b). In both analyses, post hoc paired t tests were performed on the following comparisons: “ultra-far” versus “far,” “far” versus “near,” “near” versus “ultra-near,” and “ultra-far” versus “ultra-near” (Sambo et al., 2012a; b); the latter was performed to allow comparisons with our previous studies.
(2) To estimate the approximate size of the DPPS in individual participants, we performed contrast analysis (Rosenthal and Rosnow, 2009). We compared, in each participant, the contrast representing a linear increase of the HBR magnitude with hand–face proximity (−3, −1, 1, 3) with the contrasts representing abrupt increases between the “ultra-far” and “far” positions (−3, 1, 1, 1; corresponding to an “extra-large” peripersonal space), between the “far” and “near” positions (−1, −1, 1, 1; corresponding to a “large step” peripersonal space), and between the “near” and “ultra-near” positions (−1, −1, −1, 3; corresponding to a “small” peripersonal space). Furthermore, the analysis included a contrast representing an abrupt enhancement between the “far” and “near” positions with a linear increase of the HBR magnitude between the “far” and “ultra-near” positions (−1.5, −1.5, 0.5, 2.5; corresponding to a “large ramp” peripersonal space).
(3) To investigate whether individual differences in trait anxiety and claustrophobic fear predicted the size of peripersonal space, we used multiple least-squares regression, including scores on the STAI-Trait and CLQ as predictors of the HBR increase produced by hand–face proximity. Given that the HBR magnitude did not differ significantly between the “ultra-far” and “far” positions, the size of the peripersonal space was estimated, for each participant, by plotting the line representing the HBR percentage increases (expressed as z-scores) from the “far” to the “near” position and from the “near” to the “ultra-near” position. Thus, the slope of these lines represents an estimate of the DPPS size, and was used as dependent variable: positive slopes indicate small peripersonal spaces, and negative slopes indicate large peripersonal spaces. Moreover, for positive slopes the steeper the slope the smaller the peripersonal space, whereas for negative slopes the steeper the slope the larger the peripersonal space.
Results
Effects of “hand position” on HBR magnitude
To investigate the possible effect of “hand position” on the HBR, we performed a one-way, repeated-measures ANOVA on the HBR magnitude. There was a clear main effect of “hand position” (F(1,14) = 39.16, p < 0.0001; Fig. 1, top). To test whether the HBR magnitude increased with the hand–face proximity, we performed four paired t tests. The HBR magnitude did not differ significantly between the “ultra-far” and “far” positions (t(14) = −0.05, p = 0.96). In contrast, the HBR magnitude was significantly greater in the “near” compared with the “far” position (t(14) = −4.96, p < 0.0001) and in the in the “ultra-near” compared with the “near” position (t(14) = −5.77, p < 0.0001). Expectedly, the HBR magnitude was also significantly greater in the “ultra-near” compared with the “ultra-far” position (t(14) = −6.58, p < 0.0001). This finding indicates that the transition between the DPPS and far space is abrupt, with an increase of HBR magnitude when the stimulated hand moves from the “far” to the “near” position, and a further increase when this hand moves from the “near” to the “ultra-near” position.
Figure 1.
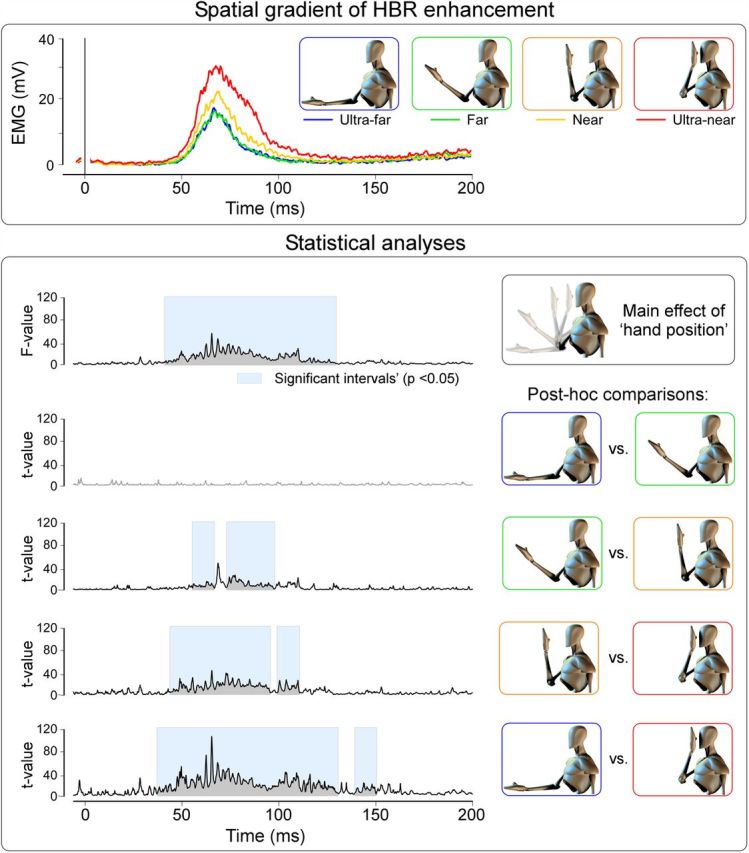
Measurement of the DPPS size. Top, Group-average HBR waveforms elicited while the hand was placed at four distances from the eye: “ultra-far,” 60 cm; “far,” 40 cm; “near,” 20 cm; “ultra-near,” 4 cm. Bottom, Point-by-point one-way ANOVA and post hoc comparisons exploring the effect of “hand position” at different distances. These results show that the DPPS has a sharp boundary, located between 20 and 40 cm from the face, and that within such space there is a thin, highest-risk area closest to the face (i.e., an “ultra-near” defensive space).
In addition, to investigate the possible effect of “hand position” on the HBR across time, we performed a one-way, repeated-measures ANOVA for each time point of the average HBR. The factor “hand position” was a significant source of variance within the 37–128 ms time window (p < 0.05; i.e., across the whole HBR response). To test the time course of the increase of the HBR magnitude with the hand–face proximity, we performed four paired t tests. The factor “hand position” was not a significant source of variance at any point of the HBR response when comparing the HBR elicited in the “ultra-far” and “far” positions (p > 0.05). In contrast, the factor “hand position” was a significant source of variance within the 55–65 ms and 73–97 ms time windows when comparing the HBR elicited in the “far” and “near” positions, and within the 48–95 ms and 99–110 ms time windows when comparing the HBR elicited in the “near” and “ultra-near” positions (Fig. 1, plots of F and t values). When comparing the HBR responses obtained in the “ultra-far” and “ultra-near” positions, the factor “hand position” was a significant source of variance within the 42–125 ms time window (Fig. 1).
Individual differences in the size of the DPPS
To estimate the approximate size of the DPPS in single subjects, we compared, in each participant, the contrast modeling a linear increase of the HBR magnitude with hand–face proximity with four contrasts representing abrupt increases. Table 1 shows, for each participant, the p value corresponding to the fit of each model. In 6 of 15 participants, the model representing abrupt increases between “near” and “ultra-near” positions (contrast −1, −1, −1, 3; corresponding to a “small” peripersonal space) provided the best fit compared with all other models (Fig. 2). In 8 of 15 participants, the model representing an abrupt increase between “far” and “near” positions with a linear increase of the HBR magnitude between the “far” and “ultra-near” positions (contrast −1.5, −1.5, 0.5, 2.5; corresponding to a “large ramp” peripersonal space) provided the best fit (Fig. 2). Finally, the model representing an abrupt increase between “far” and “near” positions without a further increase at the “ultra-near” position (contrast −1, −1, −1, 3; corresponding to a “large step” peripersonal space) provided the best fit in 1 of 15 participants (Fig. 2). Importantly, the model representing a linear increase of the HBR magnitude (contrast −3, −1, 1, 3; corresponding to a gradual transition between the far space and the peripersonal space) did not provide the best fit in any of the participants. These results, besides confirming that the DPPS has sharp boundaries (see section above), (1) show that the extension of such peripersonal space is variable across participants, and (2) define, in each participant, the location of the boundary of the DPPS.
Table 1.
| N | Linear | Small | Large ramp | Large step | Extra-large |
|---|---|---|---|---|---|
| 1 | 0.0855 | 0.0777 | 0.0077* | 0.1532 | 0.5388 |
| 2 | 0.1084 | 0.0256* | 0.0446 | 0.2594 | 0.5274 |
| 3 | 0.1222 | 0.0176* | 0.0596 | 0.2913 | 0.5342 |
| 4 | 0.1753 | 0.4825 | 0.1328 | 0.0101* | 0.5312 |
| 5 | 0.0591 | 0.1097 | 0.0009* | 0.1142 | 0.4837 |
| 6 | 0.1018 | 0.2374 | 0.0239* | 0.0417 | 0.5499 |
| 7 | 0.1321 | 0.0223* | 0.0458 | 0.2643 | 0.5862 |
| 8 | 0.0994 | 0.2012 | 0.0152* | 0.0587 | 0.5604 |
| 9 | 0.1347 | 0.1780 | 0.0221* | 0.0902 | 0.6384 |
| 10 | 0.0866 | 0.0407 | 0.0292* | 0.2209 | 0.5006 |
| 11 | 0.0810 | 0.0492 | 0.0217* | 0.2010 | 0.5005 |
| 12 | 0.1143 | 0.0492 | 0.0224* | 0.2022 | 0.5852 |
| 13 | 0.1370 | 0.0128* | 0.0655 | 0.3052 | 0.5611 |
| 14 | 0.1250 | 0.0212* | 0.0476 | 0.2682 | 0.5646 |
| 15 | 0.1229 | 0.0263* | 0.0990 | 0.3491 | 0.4607 |
aData are given as p values. In 8 of 15 participants, the model corresponding to a “Large ramp” DPPS provided the best fit compared with all other models. In 6 of 15 participants, the model corresponding to a “Small” DPPS provided the best fit. The model corresponding to a “Large step” DPPS provided the best fit in only one participant, and the model representing a gradual transition between DPPS and far space (“Linear”) did not provide the best fit in any of the participants.
*The lowest significant p value in each participant.
Figure 2.

Interindividual variability in DPPS size. Left, One model representing a linear increase of HBR magnitude with hand–face proximity (a) and four models representing different DPPS sizes (b–e). Models c and d both represent a large DPPS and differ only for the presence or absence of a further increase within the DPPS. Single-subject data were tested against each model. All but one subject best fitted either model b or model c. Right, Group-average HBR waveforms of the participants whose data best fitted model b (N = 6; top), model c (N = 8; middle), and model d (N = 1; bottom). None of the participants' data fitted model a. Insets, The HBR magnitude is expressed as the AUC (in arbitrary units).
Correlation between size of the DPPS and personality traits
Multiple least-squares regression was used to investigate whether measures of trait anxiety (STAI-Trait) and claustrophobic fear (CLQ) were significant predictors of the size of peripersonal space). Trait anxiety was a significant predictor of the DPPS size (F(2,12) = 4.95, p = 0.027, B = −0.63, t = −2.67, p = 0.020), with higher scores of trait anxiety corresponding to a larger peripersonal space. In contrast, claustrophobic fear was not a significant predictor of the size of the peripersonal space (F(2,12) = 4.95, p = 0.027, B = −0.093, t = −0.39, p = 0.70) (Fig. 3).
Figure 3.

Relationship between DPPS size and personality traits. The DPPS size (y-axis) was positively related with trait anxiety (x-axis) (p = 0.02; left). In contrast, there was no significant association between the DPPS size (y-axis) and claustrophobic fear (x-axis) (p = 0.7; right).
Discussion
In this study, we defined the extension of the DPPS surrounding the face, and we investigated the personality factors contributing to possible interindividual differences in its size. We obtained three main findings. First, at group level, the HBR magnitude is similar when the stimulated hand is in the “ultra-far” and in the “far” positions, but it is significantly increased in the “near” compared with the “far” position, and further increased in the “ultra-near” compared with the “near” position. This finding indicates that the DPPS of the face has a clear boundary that separates it from the far space, and that, within such peripersonal space, there is a thin, “highest-risk area” closest to the body (i.e., an “ultra-near” defensive space). Second, the extension of the DPPS shows clear interindividual differences. Third, such differences in the size of peripersonal space relate to individual variability in trait anxiety, but not claustrophobic fear.
The DPPS has sharp boundaries
We observed an abrupt rather than a gradual increase of the HBR magnitude with greater proximity of the hand to the face. More specifically, the HBR magnitude is unchanged when the participants' stimulated hand is placed at a distance of 60 cm from the face (“ultra-far”) compared with when this hand is placed at 40 cm (“far”). However, when the hand is placed at 20 cm from the face (“near”), the HBR magnitude is abruptly increased compared with the “far” distance. Moreover, the HBR magnitude is further increased when the participants' stimulated hand is placed at a distance of 4 cm from the face (“ultra-near”) compared with when this hand is placed at 20 cm (“near”). We previously proposed that the circuits mediating the HBR in response to the electrical stimulation of the median nerve at the wrist undergo tonic, top-down modulation from frontoparietal cortical areas involved in representing the peripersonal space (e.g., the premotor cortex and the ventral intraparietal area), thus becoming more responsive when the stimulated hand is placed within the DPPS of the face (Sambo et al., 2012a, b). However, because in these studies the stimulated hand was placed at only two distances from the face (i.e., 4 and 60 cm), we could not establish whether the peripersonal space has sharp boundaries, as well as the extension of such peripersonal space. The results from the present study indicate that the DPPS surrounding the face has a sharp boundary, which is located between 40 and 20 cm from the face. Furthermore, we observed that the circuits mediating the HBR undergo an even stronger modulation when the hand is placed at 4 cm from the face (i.e., in the “ultra-near” position). This latter finding makes functional sense as intense stimuli that are very near to the face are likely to be most dangerous and thus require more efficient protective responses. The neural mechanism underlying such effect is not known, but it could rely either (1) on a finer cortical representation of the “ultra-near” space, with a larger population of neurons in the frontoparietal network exerting a modulation when stimuli are presented in the “ultra-near” compared with the “near” space, or (2) on a stronger modulation exerted by the same neurons that are also activated by stimuli presented in the “near” space, or (3) on both mechanisms. Accordingly, invasive electrophysiological recordings in primates show that the ventral intraparietal area contains both neurons selectively responding to stimuli presented in “ultra-near” space (5 cm from the face) and neurons exhibiting a gradient in responsiveness (i.e., neurons becoming increasingly active when the stimulus is presented at nearer distances) (Colby et al., 1993). This evidence suggests that both neural mechanisms contribute to our observation.
The finding that the DPPS of the face has clear boundaries is in line with previous evidence suggesting that the peripersonal space surrounding the hand has sharp boundaries placed at ∼30 cm from the hand when measured using a rubber-hand-illusion task (Lloyd, 2007) and at ∼50 cm when assessed through a line bisection task (Berti et al., 2002), that is, within arm's reach. On the other hand, other studies observed a gradual rather than an abrupt transition between near and far space, again using a line bisection task (Longo and Lourenco, 2006, 2007). However, these studies investigated the extension of the peripersonal space related to multisensory integration and motor execution, and not to defense.
The size of the DPPS is variable across individuals
The second main finding of the present study is that the extension of the DPPS of the face is variable across participants. We defined, in each participant, the location of the boundary of such peripersonal space (Fig. 2). Sixty percent of the participants have a “large” DPPS (i.e., the magnitude of their HBR is identical in the “ultra-far” and “far” hand positions and is dramatically increased in the “near” position). All these participants, except one, show a further increase between the “near” and the “ultra-near” hand positions. Forty percent of the participants have a “small” DPPS (i.e., the magnitude of their HBR is particularly increased in the “ultra-near” compared with the “near” position). Importantly, the model representing a linear increase of the HBR magnitude did not constitute a good fit for any of the participants. This confirms, at single-subject level, the observation obtained at group level (i.e., that the transition between the DPPS and the far space is abrupt rather than gradual; Fig. 1).
Because the DPPS represents a “safety margin” with the purpose of protecting our body from potentially dangerous stimuli, this result suggests that individuals differ in what they consider to be the critical distance at which a threatening stimulus requires more efficient defensive responses. This is also supported by the evidence that the perceived proximity of threatening stimuli is increased when the magnitude of the danger is greater and that this effect is variable across individuals (McNaughton and Corr, 2004; Jackson, 2009; Vagnoni et al., 2012; Xiao and Van Bavel, 2012). For example, Vagnoni et al. (2012) observed that participants underestimate the perceived time to collision of pictures representing threatening stimuli (spiders and snakes) compared with nonthreatening stimuli (butterflies and rabbits), and showed that such effect was stronger in phobic participants.
Trait anxiety determines the size of the DPPS
Individual variability in the size of the DPPS of the face was systematically related to individual differences in trait anxiety. Individuals with higher scores on trait anxiety showed a larger peripersonal space than individual with lower trait anxiety scores. This result is in line with the evidence that the functioning of the human defensive systems relates to personality traits, most notably anxiety and fear (Perkins et al., 2010). More specifically, our result indicates that more anxious individuals display increased defensive responses when threatening stimuli are presented at the same distance from the body, compared with less anxious individuals. That is, in more anxious individuals, the “safety margin” is located at a further distance from the body than in less anxious individuals. This could be because these individuals perceive threatening stimuli as closer to their body than they actually are (McNaughton and Corr, 2004; Clerkin et al., 2009). This hypothesis is supported by the evidence in animal models that anxiolytic drugs increase the “defensive distance” (Blanchard et al., 1990; McNaughton and Corr, 2004) (i.e., the distance at which the animal responds to the threatening stimulus).
In contrast, individual variability in the size of the DPPS was not related to individual differences in claustrophobic fear. This finding might seem at odds with the observation that individuals with greater claustrophobic fear had a larger peripersonal space surrounding the hand (Lourenco et al., 2011). However, this study used a visual line bisection task to measure the extension of the multisensory peripersonal space, whereas we measured a defensive response (the HBR) related to threat perception and risk assessment (i.e., two processes related more to anxiety than to claustrophobic traits) (Blanchard et al., 2011).
These findings point to the potential for measuring a range of defensive behaviors in relation to individual levels of anxiety. The availability of such measures will allow developing procedures to test risk assessment abilities, particularly in professions that require reacting quickly to aversive stimuli near the body, such as firemen, policemen, and military officers. This may also lead to possible interventions to improve their performance under pressure.
Footnotes
The authors declare no competing financial interests.
References
- Alvarez-Blanco S, Leon L, Valls-Solé J. The startle reaction to somatosensory inputs: different response pattern to stimuli of upper and lower limbs. Exp Brain Res. 2009;195:285–292. doi: 10.1007/s00221-009-1784-7. [DOI] [PubMed] [Google Scholar]
- Berti A, Smania N, Rabuffetti M, Ferrarin M, Spinazzola L, D'Amico A, Ongaro E, Allport A. Coding of far and near space during walking in neglect patients. Neuropsychology. 2002;16:390–399. doi: 10.1037/0894-4105.16.3.390. [DOI] [PubMed] [Google Scholar]
- Blanchard DC, Blanchard RJ, Tom P, Rodgers RJ. Diazepam changes risk assessment in an anxiety/defense test battery. Psychopharmacology. 1990;101:511–518. doi: 10.1007/BF02244230. [DOI] [PubMed] [Google Scholar]
- Blanchard DC, Griebel G, Pobbe R, Blanchard RJ. Risk assessment as an evolved threat detection and analysis process. Neurosci Biobehav Rev. 2011;35:991–998. doi: 10.1016/j.neubiorev.2010.10.016. [DOI] [PubMed] [Google Scholar]
- Clerkin EM, Cody MW, Stefanucci JK, Proffitt DR, Teachman BA. Imagery and fear influence height perception. J Anxiety Disord. 2009;23:381–386. doi: 10.1016/j.janxdis.2008.12.002. [DOI] [PMC free article] [PubMed] [Google Scholar]
- Colby CL, Duhamel JR, Goldberg ME. Ventral intraparietal area of the macaque: anatomic location and visual response properties. J Neurophysiol. 1993;69:902–914. doi: 10.1152/jn.1993.69.3.902. [DOI] [PubMed] [Google Scholar]
- Combe E, Fujii N. Depth perception and defensive system activation in a 3-d environment. Front Psychol. 2011;2:205. doi: 10.3389/fpsyg.2011.00205. [DOI] [PMC free article] [PubMed] [Google Scholar]
- Cooke DF, Graziano MS. Defensive movements evoked by air puff in monkeys. J Neurophysiol. 2003;90:3317–3329. doi: 10.1152/jn.00513.2003. [DOI] [PubMed] [Google Scholar]
- Fogassi L, Gallese V, Fadiga L, Luppino G, Matelli M, Rizzolatti G. Coding of peripersonal space in inferior premotor cortex (area F4) J Neurophysiol. 1996;76:141–157. doi: 10.1152/jn.1996.76.1.141. [DOI] [PubMed] [Google Scholar]
- Graziano MS, Cooke DF. Parieto-frontal interactions, personal space, and defensive behavior. Neuropsychologia. 2006;44:845–859. doi: 10.1016/j.neuropsychologia.2005.09.009. [DOI] [PubMed] [Google Scholar]
- Jackson RE. Individual differences in distance perception. Proc Biol Sci. 2009;276:1665–1669. doi: 10.1098/rspb.2009.0004. [DOI] [PMC free article] [PubMed] [Google Scholar]
- Legrain V. Where is my pain? Pain. 2011;152:467–468. doi: 10.1016/j.pain.2010.11.011. [DOI] [PubMed] [Google Scholar]
- Lloyd DM. Spatial limits on referred touch to an alien limb may reflect boundaries of visuo-tactile peripersonal space surrounding the hand. Brain Cogn. 2007;64:104–109. doi: 10.1016/j.bandc.2006.09.013. [DOI] [PubMed] [Google Scholar]
- Lloyd D, Morrison I, Roberts N. Role for human posterior parietal cortex in visual processing of aversive objects in peripersonal space. J Neurophysiol. 2006;95:205–214. doi: 10.1152/jn.00614.2005. [DOI] [PubMed] [Google Scholar]
- Longo MR, Lourenco SF. On the nature of near space: effects of tool use and the transition to far space. Neuropsychologia. 2006;44:977–981. doi: 10.1016/j.neuropsychologia.2005.09.003. [DOI] [PubMed] [Google Scholar]
- Longo MR, Lourenco SF. Space perception and body morphology: extent of near space scales with arm length. Exp Brain Res. 2007;177:285–290. doi: 10.1007/s00221-007-0855-x. [DOI] [PubMed] [Google Scholar]
- Lourenco SF, Longo MR, Pathman T. Near space and its relation to claustrophobic fear. Cognition. 2011;119:448–453. doi: 10.1016/j.cognition.2011.02.009. [DOI] [PubMed] [Google Scholar]
- Macaluso E, Maravita A. The representation of space near the body through touch and vision. Neuropsychologia. 2010;48:782–795. doi: 10.1016/j.neuropsychologia.2009.10.010. [DOI] [PubMed] [Google Scholar]
- McNaughton N, Corr PJ. A two-dimensional neuropsychology of defense: fear/anxiety and defensive distance. Neurosci Biobehav Rev. 2004;28:285–305. doi: 10.1016/j.neubiorev.2004.03.005. [DOI] [PubMed] [Google Scholar]
- Miwa H, Nohara C, Hotta M, Shimo Y, Amemiya K. Somatosensory-evoked blink response: investigation of the physiological mechanisms. Brain. 1998;121:281–291. doi: 10.1093/brain/121.2.281. [DOI] [PubMed] [Google Scholar]
- Mouraux A, Iannetti GD. Across-trial averaging of event-related EEG responses and beyond. Magn Reson Imaging. 2008;26:1041–1054. doi: 10.1016/j.mri.2008.01.011. [DOI] [PubMed] [Google Scholar]
- Perkins AM, Cooper A, Abdelall M, Smillie LD, Corr PJ. Personality and defensive reactions: fear, trait anxiety, and threat magnification. J Pers. 2010;78:1071–1090. doi: 10.1111/j.1467-6494.2010.00643.x. [DOI] [PubMed] [Google Scholar]
- Radomsky AS, Rachman S, Thordarson DS, McIsaac HK, Teachman BA. The Claustrophobia Questionnaire. J Anxiety Disord. 2001;15:287–297. doi: 10.1016/S0887-6185(01)00064-0. [DOI] [PubMed] [Google Scholar]
- Rosenthal R, Rosnow RL. Contrast analysis: focused comparisons in the analysis of variance. Cambridge: Cambridge UP; 2009. [Google Scholar]
- Sambo CF, Forster B, Williams SC, Iannetti GD. To blink or not to blink: fine cognitive tuning of the defensive peripersonal space. J Neurosci. 2012a;32:12921–12927. doi: 10.1523/JNEUROSCI.0607-12.2012. [DOI] [PMC free article] [PubMed] [Google Scholar]
- Sambo CF, Liang M, Cruccu G, Iannetti GD. Defensive peripersonal space: the blink reflex evoked by hand stimulation is increased when the hand is near the face. J Neurophysiol. 2012b;107:880–889. doi: 10.1152/jn.00731.2011. [DOI] [PubMed] [Google Scholar]
- Spielberg CD, Gorsuch RL, Lushene RE. Manual for the state-trait anxiety inventory. Paolo Alto, CA: California Consulting Psychologists; 1970. [Google Scholar]
- Vagnoni E, Lourenco SF, Longo MR. Threat modulates perception of looming visual stimuli. Curr Biol. 2012;22:R826–R827. doi: 10.1016/j.cub.2012.07.053. [DOI] [PubMed] [Google Scholar]
- Xiao YJ, Van Bavel JJ. See your friends close and your enemies closer: social identity and identity threat shape the representation of physical distance. Pers Soc Psychol Bull. 2012;38:959–972. doi: 10.1177/0146167212442228. [DOI] [PubMed] [Google Scholar]