

Abstract
The neuronal glycine transporter GlyT2 plays a fundamental role in the glycinergic neurotransmission by recycling the neurotransmitter to the presynaptic terminal. GlyT2 is the main supplier of glycine for vesicle refilling, a process that is absolutely necessary to preserve quantal glycine content in synaptic vesicles. Alterations in GlyT2 activity modify glycinergic neurotransmission and may underlie several neuromuscular disorders, such as hyperekplexia, myoclonus, dystonia, and epilepsy. Indeed, mutations in the gene encoding GlyT2 are the main presynaptic cause of hyperekplexia in humans and produce congenital muscular dystonia type 2 (CMD2) in Belgian Blue cattle. GlyT2 function is strictly coupled to the sodium electrochemical gradient actively generated by the Na+/K+-ATPase (NKA). GlyT2 cotransports 3Na+/Cl−/glycine generating large rises of Na+ inside the presynaptic terminal that must be efficiently reduced by the NKA to preserve Na+ homeostasis. In this work, we have used high-throughput mass spectrometry to identify proteins interacting with GlyT2 in the CNS. NKA was detected as a putative candidate and through reciprocal coimmunoprecipitations and immunocytochemistry analyses the association between GlyT2 and NKA was confirmed. NKA mainly interacts with the raft-associated active pool of GlyT2, and low and high levels of the specific NKA ligand ouabain modulate the endocytosis and total expression of GlyT2 in neurons. The ouabain-mediated downregulation of GlyT2 also occurs in vivo in two different systems: zebrafish embryos and adult rats, indicating that this NKA-mediated regulatory mechanism is evolutionarily conserved and may play a relevant role in the physiological control of inhibitory glycinergic neurotransmission.
Introduction
Inhibitory glycinergic neurotransmission is terminated by specific glycine transporters GlyTs (GlyT1 and GlyT2), which actively reuptake glycine from the synaptic cleft. The neuronal transporter GlyT2 additionally recycles the neurotransmitter to the presynaptic terminal, a process that is absolutely necessary to preserve quantal glycine content inside synaptic vesicles (Gomeza et al., 2003b; Rousseau et al., 2008; Apostolides and Trussell, 2013). Gene deletion studies suggest that GlyT alterations may underlie several human disorders, such as hyperekplexia, myoclonus, pain, and epilepsy (Gomeza et al., 2003a, 2003b; Aragón and López-Corcuera, 2005). Indeed, mutations in the gene encoding GlyT2 are the second main cause of hyperekplexia in humans (Eulenburg et al., 2006; Rees et al., 2006; Carta et al., 2012; Gimenez et al., 2012) and produce congenital muscular dystonia type 2 (CMD2) in Belgian Blue cattle (Gill et al., 2012). Membrane protein trafficking plays a fundamental role in controlling neuronal activity, and it is a key regulatory mechanism for several neurotransmitter transporters by providing a rapid and transient way to modulate its activity (Blakely and Bauman, 2010). GlyT2 constitutively recycles between the cell surface and intracellular compartments, and modulation of GlyT2 trafficking is achieved by several factors in a regulated manner (Geerlings et al., 2001; Fornés et al., 2008; de Juan-Sanz et al., 2011, 2013). Glycine transporters are sodium-dependent proteins functionally coupled to the sodium electrochemical gradient, which is actively generated and maintained by Na+/K+-ATPase (NKA). GlyT2 cotransports 3Na+/Cl−/glycine (López-Corcuera et al., 1998; Roux and Supplisson, 2000), generating large rises in intracellular Na+ that must be efficiently reduced by the NKA to preserve ion homeostasis, which is absolutely necessary for synaptic transmission and neuronal excitability. Recent research has elucidated that NKA also functions as a receptor involved in many signaling events (recent reviews: Lingrel, 2010; Liu and Xie, 2010; Benarroch, 2011; Reinhard et al., 2013). Cardiotonic steroids (CTSs) are specific inhibitors of the NKA found in plants and vertebrates, and they are also produced endogenously in the human adrenal cortex and hypothalamus (Hamlyn et al., 1991; Tymiak et al., 1993; el-Masri et al., 2002). Low concentrations of ouabain and marinobufagenin can be detected in human blood similarly to endogenously produced hormones (Ludens et al., 1991; Bagrov et al., 2009), and the binding of these CTS to αNKA subunits triggers downstream signaling events leading to the modulation of different cellular processes.
Here we have identified NKA as a GlyT2-interacting protein in synaptosomes and primary neurons from rat brainstem and spinal cord. GlyT2-NKA interaction is compartmentalized in lipid rafts, where GlyT2 is optimally active (Núñez et al., 2008), suggesting that NKA might regulate the local presynaptic Na+ increases produced during glycine recapture by GlyT2. Inhibition of NKA activity by low concentrations of ouabain causes internalization of GlyT2, whereas high concentrations of ouabain elicited a drastic lysosomal degradation of the active lipid raft-associated transporter. Ouabain-mediated degradation of GlyT2 is also observed in zebrafish embryos and in adult rats, indicating the existence of an evolutionarily conserved NKA-mediated mechanism that regulates glycinergic neurotransmission by modulating GlyT2 expression in vivo.
Materials and Methods
Materials
Zebrafish embryos of either sex and male Wistar rats were bred under standard conditions at the Centro de Biología Molecular Severo Ochoa in accordance with the current guidelines for the use of animals in neuroscientific research. All animal procedures were approved by the institutional animal care and performed according to European Union guidelines (Council Directive, 2010/63/EU). Antibodies against GlyT2 were obtained in house (rabbit and rat) (Zafra et al., 1995; Núñez et al., 2009), whereas the other primary antibodies used were as follows: anti-α1NKA (1:500, mouse monoclonal, clone C464.6; Millipore Bioscience Research Reagents); anti-α1NKA (goat polyclonal; Santa Cruz Biotechnology); anti-α1NKA (mouse monoclonal, clone α6F; DHSB; only used for IP); anti-α2 NKA (1:500, rabbit polyclonal; Millipore Bioscience Research Reagents); anti-α3 NKA used for zebrafish (1:1000, mouse monoclonal; Affinity BioReagents); anti-α3 NKA (1:500, goat polyclonal; Santa Cruz Biotechnology); anti-β1 NKA (1:500, rabbit polyclonal; Thermo Scientific); anti-β2 NKA (1:500, rabbit polyclonal; Sigma); anti-Thy-1 (1:500, mouse monoclonal; BD Biosciences PharMingen); anti-flotillin1 (1:500, mouse monoclonal; BD Biosciences); anti-clathrin heavy chain (1:500, mouse monoclonal; BD Transduction); anti-β3 tubulin (1:1000, mouse monoclonal; Sigma-Aldrich); and anti-tubulin for zebrafish (mouse monoclonal, clone 6G7s; DHSB). Fluorophore-coupled secondary antibodies were acquired from Invitrogen. All the chemicals used were obtained from Sigma-Aldrich, and the Neurobasal medium and B-27 supplement were purchased from Invitrogen. The monoclonal antibody (clone 6G7) used for zebrafish tubulin detection was generated by Dr Willi Halfter (University of Pittsburgh), and the monoclonal antibody (clone α6F) anti-α1NKA was generated by Dr Douglas M. Fambrough (Johns Hopkins University). Both these antibodies were obtained from the Developmental Studies Hybridoma Bank developed under the auspices of the NICHD and maintained by the University of Iowa (Department of Biology, Iowa City, IA). Expression vectors for the rat α1, α2, and α3 NKAs were generously donated by Dr Jerry B. Lingrel (University of Cincinnati).
Protein identification by liquid chromatography coupled to tandem mass spectrometry
Protein in-gel digestion.
Protein identification in immunoprecipitates was performed following a previously published strategy (Pérez-Hernández et al., 2013). Approximately 40 μl of immunoprecipitated beads was suspended in 10 μl of sample buffer (5% SDS, 10% glycerol, 25 mm Tris-Cl, pH 6.8, 10 mm DTT, 0.01% bromophenol blue). Proteins retained by the beads were digested using a previously described protocol (Bonzon-Kulichenko et al., 2011). The samples were applied onto 2.8-cm-wide wells of a conventional SDS-PAGE gel (0.5 mm thick, 4% stacking, 10% resolving). The run was stopped as soon as the front entered 3 mm into the resolving gel so that the whole proteome was concentrated in the stacking/resolving gel interface. The protein band was visualized by Coomassie staining, excised, cut into cubes, and digested overnight at 37°C with 60 ng/μl trypsin at a 5:1 protein:trypsin (w/w) ratio in 50 mm ammonium bicarbonate, pH 8.8, containing 10% acetonitrile and 0.01% 5-cyclohexyl-1-pentyl-β d-maltoside. The resulting tryptic peptides from each proteome were then extracted by 1 h incubation in 12 mm ammonium bicarbonate, pH 8.8. Trifluoroacetic acid was added to a final concentration of 1%, and the peptides were finally desalted onto C18 Oasis cartridges and dried. The resulting peptides from each gel band were analyzed separately by reversed phase HPLC-LIT for protein identification.
Mass spectrometry and data analysis.
To identify proteins, the resulting tryptic peptide mixtures were analyzed by nanoliquid chromatography coupled to mass spectrometry. Peptides were injected onto a C-18 reversed phase nanocolumn (100 μm ID and 15 cm, Mediterranea Sea Teknokroma) and analyzed on a continuous acetonitrile gradient of 0–43% B for 90 min and 50–90% B for 1 min (B = 95% acetonitrile, 0.1% formic acid). Peptides were eluted from the reversed phase nanocolumn at a flow rate of 200 nl/min for real-time ionization, and peptide fragmentation was performed on an LTQ-Orbitrap mass spectrometer (Thermo Fisher). An enhanced FT-resolution spectrum (resolution = 30,000) and the MS/MS spectra of the 15 most intense parent ions were analyzed during the chromatographic run (150 min). Dynamic exclusion was set at 0.5 min.
The MaxQuant software package (version 1.0.3.5) was used to identify the proteins (Cox and Mann, 2008; Cox et al., 2009). Peptides were searched against the rat database (IPI.Rat, version 3.84) containing common contaminants using Andromeda. Carbamidomethylation of cysteine was selected as a fixed modification, and oxidation of methionine and acetylation of the protein N terminus was used as variable modification. Trypsin was selected as protease (full specificity) with a maximum of two missed cleavages. A mass tolerance of 0.6 Da was used for fragment ions. A minimum of seven amino acids per identified peptide was required. The false discovery rate threshold was set to 1% at both the peptide and protein levels.
Rubidium-86 uptake by neurons
Rubidium-86 uptake by neurons was used to measure the potassium ion pumping activity of NKA. Neurons were maintained in Neurobasal medium containing different concentrations of ouabain for 15 min at 37°C. The medium was then replaced with Neurobasal medium containing 1.5 μCi/ml (55.5 μBq/ml) of 86Rb (PerkinElmer Life and Analytical Sciences) and the previous concentrations of ouabain. The uptake assay was allowed to proceed for 10 min, and the incubation was stopped by rinsing the plate four times with cold PBS. The cells were extracted with 0.25 ml of 0.2 mm NaOH for 10 min, and the samples were counted in a liquid scintillation counter to measure the radiation from the incorporated β-emitting 86Rb isotopes. Each data point represents the average radioactivity present in nine separate wells from three different experiments.
Immunoprecipitation
Synaptosomes or primary neurons from the brainstem or spinal cord (100 μg) were lysed for 30 min at room temperature (RT) at a concentration of 0.35 mg of protein/ml in TN buffer (25 mm Tris-HCl and 150 mm NaCl, pH 7.4) containing 0.25% NP-40 and protease inhibitors (PIs: 0.4 mm PMSF + Sigma mixture). After 15 min centrifugation in a Microfuge to remove the cell debris, 4 μg of protein was separated to quantify total protein (T), and 5–10 μl of the primary antibody was added and left overnight at 4°C using the following antibodies for immunoprecipitation: rat or rabbit anti-GlyT2, mouse anti-α1 NKA (clone α6F), rabbit anti-α2 NKA, goat anti-α3 NKA, rabbit anti-β1 NKA, or rabbit anti-β2 NKA. A negative control was also run in parallel in which an irrelevant antibody was added, denoted as IgG. Subsequently, 20 μl of 50% protein A-Sepharose beads for rabbit antibodies or protein G-Sepharose beads for rat, mouse, or goat antibodies were added and incubated for 45 min at 4°C. The beads were collected by mild centrifugation and washed twice for 7 min with lysis buffer at RT. Finally, the beads were pelleted, and the immunoprecipitated proteins were eluted in Laemmli buffer at 75°C for 10 min, resolved in SDS-PAGE gels (7.5%), detected in Western blots by enhanced chemiluminescence, and quantified on a GS-710 calibrated imaging densitometer (Bio-Rad).
Lipid raft isolation
Membrane rafts were isolated from brainstem and spinal cord synaptosomes or primary neurons as described previously (de Juan-Sanz et al., 2011). Briefly, washed and scraped neurons or purified synaptosomes (2 mg of protein/ml) were lysed in MBS buffer (25 mm MES and 150 mm NaCl, pH 6.5) containing 0.35% Triton X-100 and PIs (0.4 mm PMSF + Sigma mixture), and solubilized by passing them through a 25-gauge needle and left at 4°C for 30 min. Equal volumes of 70% (w/v) sucrose were then added to the lysates, and they were mixed thoroughly before overlaying 1 ml of the sample successively with 2 ml of 30% and 1 ml of 5% sucrose (in MBS + PI) in Ultra-Clear Beckman tubes suitable for centrifugation in a TST 60.4 rotor. After 18 h of 52,000 rpm ultracentrifugation at 4°C, the raft fractions (R) were collected from the 5–30% sucrose interphase while the nonraft fractions from the last 35% of the phase (NR). Both the R and NR were solubilized for 30 min at RT in 0.25% NP-40 to disrupt raft structure, and the proteins recovered were analyzed by Western blot or they were immunoprecipitated as indicated above. To ensure the correct isolation, flotillin1 and clathrin heavy chain were used as raft and nonraft markers, respectively.
Primary cultures of brainstem and spinal cord neurons
Primary cultures of brainstem and spinal cord neurons were prepared as described previously (de Juan-Sanz et al., 2013). Briefly, the brainstem and spinal cord of Wistar rat fetuses were obtained at the 16th day of gestation, and the tissue was then mechanically disaggregated in HBSS (Invitrogen) containing 0.25% trypsin (Invitrogen) and 4 mg/ml DNase (Sigma). Cells were plated at a density of 500,000 cells/well in 12 well multiwell plates (Falcon), and they were incubated for 4 h in DMEM containing 10% FCS, 10 mm glucose, 10 mm sodium pyruvate, 0.5 mm glutamine, 0.05 mg/ml gentamicin, 0.01% streptomycin, and 100 μU/ml penicillin G. After 4 h, this buffer was replaced with Neurobasal/B27 culture medium containing 0.5 mm glutamine (50:1 by volume: Invitrogen), and 2 d later cytosine arabinoside (2.5–5 μm) was added to inhibit further glial growth. These primary neurons were used for study after 14–21 d in culture.
Immunofluorescence of brainstem and spinal cord primary neurons
Primary neurons were fixed with 4% paraformaldehyde in PBS, washed three times with 1 ml PBS, and then blocked for 30 min with 10% serum in TNT (0.1 m Tris/HCl, pH 7.5, 0.3 m NaCl, and 0.2% Triton). The neurons were then incubated for 2 h with the primary anti-GlyT2 rat antibody (1:500) together with the following: anti-α1 NKA (1:500), anti-α2 NKA (1:500), anti-α3 NKA (1:500), or Thy-1 (1:500) diluted in TNT containing 1% serum. The cells were then washed three times with TNT buffer and incubated for 2 h with the secondary antibody diluted in TNT with 1% serum (anti-rat AlexaFluor-594, 1:500; anti-mouse AlexaFluor-488, 1:500; anti-rabbit AlexaFluor-594, 1:500). After three washes with TNT, the coverslips were mounted on microscope slides with Vectashield (Vector Laboratories) and the cells were visualized by confocal microscopy on an inverted microscope AXIOVERT200 (Zeiss).
Immunofluorescence of brainstem and spinal cord synaptosomes
Purified brainstem and spinal cord synaptosomes were analyzed by double immunofluorescence as reported previously (Jiménez et al., 2011), using primary antibodies against GlyT2 and the different NKA α-subunits. The synaptosomes were visualized under a confocal microscope as indicated above.
Immunofluorescence quantification and generation of color maps
At least 40 images for each treatment condition were quantified using ImageJ software (National Institutes of Health). Images were processed with a 2.0 pixel median filter, and the threshold used was automatically determined by the JACoP plugin (Bolte and Cordelières, 2006). The Pearson's value was obtained with JACoP by comparing the two thresholded channels and measuring the correlation between them. The value can range from −1 to 1, with 1 representing the maximal colocalization possible (two identical images) and values ≥0.5 usually considered as valid colocalization (Zinchuk and Zinchuk, 2008). Colocalization color maps were generated in ImageJ using the colocalization color map plugin (Jaskolski et al., 2005).
Whole-mount immunofluorescence of zebrafish embryos
Manually dechorionated 48 hpf zebrafish embryos were fixed for 1 h in 4% PFA at RT, washed three times with PBS, and blocked for 1 h with 10% serum in PBS containing 0.55% Triton X-100. The fixed embryos were incubated with the primary anti-GlyT2 rabbit antibody (1:200) and the anti-α3 NKA mouse antibody (1:200) in PBS containing 1% serum at 4°C for 3 d with gentle rotation. The embryos were then washed three times with PBS and incubated for 4 h with the secondary antibodies in PBS with 1% serum (anti-rabbit AlexaFluor-594 1:500, red; anti-mouse AlexaFluor-488 1:500, green). After three washes with PBS, the embryos were visualized under a stereoscopic magnifying glass (Leica) or they were mounted on coverslips with Vectashield (Vector Laboratories) and visualized by confocal microscopy on an inverted microscope AXIOVERT200 (Zeiss).
Zebrafish embryo incubations with ouabain
Manually dechorionated 48 hpf zebrafish embryos were incubated with 100 μm ouabain diluted in E3 medium (5 mm NaCl, 0.17 mm KCl, 0.33 mm CaCl2, 0.33 mm MgSO4, and 0.1% methylene blue) or with the vehicle alone (n = 7 embryos per point, performed in triplicate). After a 6 h incubation with slow shaking, the embryos were collected, lysed in 95°C Laemmli buffer for 5 min, sonicated, and the proteins resolved on SDS-PAGE gels (7.5%). GlyT2 expression was assessed in Western blots probed with an anti-GlyT2 rabbit primary antiserum and with a peroxidase-linked anti-rabbit IgG. Antibody binding was visualized by enhanced chemiluminescence and quantified on a GS-710 calibrated imaging densitometer (Bio-Rad).
Intramedullar administration of ouabain in adult Wistar rats
Young adult male Wistar rats (295–315 g, 12 weeks of age) were anesthetized with an intraperitoneal injection of sodium thiobarbital (40 mg/kg) and xylacine (10 mg/kg). Once the absence of reflexes was confirmed, a dorsal midline incision was made into the skin and thoracic vertebra 8 (T8) was exposed after dissection of the muscle. The spiny apophysis and dorsal lamina of T8 were removed, exposing the spinal cord. Intramedullar injections (2 μl of 1 mm ouabain per animal) were applied to this section using a Hamilton glass micro-needle syringe (Hamilton). Sham-operated animals underwent the same laminectomy protocol but were injected with the vehicle alone. In both cases, the injection sites were identified by the deposition of a trypan blue dye (0.5 mg/ml, Sigma). Three hours after the administration, the animals were killed, and different sections of the spinal cord (cervical vertebra 4 [C4], T8, and thoracic vertebra 12 [T12]) were extracted, lysed, and analyzed in Western blots.
Results
Given the importance of GlyT2 in the pathophysiology of inhibitory glycinergic neurotransmission and considering the small number of proteins currently known to interact with this transporter, we performed a proteomic study to identify new molecular partners involved in the functional modulation of GlyT2. Accordingly, we immunoprecipitated the native transporter from brainstem and spinal cord synaptosomes with a specific GlyT2 antibody (Zafra et al., 1995) and identified associated protein partners by high-throughput mass spectrometry. In these assays, the number of peptides and total spectral counts detected that corresponded to nonspecific binding proteins were similar when the immunoprecipitation was performed using the anti-GlyT2 antibody, a nonrelated rabbit IgG, or Sepharose beads alone (e.g., β4 tubulin; Fig. 1A). However, we found that the anti-GlyT2 antibody specifically enhanced the detection of a higher number of spectral counts belonging to the NKA subunits (Fig. 1A). NKA is mainly composed of a catalytic α-subunit that contains the binding sites for ATP, Na+, K+, and CTS selective inhibitors and a heavily glycosylated β subunit. In some tissues, this enzyme is associated with a member of the FXYD family named the γ-subunit. We found in GlyT2 immunoprecipitates spectral counts corresponding to catalytic subunits α1, α2, and α3, and accessory subunits β1 and β2 with a higher level corresponding to α-subunits (Fig. 1A). However, the lower detection of β-subunits could be explained because they are highly glycosylated proteins and this condition can reduce the amount of the spectral counts. Therefore, this first mass spectrometry result indicated that GlyT2 could be interacting with α, β, or both subunits (representative tandem mass spectra of α1NKA-, α2NKA-, and α3NKA-specific peptides obtained in these assays are shown in Fig. 1B–D).
Figure 1.

Specific identification of Na+/K+-ATPase as an interacting partner of GlyT2. A, The histogram represents the spectral counts obtained from mass spectrometry corresponding to the α1, α2, α3, β1, and β2 subunits of NKA identified in the control (rabbit IgG immunoprecipitation, light gray) or anti-GlyT2 immunoprecipitations (dark gray). There is a significant increase in the number of αNKA spectral counts identified in the GlyT2 immunoprecipitation. β4 tubulin is shown as an example of nonspecific interaction that was identified equally in the controls and in the GlyT2 immunoprecipitations. GlyT2 spectral counts are identified only in the correct autoimmunoprecipitation. B–D, MS/MS spectra from the double-charged ions at m/z: 760.35, corresponding to the SPDFTNENPLETR peptide (B); 716.88, corresponding to VLGFCQLNLPSGK peptide (C); and 1116.49, corresponding to TVNDLEDSYGQQWTYEQR peptide (D). These peptides were derived from the α1NKA, α2NKA, and α3NKA subunits, respectively.
GlyT2 interacts with NKA in synaptosomes
To confirm GlyT2-NKA interaction, we performed reverse coimmunoprecipitations from rat brainstem and spinal cord synaptosomal lysates with specific antibodies directed against GlyT2 and α1, α2, α3, β1, and β2 NKA subunits (Fig. 2A–E). To discard experimental artifacts, we have verified the specificity of the antibodies (data not shown). Western blotting showed that each antibody selectively immunoprecipitated the respective target protein and that GlyT2 coimmunoprecipitated with α and β NKA subunits (Fig. 2A–D), indicating that native GlyT2 and NKA proteins interact specifically under physiological conditions. A significant percentage of GlyT2 interacted with α3 (13.01 ± 1.92%), a minor amount with α2 (4.90 ± 1.83%), and very little with α1 (0.29 ± 0.18%). In addition, the interaction with β subunits was also detected, showing that 1.16 ± 0.21% of total GlyT2 copurified with β1 and 2.91 ± 0.94% with β2. These results would suggest that GlyT2 preferentially interacts with α3:β2-NKA complexes, but further studies would be needed to conclusively identify the NKA subunit to which GlyT2 interacts. The α3 isoform is widely distributed throughout the brain, but its expression is restricted to neurons. By contrast, the α2 isoform is mainly found in astrocytes throughout the adult brain, although it is strongly expressed in neurons during development and it persists in some neurons of the adult (Sweadner, 1989; McGrail et al., 1991; Juhaszova and Blaustein, 1997; Moseley et al., 2003; Teixeira et al., 2003). Because the α1 isoform is expressed in all cells, the magnitude of the interaction between GlyT2 and α3 subunit could be related to its specific neuronal expression. To further investigate the interaction between GlyT2 and the different NKAα subunits, their colocalization was examined by immunocytochemistry in primary neuronal cultures from brainstem and spinal cord (Fig. 3). Double labeling for GlyT2 and NKA α subunits (Fig. 3A–C) indicates that most GlyT2 overlaps with α3 subunit and shows a more limited colocalization with α2 and α1. Given that GlyT2 is expressed in axons and nerve terminals and NKA is enriched in synapses (Hilgenberg et al., 2006; Hazelwood et al., 2008), we performed further immunofluorescence assays in synaptosomes where the degree of colocalization between synaptic NKA and GlyT2 should be significantly higher. Indeed, in addition to increasing the extent of colocalization between GlyT2 and α3 subunit, the quantitative differences in the colocalization of the transporter and each of the three subunits are more clearly manifested in this preparation (Fig. 4). Together, these immunoprecipitation and immunocytochemical assays contribute to show that GlyT2 interacts specifically with NKA in neurons. Considering these results and the neuron-specific expression of the α3 subunit and GlyT2, our further study is focused on the GlyT2-NKA interaction by studying the α3 subunit of the NKA.
Figure 2.
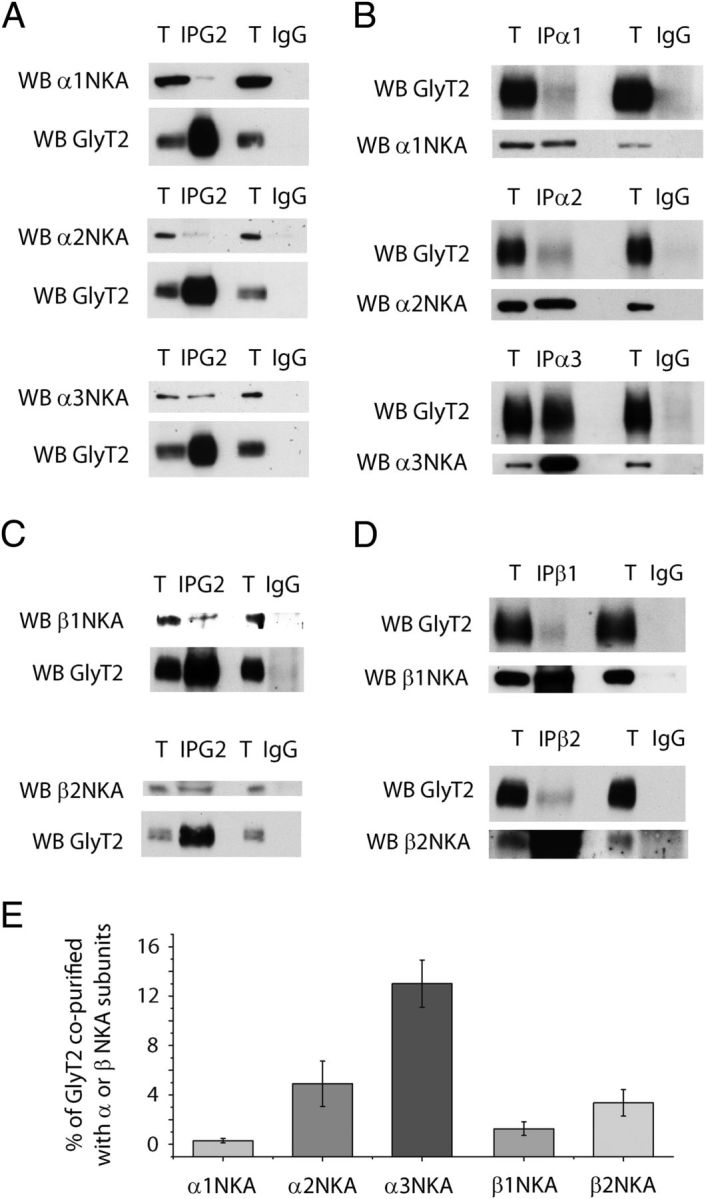
The neuronal glycine transporter GlyT2 copurifies with Na+/K+-ATPase. A–D, Synaptosomes from the rat brainstem and spinal cord were lysed and incubated at 4°C with antibodies against GlyT2 (A,C), the α1, α2, or α3 NKA subunit (B), the β1 or β2 NKA subunit (D), or the equivalent IgGs as control (A–D). After a 1 h incubation with protein A (for rabbit antibodies) or protein G (for goat and mouse antibodies) beads, the samples were precipitated by mild centrifugation. The protein complexes were analyzed in Western blots probed with anti-GlyT2 and anti-α1, -α2, -α3, -β1, or -β2 NKA subunit antibodies. T, Total protein (4 μg); IP, immunoprecipitated sample (96 μg); IgG, IgG immunoprecipitation controls (96 μg). An interaction can be detected between GlyT2 and the NKA isoforms (specifically with α3NKA), yet no signal is observed with the IgG controls. C, Quantification of the percentage of GlyT2 interacting with the different NKA subunits was calculated from the immunoprecipitations shown in B. D, Normalizing against the amount of autoimmunoprecipitated α or β subunit. E, The histogram represents the mean ± SEM (IP α1, n = 3; IP α2, n = 5; IP α3, n = 8; IP β1, n = 3; IP β2, n = 3).
Figure 3.
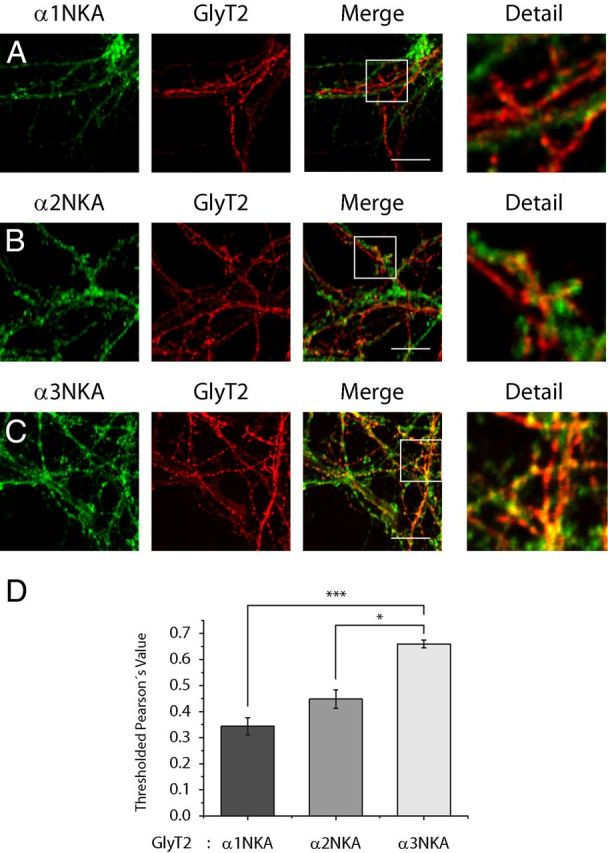
GlyT2 colocalizes with the α3 subunit of the Na+/K+-ATPase in brainstem and spinal cord primary neurons. A–D, Primary cultures of spinal cord and brainstem neurons were grown on glass coverslips, fixed in methanol at −20°C, and incubated with antibodies against GlyT2 and the α1 (A), α2 (B), or α3 (C) NKA subunits. After incubating with secondary antibodies, the cells were visualized by confocal microscopy, showing GlyT2 in red and αNKA subunits in green. D, Quantification of colocalization using Pearson's value as described in Materials and Methods. The histogram represents the mean ± SEM (n = 3; on average 30 images per condition were analyzed in each experiment). *p < 0.05, significantly different (Tukey's post hoc test). ***p < 0.001, significantly different (ANOVA with Tukey's post hoc test). There is significantly enhanced colocalization of the GlyT2 and α3 subunit of NKA, with respect to the α2 and α1 subunits.
Figure 4.
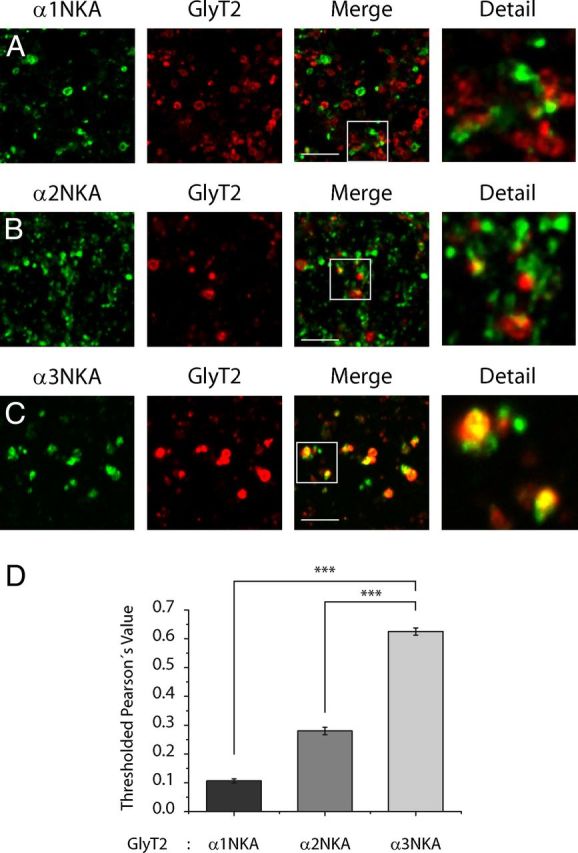
GlyT2 colocalizes with the α3 subunit of the Na+/K+-ATPase in synaptosomes from adult rat brainstem and spinal cord. A–D, Synaptosomes isolated from the adult rat brainstem and spinal cord were deposited on glass coverslips for 1 h, fixed in methanol at −20°C, and incubated with antibodies against GlyT2 and the α1 (A), α2 (B), or α3 (C) NKA subunits. After incubation with the secondary antibodies, the synaptosomes were visualized by confocal microscopy, showing GlyT2 in red and αNKA subunits in green. D, Quantification of the colocalization using Pearson's value was performed as described in Materials and Methods, and the histogram represents the mean ± SEM (n = 3; on average, 30 images per condition were analyzed in each experiment). ***p < 0.001, significantly different (ANOVA with Tukey's post hoc test). There is significantly enhanced colocalization between GlyT2 and the α3 subunit of NKA over the α2 and α1 subunits.
GlyT2–NKA interaction occurs in lipid rafts
We recently reported that GlyT2 displays optimal transport activity when associated with lipid rafts in plasma membrane where most of the transporter resides in primary neurons and synaptosomes from the rat brainstem (Núñez et al., 2008). Given that NKA localizes in lipid rafts of several tissues (Taguchi et al., 2007; Welker et al., 2007; Fujii et al., 2008; Liu et al., 2011; Tajima et al., 2011), we investigated whether NKA and GlyT2 interact in these membrane subdomains. Coimmunoprecipitation assays using an anti-NKA α3 antibody (Fig. 5A) performed from raft and nonraft fractions isolated through a sucrose gradient clearly indicated that the interaction between the two proteins only occurred in lipid rafts. The purity of the isolated fractions was confirmed by the differential distribution of the raft and nonraft markers flotillin1 and clathrin heavy chain (Fig. 5B). To detect possible proteins that might mediate the GlyT2-NKA interaction, we performed mass spectrometry analyses of GlyT2 immunoprecipitates from raft and nonraft fractions. Interestingly, NKA spectral counts were predominantly identified in the raft fractions confirming the restriction of the GlyT2-NKA complexes to lipid raft subdomains (Fig. 5C). Further immunocytochemical evidence of this distribution came from assays using specific antibodies against GlyT2, α3, and Thy-1, a marker of neuronal rafts (Madore et al., 1999) (Fig. 6). The three proteins displayed a similar distribution (Fig. 6A–G), leading to a high degree of triple colocalization (Fig. 6H,I). As a control of the proteomic assay, other molecules were restricted to nonraft fractions or found evenly in both fractions. However, proteins other than the NKA subunits that were found solely in the raft fraction were not likely to be involved in GlyT2-NKA interactions at the plasma membrane mainly because of their intracellular localization in native cells. Nevertheless, to rule out such possibilities, more detailed studies of these proteins would be necessary.
Figure 5.

GlyT2-NKA interaction is compartmentalized to the lipid raft subdomains. A–C, Adult rat brainstem and spinal cord synaptosomes were lysed in ice-cold lysis buffer, and the lipid raft fractions were isolated on a discontinuous sucrose density gradient as described in Materials and Methods. A, The membrane raft or nonraft fractions were pooled, adjusted to 100 μg in the same volume, lysed at RT for 30 min in lysis buffer to disrupt the remaining raft structures, and incubated with the antibody against α3 NKA or the equivalent amount of goat IgG as control. After protein G-Sepharose incubation, the protein complexes were separated by SDS-PAGE and probed with anti-GlyT2 antibody. T, Total protein (4 μg); IP, immunoprecipitated sample (96 μg), IgG, IgG immunoprecipitation control (96 μg). GlyT2 only copurifies with the lipid raft-associated α3NKA isoform, and no signal was observed in the IgG controls or from the nonraft immunoprecipitated α3NKA. B, For each experiment performed as in A, 10 μg of raft and nonraft fractions were resolved by SDS-PAGE, and the Western blots were probed with anti-flotillin1 (raft marker) and anti-clathrin heavy chain (CHC, nonraft marker) to ensure the purity of the isolated fractions. C, The lipid raft and nonraft fractions isolated and lysed as in A were incubated with anti-GlyT2 or rabbit IgG, and recovered with protein A-Sepharose beads. The protein complexes were digested, and the resulting peptides were identified by high-throughput MS. The histogram represents the spectral counts obtained from mass spectrometry corresponding to the α1, α2, α3, β1, and β2 subunits of NKA identified from raft and nonraft fractions. Light gray represents nonraft rabbit IgG immunoprecipitation; dark gray, nonraft anti-GlyT2 immunoprecipitations; medium gray, raft rabbit IgG immunoprecipitation; green, raft anti-GlyT2 immunoprecipitations. β4 tubulin is shown as an example of nonspecific peptides that were identified equally in the controls and in the GlyT2 immunoprecipitations. GlyT2 spectral counts are shown as a control for the correct autoimmunoprecipitation. NKA subunits are more often detected in the lipid raft-associated GlyT2 immunoprecipitates (specifically α3 NKA).
Figure 6.

Triple colocalization of GlyT2, α3NKA, and the lipid raft marker Thy-1 in brainstem and spinal cord primary neurons. A–I, Primary cultures of spinal cord and brainstem neurons were grown on glass coverslips, fixed in methanol at −20°C, and incubated with primary and secondary antibodies against GlyT2 (green), α3NKA (red), and the lipid raft marker Thy-1 (blue). The cells were visualized by confocal microscopy, and triple colocalization maps were generated using a colocalization color map plugin to denote the regions of triple colocalization, showing the maximum colocalization pixels in red and the minimum colocalization pixels in blue. GlyT2-α3NKA colocalization cocompartmentalizes extensively with the lipid raft Thy-1 clusters.
Ouabain effect on the transport activity and expression of GlyT2
Lipid rafts are fluctuating nanoscale assemblies of sphingolipids, cholesterol, and proteins that are stabilized into platforms important for signaling, viral infection, and membrane trafficking (Simons and Gerl, 2010). As mentioned above (see Introduction), NKA also acts as a specific receptor for endogenous and exogenous CTS through the formation of macromolecular complexes in which α subunit acts as the anchor. CTS-activated NKA signaling depends on the formation of specific signaling microdomains that couple NKA to its downstream effectors (Lingrel, 2010; Liu and Xie, 2010; Benarroch, 2011; Reinhard et al., 2013). The ouabain binding site in NKA lies in the α subunit, and different isoforms of the α subunit have similar affinities for ouabain, except for the rat and mouse α1 subunit, which is relatively resistant to ouabain and has much lower affinity than the other isoforms (103-fold to 104-fold) (for review, see Lingrel, 2010). Therefore, we examined the effect of different concentrations of ouabain on GlyT2 function and protein expression. As ouabain is known to inhibit NKA function, we determined the effect of ouabain on NKA and GlyT2 transport activities in parallel experiments performed in brainstem and spinal cord neurons (Fig. 7). A dose–response analysis of ouabain effect on the activity of NKA was performed by measuring 86Rb flux as a tracer for potassium. The results showed that ouabain inhibits both 86Rb and [3H]-glycine uptake in a concentration-dependent manner (Fig. 7A). Substantial inhibition was observed with 20 μm ouabain (NKA, 55%; GlyT2, 45%), and concentrations >50 μm resulted in a nearly total inhibition. The tight correlation observed between the ouabain-mediated inhibition of both transporters may be explained by the strict dependence of GlyT2 function on the sodium electrochemical gradient that is mainly generated and maintained by NKA at the neuronal plasma membrane. Because GlyT2 cotransports Na+/Cl−/glycine with a stoichiometry of 3:1:1 (López-Corcuera et al., 1998; Roux and Supplisson, 2000), a functional relationship between the two proteins is therefore not unexpected.
Figure 7.

Functional coupling between Na+/K+-ATPase and GlyT2. A, Concentration-dependent inhibition of 86Rb uptake (NKA activity) and [3H]-glycine transport (GlyT2 transport) by ouabain (20 min) in brainstem and spinal cord primary neurons. The results are expressed as the percentage of control cells maintained in the absence of ouabain, and each point represents the mean ± SEM of four experiments performed in triplicate. B, C, Representative immunoblot of primary brainstem and spinal cord neuronal cultures. Cells were treated with ouabain at 1 μm (B) or 50 μm (C) for the times indicated. After labeling the cell surface proteins with sulfo-NHS-SS-biotin and recovering the biotinylated proteins with streptavidin-agarose beads, the surface and total expression of GlyT2 and α3NKA were analyzed in Western blots. Tubulin immunodetection was used as a nonbiotinylated protein control. 2, 4, Biotinylated protein (16 μg). 1, 3, Total protein (8 μg). D, Degradation curves were generated by measuring the GlyT2 band densities and normalizing them to the corresponding tubulin densities in the total protein (1 and 3), or to the corresponding surface α3NKA band densities in surface proteins (2 and 4), and designating time 0 as 100%. The black curves correspond to the total GlyT2 concentrations after exposure to 1 μm (1) or 50 μm (3) ouabain, and the gray curves correspond to the surface GlyT2 levels after exposure to 1 μm (2) or 50 μm (4) ouabain. Densitometric analysis was performed on five independent Western blots (as in B and C), representing the mean ± SEM. E–G, Representative immunoblots of primary brainstem and spinal cord neuron cultures. E, Neurons were pretreated with the vehicle alone (veh), leupeptin (leupt), or MG132 for 3 h, and then 50 μm ouabain or the vehicle was added for a further 3 h while maintaining the pretreatment. When GlyT2 expression was analyzed in Western blots, GlyT2 degradation was significantly blocked by leupeptin treatment. F, Neurons were treated with 10 μg/ml cycloheximide or 50 μm ouabain and the respective vehicles (veh) for 3 h, and GlyT2 expression was assessed in Western blots. G, Neurons were treated with the vehicle alone or with 50 μm ouabain, and the expression of the following GlyT2-associated proteins was assessed: α1NKA, syntaxin1A (STX1A), serotonin transporter (SERT), CRMP5, and GABA transporter 1 (GAT1).
To elucidate the physiological role of the GlyT2-NKA interaction, the effect of ouabain on the overall expression and the plasma membrane levels of GlyT2 were explored. Low (1 μm) and high (50 μm) inhibitor concentrations were used to compare virtually unaltered activity with significant inhibition of the ion pump, respectively. Biotinylation with the impermeable sulfo-NHS-SS-biotin was quantified to detect changes in the cell surface levels of GlyT2. Interestingly, a decrease in surface GlyT2 levels was detected in immunoblots when neurons were exposed to 1 μm ouabain, a concentration that hardly affected NKA activity (Fig. 7B,D). This effect started within 1 h of ouabain treatment, and larger reductions were observed after longer exposures, whereas the total amount of GlyT2 remained unaffected after 3 h of ouabain treatment. By contrast, general inhibition of NKA activity by a high dose of ouabain (50 μm) drastically reduced both the total and neuronal GlyT2 surface expression (Fig. 7C,D). Because the reduction of total GlyT2 may be the result of synthesis inhibition and/or increased degradation, we assayed the effect of suppressing each of these cellular processes in the presence or absence of ouabain to discern the reason behind the decrease (Fig. 7E,F). The ouabain-induced reduction of GlyT2 was completely prevented in the presence of leupeptin, a lysosomal protease inhibitor. The partial effect exerted by the proteasome inhibitor MG132 are probably the result of decreased GlyT2 ubiquitination caused by depletion of the intracellular free ubiquitin pool (Patnaik et al., 2000; Melikova et al., 2006). This conclusion is based on our earlier results showing that endocytosis and further sorting of GlyT2 to the recycling or degradation pathways in neurons depends on ubiquitination, and that the ubiquitination status of the transporter is highly sensitive to ubiquitin homeostasis (de Juan-Sanz et al., 2013). In addition, inhibition of lysosomal proteases by the proteasome blocker MG132 might be involved (Longva et al., 2002). The lack of effect observed by 3 h treatment with cycloheximide, an inhibitor of the protein synthesis, compared with the decrease in GlyT2 expression caused by a similar treatment of ouabain, suggests that degradation, but not protein synthesis, underlies the reduction of GlyT2 levels (Fig. 7F). Together, these results indicate that NKA-dependent reduction of GlyT2 expression is mainly the result of an increase in its lysosomal degradation. To investigate whether ouabain-mediated GlyT2 degradation was a more general effect, the expression of GlyT2-related neuronal proteins was assessed in the presence of 50 μm ouabain. Syntaxin 1A and CRMP5/Ulip6 have been identified as binding partners of GlyT2 (Geerlings et al., 2001; Horiuchi et al., 2005), the serotonin and GABA transporters (SERT and GAT1, respectively), like GlyT2, are members of the SLC6 gene family. Finally, α1 and α3 are the most abundant NKA subunits in neurons. Interestingly, no changes were detected in the expression of these proteins after 3 h of treatment with 50 μm ouabain, suggesting that downregulation of GlyT2 by NKA was selective (Fig. 7C,G).
Then we asked whether the fact that GlyT2-NKA interaction takes place in rafts (Fig. 5) could have functional implications and hence participate in the ouabain-mediated degradation of GlyT2. Accordingly, we isolated lipid rafts from primary cultures of brainstem and spinal cord neurons previously treated with 50 μm ouabain and GlyT2 levels in raft and nonraft fractions were immunodetected by Western blot (Fig. 8A). Interestingly, most of the ouabain-induced GlyT2 degradation occurred in raft fractions whereas GlyT2 located outside the rafts remained unaffected. Because GlyT2 must be located in rafts for optimal transport activity, our results strongly suggest that NKA exerts a regulatory role selectively on the cell surface GlyT2 lipid raft-associated pool. Furthermore, the disruption of lipid rafts by the cholesterol chelator nystatin completely blocked ouabain-mediated GlyT2 degradation (Fig. 8B). Therefore, in addition to providing the appropriate environment for optimal GlyT2 activity and consistent with their role as signaling platforms, lipid rafts constitute the plasma membrane subdomains where the neuronal GlyT2-NKA interaction regulates the endocytosis and subsequent degradation of GlyT2.
Figure 8.

Ouabain-mediated degradation of lipid raft-associated GlyT2. A, Brainstem and spinal cord primary neurons were treated with 50 μm ouabain or the vehicle alone for 3 h, they were lysed with ice-cold lysis buffer, and the lipid raft fractions were isolated on a discontinuous sucrose density gradient (as described in Materials and Methods). The membrane raft or nonraft fractions were pooled, adjusted to 100 μg in the same volume, and they were maintained at 37°C for 30 min in lysis buffer before measuring GlyT2 expression. Flotillin1 is shown to demonstrate the purity of the isolated fractions. There is significant degradation of the lipid raft-associated GlyT2 pool. B, Neurons were pretreated with the vehicle alone (DMSO) or nystatin (Nys) for 3 h, after which 50 μm ouabain or the vehicle alone was added for a further 3 h, maintaining the previous pretreatment. The nystatin-mediated disruption of raft subdomains impaired GlyT2 degradation. **p < 0.01, ***p < 0.001, significantly different (ANOVA with Tukey's post hoc test). n.s., Not significant.
Ouabain-mediated degradation of GlyT2 occurs in vivo in distinct species
Because ouabain is an endogenously produced compound (Hamlyn et al., 1991; el-Masri et al., 2002), we investigated whether the regulation of GlyT2 observed in vitro in the primary cultures of rat brainstem and spinal cord neurons also occurred in vivo. To test this hypothesis, we first studied the zebrafish (Danio rerio) embryo, a firmly established model widely used to investigate drug effects, CNS development, mechanisms of neurological disease, and even behavioral neuroscience (for review, see Levin and Cerutti, 2009; Cheng et al., 2011; Xi et al., 2011). Furthermore, the extended distribution of glycinergic neurons and GlyT2 has been widely studied (Higashijima et al., 2004a, b; Cui et al., 2005; Moly and Hatta, 2011; Barreiro-Iglesias et al., 2013). Recently, it became also evident that zebrafish is a valuable model for investigating NKAα subunit functions (Doðanli et al., 2012, 2013). In zebrafish, CNS drug tests must be performed before the blood–brain barrier is fully formed to ensure that the compound reaches its neuronal targets, a process that ends 3 d after fertilization (72 hpf) when the embryo is ready to hatch. Thus, drug screening is usually performed on dechorionated embryos at earlier stages. GlyT2 expression in zebrafish embryos starts at 20 hpf (Higashijima et al., 2004a), augmenting over time and being clearly detected at 36–48 hpf (Higashijima et al., 2004b; Cui et al., 2005; Moly and Hatta, 2011). Moreover, 48 hpf zebrafish embryos expressed both α3NKA and GlyT2, which colocalized extensively in the central brain, hindbrain, and spinal cord, being clearly observed in dorsal interneurons (Fig. 9A–F) (Higashijima et al., 2004a, b; Cui et al., 2005; Moly and Hatta, 2011). When we treated dechorionated 48 hpf zebrafish embryos with a high dose of ouabain for 6 h and analyzed GlyT2 expression in Western blots, there was a significant reduction in GlyT2 expression (remaining only 6.74 ± 4.54% SEM of the initial amount), whereas tubulin and α3NKA were unaffected (Fig. 9G,H). These data confirmed our earlier in vitro results indicating the importance of GlyT2 regulation by NKA in vivo and suggesting that this mechanism is conserved among different vertebrates.
Figure 9.
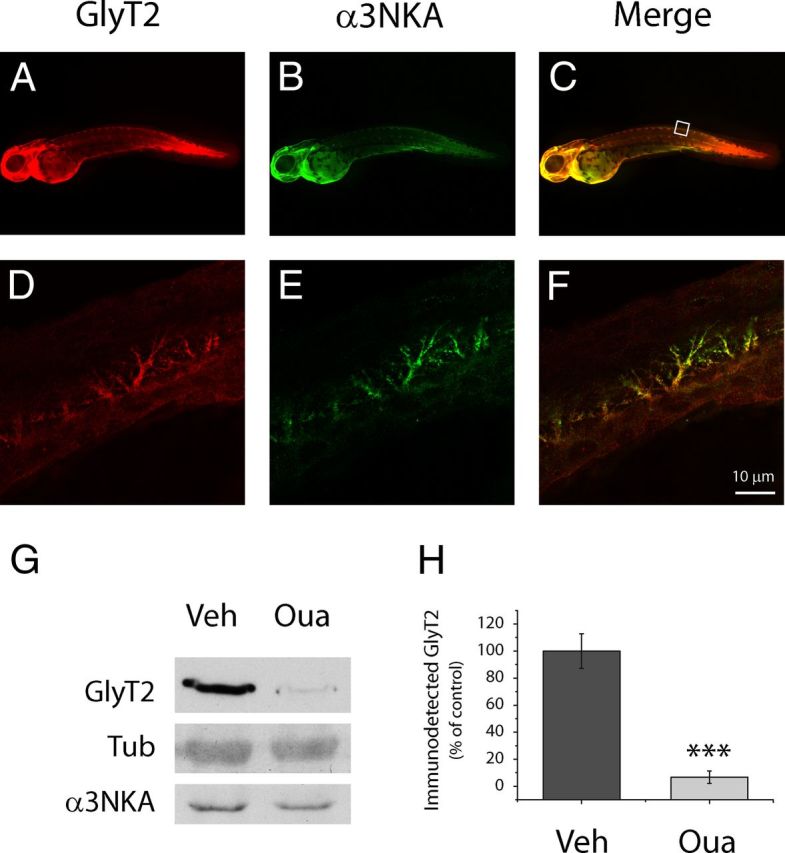
GlyT2-α3NKA colocalization and ouabain-mediated degradation of GlyT2 in zebrafish embryos. A–F, Dechorionated zebrafish embryos (48 hpf) were fixed in 4% PFA, permeabilized, immunostained for GlyT2 (green) and α3NKA (red), and visualized by confocal microscopy. A–C, Whole-mount images of zebrafish embryos. D–F, Examples showing colocalization of α3NKA and GlyT2 in dorsal interneurons. Scale bar, 10 μm. G, Seven dechorionated zebrafish embryos (48 hpf) per condition were maintained in E3 medium in the presence or absence of 100 μm ouabain for 6 h. Subsequently, all the embryos for each condition were lysed together, and GlyT2 expression was measured. Tubulin and α3NKA are shown as loading controls. There is significant reduction in GlyT2 expression but no changes in tubulin or α3NKA. H, The histogram represents the mean ± SEM of five experiments performed as in G. ***p < 0001, significantly different (Student's t test).
To study the ouabain-mediated degradation of GlyT2 in mammals in vivo, we injected ouabain intramedullary into adult rats (Fig. 10). As GlyT2 is expressed along the spinal cord, we administered ouabain to the mid region at T8. Three hours after ouabain administration, the anesthetized animals were killed and different sections of the spinal cord (C4, T8, and T12) were extracted, lysed, and analyzed in Western blots (Fig. 10A,B). Although injection of the vehicle alone produced no effect on GlyT2 expression, ouabain reduced the levels of GlyT2 locally at the site of injection (T8) but not in the other spinal cord regions examined (C4, T12). Together, these results indicate that GlyT2 is degraded in vivo in the presence of ouabain in zebrafish embryos and adult rats, suggesting an evolutionarily conserved mechanism to downregulate GlyT2 through its interacting partner Na+/K+-ATPase, which consequently modulates the inhibitory glycinergic neurotransmission.
Figure 10.

Intramedullar administration of ouabain to adult rats provokes the degradation of GlyT2 in vivo. A–C, After anesthetizing adult rats, 2 μl of the vehicle or 2 μl of 1 mm ouabain was injected intramedullary into each animal at the level of T8 of the spinal cord. Three hours later the animals were killed, and different sections of the spinal cord were extracted, lysed, and analyzed by Western blot. The sections studied were from C4, T8, and T12. B, The histogram represents the mean ± SEM (n = 4). *p < 0.05, significantly different (ANOVA with Tukey's post hoc test). There is reduced GlyT2 expression after ouabain administration in vivo that does not occur in other proteins, such as β-III tubulin, syntaxin 1A (STX1A), or CRMP5 (C). The scheme shows the different spinal cord sections extracted after ouabain administration in vivo. Red represents the site of ouabain injection.
Discussion
In the present study, we used high-throughput mass spectrometry to identify proteins that interact with GlyT2 in CNS preparations to unravel new mechanisms that might modulate GlyT2 function. In this way, we identified NKA as a new protein partner of GlyT2. This novel interaction regulates the endocytosis and total expression of GlyT2 in neurons. Our reciprocal coimmunoprecipitation and immunocytochemical studies further confirmed proteomic data and indicated that GlyT2 associates and colocalizes with NKA in neurons and synaptosomes. Given that functional NKA is composed by tightly bound α and β subunits, our immunoprecipitation results would lead to speculation that GlyT2 predominantly interacts with α3:β2-NKA functional pumps. However, the methodology used in this study does not identify which subunit of the NKA is responsible for the interaction. Thus, further studies would be needed to conclusively determine the NKA subunit to which GlyT2 interacts (α3 or β2 or both). NKA α3 subunit is specifically expressed in neurons (Dobretsov and Stimers, 2005), and it is mainly located presynaptically and postsynaptically (Hilgenberg et al., 2006; Kim et al., 2007). This subunit plays a crucial role in regulating membrane potential, and it mediates the rapid recovery of high intracellular Na+ concentrations after intense synaptic activity (Kim et al., 2007; Azarias et al., 2013). Thus, the large number of severe neurological disorders associated with human α3 mutations is not surprising. α3NKA alterations can be the cause of rapid-onset dystonic parkinsonism (de Carvalho Aguiar et al., 2004; Brashear et al., 2007), cognitive defects (Lingrel et al., 2007; Moseley et al., 2007), mood disorders (Kirshenbaum et al., 2011a, b), and alternating hemiplegia of childhood (Heinzen et al., 2012).
One important finding of this work is that the GlyT2-NKA interaction is restricted to lipid raft membrane subdomains, as demonstrated by coimmunoprecipitation from raft fractions and the triple colocalization between GlyT2, α3NKA, and the neuronal raft marker Thy-1. These results were further confirmed by proteomic analysis where spectral counts corresponding to the α1, α2, α3, β1, and β2 subunits of NKA were predominantly observed in GlyT2 immunoprecipitates from raft fractions. This GlyT2-NKA membrane compartmentalization favors their interaction by increasing the likelihood of contact and may have functional implications in maintaining local synaptic sodium homeostasis. Thus, by providing the energy required for glycine transport, the presence of NKA in rafts is essential for the efficient functioning of GlyT2. Furthermore, the interaction with the active population of GlyT2 in rafts allows NKA to restore the accumulation of intracellular Na+ after the transporter activity in the presynaptic terminal. GlyT2 cotransports 3 Na+ for each glycine recovered from the synaptic cleft (López-Corcuera et al., 1998; Roux and Supplisson, 2000), and it is the only transporter of the SLC6 family that needs more than two Na+ ions for transport coupling. During activity in the nerve terminal, neurotransmitter exocytosis produces a rapid and transient increase in the amount of GlyT2 in the plasma membrane, which favors the rapid reuptake and recycling of glycine into the terminal (Geerlings et al., 2001). In this situation, a rapid local increase in intracellular [Na+] occurs because of GlyT2 activity. The neuronal specific α3NKA subunit has a crucial role in the control of the membrane potential and the fast recovery of high intracellular Na+ concentrations after intense synaptic activity (Kim et al., 2007; Azarias et al., 2013), so it is tempting to speculate that NKA complexes containing the neuronal specific subunit α3 will rapidly restore the rapid local increase in intracellular [Na+] produced during GlyT2 activity in the presynaptic terminal.
In this regard, our 86Rb-flux and glycine transport experiments in the presence of ouabain show a tight correlation in the inhibition of NKA and GlyT2 activities that is indicative of the strict functional dependence of GlyT2 on the sodium electrochemical gradient generated by the ion pump. Because GlyT2 cotransports 3Na+/Cl−/glycine and the stoichiometry of the NKA catalytic cycle is 3Na+/2K+/ATP, a functional relationship and physical association between the two proteins may represent a suitable molecular device for the inhibitory glycinergic synapse. Low concentrations of ouabain (1 μm), which did not significantly affect the global Na+ gradient, induced GlyT2 endocytosis, which could be detected in neurons 1 h after ouabain treatment. When the overall sodium gradient in the neuron was severely compromised by high concentrations of ouabain (50 μm), significant time-dependent lysosomal degradation of the transporter was observed in addition to GlyT2 endocytosis. Thus, when α3NKA is inhibited by 1 μm ouabain GlyT2 is removed from the cell surface to prevent further local depolarization and dissipation of the Na+ gradient in the presynaptic membrane. Moreover, higher ouabain levels produce a more drastic effect by irreversibly degrading GlyT2 and preventing its recycle back to the membrane. Accordingly, our data suggest that NKA regulates GlyT2 recycling and turnover in the glycinergic synapse by a feedback mechanism used to maintain the membrane potential and intracellular sodium homeostasis. Given that the exclusively neuronal α3NKA seems to be the main αNKA interacting partner of GlyT2 and considering the important role that this subunit plays in controlling high intracellular sodium concentration during synaptic activity (Kim et al., 2007; Azarias et al., 2013), our results suggest that α3NKA could be the main mediator of GlyT2 downregulation by ouabain treatments. A regulatory mechanism similar to that described here for GlyT2 was identified for the GluR1 subunit of the AMPA receptor in hippocampal neurons. Through the interaction of α1NKA with GluR1, the surface and total expression of GluR1 decrease in response to high concentrations of ouabain (Zhang et al., 2009). Furthermore, the glutamate transporters GLAST and GLT-1 are physically associated with α2/α3NKA within a single macromolecular complex in the plasma membrane through which the NKA regulates the transporter function and hence the glutamatergic neurotransmission (Rose et al., 2009). Together, these data suggest that the mechanism described here and elsewhere could represent a more general process underlying synaptic plasticity whereby NKA controls neuronal proteins whose activity in the synaptic membrane contributes to increasing intracellular Na+ in neurons.
The physiologically relevant role of lipid rafts in regulating GlyT2 through its interaction with NKA is even more evident when we observe that ouabain-mediated degradation of GlyT2 mainly affects the active raft-associated population of this transporter. The fact that both endocytosis and degradation of GlyT2 are slow responses to ouabain is not consistent with the rapid depletion of the Na+ gradient observed (after a 20 min exposure to ouabain), implying that the mechanism underlying NKA-mediated downregulation of GlyT2 does not depend directly on changes in the ion gradient in the neuronal membrane but rather involves a process that takes longer to activate. In this regard, it is noteworthy that the two roles of NKA as an ion pump and a CTS receptor coupled to signaling pathways are not mutually exclusive because they can work in concert to control cellular function (Li and Xie, 2009), as confirmed by the GlyT2 downregulation seen in this study. However, further studies will be required to identify this molecular mechanism, which probably involves signaling pathways downstream of NKA.
It has been well established that the neuronal transporter GlyT2 recycles the neurotransmitter to the presynaptic terminal, being the main supplier of glycine for constitutive vesicle refilling. This process is absolutely necessary to preserve the quantal glycine content inside synaptic vesicles, and it is critical for regulating inhibitory synaptic strength (Gomeza et al., 2003b; Rousseau et al., 2008; Apostolides and Trussell, 2013). Therefore, because GlyT2 activity regulates inhibitory synaptic strength, the new modulatory mechanism described here acquires great relevance.
Gene deletion studies suggest that GlyT2 alterations may underlie several neuromuscular disorders, such as hyperekplexia, myoclonus, and epilepsy (Gomeza et al., 2003b; Aragón and López-Corcuera, 2005). Indeed, mutations in the gene encoding GlyT2 are the major presynaptic cause of hyperekplexia in humans (Eulenburg et al., 2006; Rees et al., 2006; Carta et al., 2012; Gimenez et al., 2012) and produce CMD2 in Belgian Blue cattle (Gill et al., 2012). Moreover, neurological disorders associated with human α3 mutations, such as rapid-onset dystonia parkinsonism (de Carvalho Aguiar et al., 2004; Brashear et al., 2007), alternating hemiplegia of childhood (Heinzen et al., 2012), and a mouse (Myk/+) model for epilepsy caused by a mutation of the NKA α3 isoform (Clapcote et al., 2009), present alterations in motor control, such as epilepsy, dystonia, and others. Considering that both GlyT2 and α3 isoforms are exclusively neuronal proteins, it is tempting to speculate that pathological mutations of α3 isoform negatively affect GlyT2 activity, leading to a glycinergic neurotransmission depletion that could contribute to the observed phenotype.
Finally, we have demonstrated that ouabain-induced GlyT2 downregulation by degradation also occurs in vivo in zebrafish embryos and adult rats, indicating that this GlyT2 regulatory mechanism involving NKA is evolutionarily conserved. Remarkably, this work started with an in vitro proteomic analysis revealing potential interacting candidates for GlyT2, and it concluded revealing a new in vivo evolutionarily conserved mechanism that regulates this relevant presynaptic transporter by the action of an endogenously produced hormone. Thus, slight increases in the amount of ouabain at glycinergic synapses could cause a decrease of GlyT2 at the cell surface, and high ouabain levels may induce a more drastic GlyT2 downregulation by additional degradation of the transporter. Both effects would lead to a reduction in the glycine refilling of synaptic vesicles further decreasing the inhibitory glycinergic neurotransmission.
Notes
Supplemental material for this article is available at http://www.cbm.uam.es/doc/ProteomicDataJS/. Proteomic data are from Figures 1 and 5. This material has not been peer reviewed.
Footnotes
This work was supported by Spanish Dirección General de Investigación Científica y Técnica Grants SAF2008-05436 and SAF2011-28674, Fondo de Investigaciones Sanitarias (Centro de Investigación Biomédica en Red de Enfermedades Raras), and Fundación Ramón Areces. We thank Dr. Fernando Martín-Belmonte (Centro de Biología Molecular Severo Ochoa [CBMSO]) for generously providing the zebrafish embryos and related experimental reagents; Raquel Mesa for proteomic technical assistance; Angeles Sánchez from Biological Security Service of CBMSO for the valuable and expert assistance in the 86Rb experiments; Dr. Jose Antonio Esteban (CBMSO) for helpful discussions, comments on the manuscript, and valuable suggestions; and Dr. Jerry B. Lingrel (University of Cincinnati) for the generous donation of expression vectors for rat α1, α2, and α3 Na+/K+-ATPase.
The authors declare no competing financial interests.
References
- Apostolides PF, Trussell LO. Rapid, activity-independent turnover of vesicular transmitter content at a mixed glycine/GABA synapse. J Neurosci. 2013;33:4768–4781. doi: 10.1523/JNEUROSCI.5555-12.2013. [DOI] [PMC free article] [PubMed] [Google Scholar]
- Aragón C, López-Corcuera B. Glycine transporters: crucial roles of pharmacological interest revealed by gene deletion. Trends Pharmacol Sci. 2005;26:283–286. doi: 10.1016/j.tips.2005.04.007. [DOI] [PubMed] [Google Scholar]
- Azarias G, Kruusmägi M, Connor S, Akkuratov EE, Liu XL, Lyons D, Brismar H, Broberger C, Aperia A. A specific and essential role for NKA α3 in neurons co-expressing α1 and α3. J Biol Chem. 2013;288:2734–2743. doi: 10.1074/jbc.M112.425785. [DOI] [PMC free article] [PubMed] [Google Scholar]
- Bagrov AY, Shapiro JI, Fedorova OV. Endogenous cardiotonic steroids: physiology, pharmacology, and novel therapeutic targets. Pharmacol Rev. 2009;61:9–38. doi: 10.1124/pr.108.000711. [DOI] [PMC free article] [PubMed] [Google Scholar]
- Barreiro-Iglesias A, Mysiak KS, Adrio F, Rodicio MC, Becker CG, Becker T, Anadón R. Distribution of glycinergic neurons in the brain of glycine transporter-2 transgenic Tg(glyt2:gfp) adult zebrafish: relationship to brain–spinal descending systems. J Comp Neurol. 2013;521:389–425. doi: 10.1002/cne.23179. [DOI] [PubMed] [Google Scholar]
- Benarroch EE. Na+,K+−ATPase: functions in the nervous system and involvement in neurologic disease. Neurology. 2011;76:287–293. doi: 10.1212/WNL.0b013e3182074c2f. [DOI] [PubMed] [Google Scholar]
- Blakely RD, Bauman AL. Biogenic amine transporters: regulation in flux. Curr Opin Neurobiol. 2010;10:328–336. doi: 10.1016/S0959-4388(00)00088-X. [DOI] [PubMed] [Google Scholar]
- Bolte S, Cordelières FP. A guided tour into subcellular colocalization analysis in light microscopy. J Microsc. 2006;224:213–232. doi: 10.1111/j.1365-2818.2006.01706.x. [DOI] [PubMed] [Google Scholar]
- Bonzon-Kulichenko E, Pérez-Hernández D, Núñez E, Martínez-Acedo P, Navarro P, Trevisan-Herraz M, Ramos Mdel C, Sierra S, Martínez-Martínez S, Ruiz-Meana M, Miró-Casas E, García-Dorado D, Redondo JM, Burgos JS, Vázquez J. A robust method for quantitative high-throughput analysis of proteomes by 18O labeling. Mol Cell Proteomics. 2011;10:M110.003335. doi: 10.1074/mcp.M110.003335. [DOI] [PMC free article] [PubMed] [Google Scholar]
- Brashear A, Dobyns WB, de Carvalho Aguiar P, Borg M, Frijns CJ, Gollamudi S, Green A, Guimaraes J, Haake BC, Klein C, Linazasoro G, Münchau A, Raymond D, Riley D, Saunders-Pullman R, Tijssen MA, Webb D, Zaremba J, Bressman SB, Ozelius LJ. The phenotypic spectrum of rapid-onset dystonia-parkinsonism (RDP) and mutations in the ATP1A3 gene. Brain. 2007;130:828–835. doi: 10.1093/brain/awl340. [DOI] [PubMed] [Google Scholar]
- Carta E, Chung SK, James VM, Robinson A, Gill JL, Remy N, Vanbellinghen JF, Drew CJ, Cagdas S, Cameron D, Cowan FM, Del Toro M, Graham GE, Manzur AY, Masri A, Rivera S, Scalais E, Shiang R, Sinclair K, Stuart CA, et al. Mutations in the GlyT2 gene (SLC6A5) are a second major cause of startle disease. J Biol Chem. 2012;287:28975–28985. doi: 10.1074/jbc.M112.372094. [DOI] [PMC free article] [PubMed] [Google Scholar]
- Cheng RK, Jesuthasan S, Penney TB. Time for zebrafish. Front Integr Neurosci. 2011;5:40. doi: 10.3389/fnint.2011.00040. [DOI] [PMC free article] [PubMed] [Google Scholar]
- Clapcote SJ, Duffy S, Xie G, Kirshenbaum G, Bechard AR, Rodacker Schack V, Petersen J, Sinai L, Saab BJ, Lerch JP, Minassian BA, Ackerley CA, Sled JG, Cortez MA, Henderson JT, Vilsen B, Roder JC. Mutation I810N in the α3 isoform of Na+,K+-ATPase causes impairments in the sodium pump and hyperexcitability in the CNS. Proc Natl Acad Sci U S A. 2009;106:14085–14090. doi: 10.1073/pnas.0904817106. [DOI] [PMC free article] [PubMed] [Google Scholar]
- Cox J, Mann M. MaxQuant enables high peptide identification rates, individualized p.p.b.-range mass accuracies and proteome-wide protein quantification. Nat Biotechnol. 2008;26:1367–1372. doi: 10.1038/nbt.1511. [DOI] [PubMed] [Google Scholar]
- Cox J, Matic I, Hilger M, Nagaraj N, Selbach M, Olsen JV, Mann M. A practical guide to the MaxQuant computational platform for SILAC-based quantitative proteomics. Nat Protoc. 2009;4:698–705. doi: 10.1038/nprot.2009.36. [DOI] [PubMed] [Google Scholar]
- Cui WW, Low SE, Hirata H, Saint-Amant L, Geisler R, Hume RI, Kuwada JY. The zebrafish shocked gene encodes a glycine transporter and is essential for the function of early neural circuits in the CNS. J Neurosci. 2005;25:6610–6620. doi: 10.1523/JNEUROSCI.5009-04.2005. [DOI] [PMC free article] [PubMed] [Google Scholar]
- de Carvalho Aguiar P, Sweadner KJ, Penniston JT, Zaremba J, Liu L, Caton M, Linazasoro G, Borg M, Tijssen MA, Bressman SB, Dobyns WB, Brashear A, Ozelius LJ. Mutations in the Na+/K+-ATPase α3 gene ATP1A3 are associated with rapid-onset dystonia parkinsonism. Neuron. 2004;43:169–175. doi: 10.1016/j.neuron.2004.06.028. [DOI] [PubMed] [Google Scholar]
- de Juan-Sanz J, Zafra F, López-Corcuera B, Aragón C. Endocytosis of the neuronal glycine transporter GlyT2: role of membrane rafts and protein kinase C-dependent ubiquitination. Traffic. 2011;12:1850–1867. doi: 10.1111/j.1600-0854.2011.01278.x. [DOI] [PubMed] [Google Scholar]
- de Juan-Sanz J, Núñez E, López-Corcuera B, Aragón C. Constitutive endocytosis and turnover of the neuronal glycine transporter GlyT2 is dependent on ubiquitination of a C-terminal lysine cluster. PLoS One. 2013;8:e58863. doi: 10.1371/journal.pone.0058863. [DOI] [PMC free article] [PubMed] [Google Scholar]
- Dobretsov M, Stimers JR. Neuronal function and α3 isoform of the Na/K-ATPase. Front Biosci. 2005;10:2373–2396. doi: 10.2741/1704. [DOI] [PubMed] [Google Scholar]
- Doðanli C, Kjaer-Sorensen K, Knoeckel C, Beck HC, Nyengaard JR, Honoré B, Nissen P, Ribera A, Oxvig C, Lykke-Hartmann K. The α2Na+/K+-ATPase is critical for skeletal and heart muscle function in zebrafish. J Cell Sci. 2012;125:6166–6175. doi: 10.1242/jcs.115808. [DOI] [PubMed] [Google Scholar]
- Doðanli C, Beck HC, Ribera AB, Oxvig C, Lykke-Hartmann K. α3Na+/K+-ATPase deficiency causes brain ventricle dilation and abrupt embryonic motility in zebrafish. J Biol Chem. 2013;288:8862–8874. doi: 10.1074/jbc.M112.421529. [DOI] [PMC free article] [PubMed] [Google Scholar]
- el-Masri MA, Clark BJ, Qazzaz HM, Valdes R., Jr Human adrenal cells in culture produce both ouabain-like and dihydroouabain-like factors. Clin Chem. 2002;48:1720–1730. [PubMed] [Google Scholar]
- Eulenburg V, Becker K, Gomeza J, Schmitt B, Becker CM, Betz H. Mutations within the human GLYT2 (SLC6A5) gene associated with hyperekplexia. Biochem Biophys Res Commun. 2006;348:400–405. doi: 10.1016/j.bbrc.2006.07.080. [DOI] [PubMed] [Google Scholar]
- Fornés A, Núñez E, Alonso-Torres P, Aragón C, López-Corcuera B. Trafficking properties and activity regulation of the neuronal glycine transporter GlyT2 by protein kinase C. Biochem J. 2008;412:495–506. doi: 10.1042/BJ20071018. [DOI] [PubMed] [Google Scholar]
- Fujii T, Takahashi Y, Itomi Y, Fujita K, Morii M, Tabuchi Y, Asano S, Tsukada K, Takeguchi N, Sakai H. K+-Cl− cotransporter-3a up-regulates NKA in lipid rafts of gastric luminal parietal cells. J Biol Chem. 2008;283:6869–6877. doi: 10.1074/jbc.M708429200. [DOI] [PubMed] [Google Scholar]
- Geerlings A, Núñez E, López-Corcuera B, Aragón C. Calcium- and syntaxin 1-mediated trafficking of the neuronal glycine transporter GlyT2. J Biol Chem. 2001;276:17584–17590. doi: 10.1074/jbc.M010602200. [DOI] [PubMed] [Google Scholar]
- Gill JL, James VM, Carta E, Harris D, Topf M, Scholes SF, Hateley G, Harvey RJ. Identification of congenital muscular dystonia 2 associated with an inherited GlyT2 defect in Belgian Blue cattle from the United Kingdom. Anim Genet. 2012;43:267–270. doi: 10.1111/j.1365-2052.2011.02255.x. [DOI] [PubMed] [Google Scholar]
- Gimenez C, Pérez-Siles G, Martínez-Villarreal J, Arribas-González E, Jiménez E, Núñez E, de Juan-Sanz J, Fernández-Sánchez E, García-Tardón N, Ibáñez I, Romanelli V, Nevado J, James VM, Topf M, Chung SK, Thomas RH, Desviat LR, Aragón C, Zafra F, Rees MI, et al. A novel dominant hyperekplexia mutation Y705C alters trafficking and biochemical properties of the presynaptic glycine transporter GlyT2. J Biol Chem. 2012;287:28986–29002. doi: 10.1074/jbc.M111.319244. [DOI] [PMC free article] [PubMed] [Google Scholar]
- Gomeza J, Hülsmann S, Ohno K, Eulenburg V, Szöke K, Richter D, Betz H. Inactivation of the glycine transporter 1 gene discloses vital role of glial glycine uptake in glycinergic inhibition. Neuron. 2003a;40:785–796. doi: 10.1016/S0896-6273(03)00672-X. [DOI] [PubMed] [Google Scholar]
- Gomeza J, Ohno K, Hülsmann S, Armsen W, Eulenburg V, Richter DW, Laube B, Betz H. Deletion of the mouse glycine transporter 2 results in a hyperekplexia phenotype and postnatal lethality. Neuron. 2003b;40:797–806. doi: 10.1016/S0896-6273(03)00673-1. [DOI] [PubMed] [Google Scholar]
- Hamlyn JM, Blaustein MP, Bova S, DuCharme DW, Harris DW, Mandel F, Mathews WR, Ludens JH. Identification and characterization of a ouabain-like compound from human plasma. Proc Natl Acad Sci U S A. 1991;88:6259–6263. doi: 10.1073/pnas.88.14.6259. [DOI] [PMC free article] [PubMed] [Google Scholar]
- Hazelwood LA, Free RB, Cabrera DM, Skinbjerg M, Sibley DR. Reciprocal modulation of function between the D1 and D2 dopamine receptors and the NKA. J Biol Chem. 2008;283:36441–36453. doi: 10.1074/jbc.M805520200. [DOI] [PMC free article] [PubMed] [Google Scholar]
- Heinzen EL, Swoboda KJ, Hitomi Y, Gurrieri F, Nicole S, de Vries B, Tiziano FD, Fontaine B, Walley NM, Heavin S, Panagiotakaki E, Panagiotakaki E, Panagiotakaki E, Panagiotakaki E, Fiori S, Abiusi E, Di Pietro L, Sweney MT, Newcomb TM, Viollet L, et al. De novo mutations in ATP1A3 cause alternating hemiplegia of childhood. Nat Genet. 2012;44:1030–1034. doi: 10.1038/ng.2358. [DOI] [PMC free article] [PubMed] [Google Scholar]
- Higashijima S, Mandel G, Fetcho JR. Distribution of prospective glutamatergic, glycinergic, and GABAergic neurons in embryonic and larval zebrafish. J Comp Neurol. 2004a;480:1–18. doi: 10.1002/cne.20278. [DOI] [PubMed] [Google Scholar]
- Higashijima S, Schaefer M, Fetcho JR. Neurotransmitter properties of spinal interneurons in embryonic and larval zebrafish. J Comp Neurol. 2004b;480:19–37. doi: 10.1002/cne.20279. [DOI] [PubMed] [Google Scholar]
- Hilgenberg LG, Su H, Gu H, O'Dowd DK, Smith MA. Alpha3Na+/K+-ATPase is a neuronal receptor for agrin. Cell. 2006;125:359–369. doi: 10.1016/j.cell.2006.01.052. [DOI] [PubMed] [Google Scholar]
- Horiuchi M, Loebrich S, Brandstaetter JH, Kneussel M, Betz H. Cellular localization and subcellular distribution of Unc-33-like protein 6, a brain-specific protein of the collapsin response mediator protein family that interacts with the neuronal glycine transporter 2. J Neurochem. 2005;94:307–315. doi: 10.1111/j.1471-4159.2005.03198.x. [DOI] [PubMed] [Google Scholar]
- Jaskolski F, Mulle C, Manzoni OJ. An automated method to quantify and visualize colocalized fluorescent signals. J Neurosci Methods. 2005;146:42–49. doi: 10.1016/j.jneumeth.2005.01.012. [DOI] [PubMed] [Google Scholar]
- Jiménez E, Zafra F, Pérez-Sen R, Delicado EG, Miras-Portugal MT, Aragón C, López-Corcuera B. P2Y purinergic regulation of the glycine neurotransmitter transporters. J Biol Chem. 2011;286:10712–10724. doi: 10.1074/jbc.M110.167056. [DOI] [PMC free article] [PubMed] [Google Scholar]
- Juhaszova M, Blaustein MP. Na+ pump low and high ouabain affinity a subunit isoforms are differently distributed in cells. Proc Natl Acad Sci U S A. 1997;94:1800–1805. doi: 10.1073/pnas.94.5.1800. [DOI] [PMC free article] [PubMed] [Google Scholar]
- Kim JH, Sizov I, Dobretsov M, von Gersdorff H. Presynaptic Ca2+ buffers control the strength of a fast post-tetanic hyperpolarization mediated by the α3 Na(+)/K(+)-ATPase. Nat Neurosci. 2007;10:196–205. doi: 10.1038/nn1839. [DOI] [PubMed] [Google Scholar]
- Kirshenbaum GS, Clapcote SJ, Duffy S, Burgess CR, Petersen J, Jarowek KJ, Yücel YH, Cortez MA, Snead OC, 3rd, Vilsen B, Peever JH, Ralph MR, Roder JC. Mania-like behavior induced by genetic dysfunction of the neuron-specific Na+,K+−ATPase alpha3 sodium pump. Proc Natl Acad Sci U S A. 2011a;108:18144–18149. doi: 10.1073/pnas.1108416108. [DOI] [PMC free article] [PubMed] [Google Scholar]
- Kirshenbaum GS, Saltzman K, Rose B, Petersen J, Vilsen B, Roder JC. Decreased neuronal Na+,K+-ATPase activity in Atp1a3 heterozygous mice increases susceptibility to depression-like endophenotypes by chronic variable stress. Genes Brain Behav. 2011b;10:542–550. doi: 10.1111/j.1601-183X.2011.00691.x. [DOI] [PubMed] [Google Scholar]
- Levin ED, Cerutti DT. Methods of behavior analysis in neuroscience. Ed 2. Boca Raton, FL: CRC; 2009. Behavioral neuroscience of zebrafish; pp. 293–310. [Google Scholar]
- Li Z, Xie Z. The Na/K-ATPase/Src complex and cardiotonic steroid-activated protein kinase cascades. Pflugers Arch. 2009;457:635–644. doi: 10.1007/s00424-008-0470-0. [DOI] [PubMed] [Google Scholar]
- Lingrel JB. The physiological significance of the cardiotonic steroid/ouabain-binding site of the NKA. Annu Rev Physiol. 2010;72:395–412. doi: 10.1146/annurev-physiol-021909-135725. [DOI] [PMC free article] [PubMed] [Google Scholar]
- Lingrel JB, Williams MT, Vorhees CV, Moseley AE. NKA and the role of α isoforms in behavior. J Bioenerg Biomembr. 2007;39:385–389. doi: 10.1007/s10863-007-9107-9. [DOI] [PubMed] [Google Scholar]
- Liu J, Xie ZJ. The sodium pump and cardiotonic steroids-induced signal transduction protein kinases and calcium-signaling microdomain in regulation of transporter trafficking. Biochim Biophys Acta. 2010;1802:1237–1245. doi: 10.1016/j.bbadis.2010.01.013. [DOI] [PMC free article] [PubMed] [Google Scholar]
- Liu L, Ivanov AV, Gable ME, Jolivel F, Morrill GA, Askari A. Comparative properties of caveolar and noncaveolar preparations of kidney Na+/K+-ATPase. Biochemistry. 2011;50:8664–8673. doi: 10.1021/bi2009008. [DOI] [PMC free article] [PubMed] [Google Scholar]
- Longva K, Blystad F, Stang E, Larsen A, Johannessen L, Madshus I. Ubiquitination and proteasomal activity is required for transport of the EGF receptor to inner membranes of multivesicular bodies. J Biol Sci. 2002;156:843–854. doi: 10.1083/jcb.200106056. [DOI] [PMC free article] [PubMed] [Google Scholar]
- López-Corcuera B, Martínez-Maza R, Núñez E, Roux M, Supplisson S, Aragón C. Differential properties of two stably expressed brain-specific glycine transporters. J Neurochem. 1998;71:2211–2219. doi: 10.1046/j.1471-4159.1998.71052211.x. [DOI] [PubMed] [Google Scholar]
- Ludens JH, Clark MA, DuCharme DW, Harris DW, Lutzke BS, Mandel F, Mathews WR, Sutter DM, Hamlyn JM. Purification of an endogenous digitalis-like factor from human plasma for structural analysis. Hypertension. 1991;17:923–929. doi: 10.1161/01.HYP.17.6.923. [DOI] [PubMed] [Google Scholar]
- Madore N, Smith KL, Graham CH, Jen A, Brady K, Hall S, Morris R. Functionally different GPI proteins are organized in different domains on the neuronal surface. EMBO J. 1999;18:6917–6926. doi: 10.1093/emboj/18.24.6917. [DOI] [PMC free article] [PubMed] [Google Scholar]
- McGrail KM, Phillips JM, Sweadner KJ. Immunofluorescent localization of three Na,K-ATPase isozymes in the rat central nervous system: both neurons and glia can express more than one Na,K-ATPase. J Neurosci. 1991;11:381–391. doi: 10.1523/JNEUROSCI.11-02-00381.1991. [DOI] [PMC free article] [PubMed] [Google Scholar]
- Melikova MS, Kondratov KA, Kornilova ES. Two different stages of epidermal growth factor (EGF) receptor endocytosis are sensitive to free ubiquitin depletion produced by proteasome inhibitor MG132. Cell Biol Int. 2006;30:31–43. doi: 10.1016/j.cellbi.2005.09.003. [DOI] [PubMed] [Google Scholar]
- Moly PK, Hatta K. Early glycinergic axon contact with the Mauthner neuron during zebrafish development. Neurosci Res. 2011;70:251–259. doi: 10.1016/j.neures.2011.03.003. [DOI] [PubMed] [Google Scholar]
- Moseley AE, Lieske SP, Wetzel RK, James PF, He S, Shelly DA, Paul RJ, Boivin GP, Witte DP, Ramirez JM, Sweadner KJ, Lingrel JB. The Na,K-ATPase α2 isoform is expressed in neurons, and its absence disrupts neuronal activity in newborn mice. J Biol Chem. 2003;278:5317–5324. doi: 10.1074/jbc.M211315200. [DOI] [PubMed] [Google Scholar]
- Moseley AE, Williams MT, Schaefer TL, Bohanan CS, Neumann JC, Behbehani MM, Vorhees CV, Lingrel JB. Deficiency in NKA α isoform genes alters spatial learning, motor activity, and anxiety in mice. J Neurosci. 2007;27:616–626. doi: 10.1523/JNEUROSCI.4464-06.2007. [DOI] [PMC free article] [PubMed] [Google Scholar]
- Núñez E, Alonso-Torres P, Fornés A, Aragón C, López-Corcuera B. The neuronal glycine transporter GLYT2 associates with membrane rafts: functional modulation by lipid environment. J Neurochem. 2008;105:2080–2090. doi: 10.1111/j.1471-4159.2008.05292.x. [DOI] [PubMed] [Google Scholar]
- Núñez E, Pérez-Siles G, Rodenstein L, Alonso-Torres P, Zafra F, Jiménez E, Aragón C, López-Corcuera B. Subcellular localization of the neuronal glycine transporter GlyT2 in brainstem. Traffic. 2009;10:829–843. doi: 10.1111/j.1600-0854.2009.00911.x. [DOI] [PubMed] [Google Scholar]
- Patnaik A, Chau V, Wills JW. Ubiquitin is part of the retrovirus budding machinery. Proc Natl Acad Sci U S A. 2000;97:13069–13074. doi: 10.1073/pnas.97.24.13069. [DOI] [PMC free article] [PubMed] [Google Scholar]
- Pérez-Hernández D, Gutiérrez-Vázquez C, Jorge I, López-Martín S, Ursa A, Sánchez-Madrid F, Vázquez J, Yáñez-Mó M. The intracellular interactome of tetraspanin-enriched microdomains reveals their function as sorting machineries toward exosomes. J Biol Chem. 2013;288:11649–11661. doi: 10.1074/jbc.M112.445304. [DOI] [PMC free article] [PubMed] [Google Scholar]
- Rees MI, Harvey K, Pearce BR, Chung SK, Duguid IC, Thomas P, Beatty S, Graham GE, Armstrong L, Shiang R, Abbott KJ, Zuberi SM, Stephenson JB, Owen MJ, Tijssen MA, van den Maagdenberg AM, Smart TG, Supplisson S, Harvey RJ. Mutations in the gene encoding GlyT2 (SLC6A5) define a presynaptic component of human startle disease. Nat Genet. 2006;38:801–806. doi: 10.1038/ng1814. [DOI] [PMC free article] [PubMed] [Google Scholar]
- Reinhard L, Tidow H, Clausen MJ, Nissen P. NKA as a docking station: protein–protein complexes of the NKA. Cell Mol Life Sci. 2013;70:205–222. doi: 10.1007/s00018-012-1039-9. [DOI] [PMC free article] [PubMed] [Google Scholar]
- Rose EM, Koo JC, Antflick JE, Ahmed SM, Angers S, Hampson DR. Glutamate transporter coupling to NKA. J Neurosci. 2009;29:8143–8155. doi: 10.1523/JNEUROSCI.1081-09.2009. [DOI] [PMC free article] [PubMed] [Google Scholar]
- Rousseau F, Aubrey KR, Supplisson S. The glycine transporter GlyT2 controls the dynamics of synaptic vesicle refilling in inhibitory spinal cord neurons. J Neurosci. 2008;28:9755–9768. doi: 10.1523/JNEUROSCI.0509-08.2008. [DOI] [PMC free article] [PubMed] [Google Scholar]
- Roux MJ, Supplisson S. Neuronal and glial glycine transporters have different stoichiometries. Neuron. 2000;25:373–383. doi: 10.1016/S0896-6273(00)80901-0. [DOI] [PubMed] [Google Scholar]
- Simons K, Gerl MJ. Revitalizing membrane rafts: new tools and insights. Nat Rev Mol Cell Biol. 2010;11:688–699. doi: 10.1038/nrm2977. [DOI] [PubMed] [Google Scholar]
- Sweadner KJ. Isozymes of the Na+/K+-ATPase. Biochim Biophys Acta. 1989;988:185–220. doi: 10.1016/0304-4157(89)90019-1. [DOI] [PubMed] [Google Scholar]
- Taguchi K, Kumanogoh H, Nakamura S, Maekawa S. Ouabain-induced isoform-specific localization change of the NKA subunit in the synaptic plasma membrane of rat brain. Neurosci Lett. 2007;413:42–45. doi: 10.1016/j.neulet.2006.11.061. [DOI] [PubMed] [Google Scholar]
- Tajima N, Itokazu Y, Korpi ER, Somerharju P, Käkelä R. Activity of BK(Ca) channel is modulated by membrane cholesterol content and association with Na+/K+-ATPase in human melanoma IGR39 cells. J Biol Chem. 2011;286:5624–5638. doi: 10.1074/jbc.M110.149898. [DOI] [PMC free article] [PubMed] [Google Scholar]
- Teixeira VL, Katz AI, Pedemonte CH, Bertorello AM. Isoform-specific regulation of Na+,K+-ATPase endocytosis and recruitment to the plasma membrane. Ann N Y Acad Sci. 2003;986:587–594. doi: 10.1111/j.1749-6632.2003.tb07257.x. [DOI] [PubMed] [Google Scholar]
- Tymiak AA, Norman JA, Bolgar M, DiDonato GC, Lee H, Parker WL, Lo LC, Berova N, Nakanishi K, Haber E. Physicochemical characterization of a ouabain isomer isolated from bovine hypothalamus. Proc Natl Acad Sci U S A. 1993;90:8189–8193. doi: 10.1073/pnas.90.17.8189. [DOI] [PMC free article] [PubMed] [Google Scholar]
- Welker P, Geist B, Frühauf JH, Salanova M, Groneberg DA, Krause E, Bachmann S. Role of lipid rafts in membrane delivery of renal epithelial NKA, thick ascending limb. Am J Physiol Regul Integr Comp Physiol. 2007;292:R1328–R1337. doi: 10.1152/ajpregu.00166.2006. [DOI] [PubMed] [Google Scholar]
- Xi Y, Noble S, Ekker M. Modeling neurodegeneration in zebrafish. Curr Neurol Neurosci Rep. 2011;11:274–282. doi: 10.1007/s11910-011-0182-2. [DOI] [PMC free article] [PubMed] [Google Scholar]
- Zafra F, Aragón C, Olivares L, Danbolt NC, Giménez C, Storm-Mathisen J. Glycine transporters are differentially expressed among CNS cells. J Neurosci. 1995;15:3952–3969. doi: 10.1523/JNEUROSCI.15-05-03952.1995. [DOI] [PMC free article] [PubMed] [Google Scholar]
- Zhang D, Hou Q, Wang M, Lin A, Jarzylo L, Navis A, Raissi A, Liu F, Man HY. NKA activity regulates AMPA receptor turnover through proteasome-mediated proteolysis. J Neurosci. 2009;29:4498–4511. doi: 10.1523/JNEUROSCI.6094-08.2009. [DOI] [PMC free article] [PubMed] [Google Scholar]
- Zinchuk V, Zinchuk O. Quantitative colocalization analysis of confocal fluorescence microscopy images. Curr Protoc Cell Biol. 2008 doi: 10.1002/0471143030.cb0419s52. Chapter 4:Unit 4.19. [DOI] [PubMed] [Google Scholar]