

Abstract
We addressed the role of nitric oxide (NO) in orexin neuron degeneration that has been observed under various pathological conditions. Administration of an NO donor NOC18 (50 nmol) into the third ventricle of mice resulted in a significant decrease of orexin-immunoreactive (-IR) neurons, in contrast to a modest change in melanin-concentrating hormone-IR neurons. In addition, NOC18 promoted formation of orexin-A-IR aggregates within orexin neurons. An endoplasmic reticulum stress inducer tunicamycin replicated the effect of NOC18 with regard to decrease of orexin-IR neurons and formation of aggregates. We also found that NOC18 caused an increase in S-nitrosation of protein disulfide isomerase (PDI) and a decrease in PDI activity in hypothalamic tissues. Moreover, PDI inhibitors, such as cystamine and securinine, caused a selective decrease of orexin neurons and promoted formation of orexin-A-IR aggregates. Aggregate formation in orexin-IR neurons was also induced by local injection of small interfering RNA targeting PDI. Interestingly, sleep deprivation for 7 consecutive days induced a selective decrease of orexin-IR neurons, which was preceded by aggregate formation in orexin-IR neurons and an increase in S-nitrosated PDI in the hypothalamus. Activity of neuronal NO synthase (nNOS)-positive neurons in the lateral hypothalamus as assessed by c-Fos expression was elevated in response to sleep deprivation. Finally, sleep deprivation-induced decrease of orexin-IR neurons, formation of aggregates, and S-nitrosation of PDI were not observed in nNOS knock-out mice. These results indicate that nNOS-derived NO may mediate specific pathological events in orexin neurons, including neuropeptide misfolding via S-nitrosation and inactivation of PDI.
Introduction
Orexins (also called as hypocretins) are neuropeptides produced by neurons localized in the lateral hypothalamic area (LHA). Two isoforms of orexins, orexin-A and orexin-B, are generated from a common precursor peptide prepro-orexin (Tsujino and Sakurai, 2010). Orexins regulate various physiological functions, including arousal, food intake, and reward system. For example, intracerebroventricular (i.c.v.) administration of orexin-A in rats enhances arousal (Hagan et al., 1999) and increases food intake (Hara et al., 2001). Intracerebroventricular administration of orexin-A also produces an antidepressant-like effect in stress-induced depression model in mice (Ito et al., 2008). On the contrary, mice lacking orexin (Chemelli et al., 1999) and mice with targeted ablation of orexin neurons (Hara et al., 2001) exhibit fragmentation of awake/nonrapid-eye-movement sleep episodes and reduced duration of wakefulness and hypophagia. In addition, orexin receptor knock-out mice show depression-like behaviors (Scott et al., 2011).
In patients with narcolepsy characterized by excessive daytime sleepiness, a selective decrease of orexin neurons (Thannickal et al., 2000) and a decreased CSF level of orexin-A (Nishino et al., 2000) have been demonstrated. Also, plasma level of orexin-A in patients with anorexia is lower than that in healthy control (Janas-Kozik et al., 2012). A decrease of CSF level of orexin-A has been reported in patients with major depressive disorder (Brundin et al., 2007). However, the mechanisms of the decrease of orexin remain largely unclear, except for potential involvement of autoimmune responses in subpopulations of narcolepsy patients (Kornum et al., 2011).
In this context, we focused on nitric oxide (NO). It is well known that moderate amounts of NO are involved in physiological processes in the brain, including synaptic plasticity and cell survival, whereas large amounts of NO cause neurodegeneration (Calabrese et al., 2007). Remarkably, NO production is increased under several conditions associated with decrease of orexin (Suzuki et al., 2001; Vannacci et al., 2006). In addition, many neuronal NO synthase (nNOS)-positive neurons are present around orexin neurons in LHA (Cutler et al., 2001; Yao et al., 2005).
A unique feature of orexin-A is that this neuropeptide possesses two intramolecular disulfide bonds located closely each other (Cys6-Cys12 and Cys7-Cys14). Therefore, orexin-A and/or pro-orexin might be prone to misfolding because of erroneous disulfide bond formation. Protein misfolding, often accompanied by increased endoplasmic reticulum (ER) stress, is recognized as a key mechanism of pathogenic events in various neurodegenerative disorders (Matus et al., 2011). Moreover, we have previously reported that orexin neurons in rat hypothalamic slice cultures are more vulnerable to ER stress than other neuropeptide-containing neurons (Michinaga et al., 2011). Importantly, protein disulfide isomerase (PDI), a critical enzyme for rearrangement of disulfide bond formation, undergoes NO-mediated S-nitrosation (Uehara et al., 2006). S-nitrosation of PDI results in inactivation of this enzyme, thereby accelerates protein misfolding, increases ER stress, and causes neurodegeneration (Gotoh and Mori, 2006; Uehara et al., 2006). Based on these lines of evidence, the present study aimed to reveal potential roles of NO and PDI in pathological events in hypothalamic orexin neurons.
Materials and Methods
Drugs.
1-Hydroxy-2-oxo-3,3-bis(2-aminoethyl)-1-triazene (NOC18) was obtained from Dojindo Laboratories. Tunicamycin was obtained from Sigma-Aldrich. Cystamine dihydrochloride was obtained from Tokyo Chemical Laboratory. Securinine was obtained from Santa Cruz Biotechnology. NOC18, cystamine dihydrochloride, and securinine were dissolved in water. Tunicamycin was dissolved in dimethyl sulfoxide. Tauroursodeoxycholic acid (TUDCA) was obtained from Merck Millipore and was dissolved in water at a final concentration of 4 mg/ml and mixed with NOC18 (the final concentration of NOC18 was 100 mm). An inert tracer copper(II) phthalocyanine (1%, Sigma-Aldrich) was included in the solutions to be injected, for verification of the site of injection.
Surgical procedures.
All procedures were approved by the animal experimentation committee of Kumamoto University, and animals were treated in accordance with Policies of the Society for Neuroscience on the Use of Animals in Neuroscience Research. Animals were housed in plastic cages with lights on between 8:00 and 20:00. Male C57BL/6J mice at ages between 8 and 10 weeks were anesthetized with pentobarbital (50 mg/kg i.p., Schering-Plough). NOC18 (50 nmol), cystamine (50 μg), or securinine (50 μg) in 0.5 μl solution was injected through a 30-G injection cannula over a period of 2 min, into the third ventricle at the following stereotaxic coordinates: 1.8 mm posterior to bregma and 5.0 mm below the dural surface, with the incisor bar at 3 mm above the interaural line. As a control, the same volume of water was injected into the same stereotaxic coordinates. Similarly, tunicamycin (0.5 μg) or dimethyl sulfoxide was injected into the third ventricle. In the experiment with TUDCA, 50 nmol NOC18 was simultaneously injected with 2 μg TUDCA, in a volume of 0.5 μl. After surgery, animals were recovered from anesthesia, and again housed in plastic cages with food and water available ad libitum.
PDI knockdown.
Stealth RNAi molecules are chemically modified, blunt-ended, 25-mer double-stranded duplexes with minimal off-target effect (Jiang et al., 2010). Stealth RNAi molecules targeting mouse PDI (Alexa-555-AAG GCC GCA ACA ACU UUG AGG GUG A) were designed and synthesized commercially by Invitrogen. Sequence-scrambled negative control Stealth RNAi duplexes (Alexa-555-UUC CUC UCC ACG CGC AGU ACA UUU A) were also synthesized by Invitrogen. PDI RNAi molecules or the negative control RNAi molecules were mixed with the transfection reagent Invivofectamine (Invitrogen) following the manufacturer's recommendations with minor modifications. Briefly, Invivofectamine was combined with RNAi molecules, and they were incubated for 30 min at 22–25°C in an orbital shaker. At the end of incubation, 15 volumes of 5% glucose were added to the mixture and gently mixed. The mixture was transferred to an Amicon Ultra-0.5 column (Millipore) and centrifuged at 1120 × g at 4°C for 2.5 h. After centrifugation, 3.4 μg of concentrated RNAi-Invivofectamine complex in 2.5 μl was injected into LHA on the left hemisphere of C57BL/6J mice at the following stereotaxic coordinates: 2.0 mm posterior to bregma, 0.9 mm lateral to the midline, and 5.4 mm below the dural surface, with the incisor bar at 3 mm above the interaural line. Mice were anesthetized at 72 h after RNAi injection, and the brain was isolated for immunohistochemical processing.
Sleep deprivation.
Sleep deprivation (SD) was initiated at 8:00, and deprivation for 6 and 12 h during light phase (6 h SD and 12 h SD, respectively) was performed by gentle handling of mice as described previously (Naidoo et al., 2005). For several groups of mice, SD for 12 h during light phase was repeated for 7 consecutive days (12 h SD for 7 d). Male nNOS knock-out mice (Huang et al., 1993) and male inducible NO synthase (iNOS) knock-out mice (MacMicking et al., 1995), both at 8–10 weeks of age and with C57BL/6 background, were also used in this series of experiments.
Immunohistochemistry.
Immunohistochemical examinations were performed essentially according to the methods described previously (Obukuro et al., 2010). Mice were anesthetized with pentobarbital and perfused transcardially with PBS followed by 4% paraformaldehyde (Nacalai) in phosphate buffer. Then the brain was isolated and postfixed overnight with 4% paraformaldehyde, then immersed in 15% sucrose (Nacalai). After freezing, coronal sections of the hypothalamus at 16 μm thickness were obtained every 128 μm and mounted onto slides. Brain sections were washed with PBS and then incubated in 10 mm sodium citrate (Nacalai) buffer, pH 8.5, for 30 min at 80°C for antigen retrieval. After cooling for 40 min, they were again washed with PBS, and blocked with 3% normal donkey serum (Millipore) in PBS containing 0.5% Triton X-100 (MP Bio Japan) for 1 h. Then, sections were incubated overnight at 4°C in a primary antibody solution in PBS containing 0.5% Triton X-100 and 3% normal donkey serum. Primary antibodies were goat polyclonal anti-orexin A (C-19) antibody (1:300; sc-8070, Santa Cruz Biotechnology), rabbit melanin-concentrating hormone (MCH) antiserum (1:20,000; H-070–47; Phoenix Pharmaceuticals), rabbit anti-cleaved caspase-3 (Asp175) antibody (1:100; #9661, Cell Signaling Technology), rabbit anti-dynorphin-A antibody (1–13) (porcine) (1:500; T-4280, Peninsula Laboratories), mouse anti-orexin-A antibody (1:300; MAB763, Sigma-Aldrich), goat anti-pro-MCH (C-20) antibody (1:500; sc-14509, Santa Cruz Biotechnology), rabbit anti-nNOS antibody (1:100; Cell Signaling Technology), mouse anti-iNOS antibody (1:100; 610328, BD Biosciences), and goat anti-glial fibrillary acidic protein (GFAP) (C-19) antibody (1:200; sc-6170, Santa Cruz Biotechnology). After wash with PBS or PBS/Triton X-100, sections were incubated in a secondary antibody solution for 2 h at 22–25°C. Secondary antibodies were AlexaFluor-488-labeled donkey polyclonal anti-goat IgG (H+L) (1:200; A-11055, Invitrogen), AlexaFluor-594-labeled donkey polyclonal anti-rabbit IgG (H+L) (1:500; A-21207, Invitrogen), AlexaFluor-488-labeled donkey polyclonal anti-mouse IgG (H+L) (1:500; A-21202, Invitrogen), or AlexaFluor-594-labeled donkey polyclonal anti-mouse IgG (H+L) (1:500; A-21203, Invitrogen). In the case of c-Fos staining, after antigen retrieval, sections were blocked with 3% normal goat serum (Invitrogen) in PBS containing 0.5% Triton X-100 for 1 h. Then, sections were incubated for 48 h in a primary antibody solution at 4°C. Primary antibody solution consisted of rabbit anti-c-Fos (1:3500; sc-52, Santa Cruz Biotechnology) and mouse anti-NOS1 (A-11) antibody (1:500; sc-5302, Santa Cruz Biotechnology) in PBS containing 0.5% Triton X-100 and 3% normal goat serum. After wash with PBS or PBS/Triton X-100, sections were incubated in a secondary antibody solution for 2 h at 22–25°C. Secondary antibodies were AlexaFluor-488-labeled goat polyclonal anti-rabbit IgG (H+L) (1:500; A-11008, Invitrogen) and AlexaFluor-594-labeled goat polyclonal anti-mouse IgG (H+L) (1:500; A-11005, Invitrogen). Immunohistochemial detection of PDI was performed by essentially the same procedures as those for c-Fos staining, using rabbit anti-PDI antibody (1:300; ADI-SPA-890, Enzo Life Sciences). Specimens were mounted onto slide glasses and coverslipped with 80% glycerol (Nacalai)/20% water, and fluorescence signals were observed using an epifluorescence microscope. The number of immunoreactive (IR) neurons in individual sections was obtained by surveying the entire area of each hemisphere of each section under the microscope at 200 magnification. The cell number was presented as a summation of the values obtained from all sections encompassing the posterior hypothalamus. Representative photographs of immunofluorescence were obtained by BIOREVO fluorescence microscope (BZ-9000; KEYENCE).
NADPH diaphorase staining.
Nicotinamide adenine dinucleotide hydrogen phosphate diaphorase (NADPH-d) histochemistry can be used to stain nNOS-containing neurons in the CNS (Xu et al., 2005). The reaction of NADPH-d was performed at 37°C for 110 min in the standard reaction mixture containing 0.5 mg/ml β-NADPH (Nacalai), 0.2 mg/ml nitroblue tetrazolium (Nacalai), and 0.3% Triton X-100 in 0.1 m PBS, pH 7.4. NADPH-d reaction was stopped by rinsing the specimens in PBS three times for 10 min.
Western blotting.
Mice were anesthetized and perfused transcardially with PBS, and the hypothalamus was dissected and homogenized in RIPA buffer consisting of 150 mm NaCl, 50 mm Tris-HCl, pH 7.5, 5 mm EDTA, 1% Nonidet P-40, 0.1% SDS, 0.5% deoxycholate, and 1% protease inhibitor mixture (Sigma). After incubation at 4°C for 30 min, lysates were centrifuged at 10,110 × g at 4°C for 10 min, and the protein concentrations were determined by the bicinchoninate method. With added sample buffer containing 0.5 m Tris-HCl, pH 6.8, 10% SDS, 2-mercaptoethanol, glycerol, and 1% bromphenol blue, each sample was heated at 99°C for 10 min. SDS-PAGE was performed on a 5.4% stacking gel with 8%, 10%, and 12% separating gel. After gel electrophoresis, proteins were transferred onto polyvinylidene difluoride membranes. The blots were washed with Tris-buffered saline containing 0.1% Tween 20 and blocked with Blocking One (Nacalai) at 22–25°C for 1 h. The membrane was incubated with mouse anti-KDEL antibody [for detection of Ig binding protein (BiP), 1:2000; SPA-827, Stressgen, Enzo Life Sciences], rabbit anti-PDI antibody (1:2000; ADI-SPA-890, Enzo Life Sciences), rabbit anti-nNOS antibody (1:1000; Cell Signaling Technology), mouse anti-iNOS antibody (1:1000; 610328, BD Biosciences), and mouse anti-β-actin antibody (1:1000; Sigma-Aldrich) overnight at 4°C. After incubation with horseradish peroxidase-conjugated secondary antibodies at 22–25°C for 1 h, bands were detected with ECL Advance Western blotting detection kit (GE Healthcare) on a lumino-imaging analyzer (LAS-3000mini; Fuji Film).
For detection of aggregates, the sample was added to sample buffer without 2-mercaptoethanol and was not heated. SDS-PAGE was performed on 8% separating gel without stacking gel. Mouse anti-orexin-A antibody (1:1000; Sigma-Aldrich) was used as a primary antibody.
Biotin switch assay.
Detection of protein S-nitrosation was performed under decreased light conditions as described previously (Uehara et al., 2006; Walker et al., 2010). Mice were anesthetized and perfused transcardially with PBS, and the hypothalamus was dissected and homogenized in HEN buffer (250 mm HEPES, 1 mm EDTA, and 0.1 mm neocuproine) and centrifuged at 2000 × g for 10 min at 4°C. Protein concentrations were determined by the bicinchoninate method, and the amount of protein in each sample was adjusted to a concentration of 0.8 mg/ml with HEN buffer containing 2.5% SDS. Free thiol groups were blocked by addition of 0.1% S-methyl methanethiosulfonate (Wako) from 10% stock in dimethylformamide and incubation at 50°C for 20 min with frequent mixing. Proteins were acetone precipitated, and the pellet was washed four times with acetone (Nacalai) at −20°C. Pellets were dried at 22–25°C and resuspended in HEN buffer with 1% SDS. Nitrosothiol groups were reduced by addition of 100 mm sodium ascorbate (Nacalai) and labeled with 0.25 mg/ml biotin-HPDP (Pierce, Thermo Fisher Scientific). Ascorbate and biotin-HPDP were omitted from some control reactions, as specified otherwise. Samples were incubated with agitation for 1 h at 22–25°C, followed by acetone precipitation as above. Proteins were resuspended in 250 μl of 10% HEN buffer with 1% SDS and 750 μl neutralization buffer (25 mm HEPES, 100 mm NaCl, 1 mm EDTA, and 1% Triton X-100). Streptavidin–agarose slurry (40 μl, Sigma) was added, and the samples were vertically rotated at 4°C for 12 h. Beads were collected and washed six times with neutralization buffer (the first four washes were done with 600 mm NaCl). Proteins were released from dried beads with SDS sample buffer containing 5% β-mercaptoethanol and immunoblotted as above.
PDI assay.
The activity of PDI in oxidative renaturation of ribonuclease (RNase) was determined at 25°C by a continuous assay as previously described (Lyles and Gilbert, 1991). Reduced RNase A was added to a 96-well plate containing buffer (0.1 m Tris-acetate/2 mm EDTA, pH 8.0), 1.0 mm GSH (Nacalai), 0.2 mm GSSG (Wako), 10 μg tissue homogenates, and 4.5 mm cyclic cytidine 3′, 5′-monophosphate (Sigma), a substrate for active RNase A. PDI activity was measured by the increase in RNase A activity with time. Reduced RNase was prepared as previously described (Shimizu et al., 2000). Briefly, 20 mg of RNase A native enzyme (Sigma) was incubated in 1 ml of 0.1 m Tris-HCl, pH 8.0, containing 2 mm EDTA, 6 m guanidine hydrochloride (GdnHCl, Wako), and 0.14 m dithiothreitol (Nacalai) at 22–25°C for 18 h. The solution was then allowed to pass through NAP-10 columns filled with Sephadex G-25 (Pharmacia Biotech) equilibrated with 0.1 m Tris-HCl, pH 8.7, containing 1 m GdnHCl and 1 mm EDTA, to remove dithiothreitol and decrease the GdnHCl concentration to 1 m. The RNase A concentration was determined by the bicinchoninic acid method, and the concentration of thiol groups was also determined by Ellman's method. The stock concentration of reduced RNase A was adjusted to 2 mg/ml by dilution with 0.1 m Tris-HCl, pH 8.7, containing 1 m GdnHCl and 1 mm EDTA. GdnHCl in RNase A stock solution was removed by methanol-chloroform precipitation just before PDI assay.
Statistical analysis.
Data are expressed as mean ± SEM. One-way ANOVA followed by post hoc Tukey-Kramer multiple-comparisons test was performed for evaluation of time-dependent changes in the percentage of aggregate-containing cells and the number of neurons, as well as for evaluation of the effect of TUDCA against NOC18 cytotoxicity. Datasets of the effect of SD on the percentage of aggregate-containing cells and the number of neurons in wild-type (WT), nNOS knock-out, or iNOS knock-out mice were analyzed by two-way ANOVA followed by post hoc comparisons with Tukey's multiple-comparisons test. Student's t test was used for data consisting of two group comparisons. Probability values <0.05 were considered statistically significant.
Results
NO induces selective decrease of orexin neurons
Excess amount of NO production is implicated in pathogenesis of several CNS disorders associated with neurodegeneration. Accordingly, we performed administration of NOC18, an NO donor, into the third ventricle of adult male C57BL/6J mice to clarify whether NO could decrease orexin neurons selectively. The site of injection was located posterior to the region where orexin neurons were distributed. Spreading of copper (II) phthalocyanine dye from the injection site was verified during preparation of frozen brain sections. We confirmed that regions containing orexin-IR neurons were all covered by dye spreading. NOC18 at 50 nmol decreased the number of orexin-IR neurons. Percentage reduction of the number of orexin-IR neurons at 3, 7, 14, and 28 d after injection of NOC18 was 11.2% (n = 5), 34.6% (n = 7), 36.4% (n = 5), and 45.1% (n = 4), respectively, and the decrease was statistically significant at 7, 14, and 28 d (Fig. 1A,B). Preliminary examinations on dose–response relationship revealed that a higher dose (100 nmol) of NOC18 did not decrease the number of orexin-IR neurons further (data not shown). We also examined MCH-IR neurons distributed around orexin-IR neurons in LHA (Griffond and Risold, 2010). The number of MCH-IR neurons also showed tendency to decrease in response to 50 nmol NOC18. However, the overall degree of the decrease (11.6%, 19.9%, 27.4%, and 19.9% reduction after 3, 7, 14, and 28 d, respectively) was smaller than that of orexin-IR neurons, and the decrease was statistically significant only at 14 d (Fig. 1C,D). In a separate set of experiments, we examined the effect of NOC18 on the number of neurons at a longer time (i.e., 56 d after single injection of NOC18 at 50 nmol). We again observed a significant decrease in the number of orexin-IR neurons (392 ± 6.2 cells in NOC18-treated mice vs 475 ± 17.6 cells in control mice, n = 8 for each condition; t(14) = 4.434, p = 0.0006) and no significant change in the number of MCH-IR neurons (668 ± 21.5 cells in NOC18-treated mice vs 724 ± 28.2 cells in control mice, n = 8 for each condition; t(14) = 1.568, p = 0.1392).
Figure 1.
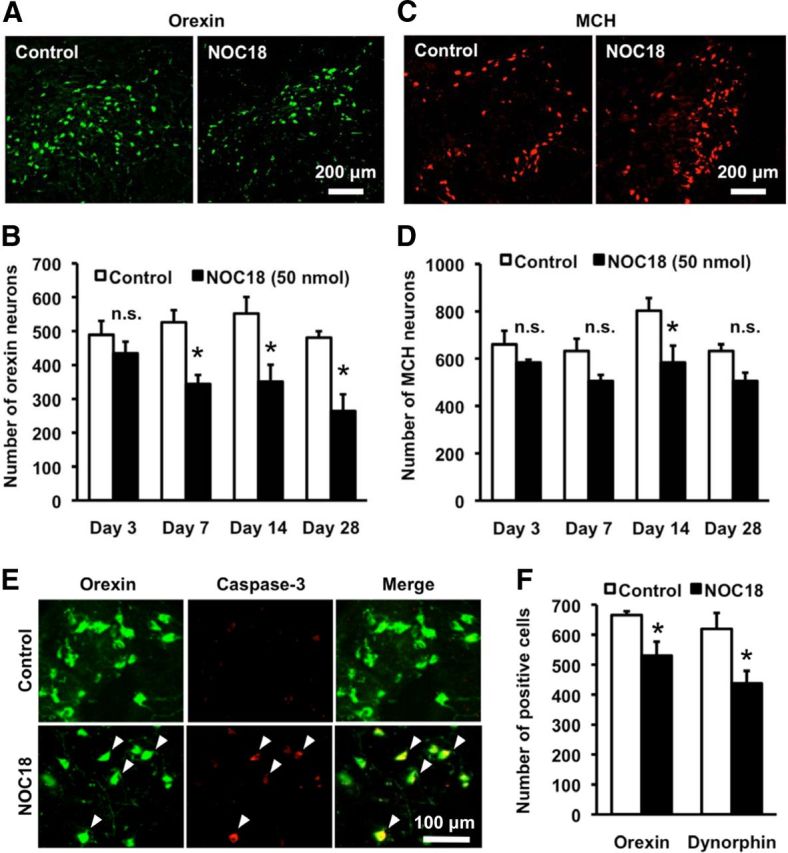
NO induces selective decrease of orexin neurons. A, Representative photomicrographs showing orexin-A immunoreactivity in the hypothalamus, at 7 d after injection of vehicle (control) or 50 nmol NOC18 into the third ventricle. B, Time course of the changes in the number of orexin-immunoreactive (-IR) neurons. Immunohistochemial examinations were performed 3, 7, 14, and 28 d after injection of 50 nmol NOC18 (n = 4–7). *p < 0.05 vs control (ANOVA results: F(7,32) = 5.863, p = 0.0002). n.s., Not significant. C, Representative photomicrographs showing MCH immunoreactivity in the hypothalamus, at 7 d after injection of vehicle (control) or 50 nmol NOC18 into the third ventricle. D, Time course of the changes in the number of MCH-IR neurons. Immunohistochemial examinations were performed 3, 7, 14, and 28 d after injection of 50 nmol NOC18 (n = 4–7). *p < 0.05 vs control (ANOVA results: F(7,32) = 3.826, p = 0.0040). n.s., Not significant. E, Photomicrographs showing double immunofluorescence of orexin-A (green) and cleaved caspase-3 (red) at 14 d after injection of vehicle (control) or 50 nmol NOC18. Representative double-positive cells are indicated by arrowheads. F, Effect of NOC18 on the number of orexin-A- and dynorphin-A-IR cells. Immunohistochemical examinations were performed 7 d after injection of vehicle (control; n = 5) or 50 nmol NOC18 (n = 6). *p < 0.05 vs control (for orexin-A-positive cells; t(9) = 2.575, p = 0.0249, for dynorphin-A-IR cells; t(9) = 2.730, p = 0.0232).
To clarify whether NO-induced loss of orexin-IR neurons resulted from cell death, we examined expression of a conventional apoptosis marker, cleaved caspase-3. At 14 d after injection of 50 nmol NOC18, the percentage of cleaved caspase-3-IR cells within orexin-IR neurons markedly increased (Fig. 1E; 34.6 ± 3.6% in NOC18-injected mice, n = 9 vs 6.4 ± 1.6% in control mice, n = 7; t(14) = 6.491, p < 0.0001). We also examined the number of neurons containing dynorphin-A. A previous study showed that almost all orexin neurons in LHA coexpress dynorphin-A (Chou et al., 2001), suggesting that dynorphin-A in LHA can be used as an alternative marker of orexin neurons. NOC18 (50 nmol) decreased both orexin-A-IR cells (20.3% reduction) and dynorphin-A-IR cells (29.4% reduction) at 7 d after injection (Fig. 1F). The percentage of dynorphin-A-IR cells in orexin-A-IR cell population was 92.9 ± 6.8% in control mice and 82.8 ± 4.2% in NOC18-injected mice.
NO induces ER stress and formation of orexin-A-immunoreactive aggregates
An important pathway leading to neuron death by NO is ER stress (Gotoh and Mori, 2006), and our previous study in hypothalamic slice cultures demonstrated vulnerability of orexin neurons to ER stress (Michinaga et al., 2011). Here we found that expression of BiP, a component of unfolded protein response (UPR), was significantly increased in the hypothalamus at 3 h after injection of 50 nmol NOC18 (Fig. 2A; 1.18 ± 0.07-fold of control, n = 9 for each condition, t(8) = 2.382, p = 0.0444). In addition, we observed that several orexin-IR neurons contained spotty, aggregate-like immunoreactivity for orexin-A after injection of NOC18, in contrast to diffuse orexin-A immunoreactivity observed in neurons in control mice (Fig. 2B). The number of cells containing orexin-A-IR aggregate-like structures increased in a time-dependent manner and peaked at 14 d after injection of 50 nmol NOC18 (Fig. 2C). Similar to the case with the effect on cell number, the effects of NOC18 at 50 nmol and 100 nmol on aggregate formation at 7 d after injection were almost the same, and the effect of 25 nmol NOC18 was less than that of 50 nmol NOC18 (data not shown). Western blot analysis under nonreduced conditions detected orexin-A-IR high-molecular weight bands (compared with 3.5 kDa for orexin-A and 13.5 kDa for prepro-orexin) from the hypothalamic tissue in NOC18-treated mice (Fig. 2D). On the other hand, the percentage of MCH-IR neurons containing MCH-IR aggregate-like structures was not significantly increased by NOC18 treatment (Fig. 2E,F).
Figure 2.
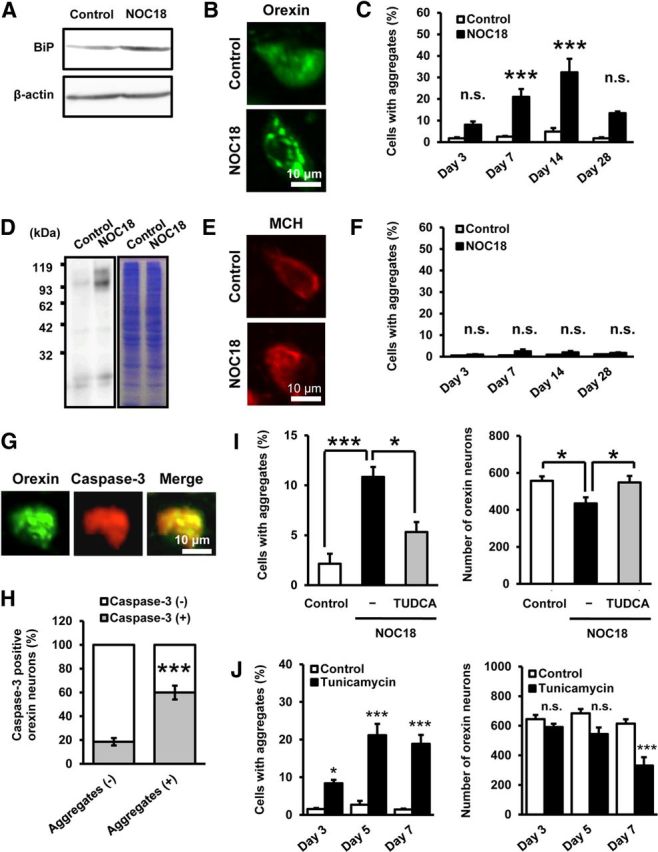
NO induces ER stress and formation of orexin-A-IR aggregates. A, Representative immunoblot showing BiP expression in mouse hypothalamus. Western blot was performed on brain samples obtained 3 h after injection of vehicle (control) or 50 nmol NOC18 into the third ventricle. B, Close-up view of orexin-A immunofluorescence at 14 d after injection of vehicle (control) or 50 nmol NOC18, indicating the appearance of orexin-A-IR aggregate-like structures after NOC18 treatment. C, Time-dependent changes in the percentage of aggregate-containing cells in orexin-A-IR neurons. Immunohistochemical examinations were performed 3, 7, 14, and 28 d after injection of vehicle (control) or 50 nmol NOC18 (n = 4–7). ***p < 0.001 vs control (ANOVA results: F(7,32) = 13.340, p < 0.0001). n.s., Not significant. D, Representative immunoblot showing orexin-A-IR bands (left) and corresponding Coomassie Brilliant Blue staining (right) on brain samples obtained 14 d after injection of vehicle (control) or 50 nmol NOC18. E, Close-up view of MCH immunofluorescence at 14 d after injection of vehicle (control) or 50 nmol NOC18. F, Time-dependent changes in the percentage of aggregate-containing cells in MCH-IR neurons. Immunohistochemical examinations were performed 3, 7, 14, and 28 d after injection of vehicle (control) or 50 nmol NOC18 (n = 4–7). ANOVA results: F(7,32) = 2.375, p = 0.0449. n.s., Not significant. G, Representative photomicrographs showing cleaved caspase-3 immunoreactivity (red) in an aggregate-containing orexin-A-IR neuron (green) at 14 d after injection of 50 nmol NOC18. H, Percentage of cleaved caspase-3-IR cells in aggregate-free and aggregate-containing orexin-A-IR neurons at 14 d after injection of 50 nmol NOC18 (n = 9). ***p < 0.001 vs cells without orexin-A-IR aggregates (t(16) = 6.228, p < 0.0001). I, Effect of TUDCA on NO-induced increase in the percentage of aggregate-containing cells in orexin-IR neurons (left) and decrease in the number of orexin-IR neurons (right). Immunohistochemical examinations were performed 7 d after injection of vehicle (control), 50 nmol NOC18, or 50 nmol NOC18 plus 2 μg TUDCA (n = 7 for each group). *p < 0.05, ***p < 0.001 (ANOVA results: for the number of orexin neurons, F(2,18) = 4.811, p = 0.0212; for the percentage of cell with aggregates, F(2,18) = 9.935, p = 0.0012). J, Effect of tunicamycin on the percentage of aggregate-containing cells in orexin-IR neurons (left) and the number of orexin-IR neurons (right). Immunohistochemical examinations were performed 3, 5, and 7 d after injection of vehicle (control) or 0.5 μg tunicamycin (n = 5–11). *p < 0.05, ***p < 0.001 vs control (ANOVA results: for the percentage of aggregate-containing cells in orexin-IR neurons, F(5,33) = 29.945, p < 0.0001; for the number of orexin-IR neurons, F(5,33) = 11.084, p < 0.0001). n.s., Not significant.
Detailed examination of the results on double immunofluorescence histochemistry for orexin-A and cleaved caspase-3 revealed that aggregate-containing orexin-IR neurons more likely expressed cleaved caspase-3 than aggregate-free orexin-IR neurons did (Fig. 2G,H). To address whether ER stress was involved in NO-induced decrease of orexin neurons, we examined the effect of TUDCA, a compound reported to act as a chemical chaperone and attenuate ER stress (Purkayastha et al., 2011). Concomitant injection of 2 μg TUDCA almost completely prevented the decrease of orexin-IR neurons induced by 50 nmol NOC18 (Fig. 2I). The percentage reduction of the number of orexin-IR neurons compared with control was 20.0% and 2.6% in the absence and the presence of TUDCA, respectively. At the same time, TUDCA significantly attenuated NOC18-induced formation of orexin-A-IR aggregates (Fig. 2I). Additionally, we found that injection of an ER stress inducer tunicamycin (0.5 μg) into the third ventricle increased orexin-IR neurons containing orexin-A-IR aggregates and decreased the total number of orexin-IR neurons at 7 d after injection (Fig. 2J).
NO induces PDI dysfunction via S-nitrosation in the hypothalamus
Because NO selectively decreased orexin-IR neurons (Fig. 1B,D) and increased orexin-A-IR aggregates (Fig. 2C,F), we focused on PDI inhibition as a potential mechanism of NO-induced degeneration of orexin neurons. PDI, which plays an important role in amending erroneously formed disulfide bonds, is inactivated by NO-mediated S-nitrosation (Uehara et al., 2006). We performed biotin switch assay to detect S-nitrosated (SNO) PDI in mouse hypothalamus. As shown in Figure 3A, NOC18 (50 nmol) increased the level of SNO-PDI at 3 h after injection (Fig. 3A). The specificity of biotinylation reaction was confirmed by dramatically decreased detection of SNO-PDI in separate samples lacking treatment with ascorbate that enhances chemical decomposition of nitrosothiol groups required for reaction with the biotinylating reagent biotin-HPDP (Fig. 3B). An increase of SNO-PDI level was apparent at 3 h after injection of 50 nmol NOC18 and continued until 3 d after injection (Fig. 3C). We also measured PDI activity in hypothalamic tissue. PDI activity in the hypothalamus of mice at 3 h and 3 d after injection of 50 nmol NOC18 substantially decreased compared with that of control mice (Fig. 3D).
Figure 3.

NO induces PDI dysfunction via S-nitrosation in the hypothalamus. A, Representative immunoblot of biotin switch assay showing the level of SNO-PDI in mouse hypothalamus at 3 h after injection of vehicle (control) or 50 nmol NOC18 into the third ventricle. B, Control biotin switch analyses with samples lacking treatment with ascorbate or biotin-HPDP, indicating specificity of the assay. Biotin switch assay was performed on brain samples obtained 3 h after injection of 50 nmol NOC18. C, Time-dependent changes in the level of SNO-PDI relative to total PDI normalized by β-actin in mouse hypothalamus. Biotin switch assay was performed on brain samples at 3 h, 3 d, 7 d, and 14 d after injection of vehicle (control) or 50 nmol NOC18 (n = 4–9). *p < 0.05 vs control (for 3 h; t(5) = 2.670, p = 0.0444, for 3 d; t(7) = 2.375, p = 0.0493, for 7 d; t(3) = 0.8469, p = 0.4593, for 14 d; t(3) = 0.5575, p = 0.6161). n.s., Not significant. D, Effect of NOC18 on PDI activity in mouse hypothalamus. PDI assay was performed on brain samples obtained 3 h and 3 d after injection of vehicle (control) or 50 nmol NOC18 (n = 4 or 5). *p < 0.05 vs control (for 3 h; t(8) = 2.760, p = 0.0247, for 3 d, t(7) = 2.895, p = 0.0493).
PDI dysfunction causes selective degeneration of orexin neurons
Next, we examined whether PDI dysfunction had a causal relationship with formation of orexin-A-IR aggregates and decrease in the number of orexin-IR neurons. For this purpose, we used two chemical compounds, cystamine and securinine, because these compounds have been shown to inhibit PDI activity (Hoffstrom et al., 2010). Administration of cystamine (50 μg) into the third ventricle resulted in orexin-A-IR aggregate formation in a subset of orexin-IR neurons after 7 d, without corresponding pathological changes in MCH-IR neurons (Fig. 4A). The absolute number of orexin-IR neurons was also decreased at 7 d after injection of cystamine, whereas the number of MCH-IR neurons remained unchanged (Fig. 4B). Qualitatively similar results were obtained by administration of 50 μg securinine, with regard to increased formation of orexin-A-IR aggregates (Fig. 4C) and selective decrease in the number of orexin-IR neurons (Fig. 4D).
Figure 4.
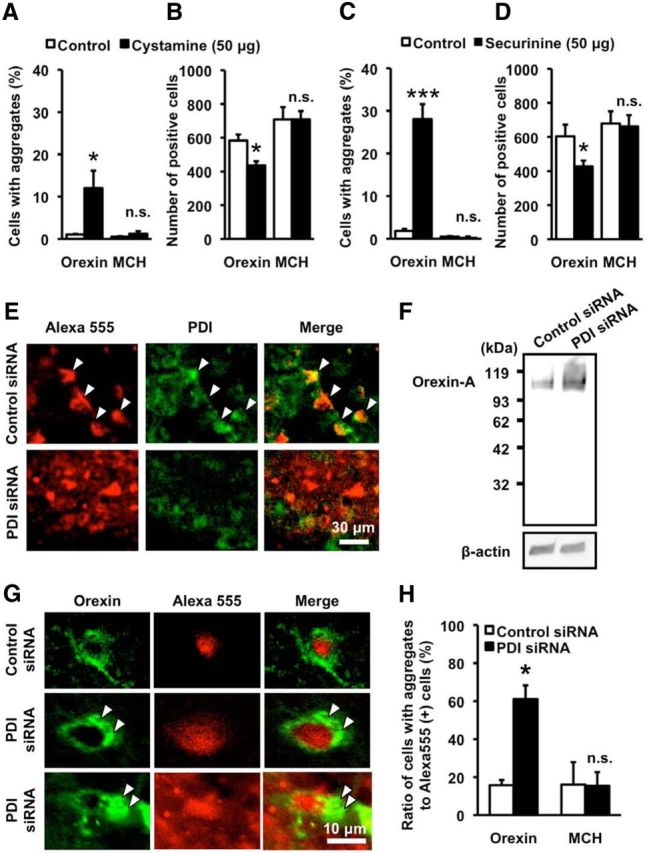
PDI dysfunction causes selective degeneration of orexin neurons. A, B, Effect of cystamine on the percentage of aggregate-containing cells in orexin-IR neurons and MCH-IR neurons (A) and the number of orexin-IR neurons and MCH-IR neurons (B). Immunohistochemical examinations were performed at 7 d after injection of vehicle (control; n = 5) or 50 μg cystamine (n = 5). *p < 0.05 vs control (for the percentage of aggregate-containing cells in orexin-IR neurons, t(8) = 2.674, p = 0.0282; for the percentage of aggregate-containing cells in MCH-IR neurons, t(8) = 0.8293, p = 0.2228; for the number of orexin-IR neurons, t(8) = 3.333, p = 0.0103; for the number of MCH-IR neurons, t(8) = 0.004567, p = 0.9965). n.s., Not significant. C, D, Effect of securinine on the percentage of aggregate-containing cells in orexin-IR neurons and MCH-IR neurons (C) and the number of orexin-IR neurons and MCH-IR neurons (D). Immunohistochemical examinations were performed at 7 d after injection of vehicle (control; n = 5) or 50 μg securinine (n = 5). *p < 0.05, ***p < 0.001 vs control (for the percentage of aggregate-containing cells in orexin-A-IR neurons, t(8) = 7.690, p < 0.0001; for the percentage of aggregate-containing cells in MCH-IR neurons, t(8) = 0.1151, p = 0.9112; for the number of orexin-IR neurons, t(8) = 2.444, p = 0.0403; for the number of MCH-IR neurons, t(8) = 0.1697, p = 0.8695). n.s., Not significant. E, Photomicrographs showing PDI immunofluorescence (green) and fluorescence of siRNA-Alexa-555 (red). Histochemical examinations were performed 3 d after injection of 3.4 μg siRNA into LHA. Arrowheads indicate representative double-positive cells. There is reduced expression of PDI in PDI-siRNA-transfected cells (bottom). F, Representative immunoblot showing orexin-A-IR bands in mouse hypothalamus samples obtained at 3 d after injection of 3.4 μg of control siRNA or PDI siRNA. G, Representative photomicrographs showing orexin-A immunofluorescence (green) and fluorescence of siRNA-Alexa-555 (red) at 3 d after injection of 3.4 μg of control siRNA or PDI siRNA. Arrowheads indicate orexin-A-IR aggregates in PDI siRNA-transfected cells. H, Percentage of the number of orexin- and MCH-IR cells containing aggregates relative to the total number of orexin- and MCH-IR cells transfected with siRNA (n = 4). *p < 0.05 vs control (for the percentage of aggregate-containing cells in orexin-IR neurons, t(6) = 3.245, p = 0.0176; for the percentage of aggregate-containing cells in MCH-IR neurons, t(6) = 0.04876, p = 0.9627). n.s., Not significant.
We also performed knockdown of PDI expression by injection of Alexa-555 fluorophore-attached PDI siRNA into LHA of mice. PDI immunofluorescence histochemistry was performed at 3 d after injection of control siRNA or PDI siRNA. Alexa-555 fluorescence confirmed cellular incorporation of siRNA, and cells transfected with PDI siRNA exhibited decreased expression of PDI (Fig. 4E). Similar to the case with NOC18 treatment, orexin-A-IR high-molecular weight bands were detected by Western blot analysis from the hypothalamic tissue of PDI siRNA-treated mice (Fig. 4F). Moreover, we observed formation of orexin-A-IR aggregates in orexin-IR neurons transfected with PDI siRNA (Fig. 4G). Of Alexa-555-positive, siRNA-transfected orexin-IR neurons, the percentage of aggregate-containing cells markedly increased in PDI siRNA-transfected cells compared with control siRNA-transfected cells. In contrast, PDI siRNA transfection produced no effect on formation of MCH-IR aggregates in MCH-IR neurons (Fig. 4H).
Sleep deprivation causes selective degeneration of orexin neurons
In the next set of experiments, we addressed whether endogenous NO could be involved in orexin neuron degeneration. A recent report has demonstrated that SD increases NO production in LHA where orexin neurons are concentrated (Kostin et al., 2011). Accordingly, we examined the effect of 12 h SD during light phase for 7 consecutive days. As shown in Figure 5A, the number of orexin-IR neurons in mice that underwent 12 h SD for 7 d significantly decreased by 24.4% compared with that in control mice. In contrast, the number of MCH-IR neurons was less affected by SD, and the decrease did not reach statistical significance (11.8%, p = 0.088; Fig. 5A). We also found that orexin-IR neurons immunopositive for cleaved caspase-3 was increased after 12 h SD for 7 d (Fig. 5B; 46.05 ± 9.51% in SD group vs 14.84 ± 5.36% in control group, n = 4 for each condition, t(8) = 2.471, p = 0.0387). Expression of BiP in the hypothalamus showed a trend toward increase in response to 6 h SD, although the increase did not reach statistical significance (Fig. 5C; 1.17 ± 0.08-fold of control, n = 8 for each condition, t(7) = 2.224, p = 0.0615). Moreover, formation of orexin-A-IR aggregates was observed after 12 h SD, and the aggregates persisted during 12 h SD for 7 d (Fig. 5D). Aggregate formation was also observed in MCH-IR neurons, but the degree of the increase was much less than that in orexin-IR neurons. Consistent with the notion that SD increased NO production in the hypothalamus, the level of SNO-PDI in the hypothalamus was increased after 12 h SD (Fig. 5E; 3.44 ± 0.88-fold of control, n = 6 for each condition, t(5) = 2.777, p = 0.0391).
Figure 5.

SD causes selective degeneration of orexin neurons. A, Effect of SD on the number of orexin-IR neurons and MCH-IR neurons. Immunohistochemical examinations were performed after 12 h SD for 7 d (n = 5). **p < 0.01 vs control (for the number of orexin-IR neurons, t(8) = 3.591, p = 0.0071; for the number of MCH-IR neurons, t(8) = 1.942, p = 0.0880). n.s., Not significant B, Representative photomicrographs showing immunofluorescence of orexin-A (green) and cleaved caspase-3 (red) in the hypothalamus of mice with or without 12 h SD for 7 d. C, Representative immunoblot showing BiP expression in the hypothalamus of mice with or without 6 h SD. D, Effect of 12 h SD for 7 d on the number of orexin- and MCH-IR cells with aggregates (n = 5). **p < 0.01 vs control (for the percentage of aggregate-containing cells in orexin-IR neurons, t(8) = 4.725, p = 0.0015; for the percentage of aggregate-containing cells in MCH-IR neurons, t(6) = 3.460, p = 0.0086). E, Representative immunoblot of biotin switch assay showing the level of SNO-PDI in mouse hypothalamus. Biotin switch assay was performed on brain samples obtained after 12 h SD.
nNOS is involved in sleep deprivation-induced degeneration of orexin neurons
Although SD-induced NO production in the hypothalamus has been reported (Kostin et al., 2011), the sources of NO have not been clarified so far. On the other hand, we confirmed that many nNOS-IR neurons were distributed around orexin-IR neurons in LHA (Fig. 6A), which was consistent with the findings in previous studies (Cutler et al., 2001; Yao et al., 2005). Then we examined the expression of c-Fos, a conventional marker protein indicative of increased neural activity. The percentage of c-Fos-IR nNOS neurons in LHA increased in response to 12 h SD, suggesting that nNOS neurons were activated during SD (Fig. 6B; 13.4 ± 4.7% in the SD group vs 3.1 ± 2.0% in the control group, n = 6 for each condition; t(10) = 4.005, p = 0.0025). In addition, we performed NADPH-d histochemistry, which reflected nNOS activity in nervous tissues (Xu et al., 2005). The number of NADPH-d-positive cells in LHA was increased after 12 h SD (Fig. 6C; 245 ± 13.9 cells in SD group vs 188 ± 19.2 cells in control group, n = 6 for each condition; t(10) = 2.425, p = 0.0411). Consistent with a study by Cutler et al. (2001) who reported that orexin neurons did not contain nNOS, we did not detect nNOS expression in orexin-IR neurons in the hypothalamus of mice with or without SD.
Figure 6.
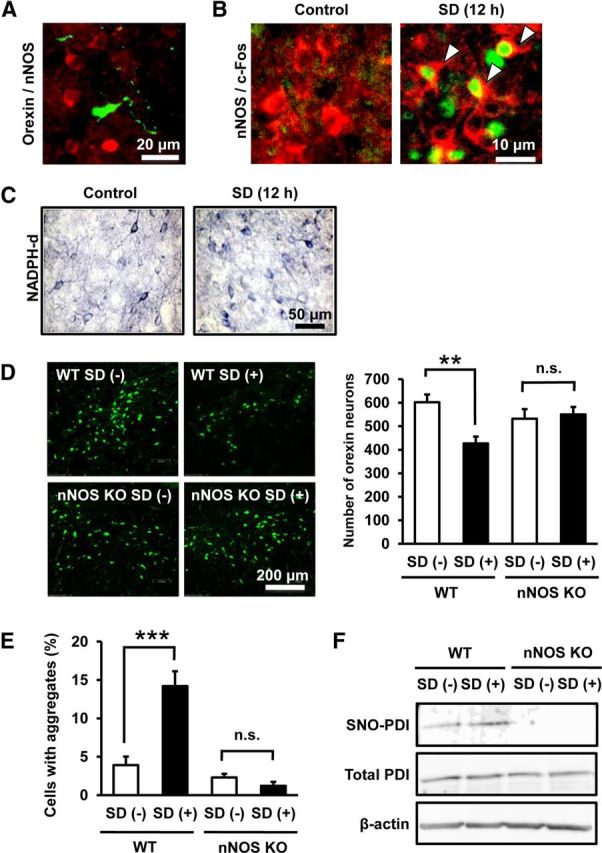
nNOS is involved in SD-induced degeneration of orexin neurons. A, Representative photomicrograph showing immunofluorescence of orexin-A (green) and nNOS (red). B, Representative photomicrographs of immunofluorescence of c-Fos (green) and nNOS (red) in LHA of mice with or without 12 h SD. Arrowheads indicate double-positive cells. C, Representative photomicrographs showing NADPH-d staining in the hypothalamus of mice with or without 12 h SD. D, Left panels, Representative photomicrographs of orexin-IR neurons in the hypothalamus of WT mice or nNOS knock-out mice with or without 12 h SD for 7 d. The effect of 12 h SD for 7 d on the number of orexin-IR neurons in WT and nNOS knock-out mice is shown in the right graph (n = 5 or 6). **p < 0.01 (main effect of SD: F(1,18) = 5.361, p = 0.0326; main effect of nNOS deletion: F(1,18) = 0.604, p = 0.447; interaction between SD and nNOS deletion: F(1,18) = 7.995, p = 0.0112). n.s., Not significant. E, Effect of 12 h SD for 7 d on the percentage of aggregate-containing cells in orexin-IR cells in WT mice and nNOS knock-out mice (n = 5 or 6). ***p < 0.001 (main effect of SD: F(1,18) = 12.86, p = 0.0021; main effect of nNOS deletion: F(1,18) = 33.16, p < 0.0001; interaction between SD and nNOS deletion: F(1,18) = 20.07, p = 0.0003). n.s., Not significant. F, Representative immunoblot of biotin switch assay showing the level of SNO-PDI in the hypothalamus of WT mice and nNOS knock-out mice with or without 12 h SD.
To address potential role of nNOS in orexin neuron pathology, we used nNOS knock-out mice. Twelve hour SD for 7 d significantly decreased the number of orexin-IR neurons in WT mice, whereas the same treatment produced no effect on orexin-IR neurons in nNOS knock-out mice (Fig. 6D). In addition, an increase of orexin-IR neurons containing orexin-A-IR aggregates in response to 12 h SD for 7 d was not observed in nNOS knock-out mice (Fig. 6E). Two-way ANOVA of results on the number of neurons and the percentage of aggregate-containing cells revealed significant interaction between the effects of SD and genotype. In other words, nNOS deletion significantly affected the effect of SD on both decrease in the number of neurons and increase in aggregate formation. We also found that SNO-PDI level in nNOS knock-out mice remained below the detection limit in our biotin switch assay either with or without 12 h SD (Fig. 6F).
iNOS is not involved in sleep deprivation-induced degeneration of orexin neurons
Because a previous study by Kalinchuk et al. (2010) has demonstrated that iNOS contributes to SD-induced NO production in the cerebral cortex, we also addressed potential involvement of iNOS in orexin neuron pathology associated with SD. After 12 h SD, a modest increase (1.2 ± 0.10-fold of control, n = 8, t(7) = 2.371, p = 0.0495) in iNOS expression in the hypothalamus was observed compared with control mice (Fig. 7A). Immunohistochemical examinations revealed iNOS localization in GFAP-IR astrocytes in LHA (Fig. 7B). However, a decrease in the number of orexin-IR neurons (Fig. 7C) and increase in formation of orexin-A-IR aggregates (Fig. 7D) in response to 12 h SD for 7 d were not abolished in iNOS knock-out mice. Two-way ANOVA revealed no significant interaction between the effects of SD and iNOS deletion, either in the number of neurons or in aggregate formation. Moreover, the increase in SNO-PDI after 12 h SD was persistent in the hypothalamus of iNOS knock-out mice (Fig. 7E).
Figure 7.
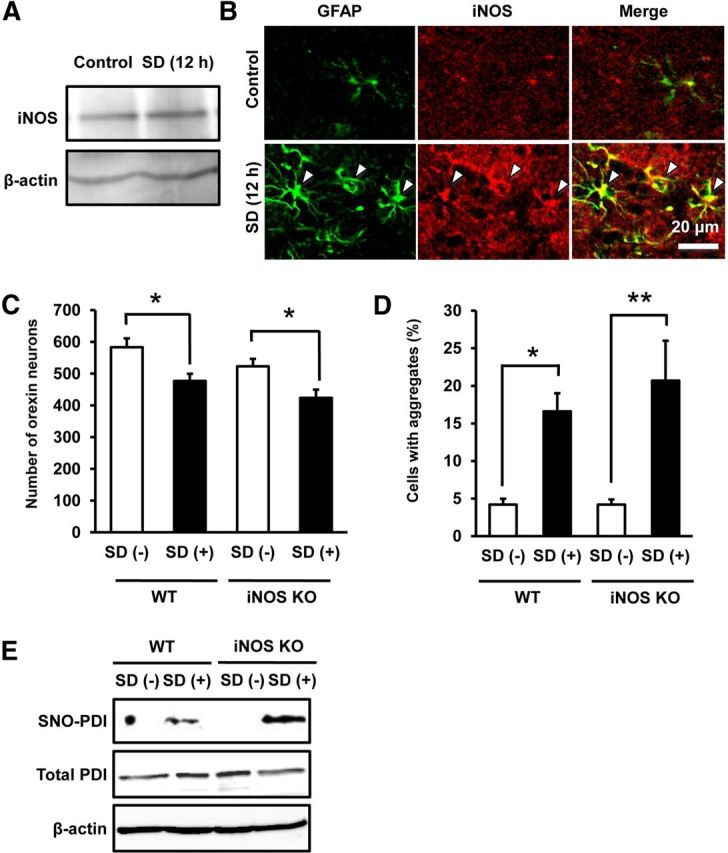
iNOS is not involved in SD-induced degeneration of orexin neurons. A, Representative immunoblot showing iNOS expression in the hypothalamus of mice with or without 12 h SD. B, Representative photomicrographs showing immunofluorescence of GFAP (green) and iNOS (red) in the hypothalamus of mice with or without 12 h SD. Double-positive cells are indicated by arrowheads. C, Effect of 12 h SD for 7 d on the number of orexin-IR neurons in WT mice and iNOS knock-out mice (n = 7 or 8). *p < 0.05 (main effect of SD: F(1,26) = 16.31, p = 0.0004; main effect of iNOS deletion: F(1,26) = 4.966, p = 0.0347; interaction between SD and iNOS deletion: F(1,26) = 0.0164, p = 0.899). D, Effect of 12 h SD for 7 d on the percentage of aggregate-containing cells in orexin-IR cells in WT and iNOS knock-out mice (n = 7 or 8). *p < 0.05, **p < 0.01 (main effect of SD: F(1,26) = 21.67, p < 0.0001; main effect of iNOS deletion: F(1,26) = 0.430, p = 0.517; interaction between SD and iNOS deletion: F(1,26) = 0.435, p = 0.515). E, Representative immunoblot of biotin switch assay showing the level of SNO-PDI in the hypothalamus of WT mice or iNOS knock-out mice with or without 12 h SD.
Discussion
Based on the results obtained in the present study, we propose a novel mechanism of degeneration of hypothalamic orexin neurons as illustrated in Figure 8. That is, NO is produced from nNOS-expressing neurons located close to orexin neurons, under pathophysiological conditions, such as shortage of sleep. Under these conditions, PDI in orexin neurons is inactivated by S-nitrosation, resulting in failure to repair erroneously formed disulfide bonds in orexin molecules. Consequently, peptide aggregates accumulate, ER stress increases, and orexin neurons degenerate.
Figure 8.

Proposed mechanisms of NO-mediated selective degeneration of orexin neurons. SD causes NO production by activation of nNOS. NO production from nearby nNOS-expressing neurons causes S-nitrosation and inactivation of PDI in orexin neurons. PDI dysfunction promotes formation of orexin-A-IR aggregates that may promote cell death via increased ER stress.
Narcolepsy is a representative neurological disorder characterized by prominent and selective decrease in the number of orexin neurons (Thannickal et al., 2000). The mechanisms of pathogenesis of narcolepsy remain unresolved, although autoimmune-related events may play a role at least in part (Kornum et al., 2011). On the other hand, a decreased number of orexin neurons and/or decreased CSF level of orexin have been found in various other pathological situations, including Parkinson's disease (Thannickal et al., 2007), anorexia (Janas-Kozik et al., 2012), depression (Brundin et al., 2007), and even normal aging (Kessler et al., 2011). Because it is unlikely that all these situations are tightly associated with autoimmune-related events, we suspect that some common mechanisms may mediate orexin neuron degeneration. Accordingly, we examined potential roles of NO because overproduction of NO has been observed under various pathological conditions (Calabrese et al., 2007), including Parkinson's disease (Hunot et al., 1996), anorexia (Vannacci et al., 2006), and major depression (Suzuki et al., 2001). We found here that NOC18 application into the third ventricle of mice caused loss of orexin-IR neurons, whereas MCH-IR neurons were less affected by this treatment compared with orexin-IR neurons. Induction of caspase-3 cleavage into active form as well as loss of dynorphin-A, another marker of orexin neurons, indicates that orexin neurons underwent cell death in response to NO.
Our hypothesis was that PDI dysfunction and resultant elevation of ER stress may be involved in NO-induced degeneration of orexin neurons. As for ER stress, we have previously shown that orexin-IR neurons in hypothalamic slice cultures are preferentially decreased by ER stress inducers, such as tunicamycin and thapsigargin (Michinaga et al., 2011). A rationale for involvement of ER stress in selective degeneration of orexin neurons is that orexin-A possesses two intramolecular disulfide bonds; therefore, orexin-A or its precursor pro-orexin might be prone to misfolding. Indeed, we demonstrated here that NOC18 triggered UPR as revealed by BiP upregulation and also induced formation of orexin-A-immunopositive aggregates. At the same time, aggregate formation was less prominent in MCH-IR neurons than in orexin-IR neurons. This difference between MCH and orexin may be related to the fact that MCH possesses only one intramolecular disulfide bond and should be less prone to misfolding than orexin. Besides, the presence of aggregates within orexin-IR neurons was associated with increased probability of caspase-3 activation, and tunicamycin replicated the action of NOC18 with respect to aggregate formation and progressive degeneration of orexin-IR neurons. Furthermore, accumulation of orexin-A-IR aggregates preceded the decrease in the number of orexin-IR neurons by NOC18 and tunicamycin, and TUDCA prevented NOC18-induced decrease in the number of orexin-IR neurons. All of these results suggest that increased ER stress associated with formation of orexin aggregates is involved in NO-induced cell death in orexin neurons. Usage of orexin-deficient mice, where orexin neurons should be identified by other markers such as dynorphin-A, may provide another line of evidence for involvement of orexin aggregates in NO-induced cell death of orexin neurons, which will be considered for future investigations.
As for PDI, S-nitrosation and resultant inactivation of this enzyme have been implicated in ER stress-associated neurodegeneration in several disorders, including Alzheimer's disease and Parkinson's disease (Uehara et al., 2006). Indeed, we confirmed that S-nitrosation of PDI and a marked decrease of PDI activity in the hypothalamus occurred promptly after NOC18 treatment. Moreover, selective accumulation of orexin-IR aggregates and selective decrease in the number of orexin-IR neurons were induced by administration of compounds reported to inhibit PDI activity. The compounds we used as PDI inhibitors also possess other pharmacological activities: for example, cystamine is generally known as an inhibitor of transglutaminase (Jeitner et al., 2005). Notably, cystamine has been reported to produce neuroprotective effects, rather than neurotoxic effects, through either inhibition of transglutaminase or other mechanisms, such as those involving NF-E2-related factor 2 (Karpuj et al., 2002; Calkins et al., 2010). As to securinine, this compound has been known as a GABAA receptor antagonist (Galvez-Ruano et al., 1995) but may also have other effects, such as induction of monocytic differentiation of myeloid leukemia cells through activation of DNA damage signaling (Gupta et al., 2011). We do not totally exclude the possibility that these various actions of compounds contribute to their effects on orexin neurons, but to the best of our knowledge, the only known action common to cystamine and securinine is inhibition of PDI (Hoffstrom et al., 2010). Together with the finding that PDI knockdown by specific siRNA promoted accumulation of orexin-IR aggregates, our results strongly suggest that PDI dysfunction plays a critical role in NO-induced pathological events in orexin neurons.
Results of experiments on SD provided evidence that endogenously produced NO could produce pathological events that were essentially the same as those demonstrated by NOC18 treatment. That is, SD was able to increase PDI S-nitrosation in the hypothalamus, promote accumulation of orexin-A-IR aggregates, and decrease the number of orexin-IR neurons. In this context, NO production in LHA measured as NOx levels was shown to increase during SD (Kostin et al., 2011). With regard to the relationship between sleep/wakefulness disturbance and ER stress, SD was shown to induce UPR in mouse cerebral cortex (Naidoo et al., 2008; Naidoo, 2009). In addition, a recent study has demonstrated that aging accompanies fragmented wakefulness and sleep, which is associated with altered UPR in orexin neurons (Naidoo et al., 2011). The ability of prolonged SD to induce cell death of orexin neurons has not been reported so far, but epidemiological studies suggested lifestyle disturbance, including sudden change in sleep/wake habits as a potential trigger to develop narcolepsy (Orellana et al., 1994; Nishino, 2007). Therefore, similar mechanisms might be involved in early pathogenic events in a subpopulation of narcolepsy patients.
In an earlier study on NO production in LHA during SD (Kostin et al., 2011), the sources of NO have not been clarified. Our present results on nNOS- or iNOS-knock-out mice identified nNOS as the major source of NO that mediated SD-induced pathology in orexin-IR neurons. This is consistent with the fact that orexin-IR neurons are surrounded by many nNOS-containing neurons, although orexin neurons themselves do not express nNOS (Cutler et al., 2001). Moreover, we also found that neural activity of nNOS-containing neurons was enhanced by SD. Characteristics of nNOS-containing neurons in LHA with respect to neural connections and their physiological functions have not been thoroughly addressed to date, except for a study showing that water deprivation increases the expression of nNOS in LHA (Yao et al., 2005). However, local production of NO within LHA may inhibit neural activity of nearby orexin neurons (Kostin et al., 2011) and thus may suppress various physiological actions of orexins, such as regulation of sleep/wakefulness, feeding, and reward-related behaviors. Besides, NO produced locally in other brain regions, such as the cerebral cortex, the basal forebrain, and the pontine structures, is also recognized to act as a sleep-promoting substance (Kalinchuk et al., 2010; Pasumarthi et al., 2010; Cespuglio et al., 2012). Interestingly, the contribution of iNOS to NO production in response to SD has been proposed in the basal forebrain and the pontine structures (Kalinchuk et al., 2010; Cespuglio et al., 2012), whereas we found that iNOS deficiency did not affect SD-induced, NO-dependent pathological events in orexin-IR neurons. These results indicate that different isoforms of NOS are involved in NO production in different brain regions in response to SD.
In conclusion, our findings in the present study provide the first evidence that neuropeptide misfolding can be a primary cause of neurodegeneration in the CNS. Together with the unique characteristic of the structure of orexin-A having two disulfide bonds, the presence of many adjacent nNOS-expressing neurons may endanger orexin neurons via NO-dependent PDI dysfunction and increased ER stress. Although we demonstrated that these mechanisms are indeed involved SD-induced pathological changes in orexin neurons, whether the same mechanisms also participate in degeneration of orexin neurons under various other pathological conditions is an interesting issue to be addressed in the future. In addition, orexin-dependent physiological and behavioral functions, such as control of sleep/wakefulness and feeding (Tsujino and Sakurai, 2010), may well be altered by NO-mediated loss of orexin neurons and therefore should also deserve detailed analyses.
Footnotes
This work was supported by the Japan Health Foundation, Astellas Foundation for Research on Metabolic Disorders, Hoansha Foundation, MEXT KAKENHI Grant 23117714, and Japan Society for the Promotion of Science KAKENHI Grant 24659118. We thank Tamami Kawaguchi for assistance in PDI assay, Ryota Hamasaki and Prof. Kazuo Takahama (Kumamoto University) for assistance in c-Fos staining, and Prof. Yukihiko Sugimoto (Kumamoto University) for assistance in biotin switch assay.
The authors declare no competing financial interests.
References
- Brundin L, Björkqvist M, Petersén A, Träskman-Bendz L. Reduced orexin levels in the cerebrospinal fluid of suicidal patients with major depressive disorder. Eur Neuropsychopharmacol. 2007;17:573–579. doi: 10.1016/j.euroneuro.2007.01.005. [DOI] [PubMed] [Google Scholar]
- Calabrese V, Mancuso C, Calvani M, Rizzarelli E, Butterfield DA, Stella AM. Nitric oxide in the central nervous system: neuroprotection versus neurotoxicity. Nat Rev Neurosci. 2007;8:766–775. doi: 10.1038/nrn2214. [DOI] [PubMed] [Google Scholar]
- Calkins MJ, Townsend JA, Johnson DA, Johnson JA. Cystamine protects from 3-nitropropionic acid lesioning via induction of nf-e2 related factor 2 mediated transcription. Exp Neurol. 2010;224:307–317. doi: 10.1016/j.expneurol.2010.04.008. [DOI] [PMC free article] [PubMed] [Google Scholar]
- Cespuglio R, Amrouni D, Meiller A, Buguet A, Gautier-Sauvigné S. Nitric oxide in the regulation of the sleep–wake states. Sleep Med Rev. 2012;16:265–279. doi: 10.1016/j.smrv.2012.01.006. [DOI] [PubMed] [Google Scholar]
- Chemelli RM, Willie JT, Sinton CM, Elmquist JK, Scammell T, Lee C, Richardson JA, Williams SC, Xiong Y, Kisanuki Y, Fitch TE, Nakazato M, Hammer RE, Saper CB, Yanagisawa M. Narcolepsy in orexin knockout mice: molecular genetics of sleep regulation. Cell. 1999;98:437–451. doi: 10.1016/S0092-8674(00)81973-X. [DOI] [PubMed] [Google Scholar]
- Chou TC, Lee CE, Lu J, Elmquist JK, Hara J, Willie JT, Beuckmann CT, Chemelli RM, Sakurai T, Yanagisawa M, Saper CB, Scammell TE. Orexin (hypocretin) neurons contain dynorphin. J Neurosci. 2001;21:RC168. doi: 10.1523/JNEUROSCI.21-19-j0003.2001. [DOI] [PMC free article] [PubMed] [Google Scholar]
- Cutler DJ, Morris R, Evans ML, Leslie RA, Arch JR, Williams G. Orexin-A immunoreactive neurons in the rat hypothalamus do not contain neuronal nitric oxide synthase (nNOS) Peptides. 2001;22:123–128. doi: 10.1016/S0196-9781(00)00364-8. [DOI] [PubMed] [Google Scholar]
- Galvez-Ruano E, Aprison MH, Robertson DH, Lipkowitz KB. Identifying agonistic and antagonistic mechanisms operative at the GABA receptor. J Neurosci Res. 1995;42:666–673. doi: 10.1002/jnr.490420509. [DOI] [PubMed] [Google Scholar]
- Gotoh T, Mori M. Nitric oxide and endoplasmic reticulum stress. Arterioscler Thromb Vasc Biol. 2006;26:1439–1446. doi: 10.1161/01.ATV.0000223900.67024.15. [DOI] [PubMed] [Google Scholar]
- Griffond B, Risold PY. MCH and feeding behavior–interaction with peptidic network. Peptides. 2009;30:2045–2051. doi: 10.1016/j.peptides.2009.07.008. [DOI] [PubMed] [Google Scholar]
- Gupta K, Chakrabarti A, Rana S, Ramdeo R, Roth BL, Agarwal ML, Tse W, Agarwal MK, Wald DN. Securinine, a myeloid differentiation agent with therapeutic potential for AML. PLoS One. 2011;6:e21203. doi: 10.1371/journal.pone.0021203. [DOI] [PMC free article] [PubMed] [Google Scholar]
- Hagan JJ, Leslie RA, Patel S, Evans ML, Wattam TA, Holmes S, Benham CD, Taylor SG, Routledge C, Hemmati P, Munton RP, Ashmeade TE, Shah AS, Hatcher JP, Hatcher PD, Jones DN, Smith MI, Piper DC, Hunter AJ, Porter RA, et al. Orexin A activates locus coeruleus cell firing and increases arousal in the rat. Proc Natl Acad Sci U S A. 1999;96:10911–10916. doi: 10.1073/pnas.96.19.10911. [DOI] [PMC free article] [PubMed] [Google Scholar]
- Hara J, Beuckmann CT, Nambu T, Willie JT, Chemelli RM, Sinton CM, Sugiyama F, Yagami K, Goto K, Yanagisawa M, Sakurai T. Genetic ablation of orexin neurons in mice results in narcolepsy, hypophagia, and obesity. Neuron. 2001;30:345–354. doi: 10.1016/S0896-6273(01)00293-8. [DOI] [PubMed] [Google Scholar]
- Hoffstrom BG, Kaplan A, Letso R, Schmid RS, Turmel GJ, Lo DC, Stockwell BR. Inhibitors of protein disulfide isomerase suppress apoptosis induced by misfolded proteins. Nat Chem Biol. 2010;6:900–906. doi: 10.1038/nchembio.467. [DOI] [PMC free article] [PubMed] [Google Scholar]
- Huang PL, Dawson TM, Bredt DS, Snyder SH, Fishman MC. Targeted disruption of the neuronal nitric oxide synthase gene. Cell. 1993;75:1273–1286. doi: 10.1016/0092-8674(93)90615-W. [DOI] [PubMed] [Google Scholar]
- Hunot S, Boissière F, Faucheux B, Brugg B, Mouatt-Prigent A, Agid Y, Hirsch EC. Nitric oxide synthase and neuronal vulnerability in Parkinson's disease. Neuroscience. 1996;72:355–363. doi: 10.1016/0306-4522(95)00578-1. [DOI] [PubMed] [Google Scholar]
- Ito N, Yabe T, Gamo Y, Nagai T, Oikawa T, Yamada H, Hanawa T. I.c.v. administration of orexin-A induces an antidepressive-like effect through hippocampal cell proliferation. Neuroscience. 2008;157:720–732. doi: 10.1016/j.neuroscience.2008.09.042. [DOI] [PubMed] [Google Scholar]
- Janas-Kozik M, Stachowicz M, Krupka-Matuszczyk I, Szymszal J, Krysta K, Janas A, Rybakowski JK. Plasma levels of leptin and orexin A in the restrictive type of anorexia nervosa. Regul Pept. 2011;168:5–9. doi: 10.1016/j.regpep.2011.02.005. [DOI] [PubMed] [Google Scholar]
- Jeitner TM, Delikatny EJ, Ahlqvist J, Capper H, Cooper AJ. Mechanism for the inhibition of transglutaminase 2 by cystamine. Biochem Pharmacol. 2005;69:961–970. doi: 10.1016/j.bcp.2004.12.011. [DOI] [PubMed] [Google Scholar]
- Jiang SX, Whitehead S, Aylsworth A, Slinn J, Zurakowski B, Chan K, Li J, Hou ST. Neuropilin 1 directly interacts with Fer kinase to mediate semaphorin 3A-induced death of cortical neurons. J Biol Chem. 2010;285:9908–9918. doi: 10.1074/jbc.M109.080689. [DOI] [PMC free article] [PubMed] [Google Scholar]
- Kalinchuk AV, McCarley RW, Porkka-Heiskanen T, Basheer R. Sleep deprivation triggers inducible nitric oxide-dependent nitric oxide production in wake-active basal forebrain neurons. J Neurosci. 2010;30:13254–13264. doi: 10.1523/JNEUROSCI.0014-10.2010. [DOI] [PMC free article] [PubMed] [Google Scholar]
- Karpuj MV, Becher MW, Springer JE, Chabas D, Youssef S, Pedotti R, Mitchell D, Steinman L. Prolonged survival and decreased abnormal movements in transgenic model of Huntington disease, with administration of the transglutaminase inhibitor cystamine. Nat Med. 2002;8:143–149. doi: 10.1038/nm0202-143. [DOI] [PubMed] [Google Scholar]
- Kessler BA, Stanley EM, Frederick-Duus D, Fadel J. Age-related loss of orexin/hypocretin neurons. Neuroscience. 2011;178:82–88. doi: 10.1016/j.neuroscience.2011.01.031. [DOI] [PMC free article] [PubMed] [Google Scholar]
- Kornum BR, Faraco J, Mignot E. Narcolepsy with hypocretin/orexin deficiency, infections and autoimmunity of the brain. Curr Opin Neurobiol. 2011;21:897–903. doi: 10.1016/j.conb.2011.09.003. [DOI] [PubMed] [Google Scholar]
- Kostin A, Rai S, Kumar S, Szymusiak R, McGinty D, Alam MN. Nitric oxide production in the perifornical-lateral hypothalamic area and its influences on the modulation of perifornical-lateral hypothalamic area neurons. Neuroscience. 2011;179:159–169. doi: 10.1016/j.neuroscience.2011.01.052. [DOI] [PMC free article] [PubMed] [Google Scholar]
- Lyles MM, Gilbert HF. Catalysis of the oxidative folding of ribonuclease A by protein disulfide isomerase: dependence of the rate on the composition of the redox buffer. Biochemistry. 1991;30:613–619. doi: 10.1021/bi00217a004. [DOI] [PubMed] [Google Scholar]
- MacMicking JD, Nathan C, Hom G, Chartrain N, Fletcher DS, Trumbauer M, Stevens K, Xie QW, Sokol K, Hutchinson N, Chen H, Mudgett JS. Altered responses to bacterial infection and endotoxic shock in mice lacking inducible nitric oxide synthase. Cell. 1995;81:641–650. doi: 10.1016/0092-8674(95)90085-3. [DOI] [PubMed] [Google Scholar]
- Matus S, Glimcher LH, Hetz C. Protein folding stress in neurodegenerative diseases: a glimpse into the ER. Curr Opin Cell Biol. 2011;23:239–252. doi: 10.1016/j.ceb.2011.01.003. [DOI] [PubMed] [Google Scholar]
- Michinaga S, Hisatsune A, Isohama Y, Katsuki H. Orexin neurons in hypothalamic slice cultures are vulnerable to endoplasmic reticulum stress. Neuroscience. 2011;190:289–300. doi: 10.1016/j.neuroscience.2011.06.026. [DOI] [PubMed] [Google Scholar]
- Naidoo N. Cellular stress/the unfolded protein response: relevance to sleep and sleep disorders. Sleep Med Rev. 2009;13:195–204. doi: 10.1016/j.smrv.2009.01.001. [DOI] [PMC free article] [PubMed] [Google Scholar]
- Naidoo N, Giang W, Galante RJ, Pack AI. Sleep deprivation induces the unfolded protein response in mouse cerebral cortex. J Neurochem. 2005;92:1150–1157. doi: 10.1111/j.1471-4159.2004.02952.x. [DOI] [PubMed] [Google Scholar]
- Naidoo N, Ferber M, Master M, Zhu Y, Pack AI. Aging impairs the unfolded protein response to sleep deprivation and leads to proapoptotic signaling. J Neurosci. 2008;28:6539–6548. doi: 10.1523/JNEUROSCI.5685-07.2008. [DOI] [PMC free article] [PubMed] [Google Scholar]
- Naidoo N, Zhu J, Zhu Y, Fenik P, Lian J, Galante R, Veasey S. Endoplasmic reticulum stress in wake-active neurons progresses with aging. Aging Cell. 2011;10:640–649. doi: 10.1111/j.1474-9726.2011.00699.x. [DOI] [PMC free article] [PubMed] [Google Scholar]
- Nishino S. Clinical and neurobiological aspects of narcolepsy. Sleep Med. 2007;8:373–399. doi: 10.1016/j.sleep.2007.03.008. [DOI] [PMC free article] [PubMed] [Google Scholar]
- Nishino S, Ripley B, Overeem S, Lammers GJ, Mignot E. Hypocretin (orexin) deficiency in human narcolepsy. Lancet. 2000;355:39–40. doi: 10.1016/S0140-6736(99)05582-8. [DOI] [PubMed] [Google Scholar]
- Obukuro K, Takigawa M, Hisatsune A, Isohama Y, Katsuki H. Quinolinate induces selective loss of melanin-concentrating hormone neurons, rather than orexin neurons, in the hypothalamus of mice and young rats. Neuroscience. 2010;170:298–307. doi: 10.1016/j.neuroscience.2010.06.081. [DOI] [PubMed] [Google Scholar]
- Orellana C, Villemin E, Tafti M, Carlander B, Besset A, Billiard M. Life events in the year preceding the onset of narcolepsy. Sleep. 1994;17:S50–S53. doi: 10.1093/sleep/17.suppl_8.s50. [DOI] [PubMed] [Google Scholar]
- Pasumarthi RK, Gerashchenko D, Kilduff TS. Further characterization of sleep-active neuronal nitric oxide synthase neurons in the mouse brain. Neuroscience. 2010;169:149–157. doi: 10.1016/j.neuroscience.2010.04.066. [DOI] [PMC free article] [PubMed] [Google Scholar]
- Purkayastha S, Zhang H, Zhang G, Ahmed Z, Wang Y, Cai D. Neural dysregulation of peripheral insulin action and blood pressure by brain endoplasmic reticulum stress. Proc Natl Acad Sci U S A. 2011;108:2939–2944. doi: 10.1073/pnas.1006875108. [DOI] [PMC free article] [PubMed] [Google Scholar]
- Scott MM, Marcus JN, Pettersen A, Birnbaum SG, Mochizuki T, Scammell TE, Nestler EJ, Elmquist JK, Lutter M. Hcrtr1 and 2 signaling differentially regulates depression-like behaviors. Behav Brain Res. 2011;222:289–294. doi: 10.1016/j.bbr.2011.02.044. [DOI] [PMC free article] [PubMed] [Google Scholar]
- Shimizu H, Fujimoto K, Kawaguchi H. Renaturation of reduced ribonuclease A with a microsphere-induced refolding system. Biotechnol Prog. 2000;16:248–253. doi: 10.1021/bp000008c. [DOI] [PubMed] [Google Scholar]
- Suzuki E, Yagi G, Nakaki T, Kanba S, Asai M. Elevated plasma nitrate levels in depressive states. J Affect Disord. 2001;63:221–224. doi: 10.1016/S0165-0327(00)00164-6. [DOI] [PubMed] [Google Scholar]
- Thannickal TC, Moore RY, Nienhuis R, Ramanathan L, Gulyani S, Aldrich M, Cornford M, Siegel JM. Reduced number of hypocretin neurons in human narcolepsy. Neuron. 2000;27:469–474. doi: 10.1016/S0896-6273(00)00058-1. [DOI] [PMC free article] [PubMed] [Google Scholar]
- Thannickal TC, Lai YY, Siegel JM. Hypocretin (orexin) cell loss in Parkinson's disease. Brain. 2007;130:1586–1595. doi: 10.1093/brain/awm097. [DOI] [PMC free article] [PubMed] [Google Scholar]
- Tsujino N, Sakurai T. Orexin/hypocretin: a neuropeptide at the interface of sleep, energy homeostasis, and reward system. Pharmacol Rev. 2009;61:162–176. doi: 10.1124/pr.109.001321. [DOI] [PubMed] [Google Scholar]
- Uehara T, Nakamura T, Yao D, Shi ZQ, Gu Z, Ma Y, Masliah E, Nomura Y, Lipton SA. S-nitrosylated protein-disulphide isomerase links protein misfolding to neurodegeneration. Nature. 2006;441:513–517. doi: 10.1038/nature04782. [DOI] [PubMed] [Google Scholar]
- Vannacci A, Ravaldi C, Giannini L, Rotella CM, Masini E, Faravelli C, Ricca V. Increased nitric oxide production in eating disorders. Neurosci Lett. 2006;399:230–233. doi: 10.1016/j.neulet.2006.01.060. [DOI] [PubMed] [Google Scholar]
- Walker AK, Farg MA, Bye CR, McLean CA, Horne MK, Atkin JD. Protein disulphide isomerase protects against protein aggregation and is S-nitrosylated in amyotrophic lateral sclerosis. Brain. 2010;133:105–116. doi: 10.1093/brain/awp267. [DOI] [PubMed] [Google Scholar]
- Xu L, Matsumura S, Mabuchi T, Takagi K, Abe T, Ito S. In situ measurement of neuronal nitric oxide synthase activity in the spinal cord by NADPH-diaphorase histochemistry. J Neurosci Methods. 2006;150:174–184. doi: 10.1016/j.jneumeth.2005.06.017. [DOI] [PubMed] [Google Scholar]
- Yao ST, Gouraud S, Paton JF, Murphy D. Water deprivation increases the expression of neuronal nitric oxide synthase (nNOS) but not orexin-A in the lateral hypothalamic area of the rat. J Comp Neurol. 2005;490:180–193. doi: 10.1002/cne.20662. [DOI] [PubMed] [Google Scholar]