Abstract
Magnetic resonance spectroscopy (MRS) of glutamatergic or GABAergic measures in anterior cingulate cortex (ACC) was found altered in psychiatric disorders and predictive of interindividual variations of functional responses in healthy populations. Several ACC subregions have been parcellated into receptor-architectonically different portions with heterogeneous fingerprints for excitatory and inhibitory receptors. Similarly, these subregions overlap with functionally distinct regions showing opposed signal changes toward stimulation or resting conditions. We therefore investigated whether receptor-architectonical and functional segregation of the cingulate cortex in humans was also reflected in its local concentrations of glutamate (Glu), glutamine (Gln), and GABA.
To accomplish a multiregion estimation of all three metabolites in one robust and reliable session, we used an optimized 7T-stimulated echo-acquisition mode method with variable-rate selective excitation pulses. Our results demonstrated that, ensuring high data retest reliability, four cingulate subregions discerning e.g., pregenual ACC (pgACC) from anterior mid-cingulate cortex showed different metabolite concentrations and ratios reflective of regionally specific inhibition/excitation balance. These findings could be controlled for potential influences of local gray matter variations or MRS voxel-placement deviations. Pregenual ACC was found to have significantly higher GABA and Glu concentrations than other regions. This pattern was not paralleled by Gln concentrations, which for both absolute and relative values showed a rostrocaudal gradient with highest values in pgACC. Increased excitatory Glu and inhibitory GABA in pgACC were shown to follow a regional segregation agreeing with recently shown receptor-architectonic GABAB receptor distribution in ACC, whereas Gln distribution followed a pattern of AMPA receptors.
Introduction
Neuroanatomical investigations of the anterior cingulate cortex (ACC) revealed a stable link between baseline metabolism and inhibition/excitation equilibrium (Walter et al., 2009). Furthermore, task-negative responses during emotional processing correlated positively with GABA concentrations (at rest) in pregenual ACC (pgACC; Northoff et al., 2007). The cingulate cortex (CC), including ACC, has been subdivided into several regions based on differences in structural connectivity, cyto- and receptor architecture (for review, see Vogt and Palomero-Gallagher, 2012). This anatomical differentiation is corroborated by a functional segregation, reported in task functional magnetic resonance imaging (fMRI) and lesion studies (Devinsky et al., 1995; Bush et al., 2000), and differences in resting-state functional connectivity patterns (Yu et al., 2011). Furthermore, the importance of local transmitter levels on interregional connectivity (Horn et al., 2010) is further supported by receptor-architectonic observations, which discern subdivisions within both the ACC and posterior CC (PCC) based on autoradiographically measured receptor densities (Palomero-Gallagher et al., 2009).
To date, it remains unclear in how far the local concentrations of the major inhibitory neurotransmitter GABA and excitatory neurotransmitter glutamate (Glu) would directly reflect differences in local GABA and Glu receptor densities, and which receptor subtypes might be most strongly represented. Furthermore, little is known about the regional distribution of glutamine (Gln), a precursor for both GABA and Glu.
To measure metabolite concentrations in vivo, single-voxel proton magnetic resonance spectroscopy (1H-MRS) was proven a robust noninvasive technique (Kaiser et al., 2005). Short echo time (TE) 1H-MRS (Bartha et al., 2000) has shown satisfying results at low-field strengths, for substances like N-acetylaspartate, creatine, and choline but not for the metabolites for which a receptor architectonic mapping would be available (e.g., GABA and Glu). Until recently, the investigations of these metabolites were technically limited both by the multivoxel acquisition time and by separating Glu and Gln along their respective multiplets or detecting GABA due to overlay by other signals at low-field strengths. These problems were partially addressed by editing approaches (Mescher et al., 1998; Terpstra et al., 2002), which, however, could only focus on one of the three metabolites, or by constant time point resolved spectroscopy (Mayer and Spielman, 2005), chemical shift selective filters (Schulte et al., 2005), and 2D J-resolved spectroscopy (Ryner et al., 1995), which drastically increase scan time per voxel.
Due to increased sensitivity and chemical shift dispersion, high field 7T provides spectra with high signal-to-noise ratio (SNR) and spectral resolution for accurate metabolite quantification without the techniques mentioned above (Tkác et al., 2001; Stephenson et al., 2011; Elywa et al., 2012). Furthermore, high resolution T1-weighted anatomical images at 7T can precisely contribute to spectroscopy voxel segmentations (Lüsebrink et al., 2013), essential for correcting the metabolite concentrations for gray matter (GM) content, which contains significantly higher Glu levels than white matter (WM; McLean et al., 2000; Srinivasan et al., 2006).
We therefore investigated regional GABAergic and glutamatergic variations using an optimized 7T 1H-MRS protocol, taking segment variations and data reliability into account, and compared metabolite distribution along cingulate subregions with their receptor fingerprints.
Materials and Methods
In the present 7T study, we applied a stimulated-echo acquisition mode (STEAM) sequence using short TE/mixing time (TM; 20 ms/10 ms) and variable-rate selective excitation (VERSE) radio frequency (RF) pulses. Although both short and long TE/TM (16 ms/17 ms and 74 ms/68 ms) have shown feasibility for in vivo detection of Gln and Glu at 7T (Yang et al., 2008; Stephenson et al., 2011), we decided in favor of short TE/TM because it was reported as yielding reproducible and reliable spectra as indicated by significantly higher SNRs and lower Cramér–Rao lower bounds (CRLBs) for measuring GABA, Gln, and Glu than long TE/TM does (Stephenson et al., 2011). Likewise, the VERSE pulses were applied because they significantly improved metabolite detection with a short TE/TM STEAM sequence when taking the reduction of the peak power requirements of RF pulses into account (Elywa et al., 2012).
MRS data acquisition.
Thirty-six healthy male subjects (27 ± 3 years old) were recruited and underwent a standard clinical interview by a board certified psychiatrist to rule out life time history neurological or psychiatric illness, including past head trauma leading to loss of consciousness or substance abuse. Present physical illness and psychiatric abnormality was screened for by the Structured Clinical Interview for DSM-IV section focusing on affective or psychotic symptoms, as well as assessed using self-report questionnaires approved by the local Institutional Review Board. Additionally, all subjects were required not to drink coffee, tea, or smoke at least 1 h before the acquisition started. Moreover, for excluding the subject with explicit sleepiness, the subjects were also instructed to adhere to a regular sleeping cycle the night before scanning, and explicitly questions before scanning, including “Did you have a good rest?,” were answered with positive responses from subjects not knowing sleepiness as an exclusion criterion. All acquisitions fell between 8:00 A.M. and 8:00 P.M. with a mean time difference of 3.8 h across all subjects, i.e., most subjects (n = 26) were scanned between 10:30 A.M. and 4:30 P.M.
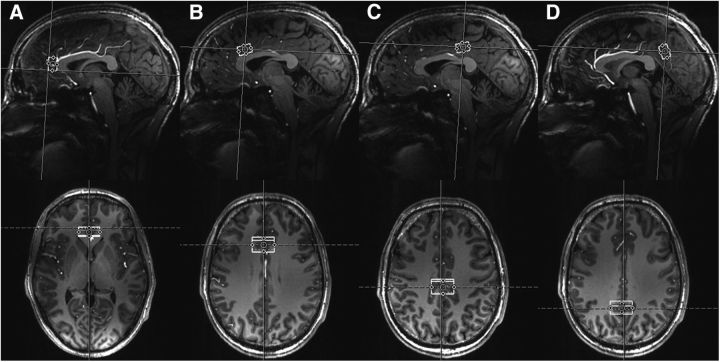
Of these subjects, 10 were chosen to attend three scan visits within 2 months to assess the reproducibility of the measurements (“retest subjects”), whereas the remaining 26 subjects underwent one scan visit. Four regions of interest (ROIs) across the CC were selected for spectrum acquisitions, including pgACC, anterior mid-CC (aMCC), as well as rostral and caudal parts within the PCC; rPCC and cPCC (Fig. 1).
Figure 1.
Voxel placement on four ROIs in representative 3D MPRAGE anatomical images (top, sagittal plane; bottom, transverse plane): pgACC (A), aMCC (B), rPCC (C), and cPCC (D).
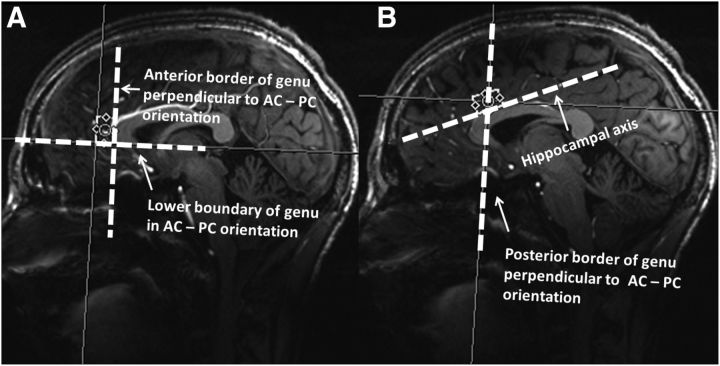
All measurements were performed on a 7T MR scanner (Siemens Magnetom) using a 24-channel head array coil (Nova Medical). High resolution anatomical images were acquired using the three dimension (3D) magnetization-prepared rapid gradient echo (MPRAGE) sequence with parameters including TE = 2.73 ms, repetition time (TR) = 2300 ms, inversion time (TI) = 1050 ms, flip angle = 5°, bandwidth = 150 Hz/pixel, acquisition matrix = 320 × 320 × 224, isometric voxel size = 0.8 mm3. A reconstruction of the MRPAGE images was implemented into the anterior commissure (AC)–posterior commissure (PC) plane, which provided the anterior–posterior direction relative to the landmarks for subsequent MRS voxel placement. As shown in Figure 2A, pgACC was prescribed as bordering the lower edge of the genu of the corpus callosum and posteriorly touching the anterior border of the genu of the corpus callosum, which was together with the tilting into AC–PC plane, oriented using the sagittal projection line. For aMCC (Fig. 2 B), the center of the voxel projected to the posterior border of the genu of the corpus callosum, whereas its rotation was oriented parallel to the hippocampal axis, and its prescription along the foot–head direction was chosen to border the upper limits of the corpus callosum. In addition to, rPCC was oriented to follow individual orientation of the central sulcus centering the visible separation of fornix and corpus callosum for anterior–posterior orientation, whereas cPCC was centered individually at the suprasplenic sulcus centering the highest extension of the corpus callosum defined by the horizontal projection of the AC–PC plane. All ROIs were placed using respective voxels of 25 × 15 × 10 mm3 = 3.75 ml, which were shimmed using an optimized vendor-provided double-gradient echo shim technique and in which the power for achieving 90° flip angle was measured for optimal SNR acquirement using a double-spin echo method. After these voxelwise adjustments, STEAM VERSE sequences (128 averages; TR/TE/TM = 3000/20/10 ms; data size = 2048; bandwidth = 2800 Hz) were used for spectrum acquisitions, which took 6 min 36 s per ROI. Corresponding water reference spectra were measured with one average for eddy current correction and absolute metabolite concentration quantification. The sequence-specific basis set for data analysis was measured using an identical TR/TE/TM set (3000/20/10 ms) at 7T and included spectra from 20 major metabolites (acetate, alanine, aspartate, citrate, N-acetylaspartate, creatine, GABA, Glu, Gln, glucose, glycine, glycerophosphocholine, gluthatione, myo-inositol, phosphocreatine, lactate, phosphocholine, phosphorylethanolamine, succinate, and taurine).
Figure 2.
A, Landmarks for voxel placement in pgACC region: anterior border of genu of the corpus callosum perpendicular to AC–PC orientation and lower boundary of genu of the corpus callosum in AC–PC orientation. B, Landmarks for voxel placement in aMCC region: hippocampal axis and posterior border of genu of the corpus callosum perpendicular to AC–PC orientation.
Data analysis.
All spectra were analyzed using LCModel version 6.1.0 (Provencher, 1993). The metabolite concentrations were expressed using institutional units (i.u.). Standard criteria were applied for excluding spectra with poor quality: (i) CRLBs of GABA, Gln, and Glu > 20%, (ii) full-width half-maximal (FWHM) of all spectra >25 Hz, and (iii) SNRs < 8. The group wise outliers of GABA, Gln, and Glu concentrations in each of four ROIs, defined as greater than three times the interquartile range, from the remaining spectra were further detected using Boxplot in SPSS 18 for Windows (SPSS) and removed.
T1-weighted anatomical images (MPRAGE images divided by gradient echo images acquired using the scan parameters of TE = 2.73 ms, TR = 1340 ms, flip angle = 5°, bandwidth = 150 Hz/pixel, acquisition matrix = 320 × 320 × 224, isometric voxel size = 0.8 mm3; Van de Moortele et al., 2009) of subjects were segmented into GM, WM, and CSF intensity maps using the unified segmentation option in the SPM 8 software package (Welcome Trust Center for Neuroimaging, London, United Kingdom). A custom-built program written in MATLAB (MathWorks) was used to calculate the GM percentages within respective MRS voxels, which were applied in the following equation for correcting metabolite concentrations based on the estimated GM contributions for each region individually: MCco,i = MCave + Resi.
The corrected metabolite concentration for each of the four regions of the ith subject (MCco,i) is calculated adding the standardized residual (Resi), obtained from a linear regression between uncorrected metabolite concentrations and corresponding GM percentages of the single voxel across all regions and subjects, to the average level (MCave) of the uncorrected metabolite concentrations over all regions and subjects.
Intraclass correlation coefficient (ICC) toolbox in SPSS was applied to quantify the reproducibility of GABA, Gln, and Glu measurements by using the data of the 10 retest subjects. This method is used for assessing reliability of test-retest studies in which low values question reliability and a coefficient of 1.0 indicates perfect matches (Weir, 2005). Due to the removal of spectra with poor quality and concentration outliers, GABA, Gln, and Glu concentrations for all four ROIs were not available for all three scan visits in all subjects. For each retest subject, acceptable data from two of three scan visits was thus randomly selected, leaving 10 of 10 subjects having complete data for two different measurements, with the exception that only 7 of 10 subjects had at least two valid Gln data in cPCC.
For inclusion into the whole sample, the 10 retest subjects were entered with their respective mean values of valid spectra. Missing concentration values, due to the exclusion of individual spectra with dissatisfactory quality or classified outliers, were replaced by mean levels of each metabolite concentrations in the respective each region. In total four spectra were discarded for the analysis of GABA variance and six values for Gln across all regions and subjects corresponding to a total of 2% of all entries. A repeated-measures ANOVA with the factor region and subsequent paired t tests with significant threshold p = 0.05 as post hoc tests were applied to the full sample to detect the difference in GM contents within voxels across the four ROIs. A separate repeated-measures ANOVA was used to test the significance of two main effects (metabolite and region) and the interaction effect (metabolite × region) on metabolite concentrations. Significance threshold was set at p = 0.05. In the case of a significant main or interaction effect, paired t tests with the significance threshold p = 0.05 using Bonferroni correction for six multiple comparisons and bootstrapping (1000 samples) guided post hoc tests to systematically investigate the regional variations of the metabolite concentrations before and after correction. Similarly, the respective concentration ratios across the four regions were compared.
Multivariate linear regressions were used to test the correlation relationships between normalized voxel positions and metabolite concentrations to explore the effect of individual MRS voxel placement, and potential effects of daytime variations of acquisitions were evaluated by exploratively introducing a group factor dividing subjects scanned before (n = 23) and after 12 o'clock (n = 13) in repeated-measures ANOVA.
Results
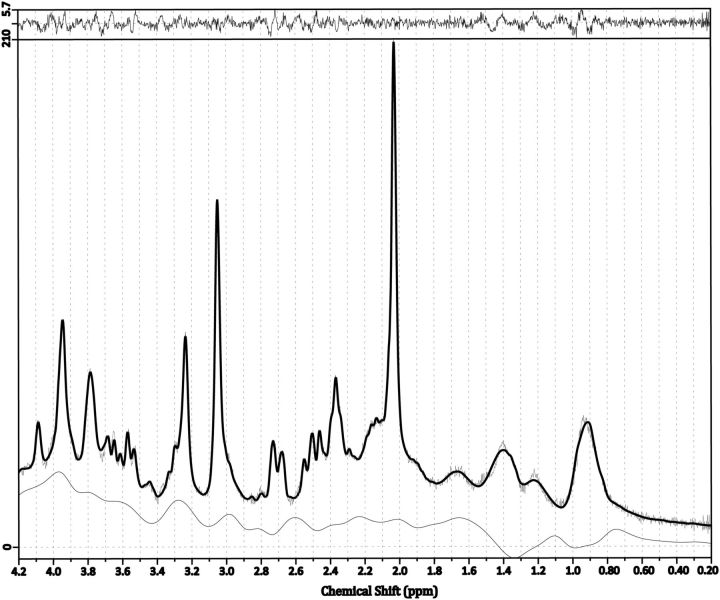
In all four regions, we were able to measure all three metabolites with sufficient accuracy with mean SNRs >30, mean FWHM values <10 Hz for all regions except pgACC (14.6 Hz), and CRLBs of ≤10% for GABA, 12% for Gln, and 4% for Glu approximately (Fig. 3; Table 1).
Figure 3.
An exemplary cPCC spectrum with a flat baseline, SNR 51 and FWHM 6.8 Hz.
Table 1.
Mean SNR ± standard deviation (SD), FWHM ± SD, and CRLB ± SD of GABA, Gln, and Glu in pgACC, aMCC, rPCC, and cPCC regions of all subjects
| SNR | FWHM (Hz) | CRLB (%) |
|||
|---|---|---|---|---|---|
| GABA | Gln | Glu | |||
| pgACC | 33 ± 6.8 | 14.6 ± 3.1 | 8.9 ± 3.3 | 9.0 ± 3.3 | 3.5 ± 0.9 |
| aMCC | 34 ± 5.9 | 9.6 ± 1.6 | 9.5 ± 2.0 | 10.6 ± 2.3 | 4.2 ± 1.9 |
| rPCC | 37 ± 4.5 | 8.8 ± 1.4 | 10.0 ± 1.8 | 12.0 ± 3.1 | 3.9 ± 0.9 |
| cPCC | 43 ± 5.8 | 9.0 ± 1.6 | 9.2 ± 1.7 | 11.7 ± 2.1 | 3.9 ± 0.8 |
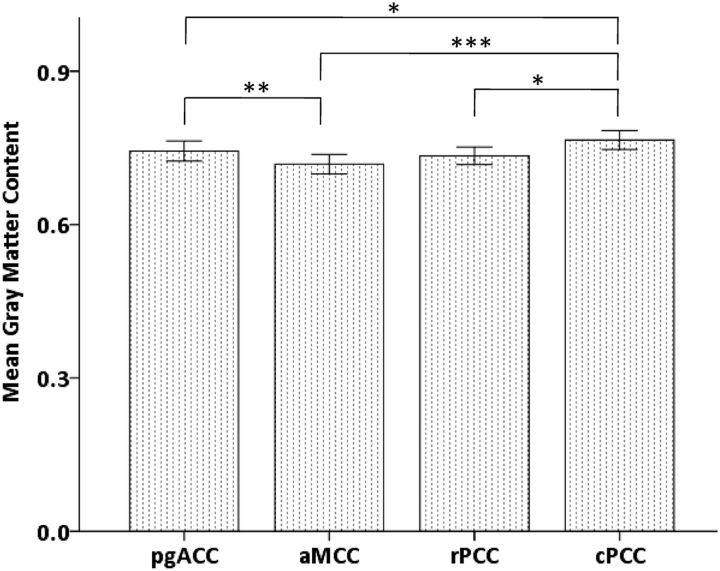
Investigation of interregional GM variations revealed a main effect of region using repeated-measures ANOVA (F(3,33) = 8.4, p < 0.001). The corresponding post hoc t tests indicated that mean GM content in the cPCC was significantly higher than that in the other three regions (cPCC vs pgACC, p = 0.035; cPCC vs aMCC, p < 0.001; cPCC vs rPCC, p = 0.011), and also a significant increase (p = 0.003) in pgACC toward aMCC (Fig. 4).
Figure 4.
Interregional differences in mean GM content with error bars indicating ± 2 standard error (SE) (***p < 0.001; **p < 0.01; *p < 0.05).
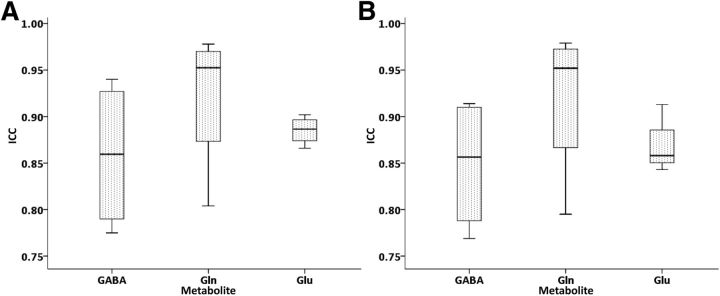
Retest reliability was assured by ICC values of >0.75 in all cases for all spectra satisfying the minimum criteria testing concentrations for two measurements at 2 separate days. We found comparable ICCs for pgACC (0.88), aMCC (0.89), rPCC (0.92), and cPCC (0.87) for all metabolites as well as similar ICCs for GABA (0.86), Gln (0.92), and Glu (0.89) across regions. After correction of GM content, these ICCs (mean 0.88; Fig. 5B) were unchanged compared with uncorrected concentrations (mean 0.89; Fig. 5 A).
Figure 5.
ICCs of the metabolite concentrations (GABA, Gln, and Glu) before (A) and after (B) correction for GM content in pgACC, aMCC, rPCC, and cPCC regions.
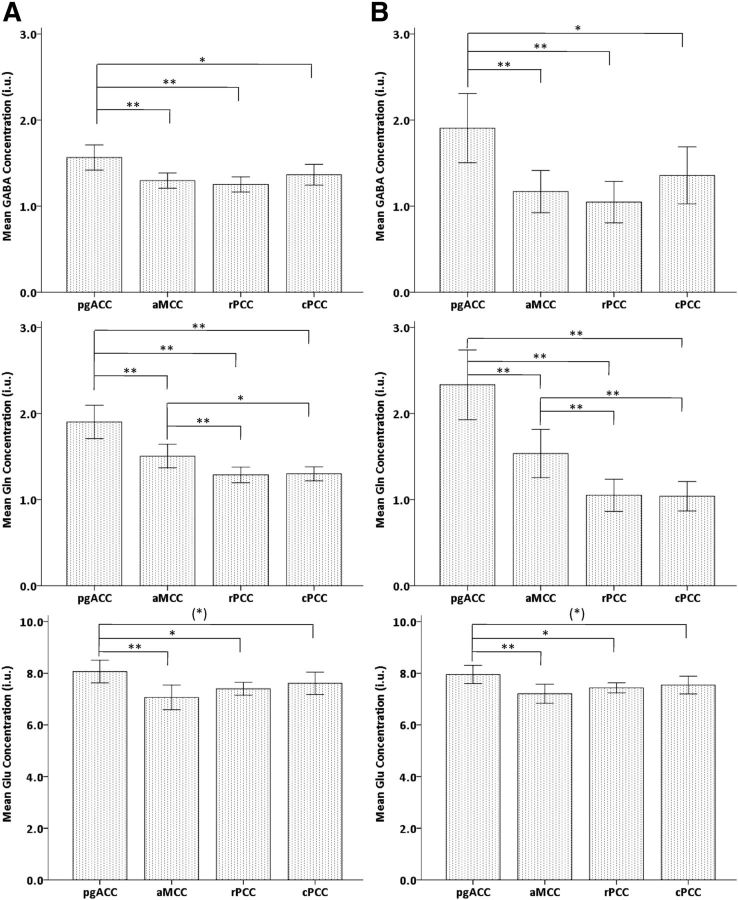
For metabolite concentrations without correction for GM content, repeated-measures ANOVA revealed significant main effect for region (F(3,33) = 7.9, p < 0.001) as well as a significant interaction effect (metabolite × region; F(6,30) = 4.9, p = 0.001). A direct comparison, correcting significance for six multiple comparisons (p < 0.008, applied for bootstrapped significance thresholds), revealed GABA in pgACC having significantly higher concentrations than those in the other regions (pgACC vs aMCC, T = 3.022, p = 0.002; pgACC vs rPCC, T = 3.585, p = 0.001), whereas the increase in pgACC vs cPCC did not survive correction for six multiple comparisons (T = 2.218, p = 0.029). Gln in pgACC also showed significantly higher concentrations than those in aMCC (T = 3.161, p = 0.003); in rPCC (T = 5.406, p = 0.001); and in cPCC (T = 6.156, p = 0.001). In addition, Gln concentrations in aMCC were significantly higher than those in rPCC (T = 2.812, p = 0.006) and also significantly higher than those in cPCC (T = 2.464, p = 0.020) at uncorrected p < 0.05 level. Glu concentrations in pgACC were significantly higher than those in aMCC (T = 3.332, p = 0.001), significantly higher than those in rPCC (T = 2.673, p = 0.010) at uncorrected p < 0.05 level, and tended to be higher than those in cPCC (T = 1.617, p = 0.097; Fig. 6A). When metabolite concentrations were corrected for GM content, results remained largely consistent, but the Gln concentrations after the correction for GM content in aMCC became significantly higher toward cPCC (Fig. 6 B). Accordingly, the repeated-measures ANOVA again showed significant main effect for region (F(3,33) = 9.9, p < 0.001) and a significant interaction effect (metabolite × region; F(6,30) = 4.1, p = 0.004).
Figure 6.
Mean levels of metabolite concentrations of GABA (top), Gln (middle), and Glu (bottom) before (A) and after (B) correction for the GM content in pgACC, aMCC, rPCC, and cPCC regions with error bars indicating ± 2 SE [**p < 0.01; * p < 0.05; (*)p < 0.1]. The metabolite concentrations are expressed in i.u.
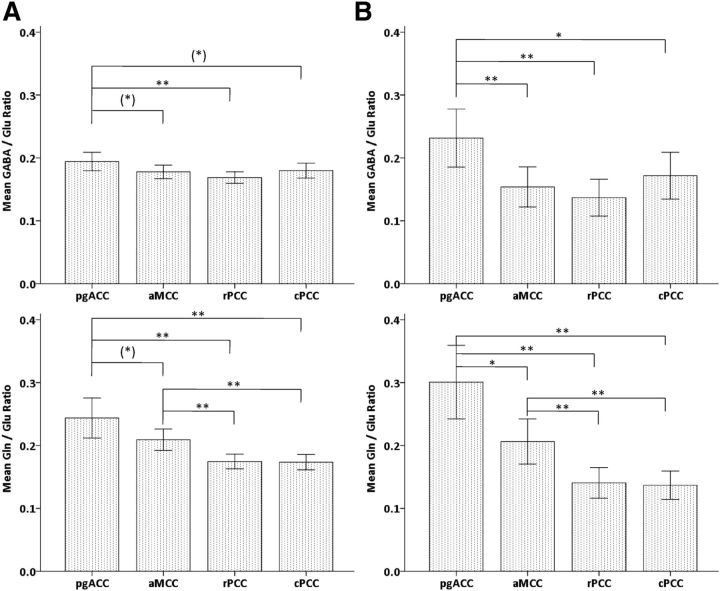
Relative ratios, representing variations in the inhibition/excitation balance (GABA/Glu) or measures of Gln cycling (Gln/Glu) across regions were comparable for GABA/Glu and Gln/Glu ratios before and after correction, but two trend-wise increases in pgACC toward aMCC for uncorrected Gln/Glu ratios and in pgACC toward cPCC for uncorrected GABA/Glu ratios became significant at uncorrected p < 0.05 level for corrected ratios. Moreover, GABA/Glu ratios before and after correction in pgACC toward aMCC varied from a trend-wise increase to a significant increase correcting for six multiple comparisons. As a main finding, we here observed increased GABA/Glu ratios in pgACC compared with all other regions, whereas a gradual decline in Gln/Glu ratios was observed along a rostrocaudal gradient (Fig. 7).
Figure 7.
Mean levels of metabolite concentration ratios for inhibition/excitation balance (GABA/Glu, top) and indirect Gln cycling (Gln/Glu, bottom) by using metabolite concentrations before (A) and after (B) correction for the GM content in pgACC, aMCC, rPCC, and cPCC regions with error bars indicating ± 2 SE [**p < 0.01; *p < 0.05; (*)p < 0.1].
Multivariate linear regression revealed no major effects of regional voxel positions on metabolite concentrations. There was also no clear evidence for an influence of the time of acquisition. Neither for main effect of group (F(1) = 0.3, p = 0.586) nor for an interaction of metabolite × region × group (morning or afternoon scans; F(6,29) = 2.0, p = 0.092) significance could be accepted when adding daytime of acquisition as an exploratory group factor to the ANOVA.
Discussion
In this study, we showed that single voxel 1H-MRS using STEAM VERSE with short TE/TM at 7T led to solid results based on data with high retest reliability, when standard spectral quality criteria were applied. We for the first time obtained reliable spectra across different anatomical CC partitions. This enabled us to find robust within-subject regional variations in absolute and relative concentrations of GABA, Gln, and Glu, even under consideration of potential effects of GM content variations across the CC.
So far, metabolic imaging studies using MRS were highly limited in their interpretation of observables in regard to specific cellular compartments. Although contributions of GM and WM could, in principle, be discerned by considering the individual single-voxel compositions, we could not infer whether transmitter concentrations reflect intracellular or synaptic pools, or are all attributable to neurons. This is of specific concern, given that both GABA and Glu are converted from Gln, synthesized almost exclusively in neighboring astrocytes. In the case of tripartite synapses, synaptic Glu is taken up into the astrocyte and then converted into the non-neurotoxic intermediate Gln. Although two recent pharmacological pilot studies in bipolar depression (Brennan et al., 2010) and major depressive disorder (Salvadore et al., 2012) were important to substantiate the role of differential assessment of Glu and Gln, they were very long, with acquisition time over 1 h, and particularly in the second study, regionally quite imprecise. Overall, no evidence currently exists, in which extent the expected glial toward neuronal contribution could be set into the context of glutamatergic receptor densities.
Here, we showed that metabolite concentrations and ratios indeed covary with known receptor distributions, when anatomically defined subregions are investigated. For the distribution of AMPA receptors, Palomero-Gallagher et al. (2009) reported a gradual decline from above-average densities in pgACC toward average levels in aMCC, and following in caudal direction, even subaverage densities in the regions around the central sulcus. Although ketamine is an NMDA receptor antagonist, its relevant antidepressant action is thought to be mainly mediated via activation/translocation of AMPA receptors, similar to other glutamate-modulating agents, such as riluzole or lamotrigine (Du et al., 2007). The suggestion speaks in favor for the observed treatment effects in pgACC, mirrored by increased Gln cycling and predicted by local estimates of Gln (Salvadore et al., 2012). Although this is still a very indirect connection, it has to be considered as the first link between local metabolite concentration and a receptor subtype density related to pharmacologically increased metabolite levels and Gln turnover. Our method here is evidenced by its robust estimation for comparably small and thus anatomically specific ROIs at very short acquisition times, allowing for assessment of several regions in one scanning session. Another major advantage is the parallel acquisition of all three metabolites with 95% success rates, thus enabling estimation of Gln/Glu ratios and inhibitory GABAergic mechanisms simultaneously. As described above for glutamatergic neurotransmission, a link between GABA concentrations and their relevance for actual synaptic GABAergic activity was currently not established in humans. Increases in pgACC GABA as found here, reflect the higher GABAB receptor densities toward the other three cingulate compartments (Palomero-Gallagher et al., 2009). Conversely, GABA concentrations are inversely correlated with GABAA receptor densities, which present considerably lower concentrations in pgACC than in the remaining cingulate regions (Palomero-Gallagher et al., 2009). Thus, GABA release in pgACC would mainly result in slow synaptic inhibition via GABAB receptors, whereas mid-CC and PCC would be subject to the fast component of GABAergic inhibition, which is mediated to a greater extent by GABAA receptors. Interestingly, activation of presynaptic GABAB receptors suppresses multivesicular release and thus decreases synaptic Glu concentration (Chalifoux and Carter, 2010), which would explain why we found the highest GABA/Glu ratios in pgACC. This characteristic ratio, which next to its receptor fingerprints, would indicate that pgACC is subject to a higher degree of inhibition than mid-CC or PCC are, according to its functional characterization as a default mode network region with high baseline activity. Indeed, Northoff et al. (2007) could show that across subjects, the amount of negative blood oxygen-level-dependent responses correlates with regional GABA concentrations in pgACC. Although a direct translation of between-subject transmitter variances to variations across the brain needs be treated as carefully as the above mentioned line of evidence for AMPA receptor-mediated increases in Gln cycling, it needs however be noted, that we here found a similar effect of covariance of markers of an excitation/inhibition balance and the known regional baseline mechanisms of task-induced activations and deactivations.
Although direct pharmacological follow up studies are needed to elaborate the above depicted correlations, a second main achievement of this study is the definition of robustness of the multivoxel, multimetabolite protocol. As 7T scanners recently became available at many institutes world-wide, our findings are encouraging that similar protocols can be applicable in such studies.
2D J-resolved spectroscopy at 3T was also applied in the pgACC region to measure GABA, Gln, and Glu (Walter et al., 2009), although long acquisition times were not suitable for our multivoxel acquisitions. In comparison, our metabolite concentrations relative to creatine (Cr) in pgACC are similar to this literature's result: Gln/Cr (0.35 vs 0.34), Glu/Cr (1.47 vs 1.35), and GABA/Cr (0.29 vs 0.21). In addition to, we found highly reliable metabolite estimates in our study. However, as a cautionary remark, this applies only to spectra fulfilling the quality criteria. In principle, the removal of outliers would be problematic. However, for the retest dataset, only 2 of 120 spectra were excluded.
Because we found a considerable variation of GM contents across our ROIs, the correction for voxel composition should be considered crucial. However, the only difference in our results was that after correction, trend-wise effects reached significance. Because there is no gold-standard method allowing the correction of metabolite concentrations for tissue compositions, to avoid false assumptions on the actual variance contribution, we decided for a linear regression method to correct metabolite concentrations based on the estimates of the influence of GM variations. Although we expected a potential increase in measurement reliability for the MRS values after GM correction, the a priori high values however were not changed. If another potentially better correction method would be applied in the future, similar inclusion of reliability assessment might be considered to prove its superiority accordingly.
Correction of metabolite concentrations becomes more difficult when modeling the effects of GM, WM, and CSF together. However, metabolites are found at much lower concentrations in CSF (Lynch et al., 1993; Stephenson et al., 2011). Additionally, the mean contribution of CSF segments to the voxel content was no more than 5%. Therefore, we can exclude significant CSF contributions to metabolite signal in this study.
A critical limitation of our study is the distinction of anatomical boundaries in the PCC. Several relatively small subregions with opposing receptor fingerprints lie in direct vicinity, making it difficult to measure them individually with our voxel size. Therefore, a careful comparison of our metabolite profiles with previously reported receptor variations would lead to expect more variation between the posterior voxels. Next to integration of different regions based on mere vicinity, one may further accuse the interindividual variation in gyrification, which of course could not be sufficiently accounted for by visual voxel prescription in the posterior part, although this is less problematic for the more distant anterior subunits (Vogt et al., 1995). A systematic variation of individual voxel placement could however not be found to support such a confounder. This variability should however not be confused with functional heterogeneity of the PCC region. Increased GABA/Glu ratios together with highest Gln cycling in pgACC would also be expected in the PCC, if the actual location of the ROI was more ventral and caudal, toward the retrosplenial–precuneus portion. In fact, our caudal PCC voxel was located quite dorsally, not overlapping with the posterior default mode node in the PCC (Yu et al., 2011). Although we rejected an influence of daytime on the systematic variations of regional metabolite measures, one should cautiously acknowledge that at larger sample sizes, such subtle mechanisms, which e.g., have been reported on other physiological assessments as well as for severe sleeping disorders (Saude et al., 2007; O'Donoghue et al., 2012) may exist and would have better been avoided using a more rigid study design with fixed acquisition times.
In conclusion, we demonstrated the regional covariation of local concentrations of GABA, Glu, and Gln with previously reported receptor variations using a robust and efficient 7T MRS protocol. Gradual decline of Gln concentration paralleled the distribution of AMPA receptor densities, providing evidence from cross-regional variances which converges with findings of longitudinal changes after AMPA modulating drugs. Strongly increased GABA concentrations in pgACC, as a representative region of the default mode network were paralleled by lowest excitation/inhibition balance. Thus, high GABA concentrations should be representative of the regions potential to deactivate under certain task conditions. More work will be needed to directly link the here observed cross-regional variance to within- and between-subject metabolite variations as seen in health and disease.
Footnotes
This work is supported by Deutsche Forschungsgemeinschaft (DFG: Wa2673/3-1) and the federal state of Saxony-Anhalt (CBBS).
The authors declare no competing financial interests.
References
- Bartha R, Drost DJ, Menon RS, Williamson PC. Comparison of the quantification precision of human short echo time 1H spectroscopy at 1.5 and 4.0 Tesla. Magn Reson Med. 2000;44:185–192. doi: 10.1002/1522-2594(200008)44:2<185::AID-MRM4>3.0.CO;2-V. [DOI] [PubMed] [Google Scholar]
- Brennan BP, Hudson JI, Jensen JE, McCarthy J, Roberts JL, Prescot AP, Cohen BM, Pope HG, Jr, Renshaw PF, Ongür D. Rapid enhancement of glutamatergic neurotransmission in bipolar depression following treatment with riluzole. Neuropsychopharmacology. 2010;35:834–846. doi: 10.1038/npp.2009.191. [DOI] [PMC free article] [PubMed] [Google Scholar]
- Bush G, Luu P, Posner MI. Cognitive and emotional influences in anterior cingulate cortex. Trends Cogn Sci. 2000;4:215–222. doi: 10.1016/S1364-6613(00)01483-2. [DOI] [PubMed] [Google Scholar]
- Chalifoux JR, Carter AG. GABAB receptors modulate NMDA receptor calcium signals in dendritic spines. Neuron. 2010;66:101–113. doi: 10.1016/j.neuron.2010.03.012. [DOI] [PMC free article] [PubMed] [Google Scholar]
- Devinsky O, Morrell MJ, Vogt BA. Contributions of anterior cingulate cortex to behaviour. Brain. 1995;118:279–306. doi: 10.1093/brain/118.1.279. [DOI] [PubMed] [Google Scholar]
- Du J, Suzuki K, Wei Y, Wang Y, Blumenthal R, Chen Z, Falke C, Zarate CA, Jr, Manji HK. The anticonvulsants lamotrigine, riluzole, and valproate differentially regulate AMPA receptor membrane localization: relationship to clinical effects in mood disorders. Neuropsychopharmacology. 2007;32:793–802. doi: 10.1038/sj.npp.1301178. [DOI] [PubMed] [Google Scholar]
- Elywa M, Mulla-Osman S, Godenschweger F, Speck O. Proton magnetic resonance spectroscopy in deep human brain structures at 7 T. J Appl Spectrosc. 2012;79:120–125. doi: 10.1007/s10812-012-9572-8. [DOI] [Google Scholar]
- Horn DI, Yu C, Steiner J, Buchmann J, Kaufmann J, Osoba A, Eckert U, Zierhut KC, Schiltz K, He H, Biswal B, Bogerts B, Walter M. Glutamatergic and resting-state functional connectivity correlates of severity in major depression- the role of pregenual anterior cingulate cortex and anterior insula. Front Syst Neurosci. 2010;4:33. doi: 10.3389/fnsys.2010.00033. [DOI] [PMC free article] [PubMed] [Google Scholar]
- Kaiser LG, Schuff N, Cashdollar N, Weiner MW. Age-related glutamate and glutamine concentration changes in normal human brain: 1H MR spectroscopy study at 4 T. Neurobiol Aging. 2005;26:665–672. doi: 10.1016/j.neurobiolaging.2004.07.001. [DOI] [PMC free article] [PubMed] [Google Scholar]
- Lüsebrink F, Wollrab A, Speck O. Cortical thickness determination of the human brain using high resolution 3T and 7T MRI data. Neuroimage. 2013;70:122–131. doi: 10.1016/j.neuroimage.2012.12.016. [DOI] [PubMed] [Google Scholar]
- Lynch J, Peeling J, Auty A, Sutherland GR. Nuclear magnetic resonance study of cerebrospinal fluid from patients with multiple sclerosis. Can J Neurol Sci. 1993;20:194–198. [PubMed] [Google Scholar]
- Mayer D, Spielman DM. Detection of glutamate in the human brain at 3 T using optimized constant time point resolved spectroscopy. Magn Reson Med. 2005;54:439–442. doi: 10.1002/mrm.20571. [DOI] [PubMed] [Google Scholar]
- McLean MA, Woermann FG, Barker GJ, Duncan JS. Quantitative analysis of short echo time (1)H-MRSI of cerebral gray and white matter. Magn Reson Med. 2000;44:401–411. doi: 10.1002/1522-2594(200009)44:3<401::AID-MRM10>3.0.CO;2-W. [DOI] [PubMed] [Google Scholar]
- Mescher M, Merkle H, Kirsch J, Garwood M, Gruetter R. Simultaneous in vivo spectral editing and water suppression. NMR Biomed. 1998;11:266–272. doi: 10.1002/(SICI)1099-1492(199810)11:6<266::AID-NBM530>3.3.CO;2-A. [DOI] [PubMed] [Google Scholar]
- Northoff G, Walter M, Schulte RF, Beck J, Dydak U, Henning A, Boeker H, Grimm S, Boesiger P. GABA concentrations in the human anterior cingulate cortex predict negative BOLD responses in fMRI. Nat Neurosci. 2007;10:1515–1517. doi: 10.1038/nn2001. [DOI] [PubMed] [Google Scholar]
- O'Donoghue FJ, Wellard RM, Rochford PD, Dawson A, Barnes M, Ruehland WR, Jackson ML, Howard ME, Pierce RJ, Jackson GD. Magnetic resonance spectroscopy and neurocognitive dysfunction in obstructive sleep apnea before and after CPAP treatment. Sleep. 2012;35:41–48. doi: 10.5665/sleep.1582. [DOI] [PMC free article] [PubMed] [Google Scholar]
- Palomero-Gallagher N, Vogt BA, Schleicher A, Mayberg HS, Zilles K. Receptor architecture of human cingulate cortex: evaluation of the four-region neurobiological model. Hum Brain Mapp. 2009;30:2336–2355. doi: 10.1002/hbm.20667. [DOI] [PMC free article] [PubMed] [Google Scholar]
- Provencher SW. Estimation of metabolite concentrations from localized in vivo proton NMR spectra. Magn Reson Med. 1993;30:672–679. doi: 10.1002/mrm.1910300604. [DOI] [PubMed] [Google Scholar]
- Ryner LN, Sorenson JA, Thomas MA. Localized 2D J-resolved 1H MR spectroscopy: strong coupling effects in vitro and in vivo. Magn Reson Imaging. 1995;13:853–869. doi: 10.1016/0730-725X(95)00031-B. [DOI] [PubMed] [Google Scholar]
- Salvadore G, van der Veen JW, Zhang Y, Marenco S, Machado-Vieira R, Baumann J, Ibrahim LA, Luckenbaugh DA, Shen J, Drevets WC, Zarate CA., Jr An investigation of amino-acid neurotransmitters as potential predictors of clinical improvement to ketamine in depression. Int J Neuropsychopharmacol. 2012;15:1063–1072. doi: 10.1017/S1461145711001593. [DOI] [PMC free article] [PubMed] [Google Scholar]
- Saude EJ, Adamko D, Rowe BH, Marrie T, Sykes BD. Variation of metabolites in normal human urine. Metabolomics. 2007;3:439–451. doi: 10.1007/s11306-007-0091-1. [DOI] [Google Scholar]
- Schulte RF, Trabesinger AH, Boesiger P. Chemical-shift-selective filter for the in vivo detection of J-coupled metabolites at 3T. Magn Reson Med. 2005;53:275–281. doi: 10.1002/mrm.20362. [DOI] [PubMed] [Google Scholar]
- Srinivasan R, Cunningham C, Chen A, Vigneron D, Hurd R, Nelson S, Pelletier D. TE-averaged two-dimensional proton spectroscopic imaging of glutamate at 3 T. Neuroimage. 2006;30:1171–1178. doi: 10.1016/j.neuroimage.2005.10.048. [DOI] [PubMed] [Google Scholar]
- Stephenson MC, Gunner F, Napolitano A, Greenhaff PL, Macdonald IA, Saeed N, Vennart W, Francis ST, Morris PG. Applications of multi-nuclear magnetic resonance spectroscopy at 7T. World J Radiol. 2011;3:105–113. doi: 10.4329/wjr.v3.i4.105. [DOI] [PMC free article] [PubMed] [Google Scholar]
- Terpstra M, Ugurbil K, Gruetter R. Direct in vivo measurement of human cerebral GABA concentration using MEGA-editing at 7 Tesla. Magn Reson Med. 2002;47:1009–1012. doi: 10.1002/mrm.10146. [DOI] [PubMed] [Google Scholar]
- Tkác I, Andersen P, Adriany G, Merkle H, Ugurbil K, Gruetter R. In vivo 1H NMR spectroscopy of the human brain at 7 T. Magn Reson Med. 2001;46:451–456. doi: 10.1002/mrm.1213. [DOI] [PubMed] [Google Scholar]
- Van de Moortele P, Auerbach EJ, Olman C, Yacoub E, Uğurbil K, Moeller S. T1 weighted brain images at 7 Tesla unbiased for proton density, T2* contrast and RF coil receive B1 sensitivity with simultaneous vessel visualization. Neuroimage. 2009;46:432–446. doi: 10.1016/j.neuroimage.2009.02.009. [DOI] [PMC free article] [PubMed] [Google Scholar]
- Vogt BA, Palomero-Gallagher N. Cingulate cortex. In: Paxinos G, Mai JK, editors. The human nervous system. Paris: Elsevier; 2012. pp. 943–987. [Google Scholar]
- Vogt BA, Nimchinsky EA, Vogt LJ, Hof PR. Human cingulate cortex: surface features, flat maps, and cytoarchitecture. J Comp Neurol. 1995;359:490–506. doi: 10.1002/cne.903590310. [DOI] [PubMed] [Google Scholar]
- Walter M, Henning A, Grimm S, Schulte RF, Beck J, Dydak U, Schnepf B, Boeker H, Boesiger P, Northoff G. The relationship between aberrant neuronal activation in the pregenual anterior cingulate, altered glutamatergic metabolism, and anhedonia in major depression. Arch Gen Psychiatry. 2009;66:478–486. doi: 10.1001/archgenpsychiatry.2009.39. [DOI] [PubMed] [Google Scholar]
- Weir JP. Quantifying test-retest reliability using the intraclass correlation coefficient and the SEM. J Strength Cond Res. 2005;19:231–240. doi: 10.1519/00124278-200502000-00038. [DOI] [PubMed] [Google Scholar]
- Yang S, Hu J, Kou Z, Yang Y. Spectral simplification for resolved glutamate and glutamine measurement using a standard STEAM sequence with optimized timing parameters at 3, 4, 4.7, 7, and 9.4T. Magn Reson Med. 2008;59:236–244. doi: 10.1002/mrm.21463. [DOI] [PubMed] [Google Scholar]
- Yu C, Zhou Y, Liu Y, Jiang T, Dong H, Zhang Y, Walter M. Functional segregation of the human cingulate cortex is confirmed by functional connectivity based neuroanatomical parcellation. Neuroimage. 2011;54:2571–2581. doi: 10.1016/j.neuroimage.2010.11.018. [DOI] [PubMed] [Google Scholar]


