

Abstract
Neuronal precursors produced in the subventricular zone throughout an animal's life migrate tangentially along the rostral migratory stream and, once in the olfactory bulb (OB), turn to migrate radially to the bulbar layers, where they differentiate into interneurons. Despite extensive investigations, it has remained largely unknown whether the same molecular mechanisms control OB neurogenesis during early postnatal development and in adulthood. In this study, we show that the extracellular matrix glycoprotein tenascin-R (TNR) is produced in the granule cell layer of the OB and that its expression increases during postnatal development. Time-lapse video imaging and morphological analyses revealed that a lack of TNR decreases the radial migration of neuronal precursors in the adult, but not in the developing OB. A lack of TNR also reduces spine development of newborn neurons in adult mice. To understand the functional consequences of a lack of TNR, we performed electrophysiological and behavioral studies on young and adult mice. Electrophysiological recordings showed that mitral cells, the target cells of newly generated interneurons, receive reduced spontaneous and evoked inhibitory activity in adult, but not young, TNR knock-out mice. Moreover, the synchronized activity of mitral cells was decreased in the OB of adult TNR knock-out mice. Behavioral studies revealed that the lower numbers of newborn interneurons in the adult OB induce alterations in short-term odor memory. Our results indicate that TNR modulates adult but not developmental neurogenesis in the OB and also highlight that the regulation of OB neurogenesis can vary during an animal's lifetime.
Introduction
In the rodent forebrain, olfactory bulb (OB) interneurons are continuously replenished throughout an animal's lifetime. While some bulbar interneurons are produced during embryonic development (Wichterle et al., 2001; Vergaño-Vera et al., 2006), the majority of interneuronal production peaks during the perinatal period and continues throughout adulthood (Altman, 1969; Lemasson et al., 2005; Batista-Brito et al., 2008). In the postnatal period, stem cells in the subventricular zone (SVZ) of the lateral ventricle give rise to transit amplifying cells, which in turn produce neuroblasts (Kriegstein and Alvarez-Buylla, 2009). The neuroblasts migrate tangentially in the rostral migratory stream (RMS) and, when they reach the core of the OB, turn to migrate radially toward the granule cell layer (GCL) and glomerular layer (GL) of the OB (Kriegstein and Alvarez-Buylla, 2009). These cells mature in the OB, form functional synapses with principal neurons, and modulate some but not all odor-associated behaviors (Imayoshi et al., 2008; Breton-Provencher et al., 2009; Lazarini and Lledo, 2011; Mandairon et al., 2011; Breton-Provencher and Saghatelyan, 2012).
Both extrinsic and intrinsic mechanisms have been shown to control and modulate the various stages of postnatal neurogenesis. A multitude of molecular cues and signaling pathways have been identified and implicated in the orchestration of neurogenesis (Lledo et al., 2006). However, it is not clear whether these molecular cues and signaling pathways are equally involved in regulating both perinatal and adult OB neurogenesis or whether some of the processes governing postnatal neurogenesis are regulated in different ways during distinct periods of an animal's life. Importantly, structural and functional differences between bulbar interneurons born at different periods during an animal's life have been observed (Lemasson et al., 2005; Saghatelyan et al., 2005; Kelsch et al., 2008; Nissant et al., 2009; Breton-Provencher and Saghatelyan, 2012). For example, the bulbar interneurons born during the perinatal period are predominantly located in the superficial GCL, whereas those born during adulthood are preferentially located in the deep GCL (Lemasson et al., 2005; Imayoshi et al., 2008). It is thus conceivable that the mechanisms controlling the targeting of newborn interneurons during different postnatal periods are distinct.
The extracellular matrix glycoprotein tenascin-R (TNR) affects the arrival of newborn interneurons in the adult OB (Saghatelyan et al., 2004), and in some regions of the nervous system (e.g., the retina) TNR expression begins postnatally at 1 week, peaks at 2–3 weeks, and then remains stable throughout adulthood (Bartsch et al., 1993). We thus hypothesized that TNR might specifically regulate adult, but not perinatal, OB neurogenesis. We used morphological, time-lapse video imaging and electrophysiological approaches to show that a lack of TNR reduces the radial migration of neuroblasts in the OB, decreases the spine density of newborn neurons, and diminishes the inhibition and synchronized activity of mitral cells in the adult but not perinatal OB. Using a behavioral approach we show that these alterations lead to a reduced short-term memory in adult, but not young mice. The combined observations indicate that the mechanisms controlling postnatal neurogenesis are distinct at different periods during an animal's lifetime.
Materials and Methods
Animals
Four-, 7-, 15-, 25–30-, and 60–120-d-old TNR wild-type (+/+) and TNR knock-out (−/−) mice (Weber et al., 1999) were obtained from the breeding of TNR heterozygous animals backcrossed to C57BL/6 mice for at least 10 generations. All experiments were approved by the Université Laval animal protection committee. The mice were kept on a 12 h light/dark cycle at a constant temperature (22°C) with food and water available ad libitum.
Immunohistochemistry and bromodeoxyuridine labeling
Immunohistochemistry and bromodeoxyuridine (BrdU) labeling were performed as described previously (Snapyan et al., 2009; Bozoyan et al., 2012). Briefly, the mice were deeply anesthetized and transcardially perfused with 0.9% NaCl followed by 4% paraformaldehyde (PFA). The brains were post-fixed in 4% PFA overnight at 4°C, and 40-μm-thick free-floating vibratome (VT 1000S; Leica) sections were incubated with a mouse anti-TNR (1:50; R&D Systems) monoclonal antibody and then with an Alexa Fluor-conjugated anti-mouse 488 secondary antibody (1:1000; Life Technologies).
The DNA synthesis marker BrdU (Sigma) was dissolved in sterile 0.9% NaCl and 0.4N NaOH. Ten-day-old [postnatal day 10 (P10)] mice were injected intraperitoneally with a 25 mg/kg BrdU solution. The adult mice were injected with 50 mg/kg BrdU. To study the proliferation of neuronal precursors during the perinatal period, P10 TNR+/+ and TNR−/− mice received a single BrdU injection and were killed 1 h later. To study the arrival of neuroblasts in the OB, P10 mice were given two BrdU injections with an interval of 2 h and were killed 5 d later. To quantify the number of newborn interneurons integrating into the OB of TNR+/+ and TNR−/− mice, two BrdU pulses with an interval of 2 h were administered at P10 or at P60, and the mice were killed 21 d later, allowing the labeled cells in the SVZ to migrate to the OB and integrate into the GCL and GL.
Serial coronal sections from the anterior tip of the OB to the SVZ were BrdU immunostained as described previously (Snapyan et al., 2009). Briefly, the sections were treated with 2N HCl for 40 min at 37°C to denature the DNA. They were then incubated overnight with a rat anti-BrdU monoclonal antibody (1:500; Serotec) at 4°C in 0.2% Triton-X supplemented with 4% BSA, then with secondary anti-rat biotinylated antibody (1:500; ThermoScientific) for 3 h at room temperature, and finally with avidin-biotin (ABC kit, Vectastain Elite; Vector Laboratories). Labeling was revealed using 0.05% diaminobenzidine in the presence of H2O2. The sections were mounted, dried, dehydrated in a series of alcohol baths, and counterstained with cresyl violet to measure the areas of the SVZ, RMS, RMS of the OB (RMSOB), GCL, and GL. Sections were analyzed using an upright BX51 microscope equipped with a motorized stage (Olympus).
Western blot analysis
OBs from P4, P7, P15, P30, and P60 mice were collected and homogenized in lysis buffer (50 mm HCl, 1 mm EDTA, 1 mm EGTA, 1 mm sodium orthovanadate, 50 mm sodium fluoride, 5 mm sodium pyrophosphate, 10 mm sodium β-glycerophosphate, 0.1% 2-mercaptoethanol, and 1% Triton X-100, pH 7.5) containing Protease Inhibitor Cocktail Set III (Calbiochem). The homogenates were sonicated and then centrifuged at 13,000 × g at 4°C for 20 min to remove insoluble material. The protein concentration in each supernatant was quantified, 60 μg of protein was separated on NuPage 4–12% Bis-Tris gels (Life Technologies), and the bands were transferred to a nitrocellulose membrane (GE Healthcare). The membrane was cut horizontally into two parts at ∼60 kDa. The upper part was incubated with the mouse anti-TNR antibody (1:100), and the lower was incubated with a mouse anti-actin antibody (1:3000; Cedarlane). The membranes were then incubated with an anti-mouse HRP-conjugated secondary antibody, and the bands were revealed using ECL (GE Healthcare). Two bands (180 and 160 kDa) corresponding to the two isoforms of TNR were detected. TNR expression was normalized to that of actin in the corresponding sample.
Stereotaxic injections
To study neuroblast migration and maturation, GFP-encoding lentiviruses or retroviruses were injected into the RMS of P10 and P60 TNR+/+ and TNR−/− mice at the following coordinates (in millimeters, with respect to the bregma): for P10, anterior–posterior 2.05, medial–lateral 0.65, and dorsal–ventral 2.7; and for P60, anterior–posterior 2.55, medial–lateral 0.82, and dorsal–ventral 3.15. To study dendritic arborization and spine density of newborn cells in both genotypes, a GFP-expressing lentivirus was injected into the RMS, and the mice were killed 21 d later. To explore whether possible changes in the spine density in TNR−/− mice result from the direct effect of TNR on the spine development of newborn cells or are a consequence of affected migration, a GFP-expressing lentivirus was injected into the RMS of TNR+/+ mice and 10 d later anti-TNR antibodies (100 μg/ml, 500 nl per injection site; R&D Systems) were injected into the OB at the following coordinates (in millimeters, with respect to the bregma): anterior–posterior 4.70, medial–lateral 1.5, and dorsal–ventral 0.45; and anterior–posterior 5.3, medial–lateral 1.2, and dorsal–ventral 0.6, respectively. The mice were perfused following an additional 4 d, and the spine density of newborn granule cells was analyzed as described below in morphological analysis. To perform time-lapse video imaging of tangential and radial migration in the OB of TNR+/+ and TNR−/− mice, GFP-encoding retroviruses were injected into the RMS, and horizontal 250-μm-thick slices were prepared 7 d later as described below in slice preparation and time-lapse video imaging.
Morphological analysis
To analyze the dendritic arborization and spine density of newborn cells, mice of both genotypes were deeply anesthetized and were perfused transcardially with 4% PFA. The brains were then postfixed overnight in 4% PFA at 4°C. The OBs were embedded in a block of 4% agar, and horizontal 100-μm-thick slices were prepared. The slices were mounted and coverslipped with fluorescence mounting medium (Dako). Images of GFP-labeled granule cells were acquired using a 60× oil emersion objective on a FV1000 confocal microscope equipped with argon 488 nm, helium-neon 543 nm, and helium-neon 633 nm lasers (Olympus). For analysis of spine density of GFP-labeled newborn cells, part of the distal dendrites projecting toward the external plexiform layer was randomly chosen, and images were reacquired using a 60× oil emersion objective with a 3× zoom. Images were analyzed manually using Fluoview software (Olympus) to measure the lengths of the primary and secondary dendrites. Spine density was calculated by counting the number of spines on a given length of dendrite.
In the TNR+/+ mice that received injections of mouse anti-TNR antibodies in the adult OB, 10 d after infection of neuroblasts in the RMS with GFP-encoding lentivirus, the animals were perfused transcardially and the sections were incubated with anti-mouse Alexa Fluor 568 secondary antibodies. The spine density of newborn granule cells was calculated in the injection sites of anti-TNR antibody [near injection site (NIS)] and compared with spine density in the regions located far away from the injection site (FIS). In control experiments, Alexa Fluor 568 secondary antibody was injected instead of anti-TNR antibody.
Slice preparation and time-lapse video imaging
Acute horizontal 250-μm-thick slices were prepared for electrophysiological recordings and time-lapse video imaging of cell migration in the OB of TNR+/+ and TNR−/− mice. The adult mice were first perfused transcardially with ice-cold sucrose-based artificial CSF (ACSF) containing the following (in mm): 250 sucrose, 3 KCl, 0.5 CaCl2, 3 MgCl2, 25 NaHCO3, 1.25 NaHPO4, and 10 glucose. The brains were rapidly removed and immersed in the solution used for the transcardiac perfusion. Horizontal slices of the OBs were obtained using a vibratome. After a 30 min recovery period at 32°C, the slices were placed in the recording chamber and were continuously perfused with oxygenated ACSF containing the following (in mm): 124 NaCl, 3 KCl, 2 CaCl2, 1.3 MgCl2, 25 NaHCO3, 1.25 NaHPO4, and 10 glucose at a rate of 1.5–2 ml/min (bubbled with 95% O2/5% CO2; pH ≈7.4). For time-lapse video imaging of cell migration, multiple z-stack images (at least 6–10 z-sections at 3–5 μm intervals) were acquired every 30 s for at least 2 h using a BX61WI up-right microscope (Olympus) equipped with a CCD camera (CoolSnap HQ2). Cell migration was analyzed manually using ImagePro software (Media Cybernetics). The total displacement during 1 h of cell migration, the speed of migration, and the percentage of the stationary phase with respect to the total migration time were calculated. For analysis of the stationary periods, only those phases that were intercepted by two migratory periods were used. Time-lapse video images of the RMSOB and GCL were acquired to track tangential migration of neuroblasts in the RMSOB, and radial migration in the RMSOB and GCL.
Patch-clamp recordings
For electrophysiological recordings, we prepared acute slices from young P25–P30 and adult P60–P120 mice. We choose P25–P30 since bulbar interneurons that are produced during the first 2 postnatal weeks require 2–3 weeks to arrive and integrate into the bulbar network. Acute horizontal 250-μm-thick vibratome slices from the OBs were prepared for patch-clamp recordings as described above. Recordings were made using a Multiclamp 700A amplifier (Molecular Devices). Patch electrodes with resistances ranging from 2.5 to 4 MΩ were filled with an intracellular solution containing the following (in mm): 135 CsCl, 10 HEPES, 0.2 EGTA, 2 ATP, 0.3 GTP, and 10 glucose, pH ≈7.2. Spontaneous IPSCs (sIPSCs) were isolated by bath application of 5 mm kynurenic acid (Kyn) to block glutamatergic activity. Miniature IPSCs (mIPSCs) were isolated by applying 1 μm tetrodotoxin (TTX) to block voltage-sensitive sodium channels in the presence of 5 mm Kyn. Magnesium-free ACSF containing 1 μm TTX was used to record evoked dendrodendritic currents. The mitral cells were depolarized to 0 mV with voltage steps of varying durations, and dendrodendritic currents were recorded from the same mitral cells. The recordings were first performed under control conditions, i.e., in the presence of Mg-free ACSF containing 1 μm TTX. A GABAA receptor antagonist [50 μm bicuculline methochloride (BMI)] was then applied together with 1 μm TTX, and evoked currents were recorded again. The traces representing dendrodendritic inhibition (DDI) responses were obtained by subtracting the traces recorded in the presence of BMI (Mg-free ACSF with TTX and BMI) from those recorded under control conditions (Mg-free ACSF with TTX).
Local field potential recordings
To record local field potentials (LFPs), the electrodes were filled with 2 m NaCl. The slices were prepared using the protocol for the patch-clamp recordings and were maintained at 35°C throughout the recordings. The olfactory nerve layer was stimulated with a glass microelectrode in the range of 150–250 μA using an A360 stimulus isolator (World Precision Instruments). The recordings were made using a Multiclamp 700B amplifier (Molecular Devices). LFP recordings were made in the mitral cell layer in the absence and presence of the GABAA receptor antagonist gabazine (20 μm). Only the recordings showing a significant reduction in the oscillation index (see below) in the presence of gabazine were kept for analysis. To analyze LFP oscillations, we used a custom-tailored program written in Matlab (Mathworks) to calculate the frequency spectrum and autocorrelation using a fast Fourier transform algorithm. The oscillation index, a measure of oscillation power, was calculated as follows:
 |
where DFTpre(f) and DFTpost(f) represent discrete Fourier transforms evaluated over a 200 ms window taken before and after the stimulus, respectively. This formula represents the sum of the oscillation amplitudes recorded at all frequencies between 20 and 80 Hz after the stimulus was normalized to the frequency amplitudes (from the same range) recorded before the stimulus. Similar results were obtained when the oscillation index was defined as the second peak height of the normalized autocorrelation function.
Behavior
Olfactory behavior was assessed on age-matched male mice at P25–P30, and the same cohort of mice was retested using the same olfactory tests at 3–4 months of age. Each mouse was individually housed and provided with food and water ad libitum. The mice were maintained in a 12 h inverted light/dark cycle and initially were subjected to a 5 d habituation (Hab) period to familiarize the mice with the test environment. During the habituation period, the home cages were used as testing chambers where the feeding grid was replaced by a clean grid from which Pasteur pipettes containing the filter paper inserts were suspended. The filter paper inserts were saturated with test odor (diluted in mineral oil) or mineral oil alone (control).
Odor detection threshold.
Upon completion of the 5 d habituation period, which allowed the mice to familiarize themselves with the test procedures, the odor detection thresholds were assessed. The mice were presented with two pipettes for 5 min, one containing a filter paper insert saturated with mineral oil (control) and the other with octanol (test odor) diluted in mineral oil to different concentrations (10−7, 10−5, 10−4, and 10−3). Each concentration was tested during separate sessions in ascending order. The time spent investigating the two pipettes was recorded. The mice were considered to be able to detect the test odor if the time spent investigating the test pipette was longer than the time spent investigating the control pipette.
Odor discrimination.
The olfactory discrimination task is a habituation/dishabituation (Dishab) test. During the habituation protocol, which consisted of three successive 5 min trials with a 15 min interval between each exposure, the mice were presented with heptanol (Hept) diluted 10−3. During the successive exposures, the total investigation time progressively decreased as the mice became habituated to the odor. The final exposure represented the dishabituation protocol, where a novel odor [limonene (Lim)] was presented mixed with heptanol at varying percentages (Hab: 100% Hept; Dishab: 100% Lim; 30% Hept/70% Lim; 42% Hept/58% Lim; 46% Hept/54% Lim; 49% Hept/51% Lim; and 58% Hept/42% Lim). The mice were considered to be able to discriminate the novel odor from the odor they were habituated to if the investigation time during the dishabituation exposure was longer than the investigation time recorded during the third and final habituation phase.
Olfactory short-term memory.
After a 4 d habituation period, reverse light/dark cycle individually housed mice were exposed to the same odor during two 5 min sessions separated by a 30, 60, 90, or 120 min interval. The pipette containing the odor was inserted randomly in the cage grid to avoid a spatial recognition effect. Individually housed mice were presented with the same odor during two 5 min sessions separated by a 30, 60, 90, or 120 min interval between the two presentations. The odors used were (+) terpinen-4-ol, limonene (−), decanal, and valeric acid for the 1-month-old mice; and (+) terpinen-4-ol, limonene (−), carvone (−), and valeric acid for the 4-month-old mice. All odors were purchased from Sigma and were diluted 10−3. The mice were considered to remember the odor if there was a significant decrease in the time taken to investigate the second odor compared with the first odor.
Statistical analysis
Results are expressed as means ± SEM. Statistical significance was determined using the Student's t test (*p < 0.05 and **p < 0.01).
Results
Tenascin-R is expressed during late perinatal development in the OB
To establish the spatio-temporal expression profile of TNR in the OB, we performed immunohistochemical and quantitative Western blot analyses. TNR immunofluorescence performed on coronal OB sections from P4, P7, P14, P30, and P60 mice revealed that TNR expression becomes detectable at P7 in the GCL around the rostral migratory stream in the RMSOB (Fig. 1a). Expression increased during the second to third postnatal weeks and peaked at P30 (Fig. 1a). At P30, TNR was homogeneously expressed in the GCL and GL, but not in the RMSOB. This spatial pattern was maintained throughout life.
Figure 1.

Expression of TNR in the postnatal OB. a, Immunolabeling of TNR in coronal sections of the OBs of TNR+/+ mice from the early perinatal period to adulthood. TNR expression appears immediately around the RMSOB at P7. b, Western blot analysis of OB samples from P4, P7, P15, P30, and P60 mice showing the late expression of TNR and the significant increase in both of its isoforms (160 and 180 kDa) with age. Actin was used as a loading control. c, Quantification of the expression of TNR in the OB. The optical density of the bands representing the two isoforms of TNR were normalized to the actin band from the same sample and were then plotted versus age to shown changes in the expression of the protein during postnatal development. Values are expressed as means ± SEM (n = 3 OB extracts from TNR+/+ and −/− mice at each age). *p < 0.05 with Student's t test.
To quantify TNR levels at different development stages, we performed quantitative Western blot analyses using protein samples extracted from the OBs of P4, P7, P15, P30, and P60 mice. Two bands (160 and 180 kDa) representing the two isoforms of TNR were detected at all ages (Fig. 1b). The Western blot results revealed that TNR expression is low at P4–P7, is increased at P15, peaks at P30, and is subsequently maintained at this level throughout adulthood (Fig. 1c), which is in agreement with the immunofluorescence results.
Lack of TNR does not affect perinatal neurogenesis in the OB
We previously demonstrated that the absence of TNR leads to a decrease in the number of interneurons in the adult OB, without affecting the proliferation and tangential migration of neuroblasts (Saghatelyan et al., 2004). However, TNR expression is low during the first and second postnatal weeks when the majority of bulbar interneurons arrive in the OB (Altman, 1969; Lemasson et al., 2005; Batista-Brito et al., 2008). We thus asked whether TNR plays a role in the bulbar neurogenesis at these early postnatal ages. We thus investigated whether a lack of TNR during the early postnatal period would affect the number of cells that integrate into the OB. We injected BrdU into P10 TNR+/+ and TNR−/− mice and analyzed cell proliferation, migration, and survival in the SVZ–OB pathway (Fig. 2a). To determine whether a lack of TNR affects cell proliferation, a single BrdU pulse was administered to P10 mice, which were killed 1 h later. Immunolabeling for BrdU revealed dense BrdU+ profiles in the SVZ and at the outer borders of the RMS (Fig. 2b), as reported previously (Pencea and Luskin, 2003). No difference in BrdU+ cell density between the genotypes was observed (3754.5 ± 352.0 cells/mm2 for TNR+/+ mice; and 3827.3 ± 248.7 cells/mm2 for TNR−/− mice; n = 3 mice per group) (Fig. 2d). To determine whether a lack of TNR affects the tangential migration of neuroblasts at early postnatal ages, two BrdU pulses were given to P10 mice, which were killed 5 d later when most of the BrdU+ cells had reached the RMSOB (Fig. 2c). The quantification of the density of the BrdU+ profiles in the RMSOB did not reveal any difference between genotypes (3281.4 ± 366.8 cells/mm2 for TNR+/+ mice, n = 5 mice per group; and 3814.1 ± 526.8 cells/mm2 for TNR−/− mice, n = 4 mice per group) (Fig. 2d). We then quantified the number of BrdU+ cells in the GCL and GL produced in P10 TNR+/+ and TNR−/− mice 21 d after the injection of two BrdU pulses. Twenty-one days were required for newborn cells produced in the SVZ and RMS to reach the OB and integrate into the bulbar network (Fig. 2e). Similarly, the densities of newly integrated cells in the GCL and GL of TNR−/− OBs were undistinguishable from those of their TNR+/+ littermates (for the GCL: 811.5 ± 109.4 cells/mm2 for TNR+/+ mice, and 698.9 ± 57.7 cells/mm2 for TNR−/− mice; for the GL: 747.3 ± 133.4 cells/mm2 for TNR+/+ mice, and 655.3 ± 43.5 cells/mm2 for TNR−/− mice; n = 4 mice per group) (Fig. 2f). These results indicated that a lack of TNR does not affect cell proliferation in the SVZ and RMS, migration in the RMS and OB, or integration into the OB during early postnatal periods. These results are consistent with the levels of TNR expression in the OB (Fig. 1) and sharply contrast with the role of TNR during adult OB neurogenesis (Saghatelyan et al., 2004). During adulthood, lack of TNR leads to the decreased number of BrdU+ cells in the OB (for the GCL 21 d after BrdU injection: 309.5 ± 12.0 cells/mm2 for TNR+/+ mice, and 211.6 ± 21.9 cells/mm2 for TNR−/− mice, p < 0.05) (see also Saghatelyan et al., 2004) because of the accumulation of neuroblasts in the RMSOB without affecting cell proliferation and tangential migration in the SVZ and RMS (Saghatelyan et al., 2004). While the accumulation of neuroblasts in the RMSOB has been attributed to defects in radial migration (Saghatelyan et al., 2004), cell migration in the OBs of TNR+/+ and TNR−/− mice has not been monitored. In addition, radial migration is a multistep process, which includes arrest of tangential migration, initiation of radial migration in the RMSOB, and maintenance of radial migration in the GCL of the OB. We used time-lapse video imaging of cell migration in acute horizontal slices of the forebrains of both genotypes and at different developmental ages to determine which of these processes is affected by a lack of TNR in the adult but not early postnatal OB.
Figure 2.
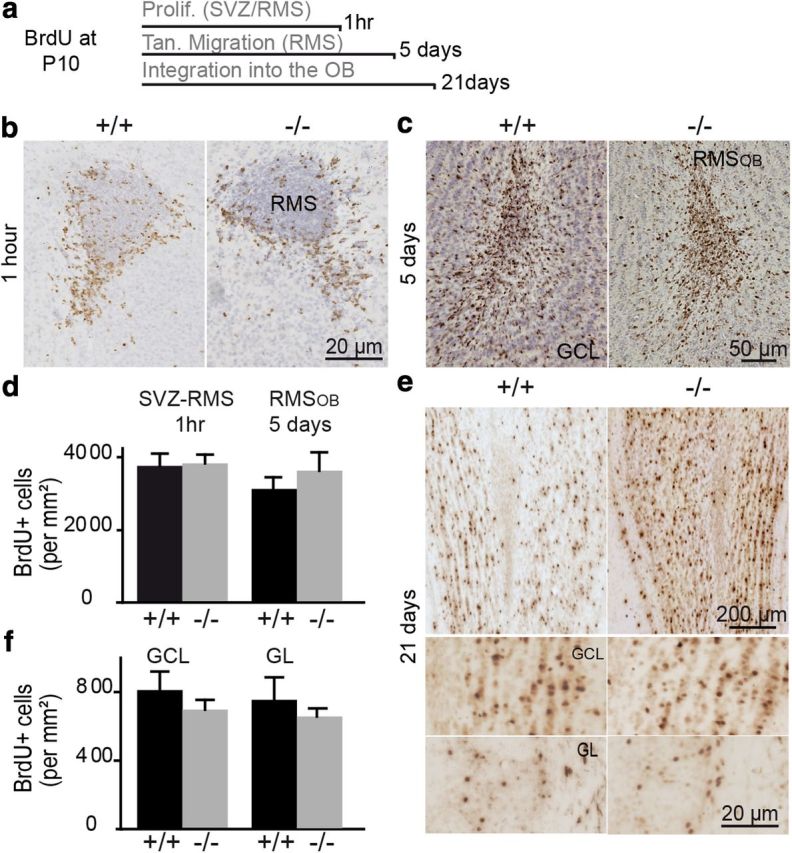
A lack of TNR does not affect the proliferation, migration, or integration of newborn interneurons into the perinatal OB. a, Schematic diagram showing the BrdU administration protocol and the time of killing used to study the proliferation, migration, and integration of newborn interneurons in P10 pups. b, Similar numbers of BrdU+ cells can be seen in coronal sections of the SVZ-RMS from P10 TNR+/+ and TNR−/− mice injected 1 h before being killed. c, Immunolabeling showing BrdU+ cells in the RMSOB of TNR+/+ and TNR−/− mice. Two BrdU pulses were given at P10, and the mice were killed 5 d later. d, Quantification of the density of BrdU+ cells in the SVZ-RMS and RMSOB of P10 TNR+/+ and TNR−/− mice, 1 h and 5 d after BrdU injection. No difference between the two genotypes was observed. Values are expressed as means ± SEM. e, Immunolabeling showing BrdU+ cells in coronal sections of OBs from TNR+/+ and TNR−/− mice. Two BrdU pulses were given at P10, and the animals were killed 21 d later. Bottom shows the magnified regions of GCL and GL in TNR+/+ and TNR−/− mice. f, Quantification of the density of BrdU+ cells in the GCL and GL of TNR+/+ and TNR−/− mice. Values are expressed as means ± SEM.
Radial migration of neuroblasts is impaired in the RMSOB and GCL of adult TNR−/− mice
While the time-lapse imaging of tangentially migrating neuroblasts in the RMS has been routinely studied (Murase and Horwitz, 2002; Bolteus and Bordey, 2004; Kim et al., 2009; Snapyan et al., 2009), little is known about the dynamics of radially migrating neuroblasts in the RMSOB and GCL of the OB at different developmental ages. In addition, it is not clear how the tangential migration of neuronal precursors in the RMSOB is modified when cells turn 90° and initiate radial migration. To address these issues and understand how a lack of TNR affects the migration of neuronal precursors in the adult but not early postnatal OB, we performed time-lapse video imaging of GFP-labeled neuroblasts in acute horizontal slices over a time period of 2 h (Figs. 3, 4). The cells were then subdivided into three groups, depending on whether they migrated tangentially in the RMSOB (Figs. 3a, 4a), radially in the RMSOB (Figs. 3b, 4b), or radially in the GCL (Figs. 3c, 4c).
Figure 3.

A lack of TNR does not affect tangential and radial migrations in the developing OB. a–c, Snapshots of time-lapse video-imaging experiments showing tangentially (a) and radially migrating neuroblasts in the RMSOB (b) and GCL (c) of P15–P16 TNR+/+ and TNR−/− mice. Times are indicated in minutes, and the white dashed line indicates the border of RMSOB. d–f, Quantification of total displacement during a 1 h recording (d), speed of migration (e), and percentage of time spent in the stationary phase (f) of neuroblasts migrating in acute OB slices prepared from P15–P16 TNR+/+ and TNR−/− mice. Values are expressed as means ± SEM.
Figure 4.

Affected radial migration of neuroblasts in the RMSOB and GCL of adult TNR−/− mice. a–c, Snapshots of time-lapse video-imaging experiments showing tangentially (a) and radially migrating neuroblasts in the RMSOB (b) and GCL (c) of TNR+/+ and TNR−/− mice. Times are indicated in minutes in the top right corner, and the white dashed line indicates the border of RMSOB. d–f, Quantification of total displacement during a 1 h recording (d), speed of migration (e), and percentage of time spent in the stationary phase (f) of neuroblasts migrating in acute OB slices prepared from adult TNR+/+ and TNR−/− mice. Note the significant decrease in the total displacement time and the increase in the percentage of time spent in the stationary phase by neuroblasts migrating radially in the OBs of adult TNR−/− mice. Values are expressed as means ± SEM. *p < 0.05, and **p < 0.01 with Student's t test. Rad, Radial; Tan, tangential.
We first performed time-lapse video imaging of cell migration in slices prepared from P15–P16 TNR+/+ and TNR−/− mice that received injection of a GFP-encoding retrovirus in the RMS at P10. Tangentially (30.6 ± 4.0 μm for TNR+/+ mice, n = 30 cells; and 30.2 ± 2.3 μm for TNR−/− mice, n = 53 cells) and radially (22.4 ± 1.7 μm for TNR+/+ mice, n = 25 cells; and 25.3 ± 1.5 μm for TNR−/− mice, n = 39 cells) migrating cells in the RMSOB, as well as radially migrating cells in GCL (23.1 ± 2.2 μm for TNR+/+ mice, n = 26 cells; and 23.2 ± 1.2 μm for TNR−/− mice, n = 43 cells) migrated the same distance during a 1 h recording in both genotypes (Fig. 3a–d). Similarly, no changes in the speed of migration of tangentially (80.9 ± 4.7 μm for TNR+/+ mice, n = 30 cells; and 76.4 ± 2.0 μm for TNR−/− mice, n = 53 cells) and radially (80.0 ± 2.5 μm for TNR+/+ mice, n = 25 cells; and 75.6 ± 1.5 μm for TNR−/− mice, n = 39 cells) migrating neuroblasts in the RMSOB as well as radially migrating cells in the GCL (78.8 ± 2.5 μm for TNR+/+ mice, n = 26 cells; and 76.4 ± 2.0 μm for TNR−/− mice, n = 43 cells) was observed (Fig. 3e). Neuroblast migration in the SVZ–OB pathway is saltatory, with the migratory phases interrupted by the stationary periods. We thus calculated the amount of time that neuroblasts spent in the stationary phase and again did not detect any changes for neuroblasts migrating tangentially (61.6 ± 5.6% for TNR+/+ mice, n = 30 cells; and 61.1 ± 2.8% for TNR−/− mice, n = 53 cells) and radially (72.2 ± 2.4% for TNR+/+ mice, n = 25 cells; and 67.5 ± 1.9% for TNR−/− mice, n = 39 cells) in the RMSOB as well as radially in the GCL (68.8 ± 3.6% for TNR+/+ mice, n = 26 cells; and 69.0 ± 1.7% for TNR−/− mice, n = 43 cells) (Fig. 3f). These data are in line with our BrdU analysis (Fig. 2) and show that migration of neuronal precursors in the early postnatal TNR−/− is undistinguishable from their wild-type counterparts.
We then performed time-lapse video imaging of cell migration in the adult TNR+/+ and TNR−/− mice (Fig. 4). Cells migrating tangentially in the RMSOB of adult TNR+/+ and TNR−/− mice migrated the same distance during a 1 h recording (37.9 ± 3.1 μm for TNR+/+ mice, n = 57 cells; and 39.4 ± 3.7 μm for TNR−/− mice, n = 36 cells) (Fig. 4d). There was no difference in the speed of migration (91.0 ± 5.0 μm for TNR+/+ mice, n = 57 cells; and 100.4 ± 7.1 μm for TNR−/− mice, n = 36 cells) (Fig. 4e) or the percentage of time the cells spent in the stationary phase during migration (59.2 ± 2.6% for TNR+/+ mice, n = 57 cells; and 61.1 ± 2.6% for TNR−/− mice, n = 36 cells) (Fig. 4f).
We next examined the radial migration of neuroblasts in the RMSOB and GCL and found that the radial migration of neuroblasts in the RMSOB and the GCL of adult TNR−/− mice is indeed affected. Cells migrating radially in the RMSOB of these TNR−/− mice stayed for a significantly longer time period in the stationary phase than those of their TNR+/+ littermates (61.9 ± 1.8% for TNR+/+ mice, n = 12 cells; and 74.4 ± 3.2% for TNR−/− mice, n = 7 cells; p < 0.05) (Fig. 4f). Given this, the overall distance traveled by radially migrating neuroblasts in the RMSOB of TNR−/− mice was also lower (35.2 ± 1.9 μm for TNR+/+ mice, n = 12 cells; and 24.8 ± 3.3 μm for TNR−/− mice, n = 7 cells; p < 0.05) (Fig. 4d). However, the speed of migration was unaffected (93.2 ± 3.8 μm/h for TNR+/+ mice, n = 12 cells; and 96.9 ± 7.3 μm/h for TNR−/− mice, n = 7 cells) (Fig. 4e). Once the cells had exited the RMSOB, they maintained their radial migration to their final destination in the GCL and GL. As in the RMSOB, the radial migration of neuroblasts in the GCL was significantly altered by a lack of TNR. The overall distance traveled by radially migrating neuroblasts in the GCL during a 1 h recording (35.6 ± 3.1 μm for TNR+/+ mice, n = 27 cells; and 23.4 ± 3.5 μm for TNR−/− mice, n = 12 cells; p < 0.05) (Fig. 4d) and the percentage of time spent by the neuroblasts in the stationary phase (63.1 ± 3.1% for TNR+/+ mice, n = 27 cells; and 75.0 ± 3.1% for TNR−/− mice, n = 12 cells; p < 0.05) (Fig. 4f) were significantly affected in the TNR−/− mice. However, the speed of migration was unaffected (100.9 ± 3.9 μm/h for TNR+/+ mice, n = 27 cells; and 93.8 ± 7.1 μm/h for TNR−/− mice, n = 12 cells) (Fig. 4e). Thus, using time-lapse monitoring of neuroblasts migrating in the OB, we were able to directly show that a lack of TNR induces alterations in radial migration in the RMSOB and GCL but not in tangential migration in the RMSOB. A lack of TNR impaired the ability of cells to leave the RMSOB and enter the GCL, leading to the accumulation of neuroblasts in the core of the OB, as suggested previously (Saghatelyan et al., 2004). Our results also demonstrate that migration in the adult RMSOB and GCL is more efficient than in early developmental stages, as we have previously shown for the RMS (Bozoyan et al., 2012).
Lack of TNR decreases the spine density of newborn granule cells in the adult OB
Lack of TNR in the hippocampus results in structural alterations in perisomatic inhibitory synapses (Nikonenko et al., 2003). We thus investigated whether the lack of TNR in the OB also causes changes in the number of spines on newborn cells. We first measured the lengths of the primary and secondary dendrites of granule cells born at P10. GFP-encoding lentiviruses were injected into the RMS of P10 TNR+/+ and TNR−/− mice, and the labeled cells were analyzed 21 d later (Fig. 5a). Our analysis did not reveal any differences in the length of the primary (128.8 ± 22.3 μm in TNR+/+ mice, n = 80 cells from three mice; and 104.8 ± 4.0 μm in TNR−/− mice, n = 70 cells from three mice) and secondary (381.7 ± 2.7 μm in TNR+/+ mice, n = 80 cells from three mice; and 362.5 ± 9.3 μm in TNR−/− mice, n = 70 cells from three mice) (Fig. 5c) dendrites of newborn granule cells in both genotypes. Also, no differences in the spine density of interneurons born at P10 was observed (0.44 ± 0.02 spines/μm in TNR+/+ mice, n = 80 cells from three mice; and 0.45 ± 0.01 spines/μm in TNR−/− mice, n = 68 cells from three mice) (Fig. 5d).
Figure 5.

Decreased spine density of newborn interneurons integrating into the adult bulbar circuits of TNR−/− mice. a, Top, Confocal images of granule cells expressing a GFP encoded by a lentivirus injected into the RMS of P10 TNR+/+ and TNR−/− mice 21 d before processing. Bottom, Magnified regions showing the dendrites and individual spines on granule cells in TNR+/+ and TNR−/− mice. b, Top, Confocal images of granule cells expressing a GFP encoded by a lentivirus injected into the RMS of adult TNR+/+ and TNR−/− mice 21 d before processing. Bottom, Magnified regions delineated in the top panels showing the dendrites and individual spines on granule cells in TNR+/+ and TNR−/− mice. c, No differences in the lengths of the primary (Pri.) and secondary (Sec.) dendrites were observed in the granule cells of TNR+/+ and TNR−/− mice at different developmental ages. Values are expressed as means ± SEM. d, A significant decrease in spine density can be seen in granule cells derived from adult, but not early postnatal, TNR−/− mice compared with their TNR+/+ counterparts. Values are expressed as means ± SEM. *p < 0.05 with Student's t test.
We next measured the lengths of the primary and secondary dendrites and the spine density of newborn granule cells in adult TNR+/+ and TNR−/− mice. The neuroblasts were labeled by stereotaxic injection of GFP-encoding lentiviruses into the RMS of P60 TNR+/+ and TNR−/− mice, and dendritic arborization and spine density were analyzed 21 d later. Virally labeled cells were found throughout the GCL and GL of the OBs of both genotypes (Fig. 5b). No differences were observed in the lengths of primary (109.8 ± 6.4 μm in TNR+/+ mice, n = 46 cells from four mice; and 122.5 ± 3.8 μm in TNR−/− mice, n = 49 cells from three mice) and secondary (566.4 ± 40.9 μm in TNR+/+ mice, n = 46 cells from four mice; and 526.2 ± 21.3 μm in TNR−/− mice, n = 49 cells from three mice) (Fig. 5c) dendrites of newborn granule cells in both genotypes. While the lengths of the dendrites of newborn cells were not altered by a lack of TNR, the marked difference in spine density between the two genotypes was observed (0.453 ± 0.03 spines/μm in TNR+/+ mice, n = 49 cells from four mice; and 0.355 ± 0.015 spines/μm in TNR−/− mice, n = 43 cells from three mice; p < 0.05) (Fig. 5d).
The decreased spine density of newborn granule cells in the adult TNR−/− mice can be caused either by defective radial migration or by a direct role of TNR in the spine formation and/or stabilization. To address these issues, we decided to block the TNR function in the adult OB, after the cessation of radial migration of neuroblasts. To this end, we labeled neuronal precursors by stereotaxic injection of GFP-encoding lentiviruses into the RMS of P90 TNR+/+ mice and 10 d later when radial migration is largely completed injected anti-TNR or control antibodies into the OB. The animals were killed after an additional 4 d, and the spine density of newborn granule cells was calculated at the sites of antibodies injections (NIS) as well as at remote locations (FIS) (Fig. 6a). Our experiments reveal that injection of anti-TNR (FIS: 0.42 ± 0.02, n = 24 cells; and NIS: 0.32 ± 0.01, n = 23 cells; p < 0.05), but not control (FIS: 0.38 ± 0.002, n = 50 cells; and NIS: 0.39 ± 0.01, n = 38 cells) antibodies reduced the spine density of newborn granule cells (Fig. 6b,c) and suggest that TNR plays a direct role in the formation and/or stabilization of spines of newborn neurons.
Figure 6.

TNR plays a direct role in the spine development of newborn granule cells. a, Low-magnification images of granule cells expressing a GFP (white) encoded by a lentivirus injected into the RMS of P10 TNR+/+ mice, 10 d before injection of control (Cntl; left) and anti-TNR (right) antibodies directly into the OB. The spine density of newborn granule cells was calculated at the sites of antibody injection (NIS; red) and was compared with the spine density at remote sites (FIS). b, Confocal images of granule cells expressing a GFP showing the spines in the FIS and NIS in TNR+/+ mice injected with Cntl (left) and anti-TNR (right) antibodies. Note, low number of spines in the regions injected with TNR antibodies. c, A significant reduction in spine density can be observed for granule cells present in anti-TNR antibody-injected bulbar regions (NIS, TNR Ab). Values are expressed as means ± SEM. *p < 0.05 with Student's t test. Ab, Antibody.
Altogether, our data show that a lack of TNR not only affects the radial migration of neuroblasts in the adult OB, but also alters the spine development of newborn granule cells. These defects are manifested in the adult but not in the early postnatal OB, likely due to the late expression of TNR. We thus expected that TNR−/− mice are a valuable tool for studying the relative contributions of neurons born during perinatal development and adulthood. Given this notion, we undertook electrophysiological and behavioral studies to assess the functioning of the bulbar circuitry and odor behavior in young, P25–P30 (most bulbar interneurons are produced during the first 2 postnatal weeks), and adult P90–P120 mice.
Lack of TNR reduces the inhibition of principal output neurons in the adult OB
OB neurogenesis results in the continuous renewal of interneurons that form dendrodendritic reciprocal synapses with mitral/tufted cells, the principle output neurons of the OB (Price and Powell, 1970). In these synapses, GABA release can be triggered by the activation of glutamatergic receptors on granule cell spines (Isaacson and Strowbridge, 1998; Isaacson, 2001; Saghatelyan et al., 2005). In addition, spontaneous granule-to-mitral cell GABAergic inhibition also occurs in the absence of glutamatergic receptor activation through action potential-dependent and -independent GABA release (Castillo et al., 1999). To investigate the functional consequences resulting from the reduced number of interneurons that integrate into the OBs of adult TNR−/− mice and the significantly lower spine density on interneurons that manage to integrate, we performed patch-clamp recordings from mitral cells in horizontal slices prepared from young and adult mice of both genotypes.
We first recorded spontaneous postsynaptic currents (sPSCs) in P25–P30 mice in the presence of ACSF. Kyn (5 mm) was then bath applied to block glutamatergic transmission, allowing the recording of sIPSCs. Last, we applied 1 μm TTX together with Kyn to abolish voltage-dependent sodium currents to allow recording of mIPSCs. In P25–P30 TNR+/+ and TNR−/− mice, the amplitude (sPSCs: 41.3 ± 3.9 vs 56.6 ± 5.8 pA, n = 8 and 10 cells, respectively; sIPSCs: 36.4 ± 4.2 vs 42.3 ± 4.8 pA, n = 8 and 10 cells, respectively; mIPSCs: 27.6 ± 3.0 vs 26.7 ± 2.5 pA, n = 8 and 10 cells, respectively) and frequency (sPSCs: 20.6 ± 1.9 vs 17.1 ± 3 Hz, n = 8 and 10 cells, respectively; sIPSCs: 4.4 ± 0.7 vs 5.1 ± 0.9 Hz, n = 8 and 10 cells, respectively; and mIPSCs: 2.5 ± 0.4 vs 2.7 ± 0.2 Hz, n = 8 and 10 cells, respectively) of the sPSCs, sIPSCs, and mIPSCs were unaffected (Fig. 7a,b). There were also no changes in the rise time and decay time of mIPSCs (data not shown). We thus concluded that at P25–P30 both genotypes exhibit the same level of inhibition in their bulbar circuitry, which is in agreement with the lack of morphological deficits observed during this developmental period (Figs. 2, 3, 5). Interestingly, however, when the same experiments were performed with mitral cells from adult TNR+/+ and TNR−/− mice, significant differences in the frequency were noted (sPSCs: 12.4 ± 1.9 vs 8.3 ± 1.5 Hz, n = 12 and 13 cells, respectively; sIPSCs 2.8 ± 0.4 vs 1.4 ± 0.3 Hz, n = 12 and 13 cells, respectively, p < 0.05; mIPSCs 0.8 ± 0.1 vs 0.4 ± 0.1 Hz, n = 7 and 10 cells, respectively, p < 0.05) (Fig. 7c,d). There were no differences in the amplitude (sPSCs: 41.1 ± 8.5 vs 43.1 ± 8.9 pA, n = 12 and 13 cells, respectively; sIPSCs: 32.0 ± 6.4 vs 33.8 ± 8.4 pA, n = 12 and 13 cells, respectively; mIPSCs: 37.2 ± 9.2 vs 34.2 ± 9.36 pA, n = 7 and 10 cells, respectively) (Fig. 7c,d) or kinetics (data not shown) of the same events. The reduced frequency but not amplitude of sIPSCs and mIPSCs in adult TNR−/− mice compared with their TNR+/+ littermates was consistent with the histological results showing reduced radial migration and spine density of newborn cells in the adult OB.
Figure 7.

Mitral cell inhibition is reduced in adult but not young TNR−/− mice. a, Electrophysiological recordings showing spontaneous sPSCs, sIPSCs, and mIPSCs in the mitral cells of P25–P30 TNR+/+ and TNR−/− mice. b, Quantification of the amplitude and frequency of sPSCs, sIPSCs, and mIPSCs did not reveal any differences between P25–P30 TNR+/+ and TNR−/− mice. Values are expressed as means ± SEM. c, Electrophysiological recordings showing spontaneous sPSCs, sIPSCs, and mIPSCs in the mitral cells of P60–P120 TNR+/+ and TNR−/− mice. d, A significant decrease can be seen in the frequency but not the amplitude of sIPSCs and mIPSCs in mitral cells recorded from P60–P120 TNR−/− mice compared with their TNR+/+ counterparts. Values are expressed as means ± SEM. *p < 0.05 with Student's t test. e, g, DDI recorded in mitral cells in TNR+/+ and TNR−/− mice in response to a 50 ms depolarization step at P25–P30 and P60–P120. f, No differences can be seen in the charge or amplitude of DDIs normalized to mitral cell capacitance recorded in P25–P30 TNR+/+ and TNR−/− mice for any duration of the depolarization steps used to induce DDI. Values are expressed as means ± SEM. h, The amplitude and charge of DDIs in P60–P120 TNR−/− mice are lower than in their TNR+/+ counterparts. Values are expressed as means ± SEM. *p < 0.05 with Student's t test.
We next recorded evoked dendrodendritic inhibitory currents from young and adult mice. Mitral cells were recorded under the whole-cell configuration and held at −60 mV. The cells were then depolarized to 0 mV for varying periods using voltage steps ranging in duration from 10 to 50 ms. The DDI currents were obtained by subtracting traces recorded in the presence of 50 μm BMI and 1 μm TTX from control traces recorded in the presence of 1 μm TTX alone. At P25–P30, both the amplitude and the charge of DDIs were indistinguishable between genotypes (Fig. 7e,f). In contrast, DDIs recorded from mitral cells of adult P60–P120 TNR−/− mice exhibited a reduction in the amplitude of inhibitory events in response to 50, 25, and 10 ms depolarization steps (50 ms: 70.6 ± 4.8 in TNR+/+ mice, and 48.8 ± 4.7 in TNR−/− mice, n = 12 and 8 cells, respectively, p < 0.05; 25 ms: 60.8 ± 6.8 in TNR+/+ mice, and 38.8 ± 2.8 in TNR−/− mice, n = 12 and 8 cells, respectively, p < 0.05; 10 ms: 42.5 ± 4.5 in TNR+/+ mice, and 25.4 ± 4.3 in TNR−/− mice, n = 12 and 7 cells, respectively; p < 0.05) (Fig. 7g,h). We also observed a reduction in the charge (Fig. 7g,h), but not the kinetics (data not shown), of the inhibitory event in response to the depolarization step. These results clearly indicated that there was a reduction in inhibition in the OB of adult TNR−/− mice compared with their littermates. These functional deficits can be explained by the fact that the number of interneurons integrating into the OB circuitry as well as the spine density of these newborn cells is significantly reduced in adult TNR−/− mice.
Reduced inhibition of mitral cells in adult TNR−/− mice alters their synchronous activity
It is well established that inhibition caused by interneurons in the OB plays a major role in the synchronous activity of output neurons, which is crucial to relaying information to the piriform cortex (Lagier et al., 2004, 2007). To investigate the effects of reduced inhibition on the synchronous activity of output neurons, LFPs were recorded from the mitral cell layer in acute slices from P25–P30 and P60–P120 mice. The olfactory nerve layer was briefly stimulated at 150–250 μA to elicit LFP oscillations in the gamma range (20–80 Hz) (Fig. 8a,c). We calculated the oscillatory index as the strength of the oscillations, which represents the integral of the oscillations taken at a given time point. No differences in the oscillatory index were observed between genotypes at P25–P30 (Fig. 8a,b). Importantly, however, the oscillatory index was significantly reduced in the adult P60–P120 TNR−/− mice compared with their TNR+/+ littermates (Fig. 8c,d). A reduction in the oscillatory index was observed over the initial 400 ms recording period (0–200 ms: 4.7 ± 0.5 in TNR+/+ mice, and 3.2 ± 0.2 in TNR−/− mice, n = 13 and 14 slices, respectively, p < 0.05; 200–400 ms: 3.4 ± 0.3 in TNR+/+ mice, and 2.7 ± 0.2 in TNR−/− mice, n = 13 and 14 slices, respectively, p < 0.05). These results indicate that the decrease in the number of interneurons and the reduction in the spine density of those that had integrated into the adult TNR−/− OB affected the overall inhibition of the mitral cells, which in turn might affect the strength of the LFP oscillations.
Figure 8.

Synchronized oscillatory activity is reduced in adult TNR−/− mice. a, c, LFP recordings from the mitral cell layer of acute slices derived from P25–P30 and P60–P120 TNR+/+ and TNR−/− mice. b, d, The oscillation index was calculated by comparing the oscillations in a 200 ms window of the prestimulus baseline to the poststimulus response. The oscillation index decreased significantly over the initial 400 ms post-stimulation period in adult (d) but not in young (b) TNR−/− mice compared with their TNR+/+ counterparts, indicating that the synchronized oscillatory activity of mitral cells is lower in TNR−/− mice than their TNR+/+ counterparts. Values are expressed as means ± SEM. *p < 0.05 with Student's t test.
Lack of TNR impairs some forms of olfactory behavior in adult but not young mice
It has been suggested that newborn neurons play an important role in some but not all odor-associated behaviors (Imayoshi et al., 2008; Breton-Provencher et al., 2009; Lazarini and Lledo, 2011; Mandairon et al., 2011; Breton-Provencher and Saghatelyan, 2012). Since our histological and electrophysiological studies revealed specific alterations in adult but not young TNR−/− mice, we investigated how young and adult mice perform in different odor behavior tasks that were performed in sequence on the same mice at P25–P30 and P110–P120. We first determined the odor concentration threshold at which the mice were able to detect an odor. Individually housed mice were exposed to an ascending series of octanol concentrations (diluted 10−7, 10−5, 10−4, and 10−3). The times taken by each mouse to investigate the test odor and the control (mineral oil) were recorded. At P25–P30, both genotypes were able to detect the odor at dilutions of 10−4 and 10−3 (Fig. 9a). Adult P110–P120 TNR+/+ and TNR−/− mice were able to detect the odor at a dilution of 10−3 (Fig. 9a).
Figure 9.

Odor detection and discrimination is unaltered in TNR−/− mice. a, Odor detection thresholds in P25–P30 and P110–P120 TNR+/+ and TNR−/− mice. Normalized values are expressed as the mean ratio of the time taken to investigate an odor at a given dilution (10−7, 10−5, 10−4, and 10−3) and the total investigation time (a combination of the time spent investigating the odor and the time spent investigating the control pipette containing mineral oil). A significant increase above the 50% threshold indicated that animals are able to detect an odor. Note that the odor detection thresholds of P25–P30 and P110–P120 TNR+/+ and TNR−/− mice are undistinguishable. Values are expressed as means ± SEM. *p < 0.05 with Student's t test. b, Top, Experimental design showing the habituation-dishabituation protocol for the odor discrimination test. Bottom, Comparison of the time taken to investigate the odor during the dishabituation (gray) and final habituation (black) exposures. During the dishabituation exposure, a novel odor (limonene) was presented at varying ratios with the habituation (heptanol) odor. Note that the abilities of P25–P30 and P110–P120 TNR+/+ and TNR−/− mice to discriminate between the mixtures of odors are undistinguishable. Values are expressed as means ± SEM. *p < 0.05 with Student's t test.
We next tested the odor discriminative ability of young P25–P30 and adult P110–P120 knock-out mice. The mice were first habituated to Hept and then tested for their ability to discriminate between two discrete odors (Lim and Hept) as well as a mixture of different proportions of Lim and Hept. In this habituation–dishabituation test, the mice were habituated to Hept diluted 10−3 using three consecutive 5 min exposures with 15 min intervals between each exposure. The investigation time during each consecutive exposure (habituation) decreased progressively. For the final presentation, the mice were presented with a novel odor (Lim) alone or mixed with Hept at different percentages. At both P25–P30 and P110–P120 the two genotypes increased their investigation times during the fourth exposure (dishabituation), indicating that they were able to discriminate Lim from Hept at all the concentrations tested, except for the mixture in which the concentration of the novel odor was lower than that of the odor used for habituation (Hept/Lim: 58:42%) (Fig. 9b). Since adult TNR−/− mice have a much lower number of newborn neurons (Saghatelyan et al., 2004), and since neurogenesis-impaired animals have defects in discriminating the complex mixture of odors (Enwere et al., 2004), we also tested adult mice at other Lim/Hept ratios, but observed no differences in the odor discriminative ability between genotypes, regardless of the odor ratios (Fig. 9b).
Since changes in the number of newborn neurons affect short-term odor memory (Rochefort et al., 2002; Breton-Provencher et al., 2009; Breton-Provencher and Saghatelyan, 2012), we tested the spontaneous short-term memory of young and adult mice by initially presenting them with an odor for 5 min followed by the same odor at 30, 60, 90, or 120 min intervals (Fig. 10a). We considered that the mice remembered a given odor if the odor investigation time during the second exposure was <50% of the investigation time during the first and second exposures. If the time was ≥50%, we considered that the mice did not remember the odor. The mice were tested using one time interval per day, with a new odor for every time interval. At P25–P30, both genotypes remembered the odor presented to them at each time interval, except for the longest one (120 min). No difference between the genotypes was observed (Fig. 10b). Interestingly, however, at P110–P120, while the TNR+/+ mice remembered the odor presented to them at all time intervals (30 min: 28.5 ± 3.5%; 60 min: 27.7 ± 1.9%; 90 min: 33.3 ± 2.0%; and 120 min: 32.6 ± 4.7%; n = 10 mice), the TNR−/− mice displayed significant alterations at all time intervals tested (Fig. 10c). The TNR−/− mice were unable to remember the second presentation of the odor after 60, 90, and 120 min (60 min: 45.1 ± 4%; 90 min: 39.0 ± 4.1%; and 120 min: 49.2 ± 3.5%; n = 11 mice). Even after 30 min, TNR−/− mice spent more time investigating the odor during the second presentation than their TNR+/+ littermates (TNR+/+ mice: 28.5 ± 3.5%, n = 13 mice; TNR−/− mice: 37.8 ± 2.8%, 11 mice; p < 0.05) (Fig. 10c). These results indicate that reduced neurogenesis resulting in impaired bulbar function selectively affects the spontaneous short-term memory of adult mice.
Figure 10.
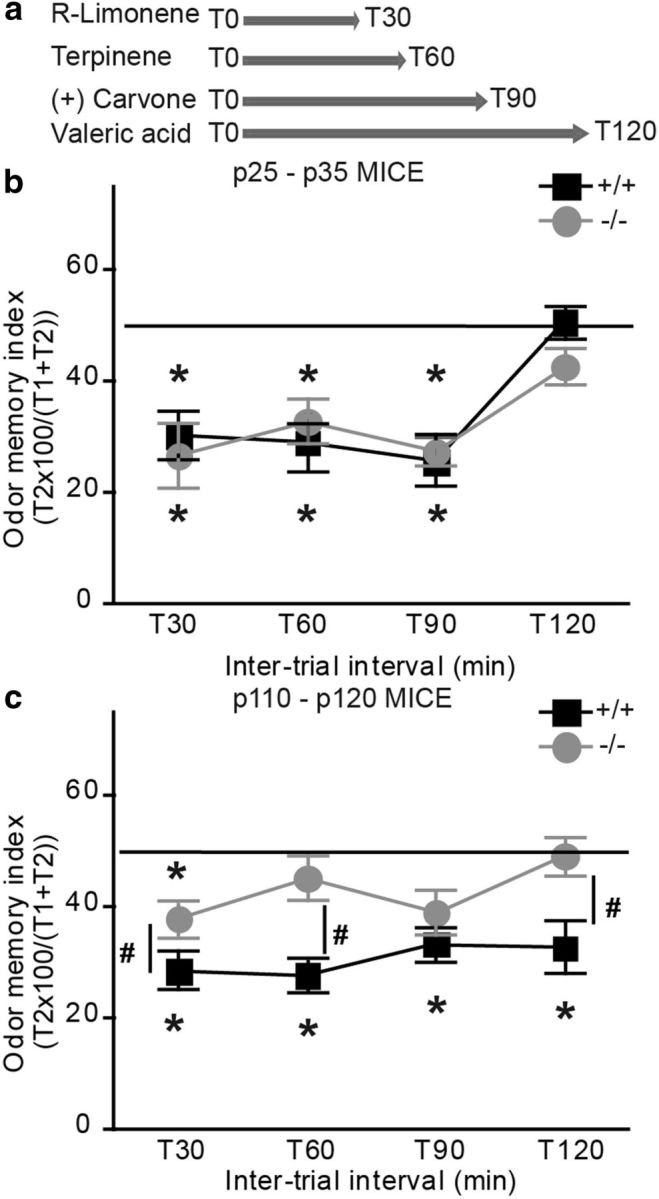
The short-term odor memory of adult TNR−/− mice is affected. a, Experimental design showing the odors and time intervals used to evaluate the short-term odor memory of P25–P30 and P110–P120 TNR+/+ and TNR−/− mice. b, The odor memory index was calculated as a percentage of the time taken by the mice to investigate the odor at the second exposure compared with the combined time spent investigating the odor during first and second exposures. Note that the P25–P30 TNR+/+ and the TNR−/− mice exhibit the same ability to remember the test odor at any interval other than the longest (120 min). Values are expressed as means ± SEM. *p < 0.05 with Student's t test. c, The same cohort of mice tested at P110–P120 showed that adult TNR−/− mice do not remember the test odor tested at any interval other than the shortest (30 min), whereas the adult TNR+/+ mice remembered the test odor at all the intervals, including the longest (120 min). Values are expressed as means ± SEM. *p < 0.05 and #p < 0.05 with Student's t tests. *Significant difference between the first and second exposures; #significant difference between genotypes.
Discussion
The present study reveals that the mechanisms guiding radial migration of neuronal precursors in perinatal and adult OBs rely on different molecular pathways. We show that TNR is expressed relatively late during bulbar development and that it reduces radial migration and spine development of newborn granule cells in the adult but not perinatal OB. Reduction in the number of newborn neurons profoundly affect the functioning of the bulbar neuronal circuitry by decreasing the overall level of inhibition received by mitral cells, which alters their synchronized activity. This, in turn, induces changes in specific types of odor behavior in adult but not young TNR−/− mice. Our novel results highlight for the first time that molecular mechanisms regulating various processes in postnatal neurogenesis are distinct at different periods of an animal's lifetime.
Olfactory bulb neurogenesis in perinatal and adult OBs
It is thought that adult OB neurogenesis is a continuum from developmental neurogenesis and that it relies on mechanisms that also operate during embryonic and early postnatal development. It is noteworthy, however, that the SVZ–OB pathway undergoes marked structural modifications during postnatal development (Law et al., 1999; Peretto et al., 2005; Bozoyan et al., 2012), and important morphological and functional differences exist between newborn neurons produced at different periods of postnatal development (Lemasson et al., 2005; Imayoshi et al., 2008; Kelsch et al., 2008; Breton-Provencher and Saghatelyan, 2012). Particularly pertinent to the present study are observations of differential targeting of newborn neurons produced during neonatal development and adulthood (Lemasson et al., 2005; Imayoshi et al., 2008). Newborn neurons produced during the early postnatal period are predominantly localized in the superficial GCL, whereas the percentage of adult-born neurons is higher in the deep GCL (Lemasson et al., 2005). In addition, genetic ablation of adult neurogenesis results in the elimination of granule cells in the deep, but not superficial, GCL (Imayoshi et al., 2008). These observations indicate that the molecular mechanisms controlling the targeting of newborn neurons in neonatal and adult OBs may be different. In line with this study are our results showing that the expression of TNR in the OB peaks at P30 and remains at this level into adulthood, and that TNR plays an important role in guiding newborn neurons in the adult OB but not in the perinatal OB. While the mechanisms controlling radial migration in the perinatal OB remain to be elucidated, it has been previously shown that embryonic OB harbors radial glia that extends processes from the ventricle to the OB surface (Puche and Shipley, 2001). During development, the majority of neuronal precursors in the neocortex, hippocampus, and cerebellum use glial processes for their migration (Hatten, 2002), and it is likely that in the developing OB neuroblasts also migrate along radial glia processes to reach their final destination. Interestingly, while it has been recently demonstrated that radial glia-like cells are present and might modulate the neuronal migration in the adult OB (Emsley et al., 2012), their number is much higher in the developing OB compared with adulthood (Puche and Shipley, 2001; Emsley et al., 2012). Thus, radial glia could provide an important structural support for migrating neuroblasts, and the higher number may account for radial migration in the developing OB. We propose that drastic reduction in the number of radial glia-like cells in the adulthood (Puche and Shipley, 2001; Emsley et al., 2012) combined with the expression of specific molecular cues such as TNR underlies changes in mechanisms of radial migration during postnatal development. This could explain the different pattern and dynamic of radially migrating neuroblasts at different periods of an animal's lifetime. Altogether, our results provide the first evidence for the existence of distinct molecular pathways controlling radial migration of neuroblasts during different periods of postnatal bulbar neurogenesis.
Role of TNR in adult OB neurogenesis
Using time-lapse video imaging, we demonstrated that a lack of TNR decreases the radial migration of neuroblasts in the adult OB, which is consistent with the accumulation of BrdU+ cells in the RMSOB of TNR−/− animals (Saghatelyan et al., 2004). Interestingly, a lack of TNR affected radial migration in the RMSOB and GCL, but not tangential migration in the RMSOB, indicating that TNR is not a “stop” signal for tangentially migrating neuroblasts, but rather favors the initiation of radial migration in the OB. A lack of TNR resulted in longer stationary phases of radially migrating neuroblasts. It has been suggested that TNR can be a “conducive” molecule (Lochter et al., 1995), and our data are in line with the facilitating effect of TNR on neurite outgrowth and growth cone dynamics of DRG neurons (Taylor et al., 1993). In addition, TNR affected the spine density of newborn GCs in the adult OB. In the hippocampus, TNR is localized at the edges of perisomatic inhibitory synapses (Saghatelyan et al., 2001), and TNR deficiency leads to structural alterations and a reduction in the number of perisomatic inhibitory synapses (Nikonenko et al., 2003).
Defects in the radial migration and spine development of newborn interneurons in the adult OB compromises the functioning of the bulbar neuronal network. Both spontaneous and evoked inhibitory currents received by mitral cells in TNR−/− mice were affected. In line with the reduced number of interneurons and spine density, and thus the reduced number of GABA release sites, the frequency of sIPSCs and mIPSCs was decreased. On the other hand, no changes in the amplitude and kinetics of sIPSCs and mIPSCs were observed, indicating that the functioning of postsynaptic GABAA receptors is not affected by the lack of TNR. This contrasts with the results obtained in the hippocampus, where a lack of TNR also affects the amplitude of postsynaptic GABAA receptor currents (Saghatelyan et al., 2001). This effect has, however, been attributed to the role of the HNK-1 carbohydrate moiety on the TNR protein backbone (Saghatelyan et al., 2000, 2003b). Thus, expression of HNK-1 in the OB will be interesting to analyze. Evoked DDIs recorded from mitral cells were also affected in the adult TNR−/− mice. It has been shown that the inhibition received by mitral cells is required to synchronize their activity (Bathellier et al., 2006; Lagier et al., 2007; Breton-Provencher et al., 2009). Experimental and theoretical approaches have revealed that decreased DDI amplitudes underlie changes in the oscillatory activity of mitral cells (Lagier et al., 2007). Our results showing that a decrease in the inhibitory drive of mitral cells in the adult TNR−/− mice resulted in reduced synchronized activity of these principal neurons is in agreement with this.
The synchronized activity of mitral cells is thought to be involved in odor information processing (Laurent et al., 2001; Saghatelyan et al., 2003a; Lagier et al., 2007; Breton-Provencher et al., 2009) and newborn bulbar interneurons play an important role in this process (Lledo et al., 2006; Mandairon et al., 2011; Breton-Provencher and Saghatelyan, 2012). Our behavior experiments are also in line with these observations since adult TNR-deficient mice showing compromised adult neurogenesis and changes in the functioning of the bulbar network, performed poorly in specific odor behavior tasks. In terms of spontaneous odor tasks, it has been shown that adult-born neurons are involved in the discrimination of perceptually similar odors and short-term odor memory (Rochefort et al., 2002; Breton-Provencher et al., 2009; Moreno et al., 2009). Using two dissimilar odors at different dilutions, we were unable to detect any differences in the odor discrimination between TNR+/+ and TNR−/− mice, unlike observations showing that aged mice with reduced neurogenesis perform poorly in fine odor discrimination tasks (Enwere et al., 2004). It should be mentioned, however, that Enwere et al. (2004) used an associative odor discrimination paradigm where mice are trained to associate an odor with a water reward, which may not be comparable to the test used in the present study. It is conceivable that, depending on the nature of the odor discrimination test (spontaneous vs associative), the involvement of adult-born neurons may be different. In line with this are observations that the involvement of newborn neurons in operant versus nonoperant odor-conditioning olfactory tests is different (Mandairon et al., 2011). With regard to spontaneous short-term odor memory, it has been shown that environmental enrichment that increases the number of newborn neurons in the adult OB improves short-term odor memory (Rochefort et al., 2002), whereas pharmacological ablation of adult-born neurons reduces short-term odor memory (Breton-Provencher et al., 2009). Our observation that spontaneous short-term memory is reduced in adult TNR−/− mice is in agreement with these reports. While several behavioral alterations such as increased anxiety and decreased motor coordination have been reported for TNR−/− mice (Freitag et al., 2003), we believe that these changes are unlikely to account for the modifications in odor behavior observed in the present study. First, we used the same experimental paradigm in terms of spatial, motor, and contextual characteristics for the odor discrimination, odor detection, and short-term odor memory tests, and observed modifications exclusively in short-term odor memory tasks. In addition, we used the same cohort of mice at P25–P30 and P110–P120 and observed changes in odor behavior only in the mice at P110–P120, whereas alterations in anxiety and motor behavior appeared already in mice at 3 weeks of age. Thus, our study, in addition to identifying the molecular cue that differently regulates radial migration and spine development of newborn cells in the perinatal and adult OB, also supports the notion that that newborn neurons in the adult OB are involved in some, but not all, odor behavior tasks (Breton-Provencher et al., 2009; Breton-Provencher and Saghatelyan, 2012).
Footnotes
This work was supported by operating grants from the Canadian Institutes of Health Research and the National Science and Engineering Research Council of Canada to A.S. A.S. is the recipient of a Canada Research Chair in postnatal neurogenesis. M.S. is supported by the New Jersey Commission for Spinal Cord Research. We thank the Platform for Cellular Imaging of Le Centre de Recherche de l'Institut Universitaire en Santé Mentale de Québec for producing the GFP-encoding lentiviruses and retroviruses.
The authors declare no financial conflicts of interest.
References
- Altman J. Autoradiographic and histological studies of postnatal neurogenesis. IV. Cell proliferation and migration in the anterior forebrain, with special reference to persisting neurogenesis in the olfactory bulb. J Comp Neurol. 1969;137:433–457. doi: 10.1002/cne.901370404. [DOI] [PubMed] [Google Scholar]
- Bartsch U, Pesheva P, Raff M, Schachner M. Expression of janusin (J1–160/180) in the retina and optic nerve of the developing and adult mouse. Glia. 1993;9:57–69. doi: 10.1002/glia.440090108. [DOI] [PubMed] [Google Scholar]
- Bathellier B, Lagier S, Faure P, Lledo PM. Circuit properties generating gamma oscillations in a network model of the olfactory bulb. J Neurophysiol. 2006;95:2678–2691. doi: 10.1152/jn.01141.2005. [DOI] [PubMed] [Google Scholar]
- Batista-Brito R, Close J, Machold R, Fishell G. The distinct temporal origins of olfactory bulb interneuron subtypes. J Neurosci. 2008;28:3966–3975. doi: 10.1523/JNEUROSCI.5625-07.2008. [DOI] [PMC free article] [PubMed] [Google Scholar]
- Bolteus AJ, Bordey A. GABA release and uptake regulate neuronal precursor migration in the postnatal subventricular zone. J Neurosci. 2004;24:7623–7631. doi: 10.1523/JNEUROSCI.1999-04.2004. [DOI] [PMC free article] [PubMed] [Google Scholar]
- Bozoyan L, Khlghatyan J, Saghatelyan A. Astrocytes control the development of the migration-promoting vasculature scaffold in the postnatal brain via VEGF signaling. J Neurosci. 2012;32:1687–1704. doi: 10.1523/JNEUROSCI.5531-11.2012. [DOI] [PMC free article] [PubMed] [Google Scholar]
- Breton-Provencher V, Saghatelyan A. Newborn neurons in the adult olfactory bulb: unique properties for specific odor behavior. Behav Brain Res. 2012;227:480–489. doi: 10.1016/j.bbr.2011.08.001. [DOI] [PubMed] [Google Scholar]
- Breton-Provencher V, Lemasson M, Peralta MR, 3rd, Saghatelyan A. Interneurons produced in adulthood are required for the normal functioning of the olfactory bulb network and for the execution of selected olfactory behaviors. J Neurosci. 2009;29:15245–15257. doi: 10.1523/JNEUROSCI.3606-09.2009. [DOI] [PMC free article] [PubMed] [Google Scholar]
- Castillo PE, Carleton A, Vincent JD, Lledo PM. Multiple and opposing roles of cholinergic transmission in the main olfactory bulb. J Neurosci. 1999;19:9180–9191. doi: 10.1523/JNEUROSCI.19-21-09180.1999. [DOI] [PMC free article] [PubMed] [Google Scholar]
- Emsley JG, Menezes JR, Madeiro Da Costa RF, Martinez AM, Macklis JD. Identification of radial glia-like cells in the adult mouse olfactory bulb. Exp Neurol. 2012;236:283–297. doi: 10.1016/j.expneurol.2012.05.012. [DOI] [PMC free article] [PubMed] [Google Scholar]
- Enwere E, Shingo T, Gregg C, Fujikawa H, Ohta S, Weiss S. Aging results in reduced epidermal growth factor receptor signaling, diminished olfactory neurogenesis, and deficits in fine olfactory discrimination. J Neurosci. 2004;24:8354–8365. doi: 10.1523/JNEUROSCI.2751-04.2004. [DOI] [PMC free article] [PubMed] [Google Scholar]
- Freitag S, Schachner M, Morellini F. Behavioral alterations in mice deficient for the extracellular matrix glycoprotein tenascin-R. Behav Brain Res. 2003;145:189–207. doi: 10.1016/S0166-4328(03)00109-8. [DOI] [PubMed] [Google Scholar]
- Hatten ME. New directions in neuronal migration. Science. 2002;297:1660–1663. doi: 10.1126/science.1074572. [DOI] [PubMed] [Google Scholar]
- Imayoshi I, Sakamoto M, Ohtsuka T, Takao K, Miyakawa T, Yamaguchi M, Mori K, Ikeda T, Itohara S, Kageyama R. Roles of continuous neurogenesis in the structural and functional integrity of the adult forebrain. Nat Neurosci. 2008;11:1153–1161. doi: 10.1038/nn.2185. [DOI] [PubMed] [Google Scholar]
- Isaacson JS. Mechanisms governing dendritic gamma-aminobutyric acid (GABA) release in the rat olfactory bulb. Proc Natl Acad Sci U S A. 2001;98:337–342. doi: 10.1073/pnas.98.1.337. [DOI] [PMC free article] [PubMed] [Google Scholar]
- Isaacson JS, Strowbridge BW. Olfactory reciprocal synapses: dendritic signaling in the CNS. Neuron. 1998;20:749–761. doi: 10.1016/S0896-6273(00)81013-2. [DOI] [PubMed] [Google Scholar]
- Kelsch W, Lin CW, Lois C. Sequential development of synapses in dendritic domains during adult neurogenesis. Proc Natl Acad Sci U S A. 2008;105:16803–16808. doi: 10.1073/pnas.0807970105. [DOI] [PMC free article] [PubMed] [Google Scholar]
- Kim Y, Comte I, Szabo G, Hockberger P, Szele FG. Adult mouse subventricular zone stem and progenitor cells are sessile and epidermal growth factor receptor negatively regulates neuroblast migration. PLoS One. 2009;4:e8122. doi: 10.1371/journal.pone.0008122. [DOI] [PMC free article] [PubMed] [Google Scholar]
- Kriegstein A, Alvarez-Buylla A. The glial nature of embryonic and adult neural stem cells. Annu Rev Neurosci. 2009;32:149–184. doi: 10.1146/annurev.neuro.051508.135600. [DOI] [PMC free article] [PubMed] [Google Scholar]
- Lagier S, Carleton A, Lledo PM. Interplay between local GABAergic interneurons and relay neurons generates gamma oscillations in the rat olfactory bulb. J Neurosci. 2004;24:4382–4392. doi: 10.1523/JNEUROSCI.5570-03.2004. [DOI] [PMC free article] [PubMed] [Google Scholar]
- Lagier S, Panzanelli P, Russo RE, Nissant A, Bathellier B, Sassoè-Pognetto M, Fritschy JM, Lledo PM. GABAergic inhibition at dendrodendritic synapses tunes gamma oscillations in the olfactory bulb. Proc Natl Acad Sci U S A. 2007;104:7259–7264. doi: 10.1073/pnas.0701846104. [DOI] [PMC free article] [PubMed] [Google Scholar]
- Laurent G, Stopfer M, Friedrich RW, Rabinovich MI, Volkovskii A, Abarbanel HD. Odor encoding as an active, dynamical process: experiments, computation, and theory. Annu Rev Neurosci. 2001;24:263–297. doi: 10.1146/annurev.neuro.24.1.263. [DOI] [PubMed] [Google Scholar]
- Law AK, Pencea V, Buck CR, Luskin MB. Neurogenesis and neuronal migration in the neonatal rat forebrain anterior subventricular zone do not require GFAP-positive astrocytes. Dev Biol. 1999;216:622–634. doi: 10.1006/dbio.1999.9498. [DOI] [PubMed] [Google Scholar]
- Lazarini F, Lledo PM. Is adult neurogenesis essential for olfaction? Trends Neurosci. 2011;34:20–30. doi: 10.1016/j.tins.2010.09.006. [DOI] [PubMed] [Google Scholar]
- Lemasson M, Saghatelyan A, Olivo-Marin JC, Lledo PM. Neonatal and adult neurogenesis provide two distinct populations of newborn neurons to the mouse olfactory bulb. J Neurosci. 2005;25:6816–6825. doi: 10.1523/JNEUROSCI.1114-05.2005. [DOI] [PMC free article] [PubMed] [Google Scholar]
- Lledo PM, Alonso M, Grubb MS. Adult neurogenesis and functional plasticity in neuronal circuits. Nat Rev Neurosci. 2006;7:179–193. doi: 10.1038/nrn1867. [DOI] [PubMed] [Google Scholar]
- Lochter A, Taylor J, Braunewell KH, Holm J, Schachner M. Control of neuronal morphology in vitro: interplay between adhesive substrate forces and molecular instruction. J Neurosci Res. 1995;42:145–158. doi: 10.1002/jnr.490420202. [DOI] [PubMed] [Google Scholar]
- Mandairon N, Sultan S, Nouvian M, Sacquet J, Didier A. Involvement of newborn neurons in olfactory associative learning? The operant or non-operant component of the task makes all the difference. J Neurosci. 2011;31:12455–12460. doi: 10.1523/JNEUROSCI.2919-11.2011. [DOI] [PMC free article] [PubMed] [Google Scholar]
- Moreno MM, Linster C, Escanilla O, Sacquet J, Didier A, Mandairon N. Olfactory perceptual learning requires adult neurogenesis. Proc Natl Acad Sci U S A. 2009;106:17980–17985. doi: 10.1073/pnas.0907063106. [DOI] [PMC free article] [PubMed] [Google Scholar]
- Murase S, Horwitz AF. Deleted in colorectal carcinoma and differentially expressed integrins mediate the directional migration of neural precursors in the rostral migratory stream. J Neurosci. 2002;22:3568–3579. doi: 10.1523/JNEUROSCI.22-09-03568.2002. [DOI] [PMC free article] [PubMed] [Google Scholar]
- Nikonenko A, Schmidt S, Skibo G, Brückner G, Schachner M. Tenascin-R-deficient mice show structural alterations of symmetric perisomatic synapses in the CA1 region of the hippocampus. J Comp Neurol. 2003;456:338–349. doi: 10.1002/cne.10537. [DOI] [PubMed] [Google Scholar]
- Nissant A, Bardy C, Katagiri H, Murray K, Lledo PM. Adult neurogenesis promotes synaptic plasticity in the olfactory bulb. Nat Neurosci. 2009;12:728–730. doi: 10.1038/nn.2298. [DOI] [PubMed] [Google Scholar]
- Pencea V, Luskin MB. Prenatal development of the rodent rostral migratory stream. J Comp Neurol. 2003;463:402–418. doi: 10.1002/cne.10746. [DOI] [PubMed] [Google Scholar]
- Peretto P, Giachino C, Aimar P, Fasolo A, Bonfanti L. Chain formation and glial tube assembly in the shift from neonatal to adult subventricular zone of the rodent forebrain. J Comp Neurol. 2005;487:407–427. doi: 10.1002/cne.20576. [DOI] [PubMed] [Google Scholar]
- Price JL, Powell TP. The synaptology of the granule cells of the olfactory bulb. J Cell Sci. 1970;7:125–155. doi: 10.1242/jcs.7.1.125. [DOI] [PubMed] [Google Scholar]
- Puche AC, Shipley MT. Radial glia development in the mouse olfactory bulb. J Comp Neurol. 2001;434:1–12. doi: 10.1002/cne.1160. [DOI] [PubMed] [Google Scholar]
- Rochefort C, Gheusi G, Vincent JD, Lledo PM. Enriched odor exposure increases the number of newborn neurons in the adult olfactory bulb and improves odor memory. J Neurosci. 2002;22:2679–2689. doi: 10.1523/JNEUROSCI.22-07-02679.2002. [DOI] [PMC free article] [PubMed] [Google Scholar]
- Saghatelyan AK, Gorissen S, Albert M, Hertlein B, Schachner M, Dityatev A. The extracellular matrix molecule tenascin-R and its HNK-1 carbohydrate modulate perisomatic inhibition and long-term potentiation in the CA1 region of the hippocampus. Eur J Neurosci. 2000;12:3331–3342. doi: 10.1046/j.1460-9568.2000.00216.x. [DOI] [PubMed] [Google Scholar]
- Saghatelyan AK, Dityatev A, Schmidt S, Schuster T, Bartsch U, Schachner M. Reduced perisomatic inhibition, increased excitatory transmission, and impaired long-term potentiation in mice deficient for the extracellular matrix glycoprotein tenascin-R. Mol Cell Neurosci. 2001;17:226–240. doi: 10.1006/mcne.2000.0922. [DOI] [PubMed] [Google Scholar]
- Saghatelyan AK, Snapyan M, Gorissen S, Meigel I, Mosbacher J, Kaupmann K, Bettler B, Kornilov AV, Nifantiev NE, Sakanyan V, Schachner M, Dityatev A. Recognition molecule associated carbohydrate inhibits postsynaptic GABA(B) receptors: a mechanism for homeostatic regulation of GABA release in perisomatic synapses. Mol Cell Neurosci. 2003b;24:271–282. doi: 10.1016/S1044-7431(03)00163-5. [DOI] [PubMed] [Google Scholar]
- Saghatelyan A, Carleton A, Lagier S, de Chevigny A, Lledo PM. Local neurons play key roles in the mammalian olfactory bulb. J Physiol Paris. 2003a;97:517–528. doi: 10.1016/j.jphysparis.2004.01.009. [DOI] [PubMed] [Google Scholar]
- Saghatelyan A, de Chevigny A, Schachner M, Lledo PM. Tenascin-R mediates activity-dependent recruitment of neuroblasts in the adult mouse forebrain. Nat Neurosci. 2004;7:347–356. doi: 10.1038/nn1211. [DOI] [PubMed] [Google Scholar]
- Saghatelyan A, Roux P, Migliore M, Rochefort C, Desmaisons D, Charneau P, Shepherd GM, Lledo PM. Activity-dependent adjustments of the inhibitory network in the olfactory bulb following early postnatal deprivation. Neuron. 2005;46:103–116. doi: 10.1016/j.neuron.2005.02.016. [DOI] [PubMed] [Google Scholar]
- Snapyan M, Lemasson M, Brill MS, Blais M, Massouh M, Ninkovic J, Gravel C, Berthod F, Götz M, Barker PA, Parent A, Saghatelyan A. Vasculature guides migrating neuronal precursors in the adult mammalian forebrain via brain-derived neurotrophic factor signaling. J Neurosci. 2009;29:4172–4188. doi: 10.1523/JNEUROSCI.4956-08.2009. [DOI] [PMC free article] [PubMed] [Google Scholar]
- Taylor J, Pesheva P, Schachner M. Influence of janusin and tenascin on growth cone behavior in vitro. J Neurosci Res. 1993;35:347–362. doi: 10.1002/jnr.490350402. [DOI] [PubMed] [Google Scholar]
- Vergaño-Vera E, Yusta-Boyo MJ, de Castro F, Bernad A, de Pablo F, Vicario-Abejón C. Generation of GABAergic and dopaminergic interneurons from endogenous embryonic olfactory bulb precursor cells. Development. 2006;133:4367–4379. doi: 10.1242/dev.02601. [DOI] [PubMed] [Google Scholar]
- Weber P, Bartsch U, Rasband MN, Czaniera R, Lang Y, Bluethmann H, Margolis RU, Levinson SR, Shrager P, Montag D, Schachner M. Mice deficient for tenascin-R display alterations of the extracellular matrix and decreased axonal conduction velocities in the CNS. J Neurosci. 1999;19:4245–4262. doi: 10.1523/JNEUROSCI.19-11-04245.1999. [DOI] [PMC free article] [PubMed] [Google Scholar]
- Wichterle H, Turnbull DH, Nery S, Fishell G, Alvarez-Buylla A. In utero fate mapping reveals distinct migratory pathways and fates of neurons born in the mammalian basal forebrain. Development. 2001;128:3759–3771. doi: 10.1242/dev.128.19.3759. [DOI] [PubMed] [Google Scholar]