

Abstract
Human behavior is imperfect. This is notably clear during repetitive tasks in which sequences of errors or deviations from perfect performance result. These errors are not random, but show patterned fluctuations with long-range temporal correlations that are well described using power-law spectra P(f)∝1/fβ, where β is the power-law scaling exponent describing the decay in temporal correlations. The neural basis of temporal correlations in such behaviors is not known. Interestingly, long-range temporal correlations are a hallmark of amplitude fluctuations in resting-state neuronal oscillations. Here, we investigated whether the temporal dynamics in brain and behavior are related. Thirty-nine subjects' eyes-open rest EEG was measured. Next, subjects reproduced without feedback a 1 s interval by tapping with their right index finger. In line with previous reports, we found evidence for the presence of long-range temporal correlations both in the amplitude modulation of resting-state oscillations in multiple frequency bands and in the timing-error sequences. Frequency scaling exponents of finger tapping and amplitude modulation of oscillations exhibited large individual differences. Neuronal dynamics of resting-state alpha-band oscillations (9–13 Hz) recorded at precentral sites strongly predicted scaling exponents of tapping behavior. The results suggest that individual variation in resting-state brain dynamics offer a neural explanation for individual variation in the error dynamics of human behavior.
Introduction
Human behavior is imperfect. Even tasks as simple as tapping your finger at a fixed interval produce small errors in timing preventing us from attaining perfect performance, whether the interval is guided by a metronome (Hennig et al., 2011) or not (Gilden et al., 1995). Sequences of tapping errors do not vary randomly from tap to tap, but show patterned fluctuations where timing errors are propagated to subsequent taps, yielding temporal correlations that span over hundreds of seconds (Gilden et al., 1995). The error time-series are well described with power-law frequency spectra (Gilden et al., 1995), P(f)∝1/fβ, where P is the power of the frequency component f and the scaling exponent β reflects propagation of timing errors. The observed values for β lie in the neighborhood of 1, suggesting that the signals have long-range temporal correlations (Chen et al., 1997; Rangarajan and Ding, 2000; Hennig et al., 2011; Torre et al., 2011). Other behavioral data showing evidence for power-law frequency scaling in the temporal organization of errors include size estimation and the detection of threshold stimuli (Gilden et al., 1995; Gilden, 1997; Monto et al., 2008). Long-range temporal correlations in man-made sequences outside the laboratory are also well documented, e.g., the loudness fluctuations in various types of music and speech (Voss and Clarke, 1975; Levitin et al., 2012).
The source of long-range temporal correlations in cognitive time-series is poorly understood (Kello et al., 2010). Intriguingly, neuronal time series exhibit similar temporal correlations, with power spectra that closely follow the 1/fβ scaling. For example, the spectra of the amplitude modulation of neuronal oscillations in different frequency bands show power-law frequency spectra over a large frequency range (Linkenkaer-Hansen et al., 2001; Berthouze et al., 2010). The observed values for β for the amplitude modulation of oscillations are typically lower than 1.0, but significantly larger than 0, which again is interpreted as evidence for long-range temporal correlations in the signals (Rangarajan and Ding, 2000; Linkenkaer-Hansen et al., 2001, 2007; Nikulin and Brismar, 2005; He et al., 2010; Kello et al., 2010; Nikulin et al., 2012). This has led to hypotheses that behavioral performance is biased by this intrinsic dynamics of the brain (Linkenkaer-Hansen et al., 2001; Palva et al., 2013). Many studies on power-law scaling in complex systems have emphasized the “universality” of the dynamics, i.e., scaling exponents appear to have negligible dependence on the exact parameters of the model or system (Bak, 1996; Paczuski et al., 1996; Plenz, 2012). Recently, however, several studies have observed considerable variation in scaling exponents across subjects, which cannot be attributed to measurement noise. For example, the scale-free modulation of alpha-band oscillations is heritable (Linkenkaer-Hansen et al., 2007) as estimated from the resemblance in detrended fluctuation analysis (DFA) exponents across monozygotic and dizygotic twin pairs. Also, computational modeling of ongoing oscillations have indicated that minor changes in the connectivity of the underlying networks can strongly influence the long-range temporal correlations (Poil et al., 2012). Clearly, not all power laws are “universal” and it would be interesting to know what consequences variation in neural scaling behavior may have for information processing.
Although temporal correlations in finger-tapping have been extensively studied (Gilden et al., 1995; Chen et al., 1997; Hennig et al., 2011), it has not been investigated whether their individual differences can be linked to individual differences in long-range temporal correlations in brain activity. We therefore used a classical finger-tapping task to obtain timing-error sequences and correlated the frequency scaling exponents to those of neuronal oscillations recorded in a separate resting-state session.
Materials and Methods
Subjects.
Thirty-nine subjects (28 females, average age 22.4, range 21–25) were students of the VU University and received no credit or payment. All subjects were informed about the nature of the experiment, and signed an informed consent in accordance with the Helsinki treaty. The experiment was approved by the Faculty of Psychology and Education ethical review board.
Procedure.
For the resting-state condition, subjects were instructed to sit silently with eyes open and to minimize movement, including eye movement, for 3 min. The finger-tapping condition consisted of 32 entrainment stimuli (0.4 degree visual angle white-on-black square presented for a duration of 500 ms on a computer monitor with an onset-to-onset interval of 1000 ms), which subjects were asked to follow with keyboard presses using their right index finger or index and middle fingers. After the entrainment stimulus disappeared, subjects continued without pause to press at approximately the same interval but now self-paced without external cue. This continued for 400 presses. This whole procedure was then repeated after a short break. Power-law frequency scaling exponents were computed separately for the two blocks and averaged for each subject. The final observations are therefore based on 800 taps and 6 min of resting-state recording.
EEG registration.
The resting-state recordings measured EEG with a 128 channel BioSemi Ag/AgCl active electrode configuration with driven right leg circuit. The sampling frequency was 1024 Hz and the low-pass filter during acquisition was 205 Hz. The data were down sampled to 128 Hz for all analyses reported here. We used EEGLAB and custom scripts in MATLAB (MathWorks for EEG data analysis. Bad channels (on average two channels per subject) were identified by visually inspecting the broadband EEG traces. EEG signals were rereferenced to average reference. Episodes with below standard signal were removed, and consisted of <5% of the data in all cases (on average approximately two signals). Independent component analysis was used to remove components reflecting blink, eye movement, muscle, and heartbeat artifacts. Bad electrodes were then interpolated using a fast 2D spatial spline interpolation.
During each finger tapping session, EEG was measured with the configuration and data cleaning procedure as the resting state. Next, data were epoched from 1400 ms before to 1400 ms after the finger-tapping event. We randomly picked 50 epochs per subject for wavelet-based time-frequency analysis and calculation of event-related potentials (ERP). The same 50 epochs were used to determine overall power in the selected frequency band (9.0–13.0 Hz) using Welch's periodogram method.
Power-law scaling analysis for estimating long-range temporal correlations.
EEG signals from the 128 locations were zero-phase bandpass filtered with a 6 dB finite-impulse response filter in the frequency bands of delta (2.0–3.5 Hz), theta (4.5–6.5 Hz), alpha (9–13 Hz), beta (18.0–26.0 Hz), and gamma (36.0–46.0 Hz) oscillations. Next, the envelope around the oscillations was determined as the absolute value of the complex-valued |s(t) + iH(s(t))| of the filtered signal s(t) (Fig. 1A) and its Hilbert transform H(s(t)), . We estimated the power spectrum density using Welch's periodogram with 75% overlapping windows with Hanning envelope of 64 s enabling detection of amplitude modulations of narrow-band oscillations down to 0.0156 Hz. The exponent β was defined as the slope of the linear regression of log-power on log-frequency from 0.0156 to 2 Hz. The procedure was repeated for the second session and the exponents averaged across sessions.
Figure 1.
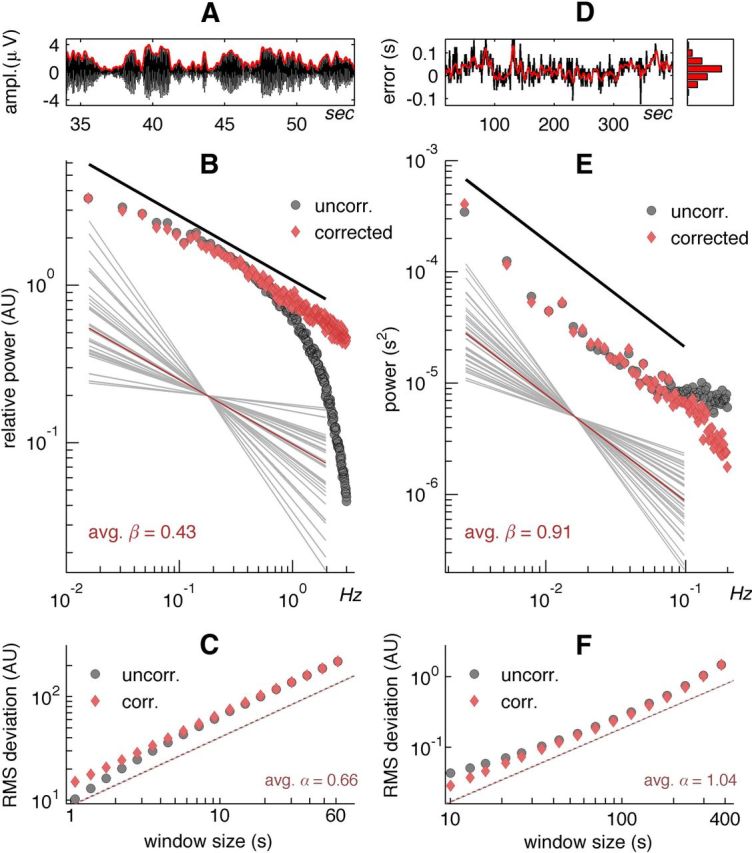
Long-range temporal correlations in alpha oscillations and tapping-error sequences exhibit large individual variation. A, Brain oscillations filtered at 9–13 Hz (black) exhibit amplitude modulation (red) on multiple time scales. B, Grand-average power spectrum of the amplitude modulation of alpha oscillations at channel CP3 exhibited 1/fβ scaling as indicated by the log-log linearity for raw spectra (black) <1 Hz and for spectra after correcting for the temporal integration effect of the narrow-band filtering (red). The slope of the line represents the scaling exponent β and its deviation from zero is a measure of temporal correlations in brain states. The large individual variability in scaling exponents is depicted by the bowtie-shaped collection of regression lines (gray) around the average (red). C, In agreement with the 1/fβ scaling in B, also the log-log linear increase in the DFA fluctuation function with a slope steeper than 0.5, which is the exponent of a white-noise signal, suggested that the amplitude modulation of alpha-band oscillations exhibited long-range temporal correlations. Grand-average DFA plots for uncorrected (black) and filter-corrected (red) amplitude modulations in the range from 1 to 60 s. D, An example sequence of finger-tapping errors, expressed as deviation to perfect 1.0 s performance also shows complex temporal variation with error propagation in the 0.2 Hz low-pass filtered signal (red). Note the close to normal distribution of the tapping errors in the marginal histogram. E, Finger-tapping error sequences also showed linearity in log-log coordinates <0.1 Hz (black line) in the grand-averaged power spectra. The deviation from the 1/fβ at frequencies >0.1 Hz has previously been modeled as a motor component in tapping timing. After correction using the Wing and Kristofferson (1973) two-compartmental model good linearity was obtained. Here, too, a large individual variability in β (gray) around the average (red) was observed. F, The DFA fluctuation function showed good linear fit from 10 to 384 s after correcting for the motor delay effect (red dashed). The slope was significantly larger than 0.5 (gray).
Behavioral sequences were 399 tap-to-tap intervals, measured twice in each individual. Very short (<0.52 s) and very long (>1.8 s) were deemed mistakes of double tapping and missed taps respectively, and removed. Sequences were reduced to 384 valid taps by removing the first of the remaining tapping intervals. FFT was applied to the full window, and the complex absolute values squared to obtain power. Exponent β is defined as the slope of the regression of log(power) on log(frequency) for 0.0026 Hz to 0.067 Hz corresponding to the straight-line regime in Figure 1E. This was repeated for the second session and the exponents averaged across sessions.
In addition to determining the spectral slope β, we applied DFA (Peng et al., 1995) to both EEG oscillations and tapping-error sequences. This procedure calculates the DFA exponent α by first computing the cumulative sum of the signal, dividing it into windows of a specified length in which the cumulative sum is linearly detrended, and computing the root-mean-square (RMS) deviation from zero. The RMS of adjacent windows is averaged. This process is repeated for logarithmically increasing window sizes. Our analysis of the amplitude modulation of oscillations used windows from 0.5 to 64 s (which are the reversed of the frequencies used in the slope regression in the power spectrum scaling analysis). The results did not critically depend on the choice of the upper or lower limit (viz, windowing 1–24 s revealed highly similar results). The DFA exponent α is then defined as the slope of the linear regression of log(RMS scores) on log(window size). Note that for ideal signals the DFA exponent α is related to the power-spectrum exponent as β = 2α − 1 (Rangarajan and Ding, 2000). To estimate the tapping-error power-law exponents, we used the same approach but with window sizes from 15 to 384 s.
Correcting estimates of long-range temporal correlations for filter-integration and motor-delay effects.
The estimates for long-range temporal correlations in the alpha-band modulation are biased by the narrow-band filtering of 9.0–13.0 Hz. To remove this, we created 1000 random signals, which were bandpass filtered identically to the EEG signals and assessed for long-range temporal correlations. It was clearly observed that this resulted in a strong decay in modulation power at frequencies >0.5 Hz, resulting in an overestimation of the steepness of the slope. A similar effect was found for RMS variation in short time windows in the DFA analysis. We used these filter-induced deviations to correct spectra by subtracting the difference of the spectral estimates to a perfect flat line. For DFA regression, we subtracted the difference between the filtered noise estimates to the perfect 0.5 slope to obtain the correction values.
Spectral estimates of behavioral sequences were also expected to deviate from power-law straight-line regime because of the influence of known Gaussian white-noise contributions to the timing interval. The two-compartmental model for timing intervals introduced by Wing and Kristofferson (1973) entails two processes, the timing process C and the motor-delay process D, each contributing to the variance of the timing intervals. C contributes directly to the timing interval, whereas D's influence is more complex. Each random fluctuation in the inter-tap interval Ij increases the interval by Dj (for the j′th tap), but is also influenced by the fluctuation of the previous finger-tap Dj−1. Gilden et al., (1995) provided evidence that when modeling C as a 1/fβ signal with β close to 1.0, and D as a Gaussian random signal, an excellent fit to the observed data is obtained. Using this model, we simulated 400 time-series of equal length to the finger-tapping sequences (384 taps) with C as 1/f0.91 signal (Fig. 1 and Gilden et al., 1995 show the choice of the exponent 0.91), and D as a normalized Gaussian random signal. The ratio of the variance of simulated C and D effects in the admixture of the two processes to obtain the simulated tapping series was set to 1.3 conforming to the observations by Gilden et al., (1995) for 1 Hz finger tapping. This produced power spectra with a clear upward deviation from 1/f and even upward slopes in the higher frequencies. By subtracting these spectra from perfect straight-line 1/f0.91 spectra we obtained a correction factor at each frequency that was applied to the observed power spectra. A similar correction was obtained for the DFA regression.
Estimating power-law goodness-of-fit with mean square error.
We performed a goodness-of-fit of linearity in the power-law regression in both DFA and spectral analysis. Often-used measures, such as r2, are heavily confounded with the slope of the regression; i.e., linear regression of a perfect 1/f1.0 signal will give r2 = 1, whereas perfect white noise (1/f0) will show r2 = 0 with an equally perfect straight line but zero slope, rendering r2 less useful as a measure of linearity when it is expected to include lines with near zero slope. We therefore opted to additionally report goodness-of-fit on unstandardized Y residuals after linear detrending. For both the spectral analysis and the DFA analyses, the log10-based scale of these residuals forces a fixed interpretation of the mean squared error (MSE) as an average percentage of deviation from the regression, for example, a MSE = 0.10 would indicate that on average points fall 100.10 = 25.9% above and below the linear trend. This is about the size of the diamond markers in Figure 1C,F, and constitutes an r2 value of 0.98 at a slope of 1.0. Alternatively, MSE = 0.20 results in points 58% from the linear trend and r2 = 0.89 at a slope of 1.0.
Statistics.
The exponents of the tapping-error sequence were correlated with the exponents of the amplitude modulation of the 9.0–13.0 Hz oscillations for each of the 128 electrode positions using standard Pearson correlation analysis. Bonferroni significance was determined as 0.05 divided by the rank of the EEG data, which was 127 due to the average reference used (p < 0.000394). In addition, we used a Monte-Carlo cluster permutation test, which corrects for multiple testing, nonnormal data distributions, and high-leverage data points, which was based on the procedure by (Maris and Oostenveld, 2007). This procedure first calculated the 128 Pearson correlation coefficients, r, between x (brain, 128 positions by N = 39 observations) and y (behavior, N = 39 observations), and calculated the associated t statistic using standard formulas. Then, we marked correlations with a stringent, but arbitrary cutoff of p < 0.005 and identified clusters as adjacent marked correlations. Adjacency was determined using the 2D Delaunay triangulation method. The test statistic was the sum of the t values within clusters, and the two largest values noted. Next, we selected 50,000 of the 39! permutations of the rows of y and recombined with x thus breaking the relation between y and x. With the shuffled data we followed the same procedure of marking correlations, summing t values within clusters significant at p < 0.005, and identifying the largest cluster statistics. This resulted in an empirical distribution of summed t values under the null hypothesis (which may not have a Student distribution) to which the actually observed summed t values for the largest cluster were compared and the empirical p values determined.
Test-retest reliability was determined by simple correlation across blocks. Because these represent the reliability of the shorter 3 min EEG recordings for brain exponents or 400 tapping sequence for behavioral exponents, we corrected these scores as described previously (Smit et al., 2008). This procedure estimates the reliability of the total of 6 min EEG and 800 taps by assuming that unreliable variance will be halved with each doubling of the number of blocks:
 |
where rretest is the test-retest correlation.
Results
Finger tapping causes alpha/mu power reduction
We assumed that a correlation could be observed for oscillations that are visible in the resting-state EEG and also related to finger tapping. Mu is an alpha-like oscillation with a frequency at ∼9–13 Hz and which desynchronizes upon movement. We validated the choice of the 9.0–13.0 Hz frequency band by calculating the power-reduction effect (the so-called mu-effect, (Niedermeyer, 1999) by comparing oscillation power during finger tapping to oscillation power during eyes-open rest. Power was collected in bins of 1 Hz wide for all frequencies ranging from 2.0 to 45.0 Hz, and significant reductions marked at p < 0.05 (two-tailed). This resulted in significant reductions only in the four adjacent bins with frequencies from 9.0 to 13.0 Hz.
Power-law characterization of alpha-band amplitude modulation
To estimate long-range temporal correlations in ongoing alpha-band oscillations, we used the standard preprocessing procedure of filtering the EEG from 9.0–13.0 Hz and extracting the amplitude envelope using the Hilbert transform (Fig. 1A). Spectral analysis of the amplitude envelope revealed the well documented 1/fβ scaling in the amplitude modulation of alpha oscillations (Linkenkaer-Hansen et al., 2001), where β is the slope of the straight-line fit in log–log coordinates (Fig. 1B). Subjects showed large individual variation in exponents (Fig. 1B, bowtie inset; 0.07 < b < 1.06 across subjects for the centro-parietal channel). The values for β were significantly larger than 0 (across channels: M > 0.21, t(39) > 6.5, p < 10−6) suggesting that these scaling exponents reflect the presence long-range temporal correlations. The goodness-of-fit MSE indicated an error across all channels and subjects of 52.8% (SD 5.2%) and 43.3% (SD 3.7%) for uncorrected and corrected spectra, respectively. These numbers yield an r2 fit index >0.89 at a slope of 1.0 (see Materials and Methods).
High exponents have relatively more low-frequency power corresponding to stronger temporal correlations, which reflect more persistent brain states than low exponents. Figure 1C shows the average DFA regression of RMS deviation around the trend line as a function of window size, uncorrected and corrected for the filter effect caused by the 9.0–13.0 Hz filter. Again, the individual variation in exponents was substantial (0.66 < α < 1.04). The values for α were significantly larger than 0.5 (across channels: M > 0.66, t(39) > 12.0, p < 10−13), again suggesting that these scaling exponents reflect the presence long-range temporal correlations. The linear fit was very good with MSE at 12.0% (SD = 3.0%) for the uncorrected and a mere 4.3% (SD = 2.1%) for the corrected DFA regression averaged across channels and subjects. These numbers compared with the (confounded) fit statistic r2 = 0.988 (SD = 0.006) for uncorrected and r2 = 0.997 (SD = 0.002) for corrected DFA regression, which is an excellent linear fit and much better than the spectral analysis. The fit statistics for both spectral and DFA regression show that the noisy nature of spectral estimates results in worse fit parameters than in DFA regression. The test-retest reliability scores for spectral exponents was 0.84 and for DFA exponents 0.76.
Power-law characterization of behavioral finger-tapping sequences
Behavioral sequences of tapping errors also showed complex fluctuations (Fig. 1D), which were characterized by 1/fβ power spectra (Fig. 1E) as reported previously (Gilden et al., 1995). The spectrum shows increased power in the high-frequency part, which is consistent with the (Wing and Kristofferson, 1973) model of finger tapping that explains a timing and a motor element, expanded by (Gilden et al., 1995) to include a scale-free element in the timing mechanism. Note, however, the good fit overall after correction (see Materials and Methods). Importantly, subjects showed large individual variation in the frequency scaling of tapping-error sequences (Fig. 1E, bowtie inset). The exponent β is the slope of the regression line (M = 0.91, range: 0.68 < β < 1.22). This range of values suggests that the tapping error signals have long-range temporal correlations, where high values for beta imply stronger temporal correlations, and thus more propagation of errors, than low exponents. Note that disregarding the temporal structure in the tapping data resulted in approximately normal distributions (Fig. 1D, marginal histogram), which may lead to the false assumption that the error sequence variation is Gaussian white noise, which carries no information. Figure 1F shows the average DFA regression of RMS variation around the trend line as a function of window size, uncorrected and corrected for the motor delay component in the Wing and Kristofferson model for tapping timing (see Materials and Methods). The reliability scores were moderate for both exponents β and α (0.36 and 0.50, respectively).
For the finger-tapping performance data, subjects were slightly faster than the required 1.0 s (M = −0.025 s, SD = 0.099). DFA scaling exponents were not correlated with the average tapping rate (r = 0.09, ns). Deviations from perfect tapping performance was defined as the absolute deviation around the perfect 1.0 s averaged over the whole sequence (M = 0.106, SD = 0.066), and was positively correlated with the DFA scaling exponent (r = 0.43, p = 0.0060). A median split into low and high behavioral exponents resulted in a highly significant difference in performance in an unequal-variances t test (Mhigh − Mlow = 70.6 ms, t(20.0) = 4.65, p = 0.00015). Thus, the data suggest that a good tapping performance is associated with a low propagation of errors.
Power-law exponents of the brain predict exponents of behavior in separate sessions
We tested whether the individual variations in power-law frequency scaling exponents of the alpha oscillation modulation could be related to that of the tapping-error sequences. The topographic distribution of spectral scaling exponents is shown in Figure 2A and showed bilateral maxima at 10/20 locations C3 and C4. This topography is different from those seen in Dehghani et al. (2010), which we attribute to the difference in the investigated parameters; Dehghani et al. (2010) investigated the scaling of broadband signals, whereas here we investigated the amplitude modulation of oscillations. The latter is not affected by the nonresistive properties of the brain, because the amplitude modulation on different timescales refer to the same narrow-band oscillation. The distribution of correlations with behavior is shown in Figure 2B. The permutation test revealed significant correlations in a cluster of four channels in the right hemisphere (average r = 0.48, permutation-based empirical p = 0.034). The average scaling exponent of channels in the significant cluster located near electrode positions FC2 and FC4 strongly predicted the behavioral power-law dynamics of tapping errors (Fig. 2C). To test the robustness of the relation between scale-free dynamics of ongoing oscillations and tapping errors obtained with the spectral analysis, we repeated the analysis using DFA. The topography of DFA exponents α (Fig. 2D) was highly similar to that of scaling exponents β from the spectral analysis (Fig. 2A). Again, we observed that scale-free dynamics of alpha oscillations of a six-channel cluster near electrode locations FC2 and FC4 correlated significantly with the dynamics of tapping error sequences (Fig. 2E; avg r = 0.51, empirical p = 0.021). For DFA exponents, one channel was found to be Bonferroni significant. The scatter plot of predicting DFA exponents of tapping errors from the DFA exponents of alpha oscillations at that scalp location showed a strong correlation (Fig. 2F).
Figure 2.

Scaling behavior of alpha oscillations predicts the power-law dynamics of human timing errors. A, Topography of power-law exponents β from spectral analysis. B, Topography of correlation coefficients between spectral power-law exponents β in oscillations and behavior revealed one significant cluster (gray circles). For anatomical reference, the positions of electrodes Fz, Cz, and Pz are indicated with diamonds. C, Scatter plot showed a strong correlation between the scaling exponents β of a channel near scalp location FP3 and exponents β of tapping errors. D, Topography of power-law exponents α from DFA. E, DFA exponents α revealed a similar cluster of significant channels at around electrode positions FC2, FC4. One electrode reached Bonferroni significance (white circle; p < 0.00039). F, Scatter plot between the DFA exponents in the significant cluster in E and those of the tapping-error sequences. G, Topography of EEG power in the 9–13 Hz range during eyes-open rest. H, The power of 9–13 Hz oscillations is reduced during tapping compared with eyes-open rest in scalp locations above the sensorimotor brain regions. I, Power of oscillations during eyes-open rest at scalp locations over right premotor areas did not predict behavioral exponents, which indicates that variation in signal-to-noise ratio of oscillations cannot explain the correlations shown in C and F.
Next, we investigated whether individual variation in the classical time-averaged oscillation power would also predict the individual subjects' tapping-error dynamics. The topographic distribution of oscillation power (Fig. 2G) differed substantially from those of spectral exponents (Fig. 2A) and DFA exponents (Fig. 2D). We note that finger tapping strongly reduced ∼10 Hz oscillation power over bilateral sensorimotor areas (Fig. 2H) compared with resting condition and that the significant clusters of brain-behavioral correlations in Figure 2B,E are located anterior of the motor-related power suppression. Thus, the data suggest that neural systems involved in the timing of finger tapping are located in premotor areas; however, future studies with individual MRI images available will have to confirm this using source modeling of the ongoing oscillations. Importantly, the alpha power from scalp locations over the premotor areas (the cluster in Fig. 2B,E) did not correlate with the behavioral exponents (across electrodes: abs(r)<0.21, ns), which emphasizes the importance of individual variation in long-time-scale neural dynamics for understanding individual variation in tapping performance.
Attenuated correlations of behavior with brain exponents during tapping
The main focus of this study was to investigate the functional implications of individual variation in scale-free dynamics of resting-state oscillations (Linkenkaer-Hansen et al., 2007; Smit et al., 2011); however, we also investigated the correlations in the oscillations during tapping. Ongoing oscillations were strongly affected by the tapping task, not only as reflected in the well known amplitude suppression shown in Figure 2H, but also the DFA exponents were affected in most scalp locations (Fig. 3A). Brain DFA exponents correlated only moderately (r = 0.37, range −0.07 < r < 0.70) between the resting and tapping conditions (Fig. 3B). These correlations are much lower than the average r = 0.76 for test–retest reliability between the two resting-state blocks and r = 0.86 between the two finger tapping blocks (both numbers corrected for the shorter measurement interval). This indicates that the tapping task introduced a substantial change in oscillatory dynamics, which is not attributable to measurement noise. As a result, the correlations between brain DFA exponents during tapping and behavioral exponents did not reach statistical significance (maximal r = 0.27, ns). Nevertheless, the maximum correlation was at the right premotor cluster and the scalp topography shown in Figure 3C (during tapping) was comparable to that of Figure 2E (during rest). Similarity in topography between tapping and resting brain exponents was assessed by correlating the 128 correlations obtained in each condition. This resulted in a strong correlation (r = 0.57, Fig. 3D), confirming the similarity of the scalp maps in predicting behavioral from brain exponents between the resting and tapping conditions.
Figure 3.

A comparison of DFA exponents between the finger tapping and eyes-open rest conditions indicates that tapping introduces different sources of variation that attenuate the correlation between brain and behavioral power-law dynamics. A, The difference in DFA exponents between tapping and eyes-open rest reveals changes across most of the scalp. B, Correlations of DFA exponents across the two conditions showed moderate stability, suggesting that the tapping behavior introduced different sources of variation. C, Although brain-behavior correlations of the DFA exponents were attenuated during tapping, the topography was highly similar to that during rest (Fig. 2B,E). D, Similarity in topography between tapping and resting conditions was assessed by correlating the 128 correlations obtained in each condition (r = 0.57).
Brain-behavior correlations were specific to the alpha oscillations
Delta, theta, beta, and gamma oscillations were defined as 2.0–3.5 Hz, 4.5–6.5 Hz, 18.0–26.0 Hz, and 36.0–46.0 Hz, respectively. Each panel in Figure 4 shows the distribution of the 128 correlation coefficients between finger-tapping exponents and exponents of the amplitude modulation of delta through gamma oscillations. In gray the DFA exponents and in red the spectral exponents. None of the frequency bands other than alpha/mu showed correlations that reached the threshold for statistical significance when correcting for multiple comparisons. Delta, theta, and gamma oscillations generally showed correlations that were lower than zero (negative shift of the histograms); however, even after averaging the DFA exponents across the scalp these correlations did not reach statistical significance.
Figure 4.
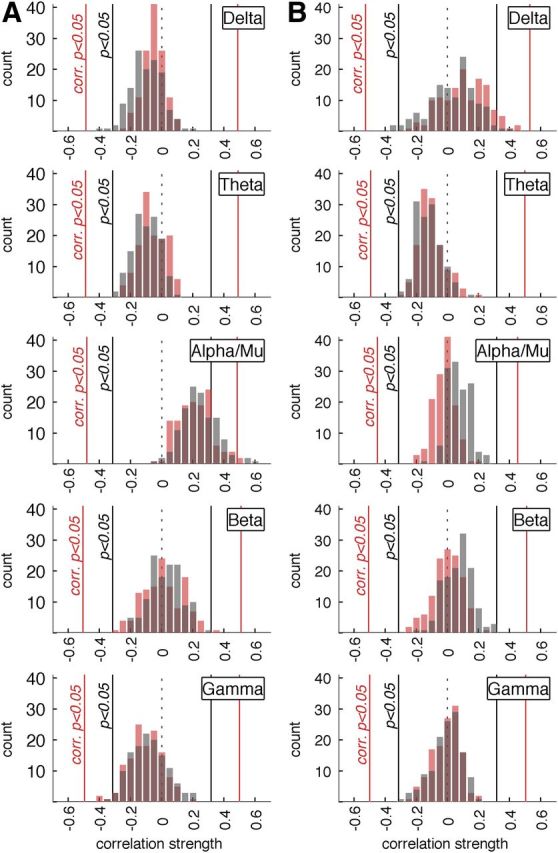
Significant brain–behavior correlations in scaling exponents are restricted to the alpha band. Delta, theta, alpha/mu, beta, and gamma oscillations were defined as 2.0–3.5 Hz, 4.5–6.5 Hz, 9.0–13.0 Hz, 18.0–26.0 Hz, and 36.0–46.0 Hz, respectively. Histograms for DFA exponents (dark gray) and spectral exponents (red) are overlaid and show a highly similar distribution. The black vertical lines (p < 0.05) indicate significance boundaries for a simple parametric test of a single correlation (N = 39) without correction for multiple testing for both DFA and spectral exponents. The red lines (corrected p < 0.05) indicate the significance boundaries for maximal and minimal correlations determined by permutation of DFA exponents, which corrects for multiple testing. A, DFA and spectral exponents derived from eyes-open resting EEG correlated with DFA and spectral exponents of behavior. Despite the negative shift in delta, theta, and gamma, frequency bands, only exponents of the amplitude modulation of the alpha/mu frequency band showed significant correlations with behavioral exponents. B, DFA and spectral exponents derived from tapping EEG correlated with DFA and spectral exponents of behavior. Delta showed a trend for positive correlation between brain and behavior, but no correlation reached significance after correcting for multiple testing.
Neuronal processes implicated with motor activity and error dynamics are distinct
To investigate whether neuronal processes directly related to the tapping were closely related to those underlying the error dynamics we analyzed the modulation of oscillation power and event-related fields related to the tapping. Figure 5A shows event-related spectral perturbation time locked to the tapping event from 1.4 s before to 1.4 s after for a left central (sensorimotor) channel, relative to the eyes-open rest power, for a left central channel. The alpha/mu frequencies showed a tonic reduction in power during finger tapping compared with eyes-open baseline. An event-related fluctuation was not obvious. This was quantified by calculating the 1 Hz modulation of alpha power (Fig. 5B), which was done by convolving the observed power signal at each frequency with a complex valued cosine/sine of 1 Hz, and taking RMS deviation. The power of this 1 Hz modulation—the approximate tapping frequency—was very low for alpha. By contrast, beta oscillations showed a clear event-related fluctuation at 1 Hz with a maximum at 22 Hz. Before the button press a clear event-related synchronization (ERS) was observed, which had a maximum at ∼380 ms before finger press event, followed by event-related desynchronization (ERD) starting around button press. This pattern of beta ERD/ERS and absence of alpha/mu ERD/ERS is consistent with earlier investigations (Neuper and Pfurtscheller, 2001; Toma et al., 2002; van Wijk et al., 2012). The scalp topography of 22 Hz beta ERD/ERS modulation resulted in a clear maximum over the left motor cortex (Fig. 5C); a pattern that deviates from both the bilateral mu depression effect and the correlational topographies in Figure 2B,E. These reactivity analyses of oscillations during tapping suggest that neuronal processes implicated with motor activity and error dynamics are distinct.
Figure 5.

Motor-related processing is topographically distinct from that of timing-error brain-behavior dynamics. A, Time-frequency power of oscillations during tapping is plotted relative to the power during eyes-open rest for a left central channel. B, Beta oscillations showed a clear modulation at around the 1 Hz tapping rate, whereas alpha/mu showed a sustained depression in power compared with eyes-open rest. C, Unlike the mu depression (Fig. 2H), the 1 Hz beta modulation was lateralized toward the contralateral motor areas (top). Alpha/mu showed no 1 Hz modulation on any scalp location (bottom). D, A subset of signals showed large ERP variation. Scalp topographies are shown for the three time points with largest RMS deviation across leads, the positions of leads included in the ERP plot are shown as diamonds. The largest RMS deviation appears 125 ms after finger press with a strong frontal positivity. Note that the large variation reappears 1 s before and after the event—the approximate tapping interval—but is much reduced because of jitter. The other time points with relatively large scalp potential variation showed reversed potentials with positivity over occipital areas and negativity over frontal. None of the scalp maps resembled those observed in Figure 2.
We additionally asked whether ERPs could point to overlapping neuronal processes between motor preparation or execution and those predicting the error dynamics (Fig. 2B,E). The three main event-related scalp potentials during finger tapping were selected on the basis of maximum between-channel variance and converted to topographic plots (Fig. 5D). The scalp distributions of these components, however, were very different from that of the correlations between behavioral and oscillatory dynamics, suggesting that a distinct functional entity underlies the timing-error variability.
Discussion
We investigated whether the well known individual variation in scale-free behavior of alpha oscillations (Linkenkaer-Hansen et al., 2007) is related to that of finger-tapping errors (Torre et al., 2011). Evidence for long-range temporal correlations in the modulation of ongoing oscillations during eyes-open rest was identified at all scalp locations in the form of spectral and DFA exponents significantly different from white noise (Rangarajan and Ding, 2000). The exponents over the right premotor brain regions strongly predicted timing-error propagation in a finger-tapping task performed in a separate session several minutes after. The topographic plot of maximal correlation anterior of the motor cortex suggests the involvement of the premotor areas, which would be consistent with earlier reports on the involvement of right premotor cortex during rhythm production (Lewis and Miall, 2003; Thaut, 2003; Chen et al., 2006, 2008). In the future, anatomically informed source localization could corroborate the exact source. More importantly, however, the result suggests that the functional organization of these areas, as reflected in the resting-state dynamics of ∼10 Hz oscillations, play a prominent role in 1/fβ scaling in timing errors.
Previous studies reporting a functional role of long-range temporal correlations in neuronal oscillations have done so by comparing different groups of participants, for example, control subjects and patients with Alzheimer's disease (Montez et al., 2009), epilepsy (Monto et al., 2007), depression (Linkenkaer-Hansen et al., 2005), or schizophrenia (Nikulin et al., 2012). We extended these findings by showing that describing time-series of oscillatory activity in normal participants with power-laws with variable exponents can predict power-laws in finger tapping sequences, suggesting that the brain's complex scale-free dynamics are directly or indirectly related to the scale-free dynamics in behavior. Because the brain's DFA exponents reflect expression of genetic variants (Linkenkaer-Hansen et al., 2007), and individual differences have consequences for behavior, the exponents are prime candidates to serve as endophenotypes in genetic studies that investigate the expression pathway from gene to normal brain functioning, brain development, or psychopathology (Smit et al., 2010, 2011; de Geus, 2010).
Overall, these results suggest that the correlations between brain exponents and behavior are evident only in alpha-frequency oscillations, although we cannot rule out that a larger study would reveal effects in other frequency bands (e.g., a negative correlation with delta oscillation modulation; Fig. 4). The scalp localization of the brain–behavior correlations suggests that neuronal sources in the premotor region are involved in timing. It is plausible that arousal fluctuations interact with the time-keeping process. Such arousal dynamics are also likely to exhibit interindividual variation and be reflected in the amplitude modulation of alpha oscillations, which could explain part of the observed correlations between long-range temporal correlations of alpha oscillations and of the tapping errors.
The brain power-law exponents showed good linear fit for spectral data and excellent fit for the DFA regression, which increased after correction of known effects of narrow-band filtering of EEG signals and a random motor delay in tapping timing. Although this does not exclude a good fit for other distribution functions (Clauset et al., 2009), the present study shows a clear link between individual differences in temporal correlations of brain and behavior. We also note that these exponents do not reflect temporal correlations in broadband scalp potentials as investigated in other studies (Miller et al., 2009; Dehghani et al., 2010), but in the amplitude modulation of narrow-band oscillatory activity. The modulation of oscillations are less likely to be influenced by instrument noise than broadband neural dynamics (Zarahn et al., 1997; Linkenkaer-Hansen et al., 2004a; He et al., 2010) and cannot be explained by the filtering characteristics of physiological tissues, because only a narrow frequency band (e.g., 9–13 Hz) is analyzed (Bédard et al., 2006). Long-range temporal correlations are also resistant to external white noise sources (Linkenkaer-Hansen et al., 2001, 2007). Baseline alpha oscillations, present in a few hundred milliseconds before trial execution, has been shown to predict performance during cognitive tasks (Linkenkaer-Hansen et al., 2004b; Babiloni et al., 2006; Hanslmayr et al., 2007). The current results support this view of intrinsic fluctuations in brain networks biasing subjects in the accuracy of tapping periodically.
Complex dynamics arising in complex systems may have advantageous computational properties (Haldeman and Beggs, 2005; Kinouchi and Copelli, 2006). Variability of the (DFA or spectral) exponents may reflect a tuning and adaptation to tasks that require different temporal correlations in brain activity (He et al., 2010). Interestingly, in the current case of finger tapping, subjects with lower exponents showed better performance, consistent with the observations by Hennig et al. (2011) who reported a positive correlation between tapping error and the scaling exponent of tapping errors. Similarly, our data showed a positive correlation (r = 0.43) between the exponents and absolute deviation from perfect performance. This performance dependency, however, seems to be mediated by poor performers propagating errors over time and worsening performance. We propose that the increasing long-range temporal correlations in reproducing a constant rhythm may be the cost of a complex motor system that should be able to adapt to changing demands and flexibly represent multiple modes of behavior. Practice, however, may tune the motor system for a better finger-tapping performance and possibly lead to lower exponents. On the other hand, in light of the high heritability of temporal correlations reflected in frequency scaling exponents (Linkenkaer-Hansen et al., 2007) it is conceivable that people born with a good sense of rhythm have weaker long-range temporal correlations of premotor alpha oscillations already before explicit learning or practice has taken place.
It was argued in Science that the universality of power-laws in nature and lack of a hypothesized mechanistic explanation gives observations of power-law frequency spectra little more than “anecdotal value” (Stumpf and Porter, 2012). In contrast, we showed that individual variation in power-law scaling of neuronal oscillations and tapping errors can be explored to learn about specific brain systems implicated in behavioral performance. The power-law nature in the temporal dynamics of the brain may lie at the source of what makes us behave imperfectly, and thus may lie at the heart of what makes us humans, rather than machines.
Footnotes
This work was funded by NWO/MagW VENI-451-08-026 to D.J.A.S. We thank Ilse van Wijk, Mandy Grannetia, Sheila Ong, and Tim Varkevisser for their help with data collection.
References
- Babiloni C, Vecchio F, Bultrini A, Luca Romani G, Rossini PM. Pre- and poststimulus alpha rhythms are related to conscious visual perception: a high-resolution EEG study. Cereb Cortex. 2006;16:1690–1700. doi: 10.1093/cercor/bhj104. [DOI] [PubMed] [Google Scholar]
- Bak P. How nature works. New York: Copernicus; 1996. [Google Scholar]
- Bédard C, Kröger H, Destexhe A. Does the 1/f frequency scaling of brain signals reflect self-organized critical states? Phys Rev Lett. 2006;97:118102. doi: 10.1103/PhysRevLett.97.118102. [DOI] [PubMed] [Google Scholar]
- Berthouze L, James LM, Farmer SF. Human EEG shows long-range temporal correlations of oscillation amplitude in theta, alpha and beta bands across a wide age range. Clin Neurophysiol. 2010;121:1187–1197. doi: 10.1016/j.clinph.2010.02.163. [DOI] [PubMed] [Google Scholar]
- Chen JL, Zatorre RJ, Penhune VB. Interactions between auditory and dorsal premotor cortex during synchronization to musical rhythms. Neuroimage. 2006;32:1771–1781. doi: 10.1016/j.neuroimage.2006.04.207. [DOI] [PubMed] [Google Scholar]
- Chen JL, Penhune VB, Zatorre RJ. Listening to musical rhythms recruits motor regions of the brain. Cereb Cortex. 2008;18:2844–2854. doi: 10.1093/cercor/bhn042. [DOI] [PubMed] [Google Scholar]
- Chen Y, Ding M, Kelso JAS. Long memory processes (1/f̂{α} type) in human coordination. Phys Rev Lett. 1997;79:4501–4504. doi: 10.1103/PhysRevLett.79.4501. [DOI] [Google Scholar]
- Clauset A, Shalizi CR, Newman MEJ. Power-law distributions in empirical data. SIAM Rev. 2009;51:661–703. doi: 10.1137/070710111. [DOI] [Google Scholar]
- de Geus E. From genotype to EEG endophenotype: a route for post-genomic understanding of complex psychiatric disease? Genome Med. 2010;2:1–4. doi: 10.1186/gm184. [DOI] [PMC free article] [PubMed] [Google Scholar]
- Dehghani N, Bédard C, Cash SS, Halgren E, Destexhe A. Comparative power spectral analysis of simultaneous electroencephalographic and magnetoencephalographic recordings in humans suggests nonresistive extracellular media. J Comput Neurosci. 2010;29:405–421. doi: 10.1007/s10827-010-0263-2. [DOI] [PMC free article] [PubMed] [Google Scholar]
- Gilden DL. Fluctuations in the time required for elementary decisions. Psychol Sci. 1997;8:296–301. doi: 10.1111/j.1467-9280.1997.tb00441.x. [DOI] [Google Scholar]
- Gilden DL, Thornton T, Mallon MW. 1/F noise in human cognition. Science. 1995;267:1837–1839. doi: 10.1126/science.7892611. [DOI] [PubMed] [Google Scholar]
- Haldeman C, Beggs JM. Critical branching captures activity in living neural networks and maximizes the number of metastable states. Phys Rev Lett. 2005;94 doi: 10.1103/PhysRevLett.94.058101. 058101. [DOI] [PubMed] [Google Scholar]
- Hanslmayr S, Aslan A, Staudigl T, Klimesch W, Herrmann CS, Bäuml K-H. Prestimulus oscillations predict visual perception performance between and within-subjects. Neuroimage. 2007;37:1465–1473. doi: 10.1016/j.neuroimage.2007.07.011. [DOI] [PubMed] [Google Scholar]
- He BJ, Zempel JM, Snyder AZ, Raichle ME. The temporal structures and functional significance of scale-free brain activity. Neuron. 2010;66:353–369. doi: 10.1016/j.neuron.2010.04.020. [DOI] [PMC free article] [PubMed] [Google Scholar]
- Hennig H, Fleischmann R, Fredebohm A, Hagmayer Y, Nagler J, Witt A, Theis FJ, Geisel T. The nature and perception of fluctuations in human musical rhythms. PLoS ONE. 2011;6:e26457. doi: 10.1371/journal.pone.0026457. [DOI] [PMC free article] [PubMed] [Google Scholar]
- Kello CT, Brown GD, Ferrer-I-Cancho R, Holden JG, Linkenkaer-Hansen K, Rhodes T, Van Orden GC. Scaling laws in cognitive sciences. Trends Cogn Sci. 2010;14:223–232. doi: 10.1016/j.tics.2010.02.005. [DOI] [PubMed] [Google Scholar]
- Kinouchi O, Copelli M. Optimal dynamical range of excitable networks at criticality. Nat Phys. 2006;2:348–351. doi: 10.1038/nphys289. [DOI] [Google Scholar]
- Levitin DJ, Chordia P, Menon V. Musical rhythm spectra from Bach to Joplin obey a 1/f power law. Proc Natl Acad Sci U S A. 2012;109:3716–3720. doi: 10.1073/pnas.1113828109. [DOI] [PMC free article] [PubMed] [Google Scholar]
- Lewis PA, Miall RC. Distinct systems for automatic and cognitively controlled time measurement: evidence from neuroimaging. Curr Opin Neurobiol. 2003;13:250–255. doi: 10.1016/S0959-4388(03)00036-9. [DOI] [PubMed] [Google Scholar]
- Linkenkaer-Hansen K, Nikouline VV, Palva JM, Ilmoniemi RJ. Long-range temporal correlations and scaling behavior in human brain oscillations. J Neurosci. 2001;21:1370–1377. doi: 10.1523/JNEUROSCI.21-04-01370.2001. [DOI] [PMC free article] [PubMed] [Google Scholar]
- Linkenkaer-Hansen K, Nikulin VV, Palva JM, Kaila K, Ilmoniemi RJ. Stimulus-induced change in long-range temporal correlations and scaling behaviour of sensorimotor oscillations. Eur J Neurosci. 2004a;19:203–211. doi: 10.1111/j.1460-9568.2004.03116.x. [DOI] [PubMed] [Google Scholar]
- Linkenkaer-Hansen K, Nikulin VV, Palva S, Ilmoniemi RJ, Palva JM. Prestimulus oscillations enhance psychophysical performance in humans. J Neurosci. 2004b;24:10186–10190. doi: 10.1523/JNEUROSCI.2584-04.2004. [DOI] [PMC free article] [PubMed] [Google Scholar]
- Linkenkaer-Hansen K, Monto S, Rytsälä H, Suominen K, Isometsä E, Kähkönen S. Breakdown of long-range temporal correlations in theta oscillations in patients with major depressive disorder. J Neurosci. 2005;25:10131–10137. doi: 10.1523/JNEUROSCI.3244-05.2005. [DOI] [PMC free article] [PubMed] [Google Scholar]
- Linkenkaer-Hansen K, Smit DJ, Barkil A, van Beijsterveldt TE, Brussaard AB, Boomsma DI, van Ooyen A, de Geus EJ. Genetic contributions to long-range temporal correlations in ongoing oscillations. J Neurosci. 2007;27:13882–13889. doi: 10.1523/JNEUROSCI.3083-07.2007. [DOI] [PMC free article] [PubMed] [Google Scholar]
- Maris E, Oostenveld R. Nonparametric statistical testing of EEG- and MEG-data. J Neurosci Methods. 2007;164:177–190. doi: 10.1016/j.jneumeth.2007.03.024. [DOI] [PubMed] [Google Scholar]
- Miller KJ, Sorensen LB, Ojemann JG, den Nijs M. Power-law scaling in the brain surface electric potential. PLoS Comput Biol. 2009;5:e1000609. doi: 10.1371/journal.pcbi.1000609. [DOI] [PMC free article] [PubMed] [Google Scholar]
- Montez T, Poil SS, Jones BF, Manshanden I, Verbunt JP, van Dijk BW, Brussaard AB, van Ooyen A, Stam CJ, Scheltens P, Linkenkaer-Hansen K. Altered temporal correlations in parietal alpha and prefrontal theta oscillations in early-stage Alzheimer disease. Proc Natl Acad Sci U S A. 2009;106:1614–1619. doi: 10.1073/pnas.0811699106. [DOI] [PMC free article] [PubMed] [Google Scholar]
- Monto S, Vanhatalo S, Holmes MD, Palva JM. Epileptogenic neocortical networks are revealed by abnormal temporal dynamics in seizure-free subdural EEG. Cereb Cortex. 2007;17:1386–1393. doi: 10.1093/cercor/bhl049. [DOI] [PubMed] [Google Scholar]
- Monto S, Palva S, Voipio J, Palva JM. Very slow EEG fluctuations predict the dynamics of stimulus detection and oscillation amplitudes in humans. J Neurosci. 2008;28:8268–8272. doi: 10.1523/JNEUROSCI.1910-08.2008. [DOI] [PMC free article] [PubMed] [Google Scholar]
- Neuper C, Pfurtscheller G. Event-related dynamics of cortical rhythms: frequency-specific features and functional correlates. Int J Psychophysiol. 2001;43:41–58. doi: 10.1016/S0167-8760(01)00178-7. [DOI] [PubMed] [Google Scholar]
- Niedermeyer E. Electroencephalography: basic principles, clinical apllications, and related fields. Ed. 4. Philadelphia: Lippincott Williams and Wilkins; 1999. The normal EEG of the waking adult. [Google Scholar]
- Nikulin VV, Brismar T. Long-range temporal correlations in electroencephalographic oscillations: relation to topography, frequency band, age and gender. Neuroscience. 2005;130:549–558. doi: 10.1016/j.neuroscience.2004.10.007. [DOI] [PubMed] [Google Scholar]
- Nikulin VV, Jönsson EG, Brismar T. Attenuation of long-range temporal correlations in the amplitude dynamics of alpha and beta neuronal oscillations in patients with schizophrenia. Neuroimage. 2012;61:162–169. doi: 10.1016/j.neuroimage.2012.03.008. [DOI] [PubMed] [Google Scholar]
- Paczuski M, Maslov S, Bak P. Avalanche dynamics in evolution, growth, and depinning models. Phys Rev E. 1996;53:414. doi: 10.1103/PhysRevE.53.414. [DOI] [PubMed] [Google Scholar]
- Palva JM, Zhigalov A, Hirvonen J, Korhonen O, Linkenkaer-Hansen K, Palva S. Neuronal long-range temporal correlations and avalanche dynamics are correlated with behavioral scaling laws. Proc Natl Acad Sci U S A. 2013;110:3585–3590. doi: 10.1073/pnas.1216855110. [DOI] [PMC free article] [PubMed] [Google Scholar]
- Peng CK, Havlin S, Stanley HE, Goldberger AL. Quantification of scaling exponents and crossover phenomena in nonstationary heartbeat time series. Chaos. 1995;5:82–87. doi: 10.1063/1.166141. [DOI] [PubMed] [Google Scholar]
- Plenz D. Neuronal avalanches and coherence potentials. Eur Phys J Special Topics. 2012;205:259–301. doi: 10.1140/epjst/e2012-01575-5. [DOI] [Google Scholar]
- Poil SS, Hardstone R, Mansvelder HD, Linkenkaer-Hansen K. Critical-state dynamics of avalanches and oscillations jointly emerge from balanced excitation/inhibition in neuronal networks. J Neurosci. 2012;32:9817–9823. doi: 10.1523/JNEUROSCI.5990-11.2012. [DOI] [PMC free article] [PubMed] [Google Scholar]
- Rangarajan G, Ding M. Integrated approach to the assessment of long range correlation in time series data. Phys Rev E. 2000;61:4991–5001. doi: 10.1103/PhysRevE.61.4991. [DOI] [PubMed] [Google Scholar]
- Smit DJ, Stam CJ, Posthuma D, Boomsma DI, de Geus EJ. Heritability of “small-world” networks in the brain: a graph theoretical analysis of resting-state EEG functional connectivity. Hum Brain Mapp. 2008;29:1368–1378. doi: 10.1002/hbm.20468. [DOI] [PMC free article] [PubMed] [Google Scholar]
- Smit DJ, Boersma M, van Beijsterveldt CE, Posthuma D, Boomsma DI, Stam CJ, de Geus EJ. Endophenotypes in a dynamically connected brain. Behav Genet. 2010;40:167–177. doi: 10.1007/s10519-009-9330-8. [DOI] [PMC free article] [PubMed] [Google Scholar]
- Smit DJ, de Geus EJ, van de Nieuwenhuijzen ME, van Beijsterveldt CE, van Baal GC, Mansvelder HD, Boomsma DI, Linkenkaer-Hansen K. Scale-free modulation of resting-state neuronal oscillations reflects prolonged brain maturation in humans. J Neurosci. 2011;31:13128–13136. doi: 10.1523/JNEUROSCI.1678-11.2011. [DOI] [PMC free article] [PubMed] [Google Scholar]
- Stumpf MP, Porter MA. Critical truths about power laws. Science. 2012;335:665–666. doi: 10.1126/science.1216142. [DOI] [PubMed] [Google Scholar]
- Thaut MH. Neural basis of rhythmic timing networks in the human brain. Ann N Y Acad Sci. 2003;999:364–373. doi: 10.1196/annals.1284.044. [DOI] [PubMed] [Google Scholar]
- Toma K, Mima T, Matsuoka T, Gerloff C, Ohnishi T, Koshy B, Andres F, Hallett M. Movement rate effect on activation and functional coupling of motor cortical areas. J Neurophysiol. 2002;88:3377–3385. doi: 10.1152/jn.00281.2002. [DOI] [PubMed] [Google Scholar]
- Torre K, Balasubramaniam R, Rheaume N, Lemoine L, Zelaznik HN. Long-range correlation properties in motor timing are individual and task specific. Psychon Bull Rev. 2011;18:339–346. doi: 10.3758/s13423-011-0049-1. [DOI] [PubMed] [Google Scholar]
- Voss RF, Clarke J. “1/f noise” in music and speech. Nature. 1975;258:317–318. doi: 10.1038/258317a0. [DOI] [Google Scholar]
- van Wijk BC, Beek PJ, Daffertshofer A. Neural synchrony within the motor system: what have we learned so far? Front Hum Neurosci. 2012;6:252. doi: 10.3389/fnhum.2012.00252. [DOI] [PMC free article] [PubMed] [Google Scholar]
- Wing A, Kristofferson A. Response delays and the timing of discrete motor responses. Percept Psychophys. 1973;14:5–12. doi: 10.3758/BF03198607. [DOI] [Google Scholar]
- Zarahn E, Aguirre GK, D'Esposito M. Empirical analyses of BOLD fMRI statistics. Neuroimage. 1997;5:179–197. doi: 10.1006/nimg.1997.0263. [DOI] [PubMed] [Google Scholar]