

Abstract
Color vision in honey bees (Apis mellifera) has been extensively studied at the behavioral level and, to a lesser degree, at the physiological level by means of electrophysiological intracellular recordings of single neurons. Few visual neurons have been so far characterized in the lateral protocerebrum of bees. Therefore, the possible implication of this region in chromatic processing remains unknown. We performed in vivo calcium imaging of interneurons in the anterior optic tubercle (AOTu) of honey bees upon visual stimulation of the compound eye to analyze chromatic response properties. Stimulation with distinct monochromatic lights (ultraviolet [UV], blue, and green) matching the sensitivity of the three photoreceptor types of the bee retina induced different signal amplitudes, temporal dynamics, and spatial activity patterns in the AOTu intertubercle network, thus revealing intricate chromatic processing properties. Green light strongly activated both the dorsal and ventral lobes of the AOTu's major unit; blue light activated the dorsal lobe more while UV light activated the ventral lobe more. Eye stimulation with mixtures of blue and green light induced suppression phenomena in which responses to the mixture were lower than those to the color components, thus concurring with color-opponent processing. These data provide evidence for a spatial segregation of color processing in the AOTu, which may serve for navigation purposes.
Introduction
Honey bees perceive light from 300 to 650 nm (von Frisch, 1914; Kühn and Pohl, 1921; Kühn, 1927) and possess trichromatic color vision (Daumer, 1956). Three photoreceptor types can be found in the bee retina, with absorption peaks at 344 nm (S type), 436 nm (M type), and 544 nm (L type) (for review, see Menzel and Backhaus, 1991; Dyer et al., 2011; Avarguès-Weber et al., 2012). Color information from the retina is further processed in the bee brain by different classes of color opponent neurons (Kien and Menzel, 1977; Riehle, 1981; Yang et al., 2004), which antagonize inputs from the different receptor types and constitute the basis for bees' color vision (Backhaus, 1991; Menzel and Backhaus, 1991).
The first visual neuropil in the bee brain, the lamina, receives input essentially from L photoreceptors (Menzel, 1974; Ribi, 1975; Meyer, 1984). Axons of the principal lamina-output neurons (lamina monopolar cells), as well as of M and S photoreceptors, proceed to the second visual neuropil, the medulla (Ribi and Scheel, 1981; Meyer, 1984), where color-opponent neurons have been found (Kien and Menzel, 1977; Yang et al., 2004). Chromatic properties of medulla neurons are preserved and amplified downstream, especially in the third visual neuropil, the lobula, which also contains many color-opponent neurons (Hertel, 1980; Yang et al., 2004; Paulk et al., 2008). Inner-layer lobula and medulla neurons, which are more likely to exhibit color-opponent responses, send projections to the mushroom bodies and to the anterior lateral protocerebrum (Mobbs, 1982; Gronenberg, 1986; Paulk and Gronenberg, 2008; Paulk et al., 2008, 2009a,b).
Little is known about how chromatic information is processed in the anterior lateral protocerebrum of bees. “Optic glomeruli” found in the lateral protocerebrum of flies are thought to process visual information conveyed by the optic lobes (Okamura and Strausfeld, 2007; Strausfeld et al., 2007). The most prominent of these glomeruli is the anterior optic tubercle (AOTu), whose organization and neural connectivity was recently described in bees (Mota et al., 2011; Pfeiffer and Kinoshita, 2012). A small subunit of the AOTu is involved in the processing of polarized light in locusts for navigation purposes (Homberg et al., 2003; Pfeiffer et al., 2005), but the exact functions of the entire AOTu remain unknown. Recent identification of lobula–AOTu color-sensitive neurons in bumblebees (Paulk et al. 2008, 2009a) and reports on color-specific responses of AOTu interneurons in locusts (Kinoshita et al., 2007, Pfeiffer and Homberg, 2007) suggest that this structure may be involved in chromatic processing. This processing may contribute to a chromatic navigation compass allowing differentiation between the sun as a green-light source and the antisolar hemisphere perceived through modulations of ultraviolet (UV) light (Rossel and Wehner, 1984). However, the nature and function of chromatic processing in the AOTu remain unknown.
Here we analyzed the spectral properties of AOTu interneurons in honey bees and the possible involvement of this structure in chromatic processing. To this end, we performed in vivo calcium imaging upon visual stimulation, a technique that enables measuring AOTu responses at the neural assembly level (Mota et al., 2011). We show that stimulations with distinct monochromatic lights and chromatic mixtures induce different signal amplitudes, temporal dynamics in the honeybee AOTu and that spatial activity patterns are different for UV and blue light, thus revealing intricate spectral properties and chromatic processing in this brain structure.
Materials and Methods
Animals.
Worker honey bees (Apis mellifera) were collected from an outdoor hive and brought to the laboratory where they were placed in small glass vials and cooled on ice until they ceased movements.
Calcium imaging preparation.
For in vivo optophysiological recordings (Joerges et al., 1997; Sachse and Galizia, 2002; Deisig et al., 2010), bees were harnessed individually in an opaque plastic chamber (Mota et al., 2011; see Fig. 1F). To stabilize the preparation, the head, thorax, legs, and wings were immobilized with low-temperature melting wax. The antennae were fixed using n-eicosan (Aldrich). The head capsule was then opened frontally, salivary glands and a small part of the tracheal sheath around the brain were removed, and the brain was exposed. For imaging neural activity of intertubercle neurons (Mota et al., 2011; Fig. 1A), the calcium indicator fura-2 dextran (potassium salt, 10,000 kDa, Invitrogen) was introduced into the left AOTu (contralateral to visual stimulation). To allow subsequent evaluation of intertubercle neuronal staining, fura-2 dextran was coinjected with tetramethyl rhodamine dextran (10,000 kDa, Invitrogen). Three borosilicate thin-walled glass electrodes coated with crystals of the tracer blend were consecutively inserted into the dorsal, medial, and ventral parts of the left AOTu (Fig. 1A). The tracers migrated retrogradely to the right AOTu (ipsilateral to visual stimulation) within axons of the ventral (vITT) and medial (mITT) intertubercle neurons (Fig. 1A,C–E). This allowed measuring calcium concentration changes in the dendrites of this population of intertubercle neurons in the right AOTu, when the right eye of the bee was stimulated with chromatic stimuli (Fig. 1F,G). After injections, the head capsule was closed with the original piece of head cuticle and sealed with n-eicosan. Animals were then fed with 50% (w/w) sucrose solution and kept alive in a moist chamber for 18 h to allow calcium-indicator uptake and retrograde transport to the AOTu on the recording side (Fig. 1A).
Figure 1.
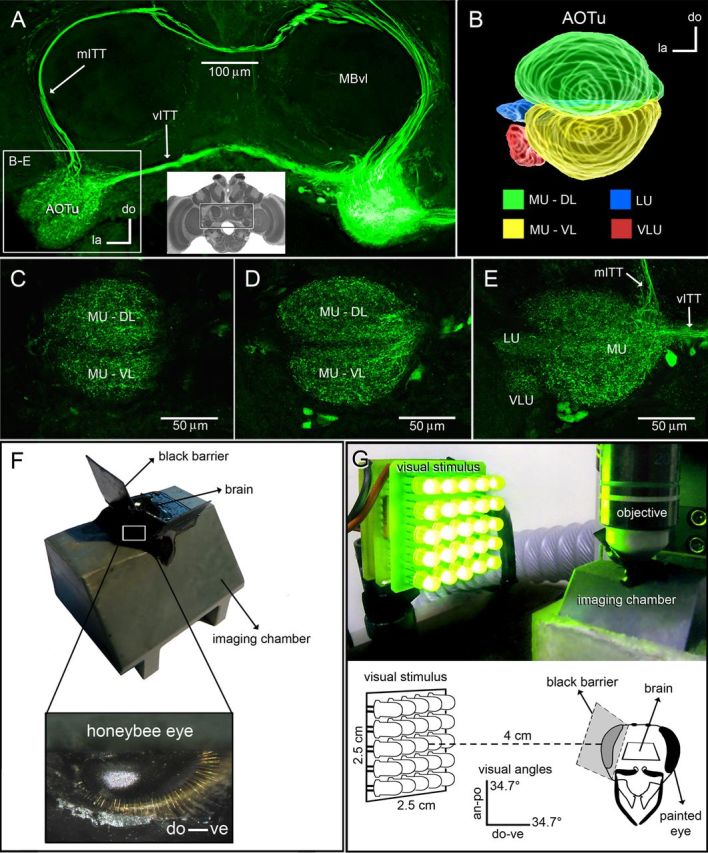
Optophysiological recordings from intertubercle neurons in the honey bee AOTu. A, Two separate ITTs connect the AOTus of both brain hemispheres. A superposition of frontal protocerebral sections shows the vITT and the mITTs stained after tracer injection into one of the AOTus (right). The brain region corresponding to this picture is shown by the central inset (montage of osmium-stained frontal sections). The mITT is posterior in relation to the vITT and projects dorsally through the protocerebrum before ventrally reaching the contralateral AOTu (left box). The box area is enlarged in B–E. B, 3D reconstruction of confocal image stacks showing the anterior view of the AOTu and its distinct compartments (Mota et al., 2011): the MU-DL is shown in green, the MU-VL in yellow, the VLU in red, and the LU in blue. C–E, Frontal sections of the left AOTu at different depths from the anterior brain surface (C, 20 μm; D, 40 μm; and E, 60 μm) showing arborizations of intertubercle neurons in all distinct AOTu compartments. F, For calcium-imaging recordings, a bee was placed in an opaque recording chamber. The brain area was optically isolated from the compound eye by means of an opaque barrier glued to the bee head with custom black epoxy. G, Spectral stimulation (green light, 565 nm) was produced by a square array (2.5 × 2.5 cm) of 25 LEDs presented laterally to the bees' right eye (recording side). The center of the LED array was placed at a distance of 4 cm from the stimulated eye, so that each array had an angular subtense of 34.7° at the bee eye in both vertical and horizontal directions. an, Anterior; po, posterior; do, dorsal; ve, ventral; la, lateral.
The preparation was then finalized to allow in vivo calcium imaging recordings. First, the mouthparts of the bee were immobilized with wax. Then, small pieces of black plastic foil were waxed to the head (Fig. 1F) and the remaining gaps were closed with epoxy glue (Red Araldite; Bostik Findley S.A.) mixed with organic black pigment (Noir de Vigne; Frère Nordin S.A.). These plastic barriers created a small pool around the brain region, which could be kept under saline at all times, and also optically isolated the compound eye on the stimulated side (Fig. 1F,G). The opaque plastic barriers ensured that visual stimuli did not interfere with the imaging CCD camera and, at the same time, that the imaging light of the microscope did not stimulate the eyes. The eye on the injection side (contralateral to visual stimulations) was painted with black epoxy (Fig. 1G). Last, the small window in the head capsule (Fig. 1G) was reopened and the brain immersed in saline solution containing the following (in mmol · l−1): 130 NaCl, 6 KCl, 4 MgCl2, 5 CaCl2, 160 sucrose, 25 glucose, 10 HEPES, pH 6.7, 500 mOsmol (all chemicals from Sigma-Aldrich).
Visual stimulation.
Spectral stimuli (Fig. 1G) were produced by square arrays (2.5 × 2.5 cm) of 25 light-emitting diodes (LEDs) presented laterally to the bees' right eye (recording side). In a first experiment, we aimed at measuring response properties and activation patterns in the AOTu upon stimulation with monochromatic lights matching the sensitivity maxima of the three photoreceptor types of the honey bee retina (Peitsch et al., 1992). We used three different monochromatic LED arrays (see Fig. 2A) with peak wavelengths of 350, 435, and 565 nm (UV 0.3–15, Blue 30M32, and Green 383UGC; all LEDs from Roithner Lasertechnik). The three LED arrays were presented in the same lateral position, at a distance of 4 cm from the stimulated eye, so that each array had an angular subtense at the bee eye of 34.7°, both in the vertical and horizontal directions (Fig. 1G). In each array, all LEDs were connected to individual resistors to allow fine calibration of light intensity. We thus presented isoluminant stimuli with an irradiance of 7.6 × 10⁶ photon counts/cm2/s at the level of the bee eye, which we measured using a fixed grating spectrometer (Ocean Optics S2000) calibrated with a DT1000 mini light source (200–1100 nm) and equipped with a R400–7 UV/VIS optical fiber (Ocean Optics). All light stimulations lasted 2 s.
Figure 2.

Visually evoked calcium signals in AOTu intertubercle neurons. A, The spectra of UV, blue, and green monochromatic stimuli were calibrated to the same photon flux and allowed maximal excitation of the S, M, or L photoreceptor types, respectively (Peitsch et al., 1992). B, Overview image showing raw fura-2 fluorescence of AOTu intertubercle neurons. C, False color-coded activation patterns (percentage change in 340/380 nm fluorescence ratio; see Materials and Methods) obtained in the right AOTu for three presentations of UV, blue, or green light and control (no light). D, Typical time course of fura-2 calcium signals (percentage change in fluorescence ratio, average of 3 presentations) measured in the AOTu of an example animal for stimulation with UV, blue, or green monochromatic lights and control. The dotted boxes define the time intervals used for calculation of response amplitude during the on- and the off-response phases. The black horizontal bar indicates stimulus duration. E, Mean amplitude of calcium signals during the on-response and the off-response phases for stimulations with UV, blue, or green monochromatic lights and control in 13 bees. Different letters and asterisks indicate significant differences (Wilcoxon matched-pairs test, N = 13 bees). la, Lateral; do, dorsal.
In a second experiment, we aimed at comparing activity patterns in the AOTu evoked by: (1) the same chromatic stimuli when presented at different photon flux intensities and (2) different blue-green chromatic mixtures and their single (blue or green) monochromatic components. To this end, we used an LED array allowing high-level excitation of the M (blue) photoreceptor alone, of the L photoreceptor alone (green), or of both M and L photoreceptors at the same time. We adapted commercial trichromatic RGB LEDs, using only the blue and green wavelengths available (peak wavelengths: 430 and 565 nm; RGB-LF5WAEMBGMBW; Kingbright Electronic). While the spectrum of the green LED was identical to that used in the previous experiment, the spectrum of the blue LED was broader and slightly shifted toward shorter wavelengths. However, the difference in predicted M-receptor activation was minimal (Peitsch et al., 1992). For such dual-wavelength LEDs in the array, the blue source and the green source could be turned on or off separately. Moreover, each source was connected to a different resistor, thus allowing separate calibration of light emission at each wavelength. In this manner, we produced eight different visual stimuli (see Fig. 4A; (1) monochromatic dim blue (λ = 430 nm; 3.8 × 10⁶ photon counts/cm2/s), (2) monochromatic bright blue (λ = 430 nm; 7.6 × 10⁶ photon counts/cm2/s), (3) monochromatic dim green (λ = 565 nm; 3.8 × 10⁶ photon counts/cm2/s), (4) monochromatic bright green (λ = 565 nm; 7.6 × 10⁶ photon counts/cm2/s), (5) mixture of dim blue and dim green, (6) mixture of bright blue and bright green, (7) mixture of bright blue and dim green, and (8) mixture of dim blue and bright green. When stimulating with a mixture, intensity of the blue and of the green LED was added so that mixtures always provided more photon counts/cm2/s than single components.
Figure 4.

Calcium-signals evoked by blue, green, and blue-green mixtures in the AOTu. Eight different chromatic stimuli were produced by means of blue-green dual-wavelength (430/565nm) LEDs. Right upper box: spectra of chromatic stimuli; monochromatic stimuli: dim blue (dim B), bright blue (bright B), dim green (dim G), bright green (bright G); mixtures: dim blue + dim green (dim B + dim G), bright blue + bright green (bright B + bright G), bright blue + dim green (bright B + dim G), and dim blue + bright green (dim B + bright G). All eight stimuli elicited calcium signals in AOTu intertubercle neurons (N = 11 bees). Activation patterns (signals; ΔR/R) evoked by each stimulus and the control, as well as global density maps (density) representing pixels activated by three presentations of each stimulus are shown for an example animal. The average time course evoked by three presentations of each of the eight chromatic stimuli is also shown for the same example animal.
Recordings of visually evoked activity.
Calcium imaging recordings were performed in standard conditions (Deisig et al., 2010; Mota et al., 2011) using a TILL photonics imaging system. Bees previously injected with fura-2 dextran were placed under an epifluorescent microscope with a 20× water-immersion objective (NA 0.5) immersed in the saline solution covering the brain (Fig. 1G). Brain movements were reduced by gently squeezing the bee's abdomen with soft modeling clay. The AOTu on the stimulation side was imaged (Fig. 1A–E). Images were taken using a 640 × 480 pixel 12-bit monochrome CCD-camera (TILL Imago) cooled to −12°C. Each measurement consisted of 60 frames at a rate of 5 Hz (interval between frames 200 ms). A monochromatic excitation light alternating between 340 and 380 nm was applied using a monochromator (TILL Polychrom IV). Imaging excitation light was shut off between frames. The filter set on the microscope was composed of a 490 nm dichroic filter and a bandpass (BP 50 nm) 525 nm emission filter. The integration time was 6–40 ms for 380 nm stimulation and 18–160 ms for 340 nm stimulation. Pixel image size corresponded to 2.4 × 2.4 μm after 4 × 4 binning on chip.
Visual stimulation using the LED arrays started at the 15th frame and lasted 2 s. Control stimuli consisted in identical recordings without any light presentation. Each bee received three presentations of each visual stimulus and of the control. The order of the stimuli was randomized within and between bees. The minimum interstimulus interval was 1 min, thus avoiding potential adaptation to light stimuli (Paulk et al., 2008).
Anatomical appraisal of specific neuronal staining.
To evaluate specific intertubercle neuronal staining (Mota et al., 2011; Fig. 1A–E), tracer-filled brains were dissected out after successful calcium imaging recordings. Brains were fixed in phosphate-buffered paraformaldehyde solution (4%; pH 6.8) for at least 24 h, dehydrated in ascending concentrations of ethanol, and cleared in methyl salicylate (Sigma-Aldrich) for 24 h. Images of whole mounts were taken with a confocal laser scanning microscope (Leica SP5) with a DPSS 561 nm laser at 2 μm optical section thickness. Projections of the confocal stacks containing neurons stained with tetramethyl rhodamine, as well as brightness and contrast adjustments, were achieved using ImageJ (Rasband; National Institutes of Health, Bethesda, MD). Brain structures are described according to a neural axis in which the mushroom body calyces are dorsal, the antennal lobes ventral and anterior, and the subesophageal ganglion posterior.
Analysis of activity patterns and signal amplitudes.
Calcium imaging data were analyzed using custom-made software written in IDL 6.4 (Research Systems) and following standard methods (Galizia and Vetter, 2005, Deisig et al., 2010, Mota et al., 2011) unless stated otherwise. Fura-2 is a ratiometric dye so that each recording was a 4D array with the excitation wavelength (340 and 380 nm), two spatial dimensions (x, y pixels of the area of interest), and the temporal dimension (60 frames). For calcium signal analysis, each recording was brought to a 3D array by calculating the fluorescence ratio R = F340nm/F380nm at each pixel and time point. Then, three steps were performed to calculate the signals. First, relative fluorescence changes were calculated as ΔR/R = (R − R0)/R0, taking as reference background R0 the average of five frames just before any visual stimulation (here frames 10–14). Second, to reduce photon noise, raw data were filtered in the temporal and the two spatial dimensions using a Gaussian filter with a size of 3 pixels. Third, a bleach correction was applied. We subtracted a logarithmic curve fitted to the median brightness decay of the entire image frames, excluding the frames during the stimulus until 5 s after stimulus onset. Signal amplitude was calculated between baseline just before the stimulus (average of frames 12–14) and 1 s after stimulus onset (average of frames 19–21; Fig. 2B), when signal in the on-response phase is maximal. Signal amplitude was also calculated between the same baseline (average of frames 12–14) and 600 ms after stimulus offset (average of frames 27–29; Fig. 2B), which corresponds to the maximum of the signal whenever an off-response phase occurs. For display, activity signals were lowpass filtered (Gaussian, 13 × 13) and presented in a false-color code, from dark blue (no signal) to red (maximum signal). For quantitative data analysis, signal amplitude at particular points of interest was calculated by averaging 9 × 9 pixels, which corresponds to a ∼20 × 20 μm region.
Neural activity induced by spectral stimuli in the AOTu.
To determine which pixels were statistically activated by each visual stimulus, we used a threshold-based method. First, the ratio R = F340nm/F380nm at each pixel and time point was calculated. Afterward, ΔR/R = (R − R0)/R0 was computed and bleaching was corrected as above. Then, data were lowpass filtered (Gaussian 13 × 13). To quantify the numbers of activated pixels on the AOTu surface only, a mask was precisely drawn close to the borders of the AOTu and only pixels within the delimited region were taken into account in the analysis. To analyze activated pixels in the two AOTu subunits major unit-dorsal lobe (MU-DL) and major unit-ventral lobe (MU-VL) separately, a similar approach was used. One mask was drawn for each subunit, and the analysis was run as above.
A pixel was considered as activated when it fulfilled two criteria: (1) activation amplitude was above noise level (see below) and (2) the pixel was part of a group of at least five activated pixels, to ensure that it revealed coherent neural activity. For each bee, noise was determined as a number of SDs of the signal measured before the stimulus (frames 1–14). Because of differences between bees in the quality of the recordings, a noise threshold was determined for each bee (between 2 and 4 SD) depending on overall signal amplitude. The same threshold was applied to all recordings of the same bee. Using the treatment described here, clear patterns of visually evoked activity could be revealed in the AOTu structure.
Overlap between spectrally specific AOTu activity maps.
To test for the existence of spectrally specific activity and coding in the AOTu, we compared the overlap of activated pixels between stimulations with the same or with different chromatic stimuli. Overlap between two visually evoked recordings was calculated as the number of pixels activated in both recordings (intersection) divided by the number of pixels activated in one or the other recording (union). Thus, for two recordings A and B: Overlap = ∩A,B/∪A,B.
Statistical analysis.
Friedman tests followed by Wilcoxon matched-pairs tests were used to compare: (1) amplitudes of calcium signals obtained in the AOTu in response to stimulations with different chromatic and control stimuli (Fig. 2C), (2) numbers of pixels activated in the AOTu or in its subcompartments (MU-DL, MU-VL) by different chromatic stimuli (see Figs. 3B,C, 5A, 6A), and (3) overlap values obtained with different pairs of chromatic stimuli (Figs. 3E, 6B–E). Pairwise comparisons were performed using Bonferroni corrections for multiple comparisons (α′ = 0.05/k with k being the number of comparisons each sample was used for).
Figure 3.

Spatial coding in the honeybee AOTu. A, Example of activated pixels during the on-phase in the MU of the AOTu for three repeated UV, blue, or green stimulations. The contours of MU-DL and MU-VL are shown by dashed lines in the overview panel. Significantly activated pixels are overlaid on a fluorescence photograph of the AOTu. A false color scale indicates their amplitude of activation (ΔR/R). Density maps indicate the reliability of activated pixels as shown by a density scale (density %): colors from dark red to white indicate pixels activated by the one, two, or three presentations of each stimulus. Overlay maps represent reliable pixels activated by the three stimulations of one monochromatic stimulus in one color and the other monochromatic stimulus in another color. Pixels activated by stimulations with both monochromatic stimuli are represented in white. B, Mean number of activated pixels in the AOTu during the on- and the off-response phases for stimulations with UV, blue, or green monochromatic lights and control in 13 bees. C, Mean number of activated pixels in the MU-DL or MU-VL for stimulations with UV, blue, or green light. In both subunits, green activated more pixels than UV or blue. In the MU-DL, blue activated more pixels than UV, while in the MU-VL, UV activated more pixels than blue. D, The overlap index between UV and blue (UV/B) is significantly lower than both overlap values for different presentations of UV (UV/UV) or blue light (B/B). E, The overlap between different presentations of green light (G/G) is significantly higher than the overlap between different presentations of UV light (UV/UV), and higher than the overlap between green and UV (UV/G). F, Likewise, the overlap between different presentations of green light (G/G) is significantly higher than the overlap between different presentations of blue light (B/B), and higher than the overlap between green and blue (B/G). Different letters and asterisks indicate significant differences in Wilcoxon matched-pairs tests (N = 13 bees). do, Dorsal; la, lateral.
Figure 5.

The effect of light intensity on visually evoked signals in the AOTu. A, Mean number of activated pixels in the AOTu for stimulations with dim or bright blue (left) and dim or bright green (right) in 11 bees. B, C, Top, Example of overlay map for dim and bright stimuli (dim B vs bright B; dim G vs bright G). Bottom, Similarity analysis comparing overlap indexes between dim and bright stimuli (Di/Br), between different presentations of each bright stimulus (Br/Br), or between different presentations of each dim stimulus (Di/Di), for blue (B) or green light (C). Both for blue and green stimuli light intensity influences the number of activated pixels (A), and the activity evoked by dim stimuli is contained within the regions activated by the bright stimuli (B, C). Different letters and asterisks indicate significant differences in Wilcoxon matched-pairs tests (N = 11 bees).
Figure 6.
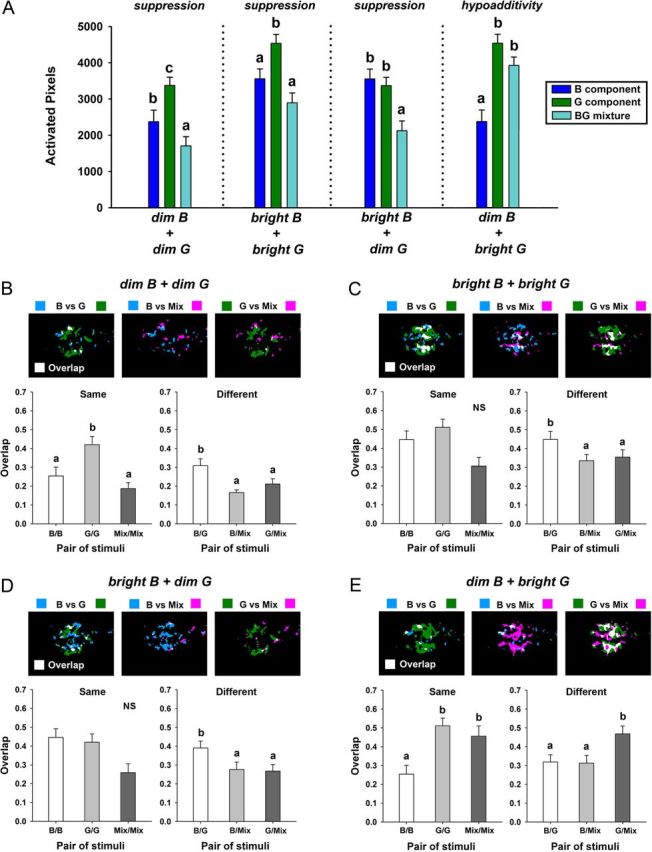
Processing of chromatic mixtures in the AOTu. A, Mean number of activated pixels for stimulations with a blue (B) component, a green (G) component, and the resulting blue-green (BG) mixture, for the mixtures dim B + dim G, bright B + bright G, bright B + dim G, and dim B + bright G. The stronger component was defined as the component of the mixture inducing the highest number of activated pixels in the AOTu. Potentially, the response to a mixture could be statistically higher than (“synergy”), equal to (“hypoadditivity”), or lower than (“suppression”) the response to the stronger component. However, mixture processing in the AOTu was largely characterized by suppression (dim B + dim G, bright B + bright G, bright B + dim G), but in the case of the dim B + bright G mixture, hypoadditivity was observed. B–E, Top, Examples of overlay maps for the blue component (B), the green component (G), and the blue-green mixture (Mix). Bottom, Comparison of the mean overlap indexes between any two presentations of the same (B/B, G/G, Mix/Mix) or of different chromatic stimuli (B/G, B/Mix, G/Mix) for dim B + dim G (B), bright B + bright G (C), bright B + dim G (D), or dim B + bright G (E). Different letters indicate significant differences in Wilcoxon matched-pairs tests (N = 11 bees).
Results
We performed optophysiological measurements of visually evoked neural activity at the level of intertubercle neurons (Fig. 1A) of honey bees stimulated with chromatic stimuli. The honey bee AOTu is composed of four distinct compartments (Fig. 1B; Mota et al., 2011). MU represents the largest component and is symmetrically subdivided in a ventral and a dorsal lobe (MU-VL and MU-DL, respectively) in its anterior part (Fig. 1C,D). Toward the posterior end of the MU, the two subcompartments (MU-VL and MU-DL) are fused (Fig. 1E). Two smaller units are situated posterior to the MU (Fig. 1E): the ventrolateral unit (VLU) and the lateral unit (LU). The intertubercle neuronal circuit comprises two distinct parallel pathways (Mota et al., 2011): the vITT and the mITT (Fig. 1A,E). This population of neurons arborizes in all four AOTu compartments (Fig. 1C–E), therefore connecting the entire AOTu structures of both brain hemispheres. Highly reproducible retrograde staining of ITTs' dendritic arborizations in the AOTu can be obtained by injection of a dextran tracer into the contralateral AOTu (Fig. 1A,C–E). We thus recorded calcium signals from these neurons in the AOTu (ipsilateral to the stimulation side, contralateral to the dextran-injection side) to determine how they respond to UV, blue, or green monochromatic stimuli (Fig. 1G). Since we used conventional microscopy, which is best suited for imaging of superficial tissue, calcium signals were mainly recorded from the anterior part of the AOTu, i.e., from the dorsal and ventral lobes of the major unit (MU-DL and MU-VL, respectively; see Fig. 1B–D), upon lateral presentation of a visual stimulus.
Experiment 1: calcium signals evoked by monochromatic stimuli in the AOTu
All three monochromatic stimuli (UV, blue, and green; Fig. 2A) elicited calcium signals in the AOTu (N = 13 bees), with clear activation of dendritic arborizations in both lobes of the MU (Fig. 2B,C). Although the three stimuli evoked consistent phasic–tonic time courses (Fig. 2D), clear differences could be observed in the temporal dynamics of calcium signals. Signals evoked by UV and blue light typically presented an off-response component, which was absent in responses to green stimulations (Fig. 2D). The off-response was most pronounced for blue light, and was characterized by a second peak in the signal after stimulus offset (Fig. 2D). For UV stimulations, the off-response was less pronounced and consisted of a slight signal increase after stimulus offset (Fig. 2D). Green stimulations generally elicited phasic–tonic responses with a slow decrease in signal amplitude after stimulus offset (Fig. 2D). Figure 2E shows the average amplitude of calcium responses evoked by UV, blue, and green light during the on-response phase (800–1200 ms after stimulus onset) and the off-response phase (400–800 ms after stimulus offset). For all three stimuli, the amplitude of calcium responses was significantly higher than that obtained in control recordings without light (Fig. 2E; on-phase: Friedman test: χ2 = 33.46, df = 3, p < 0.0001; Wilcoxon test: Z = 3.18, p < 0.01 in all cases; off-phase: Friedman test: χ2 = 21.84, df = 3, p < 0.0001; Wilcoxon test: Z = 3.18, p < 0.01 in all cases). During the on-phase, response amplitude to green light was significantly higher than to UV or blue light (Fig. 2E; Z ≥ 3.11, p < 0.01), while responses to UV and blue did not differ (Z = 0.24, NS). After stimulus offset, UV-evoked responses retained the same amplitude level (Fig. 2E; UV, on vs off: Z = 1.08, NS) and blue-evoked response increased significantly (blue, on vs off: Z = 2.56, p < 0.01) while green-evoked response decreased (green, on vs off: Z = 3.04, p < 0.01). Consequently, during the off-phase, the amplitudes of signals elicited by UV, blue, and green did not differ (Fig. 2E; Z < 1.22, NS). These results reveal specific differences in the temporal dynamics of calcium signals in the AOTu evoked by UV, blue, and green lights.
Spatial distribution of responses to monochromatic stimuli in the AOTu
To analyze the spatial distribution of activation patterns in the AOTu, we focused on pixels that were significantly activated, i.e., whose signal was statistically above noise level. Figure 3A (left) presents maps of activated pixels during the on-response phase in the AOTu of one animal upon three stimulations with UV, blue, or green light. These maps help to determine the reproducibility of calcium signals evoked by a given chromatic stimulus and compare AOTu regions activated by two different stimuli. In the first case, density maps were computed in which a color code indicated the number of times each pixel was activated during three stimulations of a given stimulus (Fig. 3A, “density” column). Pixels that were systematically activated by a chromatic stimulus were defined as “reliably activated” and are indicated in white. In the second case, overlay maps were computed in which reliably activated pixels were represented in a different color for each chromatic stimulus (Fig. 3A, “overlay” column). In these maps, coactivated pixels are shown in white.
Quantification of the number of pixels activated by each monochromatic stimulus (Fig. 3B) gave very similar results as the measure of calcium signal amplitude (Fig. 2E). All visual stimuli activated significantly more pixels than the control without any light (Fig. 3B; on-phase: Friedman test: χ2 = 33.37, df = 3, p < 0.0001; Wilcoxon test: Z = 3.18, p < 0.01 in all cases; off-phase: Friedman test: χ2 = 23.68, df = 3, p < 0.0001; Wilcoxon test: Z = 3.18, p < 0.01 in all cases). As can also be seen in Figure 3A, during the on-phase, green activated more pixels than UV or blue (Fig. 3B; Z ≥ 3.18, p < 0.01), while stimulations with UV and blue did not differ (Z = 0.03, NS). After stimulus offset, the number of activated pixels increased for UV and blue (Fig. 3B; UV: Z = 2.06, p < 0.04; blue: Z = 2.97, p < 0.01), which is consistent with the offset response elicited by these stimuli (Fig. 2D). For green, the number of activated pixels decreased after stimulus offset (Z = 3.18, p < 0.01). As a result, all three stimuli activated a similar number of pixels during the off-phase (Fig. 3B; Z < 0.94, NS).
Stimulation of the compound eye with UV, blue, or green light activated both the MU-VL and the MU-DL of the AOTu (Fig. 3A). However, the numbers of pixels activated by these monochromatic lights were different within MU subunits (Fig. 3C; Friedman test, MU-DL: χ2 = 20.46, df = 2, p < 0.001; MU-VL: χ2 = 22.15, df = 2, p < 0.001). In both subunits, green activated more pixels than UV or blue (MU-DL: Z ≥ 2.76, p < 0.01; MU-VL: Z ≥ 3.11, p < 0.01). However, in the dorsal subunit (MU-DL), blue activated more pixels than UV (Z = 2.28, p < 0.02), while in the ventral one (MU-VL), UV activated more pixels than blue (Z = 3.11, p < 0.01). Thus, while both subunits respond strongly to green, blue information preferentially activates the MU-DL, while UV information preferentially activates the MU-VL.
To analyze similarity relationships between activity patterns to the different monochromatic stimuli, we calculated overlap indices between maps. For each pair of stimulations, we calculated the proportion of pixels activated by both stimulations, relative to the number of pixels activated by one or the other stimulation (overlap index; see Materials and Methods). A value of 1 indicates a total coincidence between the two activity patterns (all pixels in common), while a value of zero corresponds to a total segregation of activity patterns (no pixel in common). For the 13 animals used in this experiment, the overlap index between different presentations of UV light was not significantly different from the index between different presentations of blue light (Fig. 3D; Overlap UV/UV vs Overlap B/B:Z = 0.17, NS). However, the overlap index between UV and blue lights was significantly lower than the two overlap values obtained for different presentations of UV light or different presentations of blue light (Fig. 3D; Friedman test: χ2 = 11.69, df = 2, p < 0.01; Overlap UV/B vs Overlap UV/UV:Z = 2.62, p < 0.01; Overlap UV/B vs Overlap B/B:Z = 2.48, p < 0.02). This result confirms that stimulations with UV and blue lights induce distinct spatial activity patterns in the AOTu (Fig. 3C).
Because green was a very strong stimulus for the entire AOTu, it generally induced broad activation maps (Fig. 3A). Therefore, UV- and blue-evoked patterns tended to be included within green-evoked maps. Consequently, the overlap index between different presentations of UV or of blue light was not significantly different from the overlap between presentations of each of these lights and green light (Fig. 3E; Overlap UV/UV vs Overlap UV/G:Z = 1.85, NS; Fig. 3G; Overlap B/B vs Overlap B/G:Z = 0.87, NS). The overlap between different presentations of green light was significantly higher than the overlap between different presentations of UV light, and higher than the overlap between green and UV lights (Fig. 3E; Friedman test: χ2 = 18.00, df = 2, p < 0.001; Overlap G/G vs Overlap UV/UV:Z = 3.18, p < 0.01; Overlap G/G vs Overlap UV/G:Z = 3.04, p < 0.01). The same effects were found when we analyzed similarity between activation patterns evoked by blue and green (Fig. 3F; Friedman test: χ2 = 11.69, df = 2, p < 0.01; Overlap G/G vs Overlap B/B:Z = 2.90, p < 0.01; Overlap G/G vs Overlap B/G:Z = 3.11, p < 0.01). These analyses show that UV and blue lights induce significantly different activity patterns within the AOTu, while green light induces broad activity patterns, which in part contain UV and blue patterns.
Experiment 2: effect of light intensity and chromatic mixtures on calcium responses
In the previous experiment we found that isoluminant UV, blue, and green monochromatic lights evoke different signal intensities and temporal dynamics and that UV and blue evoked different activation patterns in the AOTu. Chromatic stimuli in nature, however, do not all have the same luminance and are not composed of a single wavelength, but of combinations of wavelengths in different parts of the spectrum. The next experiment was thus designed to ask how stimulus intensity and chromatic mixtures affect activation patterns in the AOTu. Using blue-green dual-wavelength LED arrays, we presented eight different chromatic stimuli to the bees (Fig. 4, right upper box): dim blue, bright blue, dim green, bright green, dim blue + dim green, bright blue + bright green, bright blue + dim green, dim blue + bright green (see Material and Methods).
All eight stimuli elicited calcium signals in AOTu intertubercle neurons (Fig. 4; N = 11 bees). In all cases, the mean amplitude of calcium responses was significantly higher than that of control recordings without any light (data not shown; Friedman test: χ2 = 59.85, df = 8, p < 0.0001; Wilcoxon test: Z ≥ 2.85, p < 0.005 in all cases). Figure 4 shows for one example animal the activation pattern (“signals”) evoked by each stimulus, as well as the density map (“density”) for the three presentations of each stimulus. The average time course evoked by each of the eight chromatic stimuli is also shown. Independently of stimulus luminance, monochromatic blue stimulations (dim B and bright B) included an off-response phase, which was not observed for monochromatic green (dim G and bright G). Generally, blue-green mixtures did not show any excitatory off-response phase, except when the mixture contained more blue than green (Fig. 4, bright B + dim G), in which case, a small response increase was seen at stimulus offset.
Effect of light intensity on AOTu activation
The presentation of bright and dim versions of the monochromatic stimuli allowed us to evaluate the effect of light intensity on calcium signals in AOTu intertubercle neurons. The bright stimuli were calibrated to have twice the photon flux of dim stimuli (see Materials and Methods; Fig. 4A, right upper box). As expected, signal amplitude and the number of activated pixels were significantly higher for the bright than for the dim stimuli, both for monochromatic blue (amplitude, data not shown Z = 2.58, p < 0.01; activated pixels: Fig. 5A; Z = 2.85, p < 0.01) and green (amplitude, Z = 2.40, p < 0.02; activated pixels: Z = 2.67, p < 0.01). Activity patterns evoked by bright stimuli were generally broader than those evoked by dim stimuli, so that the overlap between different presentations of a bright stimulus was significantly higher than between different presentations of a dim stimulus, both for blue light (Fig. 5B; Friedman test: χ2 = 22.00, df = 2, p < 0.001; Overlap Br/Br vs Overlap Di/Di: Z = 2.93, p < 0.01) and for green light (Fig. 5C; Friedman test: χ2 = 11.09, df = 2, p < 0.01; Overlap Br/Br vs Overlap Di/Di: Z = 2.31, p < 0.02). When we analyzed the similarity between dim and bright blue, the overlap between presentations of these stimuli was significantly lower than that between different presentations of bright blue (Fig. 5B; Overlap Di/Br vs Overlap Br/Br: Z = 2.93, p < 0.01) but significantly higher than the overlap between presentations of dim blue (Fig. 5B; Overlap Di/Br vs Overlap Di/Di: Z = 2.93, p < 0.01). In the case of dim and bright green, the overlap between these two stimuli was significantly lower than that between different presentations of bright green (Fig. 5C; Overlap Di/Br vs Overlap Br/Br: Z = 2.85, p < 0.01) but did not differ from the overlap between presentations of dim green (Fig. 5C; Overlap Di/Br vs Overlap Di/Di: Z = 0.27, NS). These results show that light intensity clearly influences the number of activated pixels (Fig. 5A). However, the fact that two presentations of either dim or bright light do not induce higher overlap indexes than that between a bright and a dim light (rather a lower index in the case of blue light, or a similar index in the case of green light) suggests that the activity evoked by dim stimuli is rather contained within the regions activated by the bright stimuli (Fig. 5B,C).
Effect of chromatic mixtures on AOTu activation
We then asked how intertubercle neurons process chromatic mixtures. When the bee eye is stimulated with a blue-green mixture, do these neurons process the monochromatic elements separately (elemental processing) or do they treat the mixture as an entity different from its elements (configural processing)? In other words, does the mixture activate a pattern resulting from the simple sum of component patterns or is it different from such sum? In other sensory modalities, like olfaction, mixture-specific interactions have been demonstrated in the form of a specific inhibition (“suppression”) of the neural responses when two components are presented together (Duchamp-Viret et al., 2003; Deisig et al., 2006; Silbering and Galizia, 2007; Meyer and Galizia, 2012). In such cases, the response of a given neural unit to a mixture is significantly lower than that to the strongest component, i.e., the component that induces highest activation of the unit. To evaluate possible chromatic-mixture interactions in the AOTu, we used the response classification developed for studies on olfactory-mixture processing in the honey bee brain (Duchamp-Viret et al., 2003; Deisig et al., 2006, 2010). Responses to each chromatic mixture and to the stronger of its two monochromatic components were systematically compared. The stronger component was defined as the component of the mixture inducing the highest number of activated pixels in the AOTu. The response to the mixture could be statistically higher than (“synergy”), equal to (“hypoadditivity”), or lower than (“suppression”) the response to the stronger component.
As expected from the data presented above, green light was the strongest component in three of the four mixtures analyzed in this study (Fig. 6A; dim B + dim G; bright B + bright G; dim B + bright G; Z ≥ 2.67, p < 0.01 in all cases). For the last mixture (bright B + dim G), the number of pixels activated by blue and green was statistically equivalent (Fig. 6A; Z = 0.53, NS). For three chromatic mixtures (dim B + dim G; bright B + bright G; bright B + dim G), clear suppression was observed, as responses to the mixture were significantly lower than those to the stronger component (Fig. 6A; Z ≥ 2.67, p < 0.01). Chromatic mixture suppression was so strong that for two of the mixtures (dim B + dim G and bright B + dim G), the response to the mixture was even lower than the response to the weaker component (Fig. 6A; Z ≥ 2.49, p < 0.02). For the mixture dim B + bright G, in which the green component was especially strong, we observed hypoadditivity as the number of pixels activated by the mixture was equivalent to that activated by the stronger component (bright G vs dim B + bright G: Z < 1.78, NS). We thus conclude that mixture processing in the AOTu is mostly characterized by suppression effects, except when the mixture has a strong green component, in which case hypoadditivity is observed.
Similarity between activity patterns of chromatic mixtures and their components
In addition to the kind of interactions that occur within a mixture, another important question is how mixture representation relates to component representation. To evaluate similarity relationships between activity patterns for each mixture and its components in the AOTu, we represented the overlap index for presentations of the same stimulus (Fig. 6B–E, left; blue vs blue, green vs green, or mix vs mix) or of different stimuli (Fig. 6B–E, right; blue vs green, blue vs mix, green vs mix). Generally, as observed above, the overlap between different presentations of the same stimulus followed the number of pixels activated by this stimulus (Fig. 6, compare A and B–E, left). In only two cases, differences appeared among overlap indexes for presentations of the same stimulus. For the mixture dim B + dim G (Fig. 6B, left), the overlap index for presentations of dim green was significantly higher than the overlap values obtained for presentations of dim blue or of the mixture (Friedman test: χ2 = 14.36, df = 2, p < 0.01; Overlap G/G vs Overlap B/B:Z = 2.32, p < 0.02; Overlap G/G vs Overlap Mix/Mix:Z = 2.93, p < 0.01). For the mixture dim B + bright G (Fig. 6E, left) the overlap index for presentations of dim blue was significantly lower than the overlap values obtained for presentations of dim green or of the mixture (Friedman test: χ2 = 14.36, df = 2, p < 0.01; Overlap B/B vs Overlap G/G:Z = 2.93, p < 0.02; Overlap B/B vs Overlap Mix/Mix:Z = 2.85, p < 0.01). Although a clear tendency appeared, no significant difference was found for the mixtures bright B + bright G and bright B + dim G (Fig. 6C; Friedman test: χ2 = 5.63, df = 2, NS; Fig. 6D; Friedman test: χ2 = 5.09, df = 2, NS).
When evaluating the overlap for different stimuli, we found two different types of similarity relationships between mixtures and components. For the three mixtures in which suppression was observed (dim B + dim G, bright B + bright G, bright B + dim G), the overlap indexes between the mixture and each of its components (Fig. 6B–D; Overlap B/Mix, Overlap G/Mix) were both significantly lower than that between the blue and green components (Overlap B/G, Fig. 6B–D; Friedman test: χ2 ≥ 9.45, df = 2, p < 0.01; all multiple comparisons Z ≥ 2.40, p < 0.02). This shows that activation patterns evoked by monochromatic blue and green lights were more similar to each other than to the activation pattern evoked by the blue-green mixture. Therefore, chromatic processing in the AOTu gave rise to a neural representation of the chromatic mixture that was difficult to predict from the representations of its components. This result supports the idea of configural processing of chromatic information in the AOTu.
For the fourth mixture, in which the green component was especially strong and hypoadditivity was found (dim B + bright G; Fig. 6A), a different effect was observed: the overlap between the activation patterns of the stronger green component and the mixture (Overlap G/Mix) was higher than the overlap between the patterns of the weaker blue component and the mixture (Fig. 6E; Friedman test: χ2 = 11.45, df = 2, p < 0.005; Overlap G/Mix vs Overlap B/Mix: Z = 2.85, p < 0.005), and then the overlap between the patterns evoked by the two components (Overlap G/Mix vs Overlap B/G: Z = 2.76, p < 0.01). In other words, the representation of the mixture highly resembled the representation of the stronger component. In this example, chromatic processing would correspond to a more elemental strategy, since the representation of the mixture logically followed the respective strengths of the components.
Discussion
We performed the first optophysiological study of chromatic processing at a neural assembly level in the insect brain. Using in vivo calcium imaging, we analyzed the spectral response properties of interneurons in the honey bee AOTu and their possible involvement in chromatic processing. Stimulation with distinct monochromatic lights and chromatic mixtures induced different signal amplitudes, temporal dynamics, and spatial activity patterns in the AOTu intertubercle network. Although this approach cannot be directly compared with single-neuron analyses of chromatic processing (for review, see Menzel and Backhaus, 1991), it provides the first quantification of the response characteristics of a central neuronal assembly downstream of the well characterized optic neuropiles medulla and lobula. Unlike single-cell recordings, our analyses reveal spatial response distribution and allow revealing complex interactions between neurons within the AOTu.
Temporal aspects of monochromatic processing in the AOTu
Monochromatic stimuli (UV, blue, and green) matching the three photoreceptor types of the bee retina elicited clear calcium signals in the dendritic arborizations of intertubercle neurons in the AOTu. However, the temporal dynamics of the signals recorded for the three monochromatic lights were different. Signals evoked by UV and blue lights typically presented an additional off-response component, while responses evoked by green light were generally phasic–tonic with a slow signal decrease after stimulus offset. This observation concurs with intracellular electrophysiological recordings of visual neurons in bees, in which temporal response characteristics differed according to the chromatic properties of the stimuli (Menzel, 1974; Kien and Menzel, 1977; Milde, 1988; Hertel, 1980; Hertel and Maronde, 1987; Hertel et al., 1987; Yang et al., 2004; Paulk et al., 2008, 2009a,b). In the bee medulla and lobula, for instance, neurons present an “on–off” response to some colors, but a simple “on” response to others (Hertel, 1980; Yang et al., 2004; Paulk et al., 2008, 2009b). These different temporal responses are thought to facilitate color information processing using a smaller number of neurons (Dyer et al., 2011). Temporal coding could be particularly advantageous for a small insect brain, in which neuron numbers are limited (Paulk et al., 2009b).
The presence of off-responses to UV and blue light shows that some of the neurons in the AOTu network exhibit excitatory activity after UV or blue light offset. Individual neurons presenting postinhibition “off” responses in the bee brain frequently belong to the color-opponent neuronal category, characterized by differential excitatory and/or inhibitory interactions between two or more photoreceptor classes (Kien and Menzel, 1977; Riehle, 1981; Backhaus, 1991, Chittka, 1992; Yang et al., 2004; Paulk et al., 2008, 2009a,b). Thus, the observation of “on–off” responses for UV and blue light in contrast to the simple “on” response to green light suggests the existence of color-opponent neurons in the AOTu intertubercle network.
Spatial representation of monochromatic stimuli in the AOTu
Optophysiological techniques are used to analyze the spatial distribution of neural activity in neuronal assemblies. Using conventional microscopy, we measured responses from multiple neurons of the mITT and vITTs over a volume of the AOTu, so that neurons at different depths could participate in the signals (Mota et al., 2011). When different monochromatic stimuli were used, we found distinct activation patterns in the AOTu for UV and blue lights (Fig. 3). This result can be explained by the fact that UV and blue lights were differentially represented in the two recorded AOTu subcompartments (Fig. 3C). Significantly more pixels were activated by blue than by UV in the MU-DL (dorsal subcompartment), while more pixels were activated by UV than by blue in the MU-VL (ventral subcompartment). Thus, even though signal amplitude and the number of activated pixels did not differ between UV and blue stimulations, the patterns of activation induced by these colors were clearly spatially segregated. Our data thus point to different neurons responding to each of these two monochromatic stimuli and being differentially represented in the two major units. In contrast, green induced stronger and broader signals in both the dorsal and the ventral subcompartments of the MU, which strongly overlapped with both blue and UV signals. This experiment cannot distinguish between the same neurons being activated by blue (or UV) and by green, and different neurons responding exclusively to particular monochromatic lights but being located in the same areas. However, the monochromatic mixture experiments (see below) point to some neurons integrating information from different channels.
Using blue and green lights, we recorded stronger and spatially more widespread responses to bright stimuli than to dim stimuli, the spatial maps for dim stimuli being contained within those for bright stimuli. The stronger and broader signals to bright stimuli could be the product of the same neurons being more strongly activated than for dim stimuli and/or of additional neurons with a higher response threshold being recruited.
Photoreceptor distribution in the bee retina and chromatic processing in the AOTu
Three types of ommatidia have been distinguished in the bee retina based on photoreceptor identity (Wakakuwa et al., 2005). All of them contain six L receptors; type I contains additionally one S and one M receptor, type II contains two S receptors, and type III two M receptors. Each ommatidium also presents a basal ninth receptor (formerly described as an S receptor) whose exact sensitivity remains unclear (Wakakuwa et al., 2005). Thus, the higher number of L receptors evenly distributed across the retina could be a reason for the wider activation area in the AOTu and the higher response amplitude in the case of green light (activating the L receptor) compared with UV (activating the S receptor) or blue light (activating the M receptor). Yet, the number of photoreceptor types cannot be the only criterion for explaining response differences to the three lights assayed. Because the ratio of stimulus intensities between bright blue and dim green was 2:1 (bright blue: 7.6 × 10⁻⁶ photons; dim green: 3.8 × 10⁻⁶ photons) and the number of pixels activated by these two stimuli was the same (Fig. 5A), a ratio of 1 blue (M) receptor to two green (L) receptors (1:2) should be invoked to explain the similarity in activated pixel number if the effect was solely based on the proportion of photoreceptors. Such a receptor ratio does not, however, coincide with the true distribution of the three ommatidial classes described above, whose M to L photoreceptor ratios are 0:6, 1:6, or 2:6 (1:3) (Wakakuwa et al., 2005).
Alternatively, the fact that L photoreceptors are more-sensitive than S and M receptors (Menzel et al., 1986) could be considered as a more decisive factor explaining response differences to UV, blue, and green lights. However, this factor is also unlikely to explain the higher response amplitude to green light compared with UV and blue lights. As the response of photoreceptor cells increases linearly with a logarithmic increase of stimulus intensity over a certain range (V/logI function; Naka and Rushton, 1966; Menzel et al., 1986), the 2:1 stimulus intensity ratio between bright blue and dim green cannot induce significant variations of photoreceptor activity and should not, therefore, determine similar numbers of activated pixels. It may be, therefore, that the logarithmic function relating stimulus intensity and cell response at the photoreceptor level is modified at the level of the AOTu, where light intensity influences the number of activated pixels (Fig. 5A) but has no clear effect on the pattern of activation evoked by monochromatic stimuli. Transformation of the stimulus-response function may be a consequence of processing within the medulla and/or lobula.
Although the distribution of photoreceptors in the bee retina appears to be mostly random (Wakakuwa et al., 2005), the anterior ventral region seems to be more densely populated by the blue-sensitive M receptors while the dorsal rim area presents more S receptors (Wakakuwa et al., 2005). Interestingly, the MU-VL of the honey bee AOTu is mostly involved in the processing of dorsal-eye information (Mota et al., 2011). Here we found that in the MU-VL more pixels were activated by UV than by blue light, which might be related to the higher number of S receptors found in the dorsal region of the bee eye (Spaethe and Briscoe, 2005; Wakakuwa et al., 2005). Conversely, the MU-DL of the honey bee AOTu strongly participates in ventral-eye information processing (Mota et al., 2011). Accordingly, we found that the MU-DL was more activated by blue light, which might be related to the higher number of M receptors in the ventral eye region. Thus, the two major compartments of the AOTu seem to be involved in differential processing of information coming from distinct eye regions with a different distribution of photoreceptor types.
Chromatic interactions and suppressive effects in the AOTu network
For most of the blue-green mixtures, we found strong suppression, in which the chromatic mixture elicited a lower response than that elicited by its stronger component. Excitatory responses elicited by green were strongly suppressed by the addition of blue light in a blue-green mixture, discounting the possible argument that responses to blue-green mixtures would mainly reflect the expanded range of L-receptor sensitivity and the properties of the stimulating LEDs. Hypoadditivity was found in only one of four blue-green mixtures (dim B + bright G). This shows that the observed suppressive phenomena reflect inhibitory interactions and that inhibition caused by blue over green decreases when green light becomes dominant. Interestingly, the off-response usually elicited by blue was also suppressed by the combination with green in a blue-green mixture. These suppressive and hypoadditive modulations observed in responses to blue-green mixtures concur with color-opponent theories and provide additional evidence for the existence of chromatic processing in the AOTu circuits. In addition, we observed that the overlap between activity patterns elicited by blue-green mixtures and their components was mostly lower than the overlap existing between the patterns elicited by the blue and green components (Fig. 6A–C). This result is clearly at odds with elemental theories of mixture processing, in which the mixture representation is predicted to be a linear combination of component representations (Deisig et al., 2006). We thus conclude that chromatic mixtures evoke activity patterns that are better described by a configural processing strategy in which the mixture possesses novel characteristics distinct from those of the components (Pearce, 1987, 1994). Put simply, AOTu intertubercle neurons (or their inputs from the medulla or lobula) seem to integrate information from different photoreceptor channels in a nonlinear, suppressive, manner.
AOTu function
Most of the research on the AOTu has been performed in the locust, in the context of polarization vision (Homberg et al., 2003; Pfeiffer et al., 2005; Kinoshita et al., 2007; Pfeiffer and Homberg, 2007). In this insect, a small AOTu compartment called the lower unit seems to be dedicated to polarization processing. Interneurons involved in chromatic processing have been characterized by means of intracellular electrophysiological recordings in the locust's AOTu (Pfeiffer et al., 2005, Kinoshita et al., 2007; Pfeiffer and Homberg, 2007). It was proposed that they are involved in the perception of spectral sky gradients, which combined with spatial processing of polarized sky light would allow a precise coding of solar azimuth (Pfeiffer et al., 2005, Kinoshita et al., 2007; Pfeiffer and Homberg, 2007). Honey bees also derive a navigation compass from color gradients available in the sky in addition to using a polarization-based compass (Menzel and Snyder, 1974; Wehner and Rossel, 1985). Solar position is assimilated to green light while antisolar regions of the sky are assimilated to UV light (Wehner and Rossel, 1985). Our results on chromatic processing in the AOTu are consistent with a role of this structure in navigation and spatial orientation. Intertubercle neurons in the MU-VL of the honey bee, which mostly process dorsal eye information (Mota et al., 2011) and are strongly activated by UV, may participate in the central processing of polarized UV light, thus allowing identification of the antisolar sky hemisphere (Wehner and Rossel, 1985). Green-light processing both in the MU-VL and the MU-DL may encode spectral information directly related to the sun (Wehner and Rossel, 1985). The fact that intertubercle neurons in the MU-DL, which mostly process ventral eye information (Mota et al., 2011), are strongly activated by blue light is consistent with the higher proportion of M photoreceptors in the ventral part of the bee eye (Wakakuwa et al., 2005) and with an improved detection of targets in ventral eye regions based on contrast to M photoreceptors (Giurfa et al., 1999). These hypotheses constitute starting points for future studies aimed at unraveling the function of AOTu in honey bees.
Footnotes
This work was funded by the French National Research Agency (Project 07-NEURO-003, APICOLOR to J.C.S.), the National Science Foundation (IOB 0519483 to W.G.), the French Research Council (Centre National de la Recherche Scientifique), the University Paul Sabatier (Project APIGENE to M.G.), and the Brazilian Council for Scientific and Technological Development (CNPq 400575/2012–4 to T.M.). T.M. was supported by a Jovem Talento Scholarship from the Ciência sem Fronteiras Program and the Brazilian government. We thank two anonymous referees for helpful comments as well as Patrick Arrufat and Maud Combe for building the visual stimulation device and programming the software for imaging analysis, respectively.
The authors declare no competing financial interests.
References
- Avarguès-Weber A, Mota T, Giurfa M. New vistas on honey bee vision. Apidologie, 2012;43:244–268. [Google Scholar]
- Backhaus W. Color opponent coding in the visual system of the honeybee. Vision Res. 1991;31:1381–1397. doi: 10.1016/0042-6989(91)90059-e. [DOI] [PubMed] [Google Scholar]
- Chittka L. The color hexagon: a chromaticity diagram based on photoreceptor excitations as a generalized representation of color opponency. J Comp Physiol A Neuroethol Sens Neural Behav Physiol. 1992;170:533–543. [Google Scholar]
- Daumer K. Reizmetrische untersuchung des Farbensehens der Bienen. Z Vergl Physiol. 1956;38:413–478. [Google Scholar]
- Deisig N, Giurfa M, Lachnit H, Sandoz JC. Neural representation of olfactory mixtures in the honeybee antennal lobe. Eur J Neurosci. 2006;24:1161–1174. doi: 10.1111/j.1460-9568.2006.04959.x. [DOI] [PubMed] [Google Scholar]
- Deisig N, Giurfa M, Sandoz JC. Antennal lobe processing increases separability of odor mixture representations in the honeybee. J Neurophysiol. 2010;103:2185–2194. doi: 10.1152/jn.00342.2009. [DOI] [PubMed] [Google Scholar]
- Duchamp-Viret P, Duchamp A, Chaput MA. Single olfactory sensory neurons simultaneously integrate the components of an odour mixture. Eur J Neurosci. 2003;18:2690–2696. doi: 10.1111/j.1460-9568.2003.03001.x. [DOI] [PubMed] [Google Scholar]
- Dyer AG, Paulk AC, Reser DH. Colour processing in complex environments: insights from the visual system of bees. Proc Biol Sci. 2011;278:952–959. doi: 10.1098/rspb.2010.2412. [DOI] [PMC free article] [PubMed] [Google Scholar]
- Galizia CG, Vetter RS. Optical methods for analyzing odor-evoked activity in the insect brain. In: Christensen TA, editor. Advances in insect sensory neuroscience. Boca Raton, FL: CRC; 2005. pp. 349–392. [Google Scholar]
- Giurfa M, Zaccardi G, Vorobyev M. How do bees detect coloured targets using different regions of their compound eyes. J Comp Physiol A Neuroethol Sens Neural Behav Physiol. 1999;185:591–600. [Google Scholar]
- Gronenberg W. Physiological and anatomical properties of optical input-fibres to the mushroom body in the bee brain. J Insect Physiol. 1986;32:695–704. [Google Scholar]
- Hertel H. Chromatic properties of identified interneurons in the optic lobes of the bee. J Comp Physiol A Neuroethol Sens Neural Behav Physiol. 1980;137:215–231. [Google Scholar]
- Hertel H, Maronde U. The physiology and morphology of centrally projecting visual interneurons in the honeybee brain. J Exp Biol. 1987;133:301–315. [Google Scholar]
- Hertel H, Schäfer S, Maronde U. The physiology and morphology of visual commissures in the honeybee brain. J Exp Biol. 1987;133:283–300. [Google Scholar]
- Homberg U, Hofer S, Pfeiffer K, Gebhardt S. Organization and neural connections of the anterior optic tubercle in the brain of the locust, Schistocerca gregaria. J Comp Neurol. 2003;462:415–430. doi: 10.1002/cne.10771. [DOI] [PubMed] [Google Scholar]
- Joerges J, Küttner A, Galizia CG, Menzel R. Representations of odours and odour mixtures visualized in the honeybee brain. Nature. 1997;387:285–288. [Google Scholar]
- Kien J, Menzel R. Chromatic properties of interneurons in the optic lobes of the bee. II. Narrow band and colour opponent neurons. J Comp Physiol A Neuroethol Sens Neural Behav Physiol. 1977;113:35–53. [Google Scholar]
- Kinoshita M, Pfeiffer K, Homberg U. Spectral properties of identified polarized-light sensitive interneurons in the brain of the desert locust Schistocerca gregaria. J Exp Biol. 2007;210:1350–1361. doi: 10.1242/jeb.02744. [DOI] [PubMed] [Google Scholar]
- Kühn A. Über den Farbensinn der Bienen. Z Vergl Physiol. 1927;5:762–800. [Google Scholar]
- Kühn, Pohl R. Dressurfähigkeit der Bienen auf Spektrallinien. Naturwissenschaften. 1921;9:738–740. [Google Scholar]
- Menzel R. Spectral sensitivity of monopolar cells in the bee lamina. J Comp Physiol. 1974;93:337–346. [Google Scholar]
- Menzel R, Backhaus W. Color vision in insects. In: Gouras P, editor. Vision and visual dysfunction. London: Macmillan; 1991. pp. 262–288. [Google Scholar]
- Menzel R, Snyder AW. Polarized light detection in the bee, Apis mellifera. J Comp Physiol. 1974;88:247–270. [Google Scholar]
- Menzel R, Ventura DF, Hertel H, Desouza JM, Greggers U. Spectral sensitivity of photoreceptors in insect compound eyes. Comparison of species and methods. J Comp Physiol A Neuroethol Sens Neural Behav Physiol. 1986;158:165–177. [Google Scholar]
- Meyer A, Galizia CG. Elemental and configural olfactory coding by antennal lobe neurons of the honeybee (Apis mellifera) J Comp Physiol A Neuroethol Sens Neural Behav Physiol. 2012;198:159–171. doi: 10.1007/s00359-011-0696-8. [DOI] [PMC free article] [PubMed] [Google Scholar]
- Meyer EP. Retrograde labelling of photoreceptors in different regions of the compound eyes of bees and ants. J Neurocytol. 1984;13:825–836. doi: 10.1007/BF01148496. [DOI] [PubMed] [Google Scholar]
- Milde JJ. Visual responses of interneurones in the posterior median protocerebrum and the central complex of the honeybee Apis mellifera. J Insect Physiol. 1988;34:427–436. [Google Scholar]
- Mobbs PG. The brain of the honeybee Apis mellifera: I. The connections and spatial organization of the mushroom bodies. Philos Trans R Soc Lond B Biol Sci. 1982;298:309–354. [Google Scholar]
- Mota T, Yamagata N, Giurfa M, Gronenberg W, Sandoz JC. Neural organization and visual processing in the anterior optic tubercle of the honeybee brain. J Neurosci. 2011;31:11443–11456. doi: 10.1523/JNEUROSCI.0995-11.2011. [DOI] [PMC free article] [PubMed] [Google Scholar]
- Naka KI, Rushton WA. An attempt to analyse colour reception by electrophysiology. J Physiol. 1966;185:556–586. doi: 10.1113/jphysiol.1966.sp008002. [DOI] [PMC free article] [PubMed] [Google Scholar]
- Okamura JY, Strausfeld NJ. Visual system of calliphorid flies: motion- and orientation-sensitive visual interneurons supplying dorsal optic glomeruli. J Comp Neurol. 2007;500:189–208. doi: 10.1002/cne.21195. [DOI] [PubMed] [Google Scholar]
- Paulk AC, Gronenberg W. Higher order visual input to the mushroom bodies in the bee, Bombus impatiens. Arthropod Struct Dev. 2008;37:443–458. doi: 10.1016/j.asd.2008.03.002. [DOI] [PMC free article] [PubMed] [Google Scholar]
- Paulk AC, Phillips-Portillo J, Dacks AM, Fellous JM, Gronenberg W. The processing of color, motion, and stimulus timing are anatomically segregated in the bumblebee brain. J Neurosci. 2008;28:6319–6332. doi: 10.1523/JNEUROSCI.1196-08.2008. [DOI] [PMC free article] [PubMed] [Google Scholar]
- Paulk AC, Dacks AM, Gronenberg W. Color processing in the medulla of the bumblebee (Apidae: Bombus impatiens) J Comp Neurol. 2009a;513:441–456. doi: 10.1002/cne.21993. [DOI] [PMC free article] [PubMed] [Google Scholar]
- Paulk AC, Dacks AM, Phillips-Portillo J, Fellous JM, Gronenberg W. Visual processing in the central bee brain. J Neurosci. 2009b;29:9987–9999. doi: 10.1523/JNEUROSCI.1325-09.2009. [DOI] [PMC free article] [PubMed] [Google Scholar]
- Pearce JM. An introduction to animal cognition. Hillsdale, NJ: Lawrence Erlbaum; 1987. [Google Scholar]
- Pearce JM. Similarity and discrimination: a selective review and a connectionist model. Psychol Rev. 1994;101:587–607. doi: 10.1037/0033-295x.101.4.587. [DOI] [PubMed] [Google Scholar]
- Peitsch D, Feitz A, Hertel H, de Souza J, Ventura DF, Menzel R. The spectral input systems of hymenopteran insects and their receptor-based colour vision. J Comp Physiol A Neuroethol Sens Neural Behav Physiol. 1992;170:23–40. doi: 10.1007/BF00190398. [DOI] [PubMed] [Google Scholar]
- Pfeiffer K, Homberg U. Coding of azimuthal directions via time-compensated combination of celestial compass cues. Curr Biol. 2007;17:960–965. doi: 10.1016/j.cub.2007.04.059. [DOI] [PubMed] [Google Scholar]
- Pfeiffer K, Kinoshita M. Segregation of visual inputs from different regions of the compound eye in two parallel pathways through the anterior optic tubercle of the bumblebee (Bombus ignitus) J Comp Neurol. 2012;520:212–229. doi: 10.1002/cne.22776. [DOI] [PubMed] [Google Scholar]
- Pfeiffer K, Kinoshita M, Homberg U. Polarization-sensitive and light-sensitive neurons in two parallel pathways passing through the anterior optic tubercle in the locust brain. J Neurophysiol. 2005;94:3903–3915. doi: 10.1152/jn.00276.2005. [DOI] [PubMed] [Google Scholar]
- Ribi WA. The first optic ganglion of the bee. I. Correlation between visual cell types and their terminals in the lamina and medulla. Cell Tissue Res. 1975;165:103–111. doi: 10.1007/BF00222803. [DOI] [PubMed] [Google Scholar]
- Ribi WA, Scheel M. The second and third optic ganglia of the worker bee: Golgi studies of the neuronal elements in the medulla and lobula. Cell Tissue Res. 1981;221:17–43. doi: 10.1007/BF00216567. [DOI] [PubMed] [Google Scholar]
- Riehle A. Color opponent neurons of the honey bee in a heterochromatic flicker test. J Comp Physiol A Neuroethol Sens Neural Behav Physiol. 1981;142:81–88. [Google Scholar]
- Rossel S, Wehner R. How bees analyse the polarization patterns in the sky. Experiments and model. J Comp Physiol A. 1984;154:607–615. [Google Scholar]
- Sachse S, Galizia CG. Role of inhibition for temporal and spatial odor representation in olfactory output neurons: a calcium imaging study. J Neurophysiol. 2002;87:1106–1117. doi: 10.1152/jn.00325.2001. [DOI] [PubMed] [Google Scholar]
- Silbering AF, Galizia CG. Processing of odor mixtures in the Drosophila antennal lobe reveals both global inhibition and glomerulus-specific interactions. J Neurosci. 2007;27:11966–11977. doi: 10.1523/JNEUROSCI.3099-07.2007. [DOI] [PMC free article] [PubMed] [Google Scholar]
- Spaethe J, Briscoe AD. Molecular characterization and expression of the UV opsin in bumblebees: three ommatidial subtypes in the retina and a new photoreceptor organ in the lamina. J Exp Biol. 2005;208:2347–2361. doi: 10.1242/jeb.01634. [DOI] [PubMed] [Google Scholar]
- Strausfeld NJ, Sinakevitch I, Okamura JY. Organization of local interneurons in optic glomeruli of the dipterous visual system and comparisons with the antennal lobes. Dev Neurobiol. 2007;67:1267–1288. doi: 10.1002/dneu.20396. [DOI] [PubMed] [Google Scholar]
- von Frisch K. Der Farbensinn und Formensinn der Bienen. Zool Jb Physiol. 1914;37:1–238. [Google Scholar]
- Wakakuwa M, Kurasawa M, Giurfa M, Arikawa K. Spectral heterogeneity of honeybee ommatidia. Naturwissenschaften. 2005;92:464–467. doi: 10.1007/s00114-005-0018-5. [DOI] [PubMed] [Google Scholar]
- Wehner R, Rossel S. The bee's celestial compass: a case study in behavioural neurobiology. In: Hölldobler B, Lindauer M, editors. Experimental Behavioral ecology and sociobiology. Fischer: Stuttgart; 1985. pp. 11–54. [Google Scholar]
- Yang EC, Lin HC, Hung YS. Patterns of chromatic information processing in the lobula of the honeybee, Apis mellifera L. J Insect Physiol. 2004;50:913–925. doi: 10.1016/j.jinsphys.2004.06.010. [DOI] [PubMed] [Google Scholar]