

Abstract
The characteristic oscillations of the sleeping brain, spindles and slow waves, show trait-like, within-subject stability and a remarkable interindividual variability that correlates with functionally relevant measures such as memory performance and intelligence. Yet, the mechanisms underlying these interindividual differences are largely unknown. Spindles and slow waves are affected by the recent history of learning and neuronal activation, indicating sensitivity to changes in synaptic strength and thus to the connectivity of the neuronal network. Because the structural backbone of this network is formed by white matter tracts, we hypothesized that individual differences in spindles and slow waves depend on the white matter microstructure across a distributed network. We recorded both diffusion-weighted magnetic resonance images and whole-night, high-density electroencephalography and investigated whether individual differences in sleep spindle and slow wave parameters were associated with diffusion tensor imaging metrics; white matter fractional anisotropy and axial diffusivity were quantified using tract-based spatial statistics. Individuals with higher spindle power had higher axial diffusivity in the forceps minor, the anterior corpus callosum, fascicles in the temporal lobe, and the tracts within and surrounding the thalamus. Individuals with a steeper rising slope of the slow wave had higher axial diffusivity in the temporal fascicle and frontally located white matter tracts (forceps minor, anterior corpus callosum). These results indicate that the profiles of sleep oscillations reflect not only the dynamics of the neuronal network at the synaptic level, but also the localized microstructural properties of its structural backbone, the white matter tracts.
Introduction
People differ markedly with respect to their habitual sleep duration and timing. Electroencephalographic (EEG) recordings show large interindividual differences in sleep oscillation characteristics, such as slow waves and spindles, which, at the same time, have remarkable trait-like stability within an individual across nights (Kerkhof, 1991; Finelli et al., 2001; De Gennaro et al., 2005; Buckelmüller et al., 2006; Gander et al., 2010; Botella-Soler et al., 2012). The topography of slow-wave expression over the scalp is unique to each person (Rusterholz and Achermann, 2011). Furthermore, subject-specific slow-wave expression profiles have been associated with functionally relevant attributes (Dijk, 2011) such as chronotype (Kerkhof, 1991), sleep maintenance (Dijk, 2006), and the risk of schizophrenia (Sarkar et al., 2010). Similarly, sleep spindles have trait-like properties: the power profile in the spindle frequency range is remarkably constant over different nights within a person (Werth et al., 1997; De Gennaro et al., 2005, 2008) and indeed shows high heritability (De Gennaro et al., 2008). Spindle characteristics are likewise associated with meaningful measures, such as learning abilities (Schabus et al., 2008), cognitive performance (Bódizs et al., 2005), intelligence (Fogel and Smith, 2011), schizophrenia severity (Ferrarelli et al., 2007), and tolerance to environmental noise (Dang-Vu et al., 2010a). Despite this literature, little is known about the brain structural and functional mechanisms that cause the genetically specified interindividual differences and determine the properties of slow waves and spindles.
Slow waves and spindles are affected by the recent history of induced neuronal activation and synaptic plasticity (for review, Tononi and Cirelli, 2006; Diekelmann and Born, 2010; Poe et al., 2010; Fogel and Smith, 2011). Because learning-induced plasticity mostly depends on synaptic changes, the profile of slow waves and spindles likely reflects synaptic strength (Esser et al., 2007; Vyazovskiy et al., 2007; Vyazovskiy et al., 2008; Vyazovskiy et al., 2009) and consequently connectivity dynamics of the neuronal network. Crucially, whereas synapses comprise the endpoints of the network, its structural backbone is formed by long-range myelinated white matter tracts. Therefore, we hypothesized that slow waves and spindles might not only depend on synaptic strength, but also on the structural properties of the white matter tracts. Indirect support for this hypothesis is provided by Buchmann et al. (2011), who applied magnetic resonance imaging (MRI) and voxel-based morphometry to demonstrate a correlation between corpus callosum volume and slow-wave power over 10 min of sleep. As indicated by Buchmann et al. (2011), more definite conclusions would require more sophisticated imaging methods, such as diffusion tensor imaging (DTI) (Jones, 2010).
We, therefore, used DTI to investigate whether individual differences in the whole-brain white matter microstructure might contribute to the interindividual variability in slow wave and spindle characteristics as assessed by high-density sleep EEG. DTI allows for a detailed quantification of white matter properties, such as fractional anisotropy (FA), which is taken as a marker of white matter integrity (Beaulieu, 2010), and axial diffusivity (AD), which reflects the strength of diffusion along the axonal direction (Budde et al., 2007). Using this sensitive methodology, we here demonstrate, for the first time, partially overlapping and partially specific white matter networks associated with the subject-specific profiles of slow waves and spindles.
Materials and Methods
Sleep recordings.
Fifteen healthy males (mean age 25.4 ± 4.8 SD) with no history of neurological disorders took part in this study after given written informed consent according to the Declaration of Helsinki. The protocol of this study was approved by the medical ethical review board of the VU University Medical Center (Amsterdam, The Netherlands). Participants followed a regular sleep schedule in the week preceding the recording, as verified from actigraphy and sleep logs, and were requested to abstain from alcohol and caffeine for 24 h before the recording session.
Whole-night 256-channel electroencephalography (Electrical Geodesics) was recorded referenced to the Cz electrode, high pass filtered at 0.01 Hz, low pass filtered at 200 Hz with a hardware Bessel filter, and digitized at 500 Hz. Using the FAST toolbox (Leclercq et al., 2011), two independent raters scored sleep according to standard criteria (Iber et al., 2007) in 30 s epochs. One participant was excluded because he did not reach sleep stage N3 (non-REM stage 3, i.e., deep sleep). Segments containing artifacts were visually detected and excluded from analysis. For each epoch, noisy channels were automatically excluded when the signals exceeded the absolute thresholds of 1000 μV or its variance was above 10000 μV2. Slow wave and spindle detection was conducted after re-referencing to the averaged mastoid channels.
Slow wave detection.
Slow waves were automatically detected using methods described previously (Massimini et al., 2004; Dang-Vu et al., 2008) with custom code written in Matlab 7.13 (MathWorks). EEG potentials were averaged over four nonoverlapping areas of the scalp (on frontal, posterior, and lateral electrodes as in Massimini et al., 2004) and bandpass filtered between 0.2 and 4 Hz (Fig. 1A). The following criteria were applied independently to each local average to identify slow waves: (1) a negative zero crossing and a subsequent positive zero crossing separated by 0.2–1 s; (2) a negative peak between the two zero crossings with voltage less than −60 μV; and (3) a peak-to-peak difference between the negative peak and the subsequent positive peak in the 1 s period after the negative peak of >75 μV. The peak-to-peak threshold was based on the prescribed value for the detection of slow waves in the consensus sleep scoring manuals (Rechtschaffen and Kales, 1968; Iber et al., 2007).
Figure 1.

Detection of slow-wave and spindle parameters. A, The black line shows a 20 s segment of sleep EEG referenced to the averaged mastoids. After 0.2–4 Hz bandpass filtering (purple line), a slow wave was detected when the amplitude of the negative peak was less than −60 μV (green line), the duration between two zero-crossings was between 0.2 and 1 s, and the negative peak-to-positive peak difference was >75 μV. B, Three parameters were used to describe slow-wave activity: (1) slow-wave density, which is the number of slow waves in a minute; (2) the amplitude of the negative peak (blue line); and (3) the steepness of the rising slope, which is the amplitude of the negative peak divided by the interval between the negative peak and the following zero crossing (red line). C, To quantify spindles, the original signal shown in A was bandpass filtered between 11 and 16 Hz (blue line) and Hilbert-transformed into its envelope (purple line). A spindle was detected when the envelope of the band-passed signal was higher than the absolute threshold of 3 μV (green line) for 0.5–2 s. D, Two parameters were used to describe spindles: (1) spindle density, which is the number of spindles per minute; and (2) spindle power, which is the area outlined by the envelope (dark blue).
For each slow wave, we calculated (1) the maximum amplitude at the negative peak and (2) the slope between the negative peak and the following upward zero-crossing (Fig. 1B). Furthermore, we calculated slow wave density as the number of slow waves per minute. For each participant, these values were then averaged separately for sleep stages N2 and N3.
Spindle detection.
Spindles were automatically detected using an adaptation of the methods described previously (Mölle et al., 2002; Ferrarelli et al., 2007). The raw EEG signal was averaged over the same four nonoverlapping areas of the scalp as above, bandpass filtered between 11 and 16 Hz, and transformed into the envelope of the Hilbert transform (Fig. 1C,D). A spindle was detected when the signal envelope remained above the threshold of 3 μV for a duration of 0.5–2 s. These two absolute criteria allow for a constant detection threshold that is consistent across subjects and simplifies the interpretation of between-subject variability.
For each spindle we calculated the spindle power, which is defined as the area outlined by the envelope above the threshold (Fig. 1D). Furthermore, we calculated spindle density as the number of spindles per minute. For each participant, these values were then averaged separately for sleep stages N2 and N3.
Diffusion tensor imaging.
Diffusion properties in the white matter were assessed using DTI measures of fractional anisotropy and axial diffusivity from diffusion-weighted images. One image at b = 0 s/mm2 and 64 diffusion-weighted images at b = 1000 s/mm2 were acquired on a Philips Achieva 3T MRI scanner (Philips Medical Systems) with the following parameters: TR/TE = 8188/60 ms, flip angle = 90°, 224 × 224 × 120 mm FOV, 2 × 2 × 2 mm voxel size.
The FMRIB Software Library (FSL) data analysis suite [FSL 4.1.9 (Smith et al., 2004); http://www.fmrib.ox.ac.uk/fsl/] was used for correction of eddy current distortions and motion artifacts and for the computation of FA and AD. Single-voxel statistical analysis of the FA and AD maps was carried out using tract-based spatial statistics (TBSS) (Smith et al., 2006). Briefly, individual maps are warped into the MNI152 template space using nonlinear registration. Individual maps are averaged across subjects, and voxels with FA > 0.2 are included in the analysis, resulting in the selection of only major fiber bundles. Individual DTI maps are then projected onto this skeleton of putative white matter tracts.
Group statistics were computed separately for FA and AD on the slow-wave and spindle parameters. The design matrix included a column of ones to capture the intercept and a demeaned column for the sleep parameter, the latter representing the contrast of interest. In this way, the single-subject DTI values included in the white matter skeleton were correlated with the slow-wave and spindle parameters. Statistical tests were carried out using the FSL tool randomise, with a threshold-free cluster-enhanced correction for multiple comparisons [TFCE correction (Smith and Nichols, 2009)] using 10,000 permutations. The p values in the Tables refer to the most significant voxel in that particular contrast. The correlation maps with the slope of the slow wave in N3 and the spindle power in N2 are plotted in Figures 2 and 3, respectively. These figures show the significant voxels thresholded at (corrected) p ≤ 0.05 after using tbss_fill overlaid on the white matter skeleton in gray color and the study-specific MRI template. To identify which electrodes were the most informative in determining the slow-wave slope, we calculated at each significant voxel which group of electrode had the highest correlation. The four regions of interest are then color-coded in Figure 2.
Figure 2.
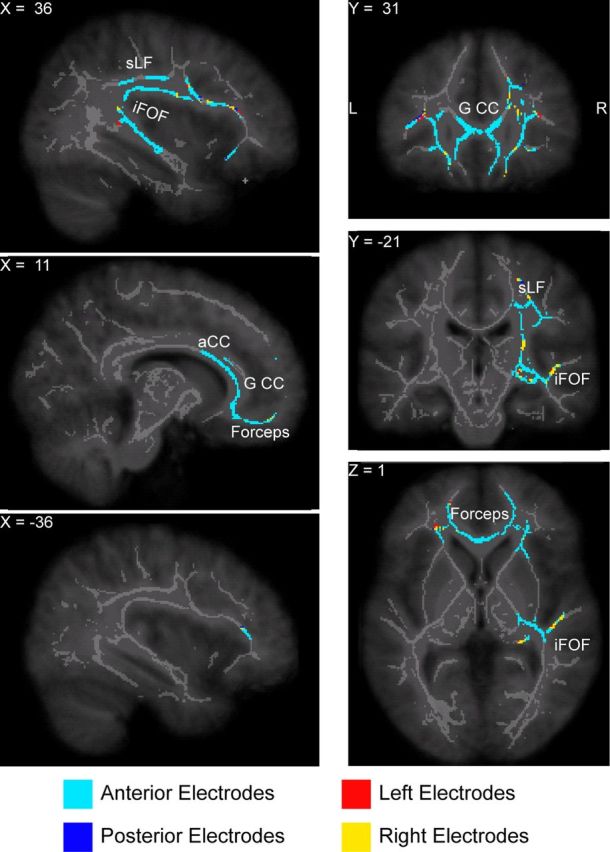
White matter tracts where axial diffusivity was higher in individuals with a steeper slow-wave slope. The plot shows the voxels with a positive significant correlation (thresholded at p ≤ 0.05 after correction for multiple comparisons) superimposed on the white matter skeleton (light gray) and on the study-specific MRI template (dark gray) following the neurological convention (right is right). The average slope was computed from the slow waves detected in all the four regions of interest, while the color coding indicates which region of interest was the most correlated with the AD at each voxel. The white matter tracts in which AD was associated with the slope steepness are concentrated in the frontal white matter, including the forceps minor, the genu and anterior part of the corpus callosum (G CC and aCC, respectively). These frontal pathways connect to the superior longitudinal fascicle (sLF) and the temporal branch of the inferior fronto-occipital fascicle (iFOF).
Figure 3.
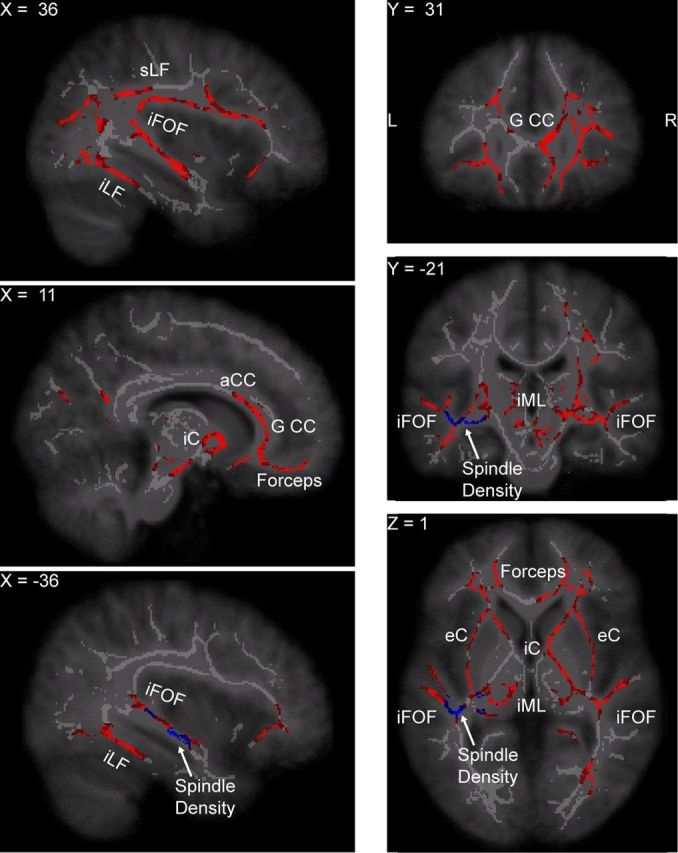
White matter tracts where axial diffusivity was higher in individuals with a stronger spindle power in sleep stage N2. Some of the white matter tracts in which AD was associated with spindle power partially overlap with the tracts plotted in Figure 2, such as the forceps minor, the genu and anterior part of the corpus callosum (G CC and aCC, respectively), the superior longitudinal fascicle (sLF), and the inferior fronto-occipital fascicle (iFOF). The network of white matter tracts whose AD was correlated with spindle power was more extended in the temporal lobe than the network where AD was associated with the slow-wave slope and included the inferior longitudinal fascicle (iLF) as well. Other tracts more selectively associated with spindle power include the white matter regions around the thalamus, such as the internal and external capsule (iC and eC, respectively) and the internal medullary lamina (iML) of the thalamus. In addition, tracts in the middle temporal lobe, colored in blue, were associated with spindle density in sleep stage N2.
The Matlab/FSL script for the complete analysis can be requested from the corresponding author.
Results
Association between properties of slow waves and white matter diffusion
Slow waves were automatically detected and their properties quantified by three parameters (Fig. 1A,B): (1) the mean amplitude of the negative peak, (2) the mean rising slope (Riedner et al., 2007), and (3) the slow-wave density (the number of slow waves per minute). The values for these parameters were calculated separately for sleep stages N2 and N3 (Iber et al., 2007) and are shown in Table 1.
Table 1.
Summary of the parameters for the slow waves, including mean and standard deviation
| Stage | Parameter | Mean | SD | PFA | PAD |
|---|---|---|---|---|---|
| N2 | Slow wave density (SW per minute) | 2.61 | ±0.56 | 0.07 | 0.11 |
| Mean negative peak (μV) | −92.24 | ±5.96 | 0.26 | 0.68 | |
| Mean rising slope (μV/s) | 324.41 | ±31.04 | 0.59 | 0.13 | |
| N3 | Slow wave density (SW per minute) | 11.26 | ±3.77 | 0.27 | 0.11 |
| Mean negative peak (μV) | −87.52 | ±4.23 | 0.56 | 0.93 | |
| Mean rising slope (μV/s) | 357.84 | ±28.05 | 0.14 | 0.006 |
The rightmost columns indicate the corrected p value for the most significant voxel of the correlation between the slow wave parameter (row) and the DTI parameter (column). A significant correlation between AD and the rising slope of slow waves during sleep stage N3 was observed, indicating that axial diffusivity was higher in individuals with a steeper slow wave slope (see Fig. 2).
The mean steepness of the rising slope of slow waves in stage N3 sleep was significantly positively correlated with AD, but not FA, in several parts of the structural skeleton of major white matter bundles (corrected p value = 0.006 at the peak voxel, see Fig. 2). A steeper rising slope was associated with higher AD in the forceps minor and neighboring white matter structures, including part of the uncinate fascicle, the genu and anterior part of the corpus callosum, the right superior longitudinal fascicle, and the temporal branch of the right inferior fronto-occipital fascicle. These areas comprise a mostly frontal interconnected network; major bundles in the parietal and occipital areas were below the significance threshold. To investigate which electrodes were the most informative in estimating the slow-wave slope, we calculated, at each significant voxel, the correlation between the slope and axial diffusivity for each of the four regions of interest and then selected the region of interest showing the highest correlation. The slow-wave slopes estimated from anterior electrodes showed the highest correlation with axial diffusivity, especially in the anterior white matter bundles (color-coded in Fig. 2). Neither AD nor FA correlated significantly with slow-wave density or the mean negative peak amplitude. No correlations were found for stage N2 sleep slow-wave parameters (details are reported in Table 1).
Association between properties of spindles and white matter diffusion
Spindles were automatically detected and their properties quantified by two parameters (Fig. 1 C,D): (1) the mean spindle power and (2) the mean spindle density (the mean number of spindles per minute). These parameters were calculated separately for sleep stages N2 and N3 and are shown in Table 2.
Table 2.
Summary of the parameters for the spindles, including mean and standard deviation
| Stage | Parameter | Mean | SD | PFA | PAD |
|---|---|---|---|---|---|
| N2 | Spindle density (spindles per minute) | 9.09 | ±2.84 | 0.33 | 0.04 |
| Mean spindle power (μV) | 4.22 | ±0.55 | 0.50 | 0.02 | |
| N3 | Spindle density (spindles per minute) | 5.63 | ±3.29 | 0.31 | 0.04 |
| Mean spindle power (μV) | 3.54 | ±0.50 | 0.58 | 0.11 |
The rightmost columns indicate the corrected p value for the most significant voxel of the correlation between the spindle parameter (row) and the DTI parameter (column). A significant correlation between AD and spindle power during sleep stage N2 was observed, indicating that axial diffusivity was higher in individuals with a stronger spindle power (Fig. 3). Furthermore, axial diffusivity was higher in individuals with a higher spindle density in sleep stages N2 and N3 in the temporal branch of the right inferior fronto-occipital fascicle (Fig. 3).
Individuals with a higher spindle power during sleep stage N2 had a higher axial diffusivity in the forceps minor, the genu and anterior part of the corpus callosum, the temporal branch of the inferior longitudinal fascicles, and the areas surrounding and intrinsic to the thalamus, including parts of the internal and external capsule (corrected p value = 0.02 at the peak voxel; Fig. 3). Higher spindle density, calculated during N2 and N3, positively correlated with higher AD in specific parts of the white matter tracts in the left middle temporal lobe (corrected p value = 0.04 at the peak voxel for both contrasts, details are reported in Table 2).
Discussion
Individual differences in the steepness of the rising slope of the slow wave during stage N3 sleep and in spindle power during stage N2 sleep are associated with axial diffusivity in partially overlapping major frontal white matter tracts that include the forceps minor, parts of the uncinate fascicle, and the anterior corpus callosum. Connected to this white matter backbone are the temporal branch of the inferior fronto-occipital fascicle and parts of the superior longitudinal fascicle, tracts in which AD was correlated with the profiles of both slow waves and spindles. In addition, participants with higher spindle power had higher axial diffusivity in white matter tracts within and surrounding the thalamus, including the internal and external capsule. Of note is that the slow-wave profile is mainly associated with frontal white matter, whereas the spindle profile is associated with white matter in a more extensive network that also includes subcortical regions. This difference is in line with the known anatomical and cellular substrate of both types of oscillatory events and with evidence from intracortical and scalp EEG, fMRI, and MRI studies (Schabus et al., 2007; Dang-Vu et al., 2008; Dang-Vu et al., 2010b). These results indicate that specific parameters of slow-wave and spindle activity do not only depend on the dynamics of the connectivity at the synaptic level (Vyazovskiy et al., 2007; Vyazovskiy et al., 2008; Vyazovskiy et al., 2009), but also reflect the more stable network properties that are determined by the structural backbone of white matter tracts.
The correlation between the slow-wave slope and AD in the superior longitudinal fascicle and the temporal fascicle was more pronounced in the right than in the left hemisphere. It is unclear whether this lateralization is due to an underlying anatomical difference between hemispheres, such as the unilateral increase in diffusivity in the arcuate fasciculus for language-related skills and handedness (Glasser and Rilling, 2008; Lebel and Beaulieu, 2009; Propper et al., 2010), or to the predominance of slow-wave activity on the right hemisphere (Goldstein et al., 1972; Roth et al., 1999; Sekimoto et al., 2000). This latter fact or local magnetic field in homogeneities might reduce the signal-to-noise ratio, thereby weakening the correlation in the left hemisphere. In fact, a more liberal threshold reveals significant correlation in the homologous regions in the left hemisphere.
Role of axial diffusivity in slow-wave synchronization and propagation
Axial diffusivity is considered a marker of axonal integrity (Budde et al., 2007; Budde and Song, 2010). The present findings indicate that axonal integrity in frontal parts of the white matter bundles determines the steepness of the slow-wave slope. Slope steepness is thought to reflect the extent to which the neuronal network synchronizes activity during the transition from the downstate of hyperpolarization and neuronal silence to the upstate of depolarization and discharge of action potentials (Steriade et al., 1993; Vyazovskiy et al., 2007). Taken together, these observations suggest that higher AD in selected brain regions might contribute to the synchronization of the slow wave, resulting in a steeper slope.
The effect of axonal integrity on slow-wave slope can be thought of in terms of known biophysical processes. We propose that while the intrinsic bistability of membrane potentials during slow-wave sleep eventually leads to some spontaneous isolated firing (Destexhe et al., 1999; Chauvette et al., 2010), white matter tracts with higher axial diffusivity will promote a more synchronized switching into the upstate over multiple neurons, as reflected in the steepness of the slow-wave slope. Crucially, according to our interpretation, strong axonal integrity of the bundles that connect prefrontal and limbic regions will catalyze the probability that sparse neuronal firing can ignite a widespread avalanche of slow-wave activity across the neuronal network.
White matter tracts of particular importance for the expression of slow waves comprise, among others, the forceps minor, the genu of the corpus callosum, and the uncinate fascicle. These bundles are ideal candidates to support the spreading of slow waves over widespread cortical areas across hemispheres (Fig. 2). Once a slow wave has been triggered in frontal regions, activity spreads toward the posterior part of the cortex along the cingulate cortex and the longitudinal fascicles (Botella-Soler et al., 2012). Conduction over the corpus callosum might be involved in the enhanced interhemispheric connectivity observed during sleep (Nir et al., 2008).
This interpretation is supported by intracranial and high-density EEG experiments that have demonstrated that slow waves are highly dynamic and are not confined to any brain region but travel over the cortex (Massimini et al., 2004; Botella-Soler et al., 2012). Although they can emerge in any part of the cortex, they are more likely to first appear in the anterior cingulate cortex and insula and then propagate along the anteroposterior axis over medial cortical areas (Murphy et al., 2009). Activity in the medial prefrontal cortex during slow waves (Dang-Vu et al., 2008) and spindles (Schabus et al., 2007) has been described using combined EEG-fMRI. Furthermore, the volume of the corpus callosum, measured with MRI, is associated with an individual's power spectral density in slow-wave frequency band (Buchmann et al., 2011). By employing DTI, not only do we confirm the association between slow waves and frontal regions, such as the prefrontal and cingulate cortex, but we also demonstrate that the profiles of slow waves are specifically affected by the microstructural properties of the main interregional white matter bundles.
Role of axial diffusivity in spindle profiles
A similar mechanism might contribute to the enhanced spindle power in individuals with high AD in the areas surrounding and within the thalamus and the internal and external capsule, including the corona radiata. These areas are thought to be involved in driving spindles by way of projections to and from the cortex (Steriade et al., 1985; Steriade, 2003a, Steriade, 2003b). Corticothalamic and thalamocortical fibers run through the superior and anterior thalamic peduncles that are located on the medial part of the internal capsule and in the anterior limb of the internal capsule, respectively. Our findings suggest that a stronger AD in the thalamocortical loop that supports the generation of spindles (Steriade et al., 1985; Steriade, 2003b) could enhance their power. Similarly, high AD in the frontal white matter network including the corpus callosum may facilitate interhemispheric synchronization (Achermann and Borbély, 1998), which is of functional relevance given its association with memory performance (Cantero et al., 2002; Mölle et al., 2004).
Temporal lobe
Expression profiles of slow waves and spindles consistently correlated with axial diffusivity not only in frontal white matter, but also in two major white matter tracts of the temporal lobe: the temporal branch of the inferior fronto-occipital fascicle and the inferior longitudinal fascicle. The association of AD in the temporal lobe and spindle activity was particularly strong, as judged from the spindle power correlation in both hemispheres and the spindle density correlation during both stages N2 and N3 sleep. Whereas spindles are generated in thalamocortical networks (Steriade, 2003b), their enhanced expression in individuals with higher AD in the inferior fronto-occipital fascicule and the inferior longitudinal fascicle may be of particular functional relevance, because these fascicles connect the temporal lobes with widespread cortical areas. Several studies have shown that memory performance and intelligence are positively associated with spindle density (Gais et al., 2002; Clemens et al., 2005; Morin et al., 2008; Fogel and Smith, 2011) and also with white matter connectivity in the temporal lobe (Persson et al., 2006; Sasson et al., 2010; Kantarci et al., 2011). Individual differences in white matter connectivity may mediate the association of spindle expression with memory performance and intelligence. Thus, these different structural and neurophysiological traits might be related and result from a common genotype. An intriguing additional possible explanation is that the variability in AD in these white matter bundles may in part reflect plasticity-induced changes associated with prolonged activation. There is accumulating evidence of an increase in structural connectivity, assessed with DTI, in response to training (Keller and Just, 2009; Scholz et al., 2009; Landi et al., 2011). A possible mechanism underlying such strengthening might be the recently discovered changes in myelination in association with glutamate release onto oligodendrocytes along the axon during action potentials (Kukley et al., 2007; Araque and Navarrete, 2011; Wake et al., 2011). Based on these findings, a prolonged and repeated high level of spindle activity, for example triggered by extensive learning (Fogel and Smith, 2011) and measured in this study with high spindle power and high spindle density, will conceivably strengthen an individual's temporal lobe white matter connectivity. Such increased connectivity might facilitate the synchronization between spindles and hippocampal ripples (Clemens et al., 2007) that underpins the communication between neocortex and hippocampus (Siapas and Wilson, 1998; Clemens et al., 2011) and bolsters memory consolidation during sleep (Diekelmann and Born, 2010).
Conclusion
Our findings indicate that interindividual variability in regionally specific white matter tracts contribute to the trait-like expression of slow waves and spindles, the most characteristic oscillations of the sleeping brain. The individual profiles of both these types of sleep oscillations correlate strongly with white matter axial diffusivity in frontal regions. In addition to these areas, spindle profiles show a marked association with axial diffusivity in subcortical white matter, including tracts within and around the thalamus. The regional distribution is in line with previous work on the neural sources of these oscillations. The findings complement earlier work which indicated that the expression profile of sleep oscillations reflect dynamic properties of network connectivity as a consequence of the relatively fast changes in synaptic strength (Tononi and Cirelli, 2006; Poe et al., 2010). White matter tracts, representing the structural backbone of neuronal network connectivity, appear equally important in determining the expression of sleep oscillations, reflecting the more stable and trait-like individual characteristics.
Footnotes
This work was supported by Netherlands Organization for Scientific Research (NWO) Grants VIDI 016.095.359 (to Y.D.V.D.W.) and VICI 453.07.001(to E.J.W.V.S.) and Top Talent Grant 021.002.080 (to S.-S. P.). We thank D. Stoffers for technical assistance and L. Sloot, D. Windhorst, and C. Zennig for their help with data acquisition. Part of the data were collected in collaboration with the Spinoza Centre for Neuroimaging, Amsterdam, The Netherlands, www.spinozacentre.nl.
References
- Achermann P, Borbély AA. Temporal evolution of coherence and power in the human sleep electroencephalogram. J Sleep Res. 1998;7(Suppl 1):36–41. doi: 10.1046/j.1365-2869.7.s1.6.x. [DOI] [PubMed] [Google Scholar]
- Araque A, Navarrete M. Development: electrically driven insulation in the central nervous system. Science. 2011;333:1587–1588. doi: 10.1126/science.1212525. [DOI] [PubMed] [Google Scholar]
- Beaulieu C. What makes diffusion anisotropic in the nervous system? In: Jones DK, editor. Diffusion MRI: theory, methods, and application. Oxford: Oxford UP; 2010. pp. 92–109. [Google Scholar]
- Bódizs R, Kis T, Lázár AS, Havrán L, Rigó P, Clemens Z, Halász P. Prediction of general mental ability based on neural oscillation measures of sleep. J Sleep Res. 2005;14:285–292. doi: 10.1111/j.1365-2869.2005.00472.x. [DOI] [PubMed] [Google Scholar]
- Botella-Soler V, Valderrama M, Crépon B, Navarro V, Le Van Quyen M. Large-scale cortical dynamics of sleep slow waves. PLoS One. 2012;7:e30757. doi: 10.1371/journal.pone.0030757. [DOI] [PMC free article] [PubMed] [Google Scholar]
- Buchmann A, Kurth S, Ringli M, Geiger A, Jenni OG, Huber R. Anatomical markers of sleep slow wave activity derived from structural magnetic resonance images. J Sleep Res. 2011;20:506–513. doi: 10.1111/j.1365-2869.2011.00916.x. [DOI] [PubMed] [Google Scholar]
- Buckelmüller J, Landolt H-P, Stassen HH, Achermann P. Trait-like individual differences in the human sleep electroencephalogram. Neuroscience. 2006;138:351–356. doi: 10.1016/j.neuroscience.2005.11.005. [DOI] [PubMed] [Google Scholar]
- Budde MD, Song S-K. Insights into diffusion tensor imaging from animal models of white matter pathology. In: Jones DK, editor. Diffusion MRI: theory, methods, and application. Oxford: Oxford UP; 2010. pp. 670–701. [Google Scholar]
- Budde MD, Kim JH, Liang H-F, Schmidt RE, Russell JH, Cross AH, Song S-K. Toward accurate diagnosis of white matter pathology using diffusion tensor imaging. Magn Reson Med. 2007;57:688–695. doi: 10.1002/mrm.21200. [DOI] [PubMed] [Google Scholar]
- Cantero JL, Atienza M, Salas RM, Dominguez-Marin E. Effects of prolonged waking-auditory stimulation on electroencephalogram synchronization and cortical coherence during subsequent slow-wave sleep. J Neurosci. 2002;22:4702–4708. doi: 10.1523/JNEUROSCI.22-11-04702.2002. [DOI] [PMC free article] [PubMed] [Google Scholar]
- Chauvette S, Volgushev M, Timofeev I. Origin of active states in local neocortical networks during slow sleep oscillation. Cereb Cortex. 2010;20:2660–2674. doi: 10.1093/cercor/bhq009. [DOI] [PMC free article] [PubMed] [Google Scholar]
- Clemens Z, Fabó D, Halász P. Overnight verbal memory retention correlates with the number of sleep spindles. Neuroscience. 2005;132:529–535. doi: 10.1016/j.neuroscience.2005.01.011. [DOI] [PubMed] [Google Scholar]
- Clemens Z, Mölle M, Eross L, Barsi P, Halász P, Born J. Temporal coupling of parahippocampal ripples, sleep spindles and slow oscillations in humans. Brain. 2007;130:2868–2878. doi: 10.1093/brain/awm146. [DOI] [PubMed] [Google Scholar]
- Clemens Z, Mölle M, Eross L, Jakus R, Rásonyi G, Halász P, Born J. Fine-tuned coupling between human parahippocampal ripples and sleep spindles. Eur J Neurosci. 2011;33:511–520. doi: 10.1111/j.1460-9568.2010.07505.x. [DOI] [PubMed] [Google Scholar]
- Dang-Vu TT, Schabus M, Desseilles M, Albouy G, Boly M, Darsaud A, Gais S, Rauchs G, Sterpenich V, Vandewalle G, Carrier J, Moonen G, Balteau E, Degueldre C, Luxen A, Phillips C, Maquet P. Spontaneous neural activity during human slow wave sleep. Proc Natl Acad Sci U S A. 2008;105:15160–15165. doi: 10.1073/pnas.0801819105. [DOI] [PMC free article] [PubMed] [Google Scholar]
- Dang-Vu TT, McKinney SM, Buxton OM, Solet JM, Ellenbogen JM. Spontaneous brain rhythms predict sleep stability in the face of noise. Curr Biol. 2010a;20:R626–R627. doi: 10.1016/j.cub.2010.06.032. [DOI] [PubMed] [Google Scholar]
- Dang-Vu TT, Schabus M, Desseilles M, Sterpenich V, Bonjean M, Maquet P. Functional neuroimaging insights into the physiology of human sleep. Sleep. 2010b;33:1589–1603. doi: 10.1093/sleep/33.12.1589. [DOI] [PMC free article] [PubMed] [Google Scholar]
- De Gennaro L, Ferrara M, Vecchio F, Curcio G, Bertini M. An electroencephalographic fingerprint of human sleep. Neuroimage. 2005;26:114–122. doi: 10.1016/j.neuroimage.2005.01.020. [DOI] [PubMed] [Google Scholar]
- De Gennaro L, Marzano C, Fratello F, Moroni F, Pellicciari MC, Ferlazzo F, Costa S, Couyoumdjian A, Curcio G, Sforza E, Malafosse A, Finelli LA, Pasqualetti P, Ferrara M, Bertini M, Rossini PM. The electroencephalographic fingerprint of sleep is genetically determined: a twin study. Ann Neurol. 2008;64:455–460. doi: 10.1002/ana.21434. [DOI] [PubMed] [Google Scholar]
- Destexhe A, Contreras D, Steriade M. Spatiotemporal analysis of local field potentials and unit discharges in cat cerebral cortex during natural wake and sleep states. J Neurosci. 1999;19:4595–4608. doi: 10.1523/JNEUROSCI.19-11-04595.1999. [DOI] [PMC free article] [PubMed] [Google Scholar]
- Diekelmann S, Born J. The memory function of sleep. Nat Rev Neurosci. 2010;11:114–126. doi: 10.1038/nrn2762. [DOI] [PubMed] [Google Scholar]
- Dijk D-J. Sleep of aging women and men: back to basics. Sleep. 2006;29:12–13. doi: 10.1093/sleep/29.1.12. [DOI] [PubMed] [Google Scholar]
- Dijk D-J. Phenotyping sleep. J Sleep Res. 2011;20:495. doi: 10.1111/j.1365-2869.2011.00980.x. [DOI] [PubMed] [Google Scholar]
- Esser SK, Hill SL, Tononi G. Sleep homeostasis and cortical synchronization: I. Modeling the effects of synaptic strength on sleep slow waves. Sleep. 2007;30:1617–1630. doi: 10.1093/sleep/30.12.1617. [DOI] [PMC free article] [PubMed] [Google Scholar]
- Ferrarelli F, Huber R, Peterson MJ, Massimini M, Murphy M, Riedner BA, Watson A, Bria P, Tononi G. Reduced sleep spindle activity in schizophrenia patients. Am J Psychiatry. 2007;164:483–492. doi: 10.1176/ajp.2007.164.3.483. [DOI] [PubMed] [Google Scholar]
- Finelli LA, Achermann P, Borbély AA. Individual “fingerprints” in human sleep EEG topography. Neuropsychopharmacology. 2001;25:S57–62. doi: 10.1016/S0893-133X(01)00320-7. [DOI] [PubMed] [Google Scholar]
- Fogel SM, Smith CT. The function of the sleep spindle: a physiological index of intelligence and a mechanism for sleep-dependent memory consolidation. Neurosci Biobehav Rev. 2011;35:1154–1165. doi: 10.1016/j.neubiorev.2010.12.003. [DOI] [PubMed] [Google Scholar]
- Gais S, Mölle M, Helms K, Born J. Learning-dependent increases in sleep spindle density. J Neurosci. 2002;22:6830–6834. doi: 10.1523/JNEUROSCI.22-15-06830.2002. [DOI] [PMC free article] [PubMed] [Google Scholar]
- Gander P, Signal L, Van Dongen HP, Muller D, Van Den Berg M. Stable inter-individual differences in slow-wave sleep during nocturnal sleep and naps. Sleep Biol Rhythms. 2010;8:239–244. [Google Scholar]
- Glasser MF, Rilling JK. DTI tractography of the human brain's language pathways. Cereb Cortex. 2008;18:2471–2482. doi: 10.1093/cercor/bhn011. [DOI] [PubMed] [Google Scholar]
- Goldstein L, Stoltzfus NW, Gardocki JF. Changes in interhemispheric amplitude relationships in the EEG during sleep. Physiol Behav. 1972;8:811–815. doi: 10.1016/0031-9384(72)90289-2. [DOI] [PubMed] [Google Scholar]
- Iber C, Ancoli-Israel S, Chesson AL, Quan SF. The AASM manual for the scoring of sleep and associated events: rules, terminology, and technical specifications. Ed 1. Westchester, IL: American Academy of Sleep Medicine; 2007. [Google Scholar]
- Jones DK, editor. Diffusion MRI: theory, methods, and application. Oxford, UK: Oxford UP; 2010. [Google Scholar]
- Kantarci K, Senjem ML, Avula R, Zhang B, Samikoglu AR, Weigand SD, Przybelski SA, Edmonson HA, Vemuri P, Knopman DS, Boeve BF, Ivnik RJ, Smith GE, Petersen RC, Jack CR., Jr Diffusion tensor imaging and cognitive function in older adults with no dementia. Neurology. 2011;77:26–34. doi: 10.1212/WNL.0b013e31822313dc. [DOI] [PMC free article] [PubMed] [Google Scholar]
- Keller TA, Just MA. Altering cortical connectivity: remediation-induced changes in the white matter of poor readers. Neuron. 2009;64:624–631. doi: 10.1016/j.neuron.2009.10.018. [DOI] [PMC free article] [PubMed] [Google Scholar]
- Kerkhof GA. Differences between morning-types and evening-types in the dynamics of EEG slow wave activity during night sleep. Electroencephalogr Clin Neurophysiol. 1991;78:197–202. doi: 10.1016/0013-4694(91)90033-z. [DOI] [PubMed] [Google Scholar]
- Kukley M, Capetillo-Zarate E, Dietrich D. Vesicular glutamate release from axons in white matter. Nat Neurosci. 2007;10:311–320. doi: 10.1038/nn1850. [DOI] [PubMed] [Google Scholar]
- Landi SM, Baguear F, Della-Maggiore V. One week of motor adaptation induces structural changes in primary motor cortex that predict long-term memory one year later. J Neurosci. 2011;31:11808–11813. doi: 10.1523/JNEUROSCI.2253-11.2011. [DOI] [PMC free article] [PubMed] [Google Scholar]
- Lebel C, Beaulieu C. Lateralization of the arcuate fasciculus from childhood to adulthood and its relation to cognitive abilities in children. Hum Brain Mapp. 2009;30:3563–3573. doi: 10.1002/hbm.20779. [DOI] [PMC free article] [PubMed] [Google Scholar]
- Leclercq Y, Schrouff J, Noirhomme Q, Maquet P, Phillips C. fMRI artefact rejection and sleep scoring toolbox. Comput Intell Neurosci. 2011;2011:598206. doi: 10.1155/2011/598206. [DOI] [PMC free article] [PubMed] [Google Scholar]
- Massimini M, Huber R, Ferrarelli F, Hill S, Tononi G. The sleep slow oscillation as a traveling wave. J Neurosci. 2004;24:6862–6870. doi: 10.1523/JNEUROSCI.1318-04.2004. [DOI] [PMC free article] [PubMed] [Google Scholar]
- Mölle M, Marshall L, Gais S, Born J. Grouping of spindle activity during slow oscillations in human non-rapid eye movement sleep. J Neurosci. 2002;22:10941–10947. doi: 10.1523/JNEUROSCI.22-24-10941.2002. [DOI] [PMC free article] [PubMed] [Google Scholar]
- Mölle M, Marshall L, Gais S, Born J. Learning increases human electroencephalographic coherence during subsequent slow sleep oscillations. Proc Natl Acad Sci U S A. 2004;101:13963–13968. doi: 10.1073/pnas.0402820101. [DOI] [PMC free article] [PubMed] [Google Scholar]
- Morin A, Doyon J, Dostie V, Barakat M, Hadj Tahar A, Korman M, Benali H, Karni A, Ungerleider LG, Carrier J. Motor sequence learning increases sleep spindles and fast frequencies in post-training sleep. Sleep. 2008;31:1149–1156. [PMC free article] [PubMed] [Google Scholar]
- Murphy M, Riedner BA, Huber R, Massimini M, Ferrarelli F, Tononi G. Source modeling sleep slow waves. Proc Natl Acad Sci U S A. 2009;106:1608–1613. doi: 10.1073/pnas.0807933106. [DOI] [PMC free article] [PubMed] [Google Scholar]
- Nir Y, Mukamel R, Dinstein I, Privman E, Harel M, Fisch L, Gelbard-Sagiv H, Kipervasser S, Andelman F, Neufeld MY, Kramer U, Arieli A, Fried I, Malach R. Interhemispheric correlations of slow spontaneous neuronal fluctuations revealed in human sensory cortex. Nat Neurosci. 2008;11:1100–1108. doi: 10.1038/nn.2177. [DOI] [PMC free article] [PubMed] [Google Scholar]
- Persson J, Nyberg L, Lind J, Larsson A, Nilsson L-G, Ingvar M, Buckner RL. Structure-function correlates of cognitive decline in aging. Cereb Cortex. 2006;16:907–915. doi: 10.1093/cercor/bhj036. [DOI] [PubMed] [Google Scholar]
- Poe GR, Walsh CM, Bjorness TE. Cognitive neuroscience of sleep. Prog Brain Res. 2010;185:1–19. doi: 10.1016/B978-0-444-53702-7.00001-4. [DOI] [PMC free article] [PubMed] [Google Scholar]
- Propper RE, O'Donnell LJ, Whalen S, Tie Y, Norton IH, Suarez RO, Zollei L, Radmanesh A, Golby AJ. A combined fMRI and DTI examination of functional language lateralization and arcuate fasciculus structure: Effects of degree versus direction of hand preference. Brain Cogn. 2010;73:85–92. doi: 10.1016/j.bandc.2010.03.004. [DOI] [PMC free article] [PubMed] [Google Scholar]
- Rechtschaffen A, Kales A. A manual of standardized terminology, techniques and scoring system for sleep stages of human subjects. Los Angeles: UCLA Brain Information Service/Brain Research Institute; 1968. [Google Scholar]
- Riedner BA, Vyazovskiy VV, Huber R, Massimini M, Esser S, Murphy M, Tononi G. Sleep homeostasis and cortical synchronization: III. A high-density EEG study of sleep slow waves in humans. Sleep. 2007;30:1643–1657. doi: 10.1093/sleep/30.12.1643. [DOI] [PMC free article] [PubMed] [Google Scholar]
- Roth C, Achermann P, Borbély AA. Frequency and state specific hemispheric asymmetries in the human sleep EEG. Neurosci Lett. 1999;271:139–142. doi: 10.1016/s0304-3940(99)00048-8. [DOI] [PubMed] [Google Scholar]
- Rusterholz T, Achermann P. Topographical aspects in the dynamics of sleep homeostasis in young men: individual patterns. BMC Neurosci. 2011;12:84. doi: 10.1186/1471-2202-12-84. [DOI] [PMC free article] [PubMed] [Google Scholar]
- Sarkar S, Katshu MZUH, Nizamie SH, Praharaj SK. Slow wave sleep deficits as a trait marker in patients with schizophrenia. Schizophr Res. 2010;124:127–133. doi: 10.1016/j.schres.2010.08.013. [DOI] [PubMed] [Google Scholar]
- Sasson E, Doniger GM, Pasternak O, Assaf Y. Structural correlates of memory performance with diffusion tensor imaging. Neuroimage. 2010;50:1231–1242. doi: 10.1016/j.neuroimage.2009.12.079. [DOI] [PubMed] [Google Scholar]
- Schabus M, Dang-Vu TT, Albouy G, Balteau E, Boly M, Carrier J, Darsaud A, Degueldre C, Desseilles M, Gais S, Phillips C, Rauchs G, Schnakers C, Sterpenich V, Vandewalle G, Luxen A, Maquet P. Hemodynamic cerebral correlates of sleep spindles during human non-rapid eye movement sleep. Proc Natl Acad Sci U S A. 2007;104:13164–13169. doi: 10.1073/pnas.0703084104. [DOI] [PMC free article] [PubMed] [Google Scholar]
- Schabus M, Hoedlmoser K, Pecherstorfer T, Anderer P, Gruber G, Parapatics S, Sauter C, Kloesch G, Klimesch W, Saletu B, Zeitlhofer J. Interindividual sleep spindle differences and their relation to learning-related enhancements. Brain Res. 2008;1191:127–135. doi: 10.1016/j.brainres.2007.10.106. [DOI] [PMC free article] [PubMed] [Google Scholar]
- Scholz J, Klein MC, Behrens TEJ, Johansen-Berg H. Training induces changes in white matter architecture. Nat Neurosci. 2009;12:1370–1371. doi: 10.1038/nn.2412. [DOI] [PMC free article] [PubMed] [Google Scholar]
- Sekimoto M, Kato M, Kajimura N, Watanabe T, Takahashi K, Okuma T. Asymmetric interhemispheric delta waves during all-night sleep in humans. Clin Neurophysiol. 2000;111:924–928. doi: 10.1016/s1388-2457(00)00258-3. [DOI] [PubMed] [Google Scholar]
- Siapas AG, Wilson MA. Coordinated interactions between hippocampal ripples and cortical spindles during slow-wave sleep. Neuron. 1998;21:1123–1128. doi: 10.1016/s0896-6273(00)80629-7. [DOI] [PubMed] [Google Scholar]
- Smith SM, Nichols TE. Threshold-free cluster enhancement: addressing problems of smoothing, threshold dependence and localisation in cluster inference. Neuroimage. 2009;44:83–98. doi: 10.1016/j.neuroimage.2008.03.061. [DOI] [PubMed] [Google Scholar]
- Smith SM, Jenkinson M, Woolrich MW, Beckmann CF, Behrens TEJ, Johansen-Berg H, Bannister PR, De Luca M, Drobnjak I, Flitney DE, Niazy RK, Saunders J, Vickers J, Zhang Y, De Stefano N, Brady JM, Matthews PM. Advances in functional and structural MR image analysis and implementation as FSL. Neuroimage. 2004;1(23 Suppl):S208–S219. doi: 10.1016/j.neuroimage.2004.07.051. [DOI] [PubMed] [Google Scholar]
- Smith SM, Jenkinson M, Johansen-Berg H, Rueckert D, Nichols TE, Mackay CE, Watkins KE, Ciccarelli O, Cader MZ, Matthews PM, Behrens TEJ. Tract-based spatial statistics: voxelwise analysis of multi-subject diffusion data. Neuroimage. 2006;31:1487–1505. doi: 10.1016/j.neuroimage.2006.02.024. [DOI] [PubMed] [Google Scholar]
- Steriade M. The corticothalamic system in sleep. Front Biosci. 2003a;8:d878–99. doi: 10.2741/1043. [DOI] [PubMed] [Google Scholar]
- Steriade M. Neuronal substrates of sleep and epilepsy. Cambridge: Cambridge University UP; 2003b. [Google Scholar]
- Steriade M, Deschênes M, Domich L, Mulle C. Abolition of spindle oscillations in thalamic neurons disconnected from nucleus reticularis thalami. J Neurophysiol. 1985;54:1473–1497. doi: 10.1152/jn.1985.54.6.1473. [DOI] [PubMed] [Google Scholar]
- Steriade M, Nuñez A, Amzica F. A novel slow (<1 Hz) oscillation of neocortical neurons in vivo: depolarizing and hyperpolarizing components. J Neurosci. 1993;13:3252–3265. doi: 10.1523/JNEUROSCI.13-08-03252.1993. [DOI] [PMC free article] [PubMed] [Google Scholar]
- Tononi G, Cirelli C. Sleep function and synaptic homeostasis. Sleep Med Rev. 2006;10:49–62. doi: 10.1016/j.smrv.2005.05.002. [DOI] [PubMed] [Google Scholar]
- Vyazovskiy VV, Riedner BA, Cirelli C, Tononi G. Sleep homeostasis and cortical synchronization: II. A local field potential study of sleep slow waves in the rat. Sleep. 2007;30:1631–1642. doi: 10.1093/sleep/30.12.1631. [DOI] [PMC free article] [PubMed] [Google Scholar]
- Vyazovskiy VV, Cirelli C, Pfister-Genskow M, Faraguna U, Tononi G. Molecular and electrophysiological evidence for net synaptic potentiation in wake and depression in sleep. Nat Neurosci. 2008;11:200–208. doi: 10.1038/nn2035. [DOI] [PubMed] [Google Scholar]
- Vyazovskiy VV, Olcese U, Lazimy YM, Faraguna U, Esser SK, Williams JC, Cirelli C, Tononi G. Cortical firing and sleep homeostasis. Neuron. 2009;63:865–878. doi: 10.1016/j.neuron.2009.08.024. [DOI] [PMC free article] [PubMed] [Google Scholar]
- Wake H, Lee PR, Fields RD. Control of local protein synthesis and initial events in myelination by action potentials. Science. 2011;333:1647–1651. doi: 10.1126/science.1206998. [DOI] [PMC free article] [PubMed] [Google Scholar]
- Werth E, Achermann P, Dijk DJ, Borbély AA. Spindle frequency activity in the sleep EEG: individual differences and topographic distribution. Electroencephalogr Clin Neurophysiol. 1997;103:535–542. doi: 10.1016/s0013-4694(97)00070-9. [DOI] [PubMed] [Google Scholar]