

Abstract
Time interval estimation is involved in numerous behavioral processes, but its underlying neural mechanisms remain unclear. In particular, it has been controversial whether time is encoded on a linear or logarithmic scale. Based on our previous finding that inactivation of the medial prefrontal cortex (mPFC) profoundly impairs rat's ability to discriminate time intervals, we investigated how the mPFC processes temporal information by examining activity of mPFC neurons in rats performing a temporal bisection task. Many mPFC neurons conveyed temporal information based on monotonically changing activity profiles over time with negative accelerations, so that their activity profiles were better described by logarithmic than linear functions. Moreover, the precision of time-interval discrimination based on neural activity was lowered in proportion to the elapse of time, but without proportional increase in neural variability, which is well accounted for by logarithmic, but not by linear functions. As a population, mPFC neurons conveyed precise information about the elapse of time with their activity tightly correlated with the animal's choice of target. These results suggest that the mPFC might be part of an internal clock in charge of controlling interval-timing behavior, and that linearly changing neuronal activity on a logarithmic time scale might be one way of representing the elapse of time in the brain.
Introduction
The ability to estimate time interval is ubiquitous in the animal kingdom, but its underlying neural mechanisms remain unclear. Behavioral studies in animals and humans have shown that the precision of time-interval discrimination is lowered in proportion to its duration, which is consistent with Weber's law. Moreover, the subjective midpoint between two different time intervals lies near the geometric rather than the arithmetic mean (Gallistel, 1990; Gibbon et al., 1997; Buhusi and Meck, 2005). These findings are well accounted for by assuming that time is represented on a logarithmic scale in the nervous system (Church and Deluty, 1977; Staddon and Higa, 1999; Roberts, 2006; Yi, 2009). However, they can also be accounted for by assuming that time is represented on a linear scale, but with proportionally increasing variability (Gibbon, 1977; Gibbon and Church, 1981; Roberts, 1981; Church and Gibbon, 1982; Gallistel, 1999; Wearden and Jones, 2007; scalar variability). Although each account is supported by behavioral data, their interpretations are based on various assumptions, casting doubts on the validity of the conclusions. Clearly, examining timing-related neural activity would be helpful to resolve the controversy and to elucidate the neural basis of interval timing.
It has been proposed that the brain is equipped with multiple time-measurement systems associated with different types of interval-timing behavior. The proposed systems include subsecond versus suprasecond timing (Ivry, 1996; Lewis and Miall, 2003b), perceptual versus motor timing (Schubotz and von Cramon, 2001; Merchant et al., 2008), automatic versus controlled timing (Lewis and Miall, 2003a), and explicit versus implicit timing (Coull and Nobre, 2008), which are partially related categories. Frontal cortex-basal ganglia circuitry, in particular, has been implicated in suprasecond (Meck and Benson, 2002; Mauk and Buonomano, 2004; Buhusi and Meck, 2005; Koch et al., 2009), cognitively controlled (Lewis and Miall, 2003a), and explicit (Coull and Nobre, 2008) timing. Here, we focused on the neural basis of interval timing in the prefrontal cortex (PFC). Involvement of the PFC in interval timing is well supported by several lines of evidence. Brain-imaging studies in humans have found activation of the PFC during various timing tasks (Penny and Vaitilingam, 2008), and local lesion/inactivation studies have shown that the PFC is crucially involved in time-interval discrimination in humans (Mangels et al., 1998; Koch et al., 2003; Jones et al., 2004), monkeys (Glickstein et al., 1964; Onoe et al., 2001), cats (Rosenkilde and Divac, 1976), and rats (Dietrich et al., 1997; Dietrich and Allen, 1998). We also have found that inactivation of the medial PFC (mPFC) profoundly impairs rat's ability to discriminate time intervals in the range of a few seconds (Kim et al., 2009b). In the present study, to investigate how the mPFC processes temporal information, we examined activity of mPFC neurons in rats performing the same temporal discrimination task as used in our previous behavioral study (Kim et al., 2009b). We found that mPFC neurons convey precise information about the elapse of time largely based on linearly changing activity on a logarithmic time scale.
Materials and Methods
Subjects
Six young male Sprague Dawley rats (∼9∼11 weeks old, 280∼380 g) were individually housed in the colony room and initially allowed ad libitum access to food and water with extensive handling for 1 week. Their body weights were gradually reduced to 80∼85% of their free-feeding weights by water deprivation and, once behavioral training began, they were allowed to have access to water only during two daily behavioral sessions. Experiments were performed in the dark phase of 12 h light/dark cycle, one in the morning and one in the evening. The experimental protocol was approved by the Institutional Animal Care and Use Committee of the Ajou University School of Medicine.
Behavioral tasks
Two separate groups of animals (3 animals each) performed two different temporal discrimination tasks on a modified T-maze (63 × 69 cm, elevated 30 cm from the floor; 8-cm-wide track with 2.7 cm walls around the track except the central connecting bridge; Fig. 1B). The experimental procedures were identical for the two tasks except that different durations of sample intervals were used. Animals in the first group (Experiment 1) were required to discriminate six different durations of time intervals into short or long periods to obtain water reward (Kim et al., 2009b). A new trial began when the animal came back from either goal location (Fig. 1B, white circles) to the central arm via the lateral alley and broke the central photobeam (Fig. 1B, arrow). The beginning of a time interval was signaled by a brief auditory tone (3.3 kHz, 200 ms, 90 db) when the animal broke the central photobeam. The end of a time interval was signaled by lowering the central bridge that allowed the animal to navigate to either goal location. Six different durations of time interval, which were spaced evenly on a logarithmic scale, were programmed to be presented in equal probability for a total of 300 trials in random order, and the animals performed 164∼273 (mean ± SD, 232.7 ± 21.5) trials per session. The animal had to navigate to one designated goal (left, n = 2 animals; right, n = 1 animal) when a short (3018, 3310, or 3629 ms) interval was presented, and navigate to the opposite goal when a long (3979, 4363, or 4784 ms) interval was presented to obtain water reward (30 μl). The presentation of sample intervals, delivery of water, and raising/lowering of the central bridge were automatically controlled by a personal computer using LabView software (National Instruments). The animals were trained to perform the task as previously described (Kim et al., 2009b) over the course of 28 d before electrode implantation. They were further trained for 14 d after recovery from the surgery. Thus, the animals were well trained in the task by the time unit recordings began. Also, before each recording session, the animals went through 20 practice trials that consisted of the shortest (3018 ms) and the longest (4784 ms) intervals only (10 trials each).
Figure 1.

Recording sites, behavioral task, and behavioral performance in Experiment 1. A, Activity of single neurons was recorded from the dorsal ACC, prelimbic cortex (PLC), and infralimbic cortex (ILC), as indicated by shading. The diagram is a coronal section view of the brain (2.7 mm anterior to bregma). Modified with permission from Elsevier (Paxinos and Watson, 1998). B, Temporal bisection task. One of six different time intervals was presented to the animal in each trial, and the animal had to navigate to either goal location (white circles) depending on the duration of the sample interval (short vs long). The arrows indicate photobeam sensors. Scale bar, 10 cm. C, The graphs show the fraction of long-target choices (Plong) as a function of sample interval duration. The solid lines were determined by logistic regression and the shading indicates 95% confidence interval. Error bars, SEM.
Animals in the second group (Experiment 2) were required to discriminate two different durations of time interval into short or long periods in a given block to obtain water reward on the same maze. The animals had to discriminate 2 versus 4 s sample intervals in the first block (60∼70 trials; mean ± SD, 67.5 ± 3.0), 4 versus 8 s in the second block (60∼70 trials, 67.2 ± 3.1), and then 2 versus 4 s again in the third block (55∼117 trials, 74.4 ± 16.1) without an intersession break. They experienced 15∼20 forced-choice trials that consisted of 2 and 4 s intervals before each recording session. The sequence of sample interval durations within each block was randomized. The animals were trained to perform this task for 30 d before and 17 d after electrode implantation, so that they were overtrained before unit recording. Although the animals quickly adapted to block changes within a few trials (1∼5 error trials before the first correct choice after block transition), the initial 10 trials of each block were excluded from the analysis.
Unit recording
Twelve tetrodes were chronically implanted in the left or right mPFC (2.7 mm anterior and 0.7 mm lateral to bregma) and unit signals were recorded from the dorsal anterior cingulate cortex (ACC), prelimbic cortex, and infralimbic cortex (Fig. 1A), while the animals were performing either temporal discrimination task. Unit signals were amplified 10,000×, filtered between 600 and 6000 Hz, digitized at 32 kHz, and stored on a personal computer using a Cheetah data acquisition system (Neuralynx). The animal's head position was monitored by tracking a set of light-emitting diodes mounted on the headstage at 60 Hz. When recordings were completed, small marking lesions were made by passing an electrolytic current (50 mA, 30 s, cathodal) through one channel of each tetrode and recording locations were verified histologically as previously described (Baeg et al., 2001).
Analysis
Choice behavior.
Animal's choice data in the first experiment (6-interval discrimination task) were averaged according to sample interval duration across all sessions for each animal and subject to the following logistic regression:
 |
where Plong is the proportion of long-target choice trials, T denotes the sample interval duration, and a and b are constants.
Unit classification.
Unit signals were isolated by manual cluster cutting of various spike waveform parameters using the MClust software (A.D. Redish) as previously described (Baeg et al., 2003). Recorded unit signals in all areas were classified into putative pyramidal cells and putative interneurons based on mean discharge rate and spike width (Fig. 2). Although both types of neurons were included in the analyses, essentially the same results were obtained when putative interneurons were excluded from the analysis (data not shown).
Figure 2.

Unit classification. Recorded units (n = 1693; 993 in Experiment 1 and 700 in Experiment 2) were classified into two groups based on mean discharge rate and spike width. Those neurons with mean firing rate <8.83 Hz and spike width >0.276 ms were classified as putative pyramidal cells (PC; n = 1372, 81.0%), and the rest were classified as putative interneurons (IntN; n = 321, 19.0%). The curves are Gaussian fits. Examples of averaged spike waveform for a putative pyramidal cell and a putative interneuron are shown on the right. Calibration: 0.5 ms, 0.1 mV.
Multiple linear regression.
Dependence of individual neuronal activity on time was examined in two different ways. First, each sample interval was divided into 10 equal-duration bins on a linear time scale and mean discharge rate of a neuron within each time bin was related to time since interval onset. This analysis was repeated for each interval duration separately (n = 6 for both Experiment 1 and 2). Second, mean discharge rate of a neuron during the last 500 ms of each sample interval was related to time since interval onset. For both analyses, to examine whether individual neuronal activity was better explained by the elapse of time on a linear or logarithmic time scale, neuronal activity was related to raw (to check linear time encoding) as well as log-transformed (to check logarithmic time encoding) time since interval onset. To factor out potential influences of confounding behavioral variables, the regression model included movement-related variables and the animal's previous goal choice as represented in Equation 1 as the follows: S = a0 + a1T + a2PC + a3X + a4Y + a5D + ε, where S indicates trial-by-trial spike discharge rate of one neuron within a specific time window (during the last 500 ms or 1 of 10 equal-duration bins of a sample interval); T represents raw or log-transformed time since the interval onset; X, Y, and D denote animal's mean lateral head position (X-position), mean vertical head position (Y-position), and overall movement (displacement), respectively, in the corresponding analysis time window; PC represents the animal's goal choice in the previous trial (dummy variable of −1 and 1 for the left and right goal choice, respectively); ε is the error term; and a0∼a5 are the regression coefficients.
Principal component analysis.
A mean spike density function was constructed for each neuron for each sample interval duration using all correct trials by applying a Gaussian kernel (σ = 100 ms) to each spike. For the neural data collected in Experiment 1, the six spike-density functions were aligned serially from the shortest to the longest. For those collected in Experiment 2, the six spike-density functions from the three blocks were aligned serially (Blocks 1, 2, and 3; shortest first in each block). They were converted to a perievent time histogram (PETH) in 50 ms time bins, and the mean and SD of firing rates were calculated across all bins. Then each bin's firing rate was normalized to unit variance by subtracting the mean and dividing with the SD, and principal component analysis (PCA) was applied to the matrix of PETHs for all analyzed neurons (rows, neurons; columns, normalized discharge rate during 50 ms time bins).
Decoding temporal information.
Temporal information transmitted by neural activity was assessed by examining (1) how well neural activity classified the length of sample intervals as either short or long (length classification) and (2) how well the neural activity kept track of the elapse of time (decoding elapsed time) using a linear discriminant analysis. For the former, neural activity during the last 500 ms of each sample interval was analyzed and, for the latter, each time interval was divided into 10 equal-duration bins (on a linear time scale; e.g., 478.4 ms each for the longest sample interval in Experiment 1) and the order of the middle eight bins was decoded based on neural activity within each bin. Decoding of temporal information was based on individual neuronal activity (single neuron decoding) as well as neuronal ensemble activity (population decoding). For the latter, temporal information was decoded based on simultaneously recorded as well as all recorded units that were pooled across sessions (with mean firing rate ≥1 Hz during sample interval presentation). For decoding elapsed time based on all recorded units, the number of correct trials was equalized across sessions according to the smallest number of correct trials per session for each interval duration (21∼44 trials in Experiment 1 and 20∼41 trials in Experiment 2). For length classification based on all recorded units, the number of correct trials was additionally equalized across sample interval durations (n = 21 and 20 trials in Experiment 1 and 2, respectively). For the comparison of correct and error trials based on all recorded units (Experiment 1 only; see Fig. 13), the numbers of correct as well as error trials were equalized across sessions.
Figure 13.

Comparison of neural activity during correct and error trials. The longest and shortest sample intervals were excluded from the analysis because of small numbers of error trials. A, Classification of sample intervals into short and long ones based on activity of all recorded units (n = 733) during correct (blue) and error (red) trials. Same format as in Figure 10C. The lines represent perfect (100% correct) classification. B, Decoding of elapsed time based on activity of all recorded units during correct (blue) and error (red) trials. Same format as in Figure 10G. C, Spike raster plots and spike density functions (σ = 100 ms) for correct (blue) and error (red) trials are shown for an example neuron.
A single trial was removed, and a linear discriminant function was generated based on the neural activity in the remaining correct trials separated according to the animal's goal choice (for length classification) or bin number (for decoding elapsed time). This procedure was repeated for all correct trials (and also error trials when comparing neural activity during correct and error trials) and the percentage of long-target choice (i.e., classification of a sample interval into a long duration, Plong; length classification) or decoding error (i.e., the distance between the actual and decoded bin numbers; decoding elapsed time) was calculated. Neural population decoding was based on the assumption of independence among neurons unless noted otherwise. Behavioral decoding was performed in the same manner except that a behavioral index (mean X-position, mean Y-position, and/or overall displacement) was used instead of neural data.
Neuron-dropping analysis.
To assess the relationship between the size of mPFC neuronal ensemble and the amount of temporal information, the number of neurons in the ensemble was systematically reduced (Wessberg et al., 2000). The same decoding analyses were repeated 100 times after randomly dropping a given number of neurons from the original ensemble, and mean correct classification of interval durations (percentage correct; length classification) or mean decoding error (the distance between the actual and predicted bins; decoding elapsed time) was calculated for each step of neuron dropping.
Mahalanobis distance.
Mahalanobis distance of neuronal ensemble activity between two adjacent bins was calculated according to the following equations:
 |
 |
 |
where N is the total number of trials, xi and yi are firing vectors of N neurons in two adjacent bins in trial i, and ∑ is the covariance matrix of x and y.
Statistical tests
Student's t tests were used to test statistical significance of mean decoding error and regression coefficients. Binomial tests were used to test significance of the fraction of correct neural classification and the number of neurons that significantly modulated their activity according to linear or logarithmic passage of time. χ2 tests were used to test whether numbers of neurons whose activity were preferentially explained by logarithmic versus linear passage of time significantly deviated from an even distribution. A p value <0.05 was used as the criterion for a significant statistical difference. Data are expressed as mean ± SEM unless noted otherwise.
Results
Behavioral performance
In Experiment 1, the probability for the animal to choose the long target (Plong) increased as a function of the sample interval duration, which was well accounted for by a logistic regression model (R2 = 0.963 ± 0.005; Fig. 1C). The animals chose the correct target in 80.0 ± 0.0% of trials.
Activity profiles of individual neurons
A total of 993 well isolated single units were recorded in Experiment 1 and the majority were putative pyramidal cells (n = 791, 79.7%; Fig. 2). Of these, only those units with mean firing rate ≥1 Hz during sample interval presentation (n = 733, 555 putative pyramidal cells and 178 putative interneurons) were subject to analysis, and only correct trials were included in the analysis unless noted otherwise. Diverse types of neuronal activity profiles were observed during sample interval presentation in Experiment 1 (Fig. 3). Of these, the most abundant type was a monotonically changing activity profile (“ramping activity”) (Fuster, 1997; Durstewitz and Seamans, 2006); many neurons gradually increased or decreased their activity over time. Also, for the majority of ramping activity neurons, the rate of activity change became progressively smaller over time (Figs. 3–5). These observations raise the possibility that the mPFC might convey temporal information based on monotonically changing activity profiles over time with negative accelerations, which would be better explained by logarithmic than by linear functions. To test this possibility, we compared how well linear versus logarithmic passage of time explains activity of individual mPFC neurons. For each neuron (n = 733) and each interval duration (n = 6), we divided sample intervals into 10 equal-duration bins and examined dependence of trial-by-trial neuronal activity within each time bin on linear or log-transformed time using a linear regression model. We included the animal's mean X-position, mean Y-position, and total displacement during each time bin, along with the animal's previous goal choice, as confounding variables in the regression model (Eq. 1) because the animals made different degrees of head movement during sample intervals (Figs. 4, 5) that might affect neuronal activity (Euston and McNaughton, 2006; Cowen and McNaughton, 2007). Indeed, time-dependent neural activity was often confounded with movement-related neural activity (Fig. 4), although time-dependent neural activity was apparent with minimal movement variations over time in some sessions (Fig. 5).
Figure 3.

Examples of individual neuronal activity. A–H, Spike raster plots and spike density functions (σ = 100 ms) are shown for example mPFC neurons (Experiment 1). Trials were grouped according to the length of sample interval and the abscissa denotes time since the onset of each sample interval. Gray vertical lines denote the onset and offset of each time interval. As shown, diverse types of neuronal activity were observed during sample interval presentation. The first four (A–D) are examples of ramping activity neurons.
Figure 4.

Examples of neuronal activity correlated with the elapse of time, the animal's movement, or both. Shown are three example neurons that were recorded simultaneously. Same format as in Figure 3 except that time courses of movement variables (X-position, Y-position, and displacement) are also shown. A, Time courses of behavioral variables (gray, trial-by-trial data; black, their mean across trials). B–D, Neuronal activity correlated with the animal's X-position (B), the elapse of time (C), or both (D).
Figure 5.

Examples of neuronal activity correlated with the elapse of time with minimal behavioral variations over time. Shown are two example neurons that were simultaneously recorded in a behavioral session with small behavioral variations over time. Same format as in Figure 4. A, Time courses of behavioral variables. B, C, Neurons that gradually decreased (B) or increased (C) their activity over time.
During the longest sample interval (4784 ms), there were 399 and 380 (out of 733; 54.4 and 51.8%, respectively) mPFC neurons whose activity profiles were significantly correlated with linear and logarithmic passage of time, respectively (354 were significantly correlated with both), which were significantly above chance level (binomial test, p < 10−20 for both comparisons). Activity profiles of 269 (36.7%), 265 (36.2%), and 237 (32.3%) neurons were significantly correlated with the animal's mean X-position, mean Y-position, and total displacement, respectively during the longest sample interval, and, of these, 172, 181, and 143 were additionally correlated with the linear or logarithmic passage of time. Thus, mPFC neural activity was influenced by both the elapse of time and the animal's movement during sample intervals. Of all neurons whose activity profiles were significantly correlated with linear or logarithmic passage of time during the longest sample interval (n = 425), 242 (56.9%) and 183 (43.1%) were activity-increasing and activity-decreasing types, respectively, which deviated significantly from an equal distribution (χ2 test, p = 0.004). Of these 425 neurons, activity profiles of 235 (55%) and 190 (45%) neurons were better explained (in terms of R2) by logarithmic and linear passage of time, respectively, which deviated significantly from an equal distribution (χ2 test, p = 0.029). Also, R2 values of all analyzed neurons (n = 733) determined with the logarithmic model were significantly larger than those determined with the linear model (0.120 ± 0.005 vs 0.118 ± 0.005, respectively; paired t test, p < 0.001). Similar results were obtained for all other sample durations (Tables 1, 2).
Table 1.
Comparison of R2 values for linear and logarithmic functions (Experiment 1)a
| Interval duration | 3018 ms | 3310 ms | 3629 ms | 3979 ms | 4363 ms | 4784 ms |
|---|---|---|---|---|---|---|
| R2 of linear function | 0.099 ± 0.004 | 0.105 ± 0.004 | 0.114 ± 0.004 | 0.117 ± 0.004 | 0.116 ± 0.005 | 0.118 ± 0.005 |
| R2 of log function | 0.102 ± 0.004 | 0.108 ± 0.004 | 0.117 ± 0.004 | 0.120 ± 0.005 | 0.119 ± 0.005 | 0.120 ± 0.005 |
| p value (t test) | <10−7 | <10−5 | <10−5 | <0.001 | <10−4 | <0.001 |
aR2 values of all analyzed neurons (n = 733) were compared for the regression models containing linear versus log-transformed time (Eq. 1) for each sample interval duration (mean ± SEM). R2 values were significantly larger for the model containing log-transformed time for all interval durations (paired t test).
Table 2.
Numbers of neurons whose activity profiles were preferentially explained by linear versus logarithmic functions (Experiment 1)a
| Interval duration | 3018 ms | 3310 ms | 3629 ms | 3979 ms | 4363 ms | 4784 ms |
|---|---|---|---|---|---|---|
| Number of neurons significantly modulating their activity according to linear and/or log time | 352 | 375 | 338 | 358 | 411 | 425 |
| Number (percentage) of neurons with higher R2 values for linear functions | 138 (39%) | 160 (43%) | 131 (39%) | 157 (44%) | 179 (44%) | 190 (45%) |
| Number (percentage) of neurons with higher R2 values for logarithmic functions | 214 (61%) | 215 (57%) | 207 (61%) | 201 (56%) | 232 (56%) | 235 (55%) |
| p value (χ2 test) | <10−4 | 0.005 | <10−4 | 0.020 | 0.009 | 0.029 |
aFor each sample interval duration, of those neurons whose activity profiles were significantly correlated with linear or logarithmic passage of time, the numbers of neurons whose activity profiles were better explained by linear versus logarithmic passage of time were compared (Eq. 1). The number of neurons whose activity profiles were better explained by the logarithmic model was significantly larger than that whose activity profiles were better explained by the linear model for each sample interval duration (χ2 test).
We also applied the multiple linear regression analysis (Eq. 1) to individual neural activity during the last 500 ms of all six sample intervals and examined its dependence on linear or log-transformed sample interval duration. Activity profiles of 187 and 187 mPFC neurons were significantly correlated with linearly and logarithmically coded sample interval duration, respectively (185 were significantly correlated with both), which were significantly above chance level (binomial test, p < 10−20 for both comparisons). Of all neurons whose activity profiles were significantly correlated with linear or logarithmic passage of time (n = 189), there were more activity-increasing (n = 109, 57.7%) than activity-decreasing neurons (n = 80, 42.3%; χ2 test, p = 0.035). Of these 189 neurons, the majority preferentially modulated their activity according to logarithmically than linearly coded sample duration (118 and 71, respectively; χ2 test, p < 0.001). In addition, R2 values of all neurons (n = 733) for the logarithmic model (0.0962 ± 0.0034) were significantly larger than those for the linear model (0.0960 ± 0.0034; paired t test, p < 0.001).
If the mPFC relies on ramping activity in conveying temporal information, then the ramping activity neurons should convey higher temporal information than the remaining neurons. To test this, we separated for each sample interval duration all analyzed neurons in Experiment 1 (n = 733) whose activity profiles were significantly correlated with logarithmic passage of time, from those whose activity profiles were not significantly correlated with logarithmic passage of time (Table 1). Temporal information of individual neural activity was quantified based on how well individual neuronal activity classified the length of sample intervals (length classification) as well as kept track of the elapse of time (decoding elapsed time; see Materials and Methods). For the longest sample interval, as expected, the ramping activity neurons conveyed higher amounts of temporal information than the other group (length classification, 55.2 ± 0.5 vs 52.7 ± 0.6% correct classification; t test, p < 0.001; decoding elapsed time for the longest interval, 1.97 ± 0.03 vs 2.34 ± 0.03 bins of decoding error; p < 10−15). Also, there was a significant correlation between the amount of temporal information transmitted by individual neurons and the degree to which an individual activity profile was explained by a logarithmic function (i.e., R2 value of the logarithmic model; Fig. 6). Similar results were obtained for all other sample durations (data not shown).
Figure 6.

Relationship between temporal information and logarithmic activity profile. A, B, There was a significant correlation between temporal information (A, percentage correct classification; B, mean decoding error) conveyed by an individual neuron and the extent to which a logarithmic function can explain a neuronal activity profile (R2 value; Eq. 1 with log-transformed time used as a regressor). Shown are the results for the longest sample interval in Experiment 1 (4784 ms).
Principal component analysis
The above results suggest that gradually changing neuronal activity with negative acceleration is a major activity pattern in the mPFC during sample interval presentation and that such activity pattern conveys a relatively large amount of temporal information. To test this further, we characterized activity profiles of mPFC neurons during sample intervals using a PCA (Narayanan and Laubach, 2009; Machens et al., 2010). The first principal component (PC1) was a monotonically, yet nonlinearly increasing function for each sample interval duration; the rate of change became progressively smaller (Fig. 7A). When PC1 was plotted on a logarithmic time scale, it increased linearly during the time period between ∼300 ms following the onset of each sample interval and its offset (Fig. 7B). Also, PC1 conveyed a relatively large amount of temporal information compared with other principal components (Fig. 7C), and the absolute PC1 loading value was significantly correlated with the amount of temporal information each neuron conveyed [correlation with percentage correct classification (length classification), r = 0.116; p = 0.002; correlation with decoding error (decoding elapsed time), r = −0.127, p < 0.001]. These results further support the conclusion that the mPFC conveyed temporal information largely based on linearly changing neuronal activity on a logarithmic time scale.
Figure 7.
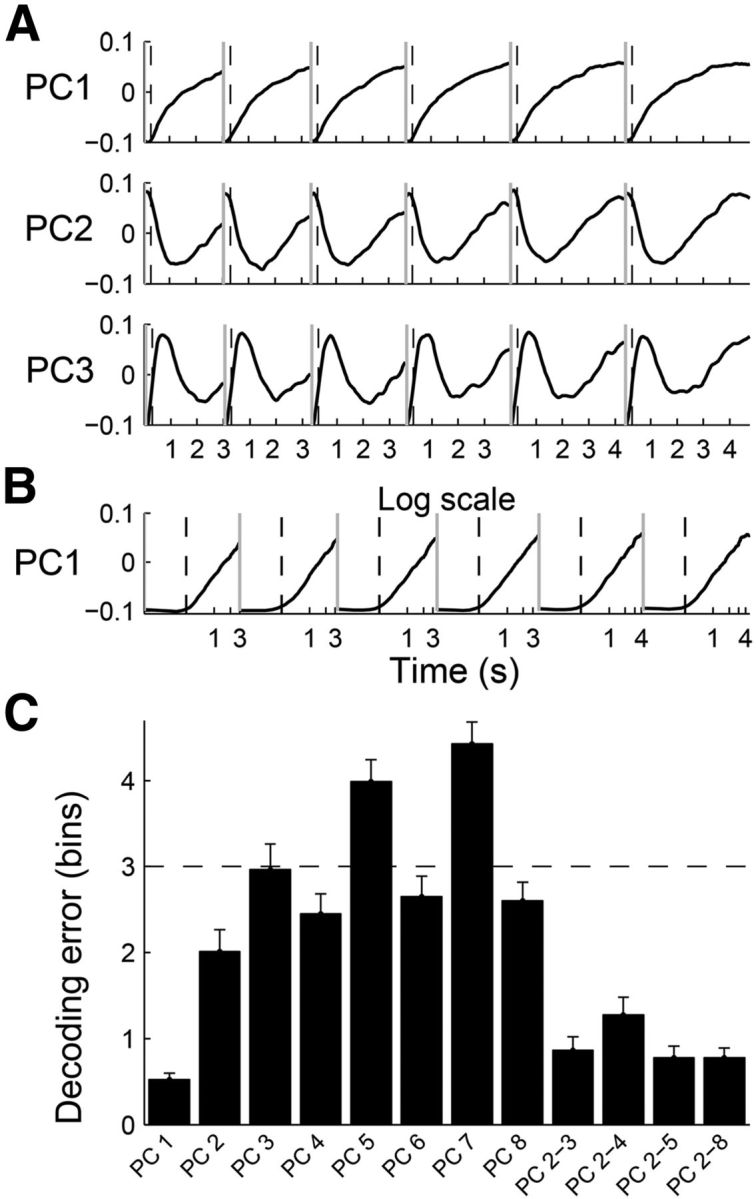
Results of PCA. A, Eigenvectors are shown for the first three principal components relative to the time of sample interval onset. They accounted for 30.9, 10.4, and 6.3% of total variance in neuronal activity, respectively. B, The eigenvector for PC1 was plotted on a logarithmic scale. The gray vertical lines indicate the onset of a time interval and the dashed vertical lines mark 300 ms following a time-interval onset. C, Mean error in the prediction of elapsed time based on individual PCs (PC1∼PC8, which explained >80% of total variance in neural activity) as well as their linear combinations are shown together. Shown are the results obtained from the analysis of the longest sample interval in Experiment 1 (4784 ms). Error bars, SEM.
Figure 8A shows normalized activity profiles of all analyzed neurons (n = 733) during correct trials that were arranged according to their PC1 loading values. As shown, those neurons with high absolute values of PC1 loading showed monotonically changing activity profiles during each sample interval. When the neurons were divided into quintiles according to their PC1 loading values, those with large positive (or negative) values showed monotonically increasing (or decreasing) activity profiles with the rate of change becoming progressively smaller (Fig. 8B).
Figure 8.

Activity profiles of individual mPFC neurons. A, Temporal profiles of normalized activity (z-score) are shown for all analyzed neurons (n = 733) for each sample interval duration (from left to right, short to long) that were sorted according to PC1 loading value. Red and blue indicate neural activity above and below zero mean, respectively. B, All neurons were grouped into quintiles according to their PC1 loading values and their mean normalized activity (z-score, left) and SD (right) are shown for all six interval durations in 50 ms time bins. The bottom panels in B show mean normalized activity and mean SD for all neurons. The abscissa denotes time since the onset of each sample interval.
Precision of temporal discrimination as a function of time
To further test linear versus logarithmic encoding of time, we examined the relationship between the precision of temporal discrimination and the elapse of time. For this, we divided each sample interval into 10 equal-duration bins and calculated Mahalanobis distance (MacDonald et al., 2011) between two adjacent bins based on neuronal ensemble activity (n = 733 neurons). As shown in Figure 9A, Mahalanobis distance decreased gradually over time. A linear regression analysis indicated that the slopes of all six curves were significantly different from 0 (p < 0.015 for all curves).
Figure 9.

Precision of temporal discrimination as a function of time. A, Mahalanobis distance was assessed between two adjacent bins (9 pairs total for each sample interval). B, Same as A except that simulated neural data obtained from linearly (red) or logarithmically (black) changing functions were analyzed for the longest sample interval (4784 ms). The error bars (SEM) are too small to see.
The above results can be accounted for by logarithmic encoding of time with constant variability as well as linear encoding time with gradually increasing variability. Variability of individual neuronal activity changed over time approximately in proportion to mean neuronal activity (r = 0.90 ± 0.06; the longest sample interval was divided into 10 equal-duration bins and correlation between mean discharge rate and SD was calculated for each neuron). Because there were both activity-increasing and activity-decreasing neurons, the mean variability stayed more or less similar over time (Fig. 8B). Thus, the latter is an unlikely possibility. Nevertheless, to discriminate between these two possibilities more precisely, we assessed Mahalanobis distance between two adjacent time bins of linear and logarithmic functions that were simulated based on the variability of the original neural data. For each neuron (n = 733), linear and logarithmic functions were separately determined for the longest sample interval (4784 ms) based on a maximum likelihood procedure (Eq. 1) and, for each function, trial-by-trial neural activity was generated 200 times by a Gaussian random number generator based on mean firing rate of the simulated function and SD of the original neural data at 50 ms time resolution. Then 100 neurons were randomly selected for the analysis of Mahalanobis distance between adjacent 10 equal-duration bins, which was repeated 100 times. Mahalanobis distance decreased gradually over time for the simulated logarithmic functions, but not for the simulated linear functions (Fig. 9B). A linear regression analysis showed that the slope of the curve was significantly different from 0 for the simulated logarithmic functions (p = 0.002), but not for the simulated linear functions (p = 0.149).
Temporal information of mPFC neuronal ensemble
We then quantified the amount of temporal information conveyed by mPFC neuronal population (Experiment 1). We first examined how well neuronal ensemble activity during the last 500 ms of each sample interval classified a given sample interval as short or long (length classification). Simultaneously recorded mPFC neuronal ensembles (5∼32 units per session; mean ± SD, 14.9 ± 4.7) classified sample intervals significantly better than chance level (mean ± SEM, 65.6 ± 0.7% correct classification; paired t test, p < 10−20; Fig. 10A,B). Performance was somewhat lower when full covariance among neural activity was considered (61.9 ± 0.8% correct classification; comparison with length classification with the assumption of independence among neurons, paired t test, p < 10−7), suggesting that correlated mPFC neuronal activity at the time resolution of 500 ms conveyed redundant temporal information. Length classification based on all recorded units across sessions (n = 733 neurons) assuming independence among neurons was nearly perfect (99.0% correct; significantly above chance level; binomial test, p < 10−20; Fig. 10C,D).
Figure 10.

mPFC neuronal ensemble conveys temporal information. A–D, Classification of sample intervals into short and long intervals based on simultaneously (A, B) or all (C, D) recorded units. A, Gray, Probability to classify sample intervals into long ones as a function of sample interval duration in one session. Black, Their mean and SEM across sessions. B, Results of a neuron-dropping analysis for A, showing the relationship between the size of neuronal ensemble and the fraction of correct decoding (Pcorrect). C, Gray, Results of trial-by-trial classification (0, short interval; 1, long interval). Black, Their mean and SEM. D, Results of a neuron-dropping analysis for C. E–H, Neural decoding of elapsed time. The longest sample interval (4784 ms) was divided into 10 equal-duration bins, and the order of the middle eight bins was decoded based on the activity of simultaneously (E, F) or all (G, H) recorded units within each bin. E, Gray, Mean decoded bin number for each bin for one session. Black, Their mean and SEM across sessions. F, Results of a neuron-dropping analysis for E, showing the relationship between the size of neuronal ensemble and mean decoding error (mean distance between the actual and predicted bins). The horizontal dashed line denotes the chance level. G, Gray, Trial-by-trial decoding results for each bin. Black, their mean and SEM across trials. H, Results of a neuron-dropping analysis for G. Error bars are too small to see in A, C, E, and G. Decoding results based on a single session (24∼35 units) are not shown in B and F.
Second, we examined how well the mPFC neuronal ensemble kept track of the elapse of time (decoding elapsed time; each interval was divided into 10 equal-duration bins). The mean error in the prediction of elapsed time based on simultaneously recorded units was 0.94 ± 0.04 (mean ± SEM) bins for the longest sample interval (4784 ms), which was well below chance level (3 bins; paired t test, p < 10−20; Fig. 10E,F). Again, the performance was somewhat lower when full covariance among neural activity was considered (decoding error, 1.15 ± 0.04 bins; paired t test, p < 10−14). When all recorded units (n = 733) were used for decoding elapsed time assuming independence among neurons, the mean error was only 0.70 ± 0.04 bin for the longest sample interval (4784 ms), which was well below chance level (paired t test, p < 10−20; Fig. 10G,H). Similar results were obtained for all other sample durations (data not shown). Neuron-dropping analyses revealed that >100 neurons were needed for asymptotic performance of neural decoding (Fig. 10D,H), which is in contrast to the finding that only a few mPFC neurons are sufficient for near-maximal decoding of rat's binary choices in a working memory task (Baeg et al., 2003). These results suggest that many more neurons are required to accurately keep track of elapsed time in the range of a few seconds compared with representing the animal's choice in a simple binary-choice task.
To examine the possibility that temporal information conveyed by mPFC neural activity was because of variations in the animal's ongoing behavior during sample interval presentation, performance of neural decoding was compared after dividing the behavioral sessions into quintiles according to the amount of temporal information conveyed by each or the whole set of three behavioral variables (X-position, Y-position, and displacement). The pattern of sample interval classification (short vs long) based on neuronal ensemble activity was similar across the quintiles of behavioral variations (percentage correct classification of sample intervals based on behavioral data; Fig. 11A) so that there was no significant variation in the percentage of correct neural classification across the quintiles (1-way ANOVA, X-position, p = 0.459; Y-position, p = 0.454; displacement, p = 0.178; all variables, p = 0.244; Fig. 11B). Likewise, the pattern of decoding elapsed time based on neuronal ensemble activity was similar across the quintiles of behavioral variations (the accuracy in predicting elapsed time based on behavioral data; Fig. 11C) so that there was no significant variation in mean neural decoding error across the quintiles (longest sample interval, 1-way ANOVA, X-position, p = 0.509; Y-position, p = 0.188; displacement, p = 0.269; all variables, p = 0.860, respectively; Fig. 11D). Similar results were obtained for all other durations of sample intervals (data not shown). These results indicate that temporal information conveyed by mPFC neural activity was not because of variations in the animal's ongoing behavior during sample interval presentation.
Figure 11.

Neural coding of temporal information for different levels of behavioral variation. To test whether temporal information conveyed by mPFC neural activity was because of variations in the animal's ongoing behavior during sample intervals, performance of neural decoding was compared after dividing the behavioral sessions into quintiles according to the amount of temporal information (A, B, length classification; C, D, decoding elapsed time) conveyed by each or the whole set of three behavioral variables (X-position, Y-position, and displacement). Red, Results of neural decoding. Blue, Results of behavioral decoding. A, Probability of long classification (Plong) as a function of sample interval duration. B, Mean correct classifications (Pcorrect) as a function of behavioral variations. C, Decoded bin number versus actual bin number. The longest sample interval (4784 ms) was divided into 10 equal-duration bins and the order of the middle eight bins was decoded. D, Accuracy in decoding elapsed time (mean encoding error) as a function of behavioral variations. The error bars (SEM) are too small to see.
To test whether mPFC neurons conveyed information on sample interval duration after its offset, we applied a multiple linear regression analysis (Eq. 1) to individual neural activity around the offset of sample intervals. We first determined the duration of the time period between the sample interval offset and the animal's choice of action (i.e., beginning of the leftward or rightward movement) for each session as in our previous studies (Kim et al., 2009a; Sul et al., 2010). The average duration of this time period was 316 ± 98 ms. Based on this value, we determined fractions of neurons that significantly modulated their activity according to log-transformed sample interval duration during a 300 ms time window that was advanced in 100 ms time steps. Of 733 mPFC neurons, those with mean firing rates ≥1 Hz during 1150 ms time period following the sample interval offset were included in this analysis (n = 640 neurons). As shown in Figure 12, significant fractions conveyed information on sample interval duration after sample interval offset.
Figure 12.
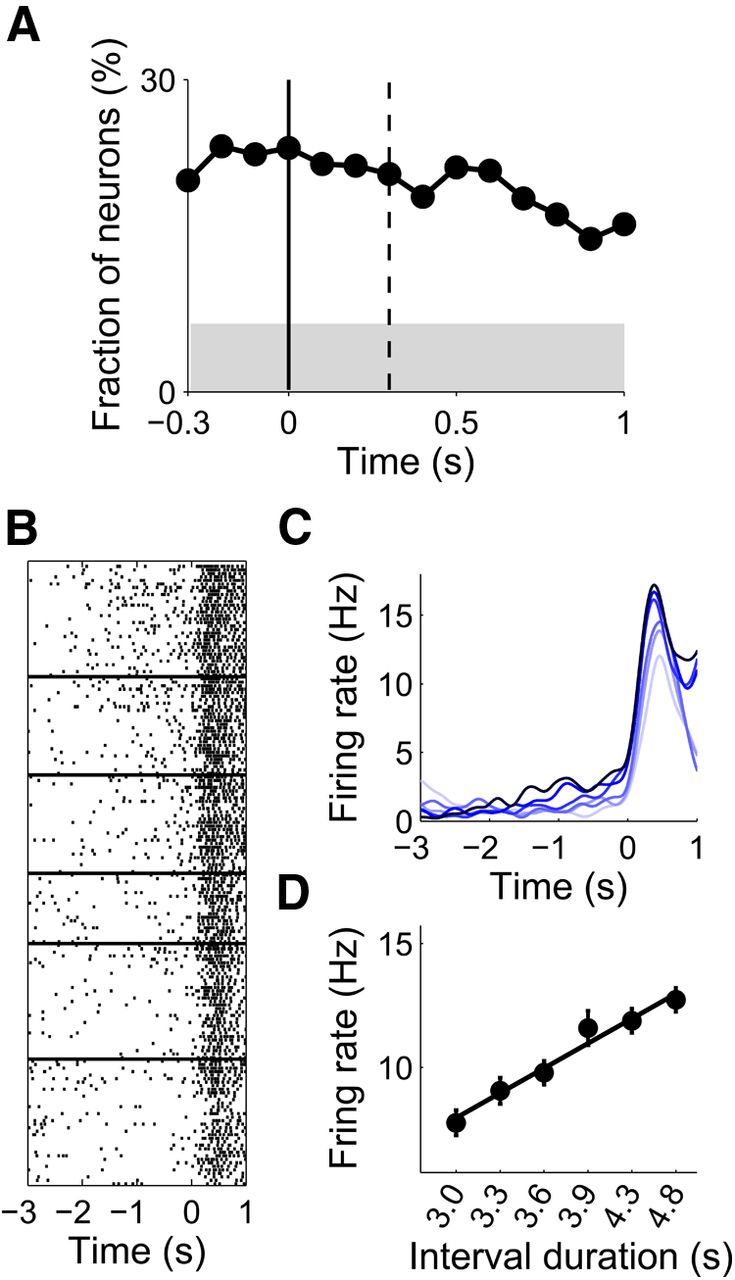
Temporal information after sample interval offset. A, The graph shows the fraction of neurons that significantly modulated their activity according to sample interval duration during a 300 ms time window that was advanced in 100 ms time steps. Time 0 indicates the offset of each sample interval, and the vertical dashed line denotes the mean latency for the first behavioral manifestation of the animal's goal choice. The shading indicates the minimum fraction significantly above chance level (binomial test, p < 0.05). B, C, A spike raster plot (correct trials only) and spike density functions (σ = 100 ms; darker tone, longer duration) of an example neuron that modulated its activity according to sample interval duration after its offset. Trials were grouped according to sample interval duration, and aligned to the offset of each sample interval. D, Mean firing rate of the example neuron between 0 and 1 s time period after sample interval offset as a function of sample interval duration. The abscissa is in logarithmic scale. The line was determined by linear regression (R2 = 0.971).
Timing-related neural activity has been found in many different areas of the brain, which is consistent with the view that the brain is equipped with multiple intrinsic clocks rather than a central dedicated clock (Mauk and Buonomano, 2004; Ivry and Schlerf, 2008). Therefore, simply finding neural activity conveying temporal information does not tell us much about neural processes controlling interval-timing behavior. For this, one needs to go one step further to show neural activity that is tightly correlated with animal's interval-timing behavior. If the mPFC plays an important role in interval-timing behavior, as suggested by our previous inactivation study (Kim et al., 2009b), then mPFC neural activity is expected to be correlated with the animal's interval-timing behavior. We tested this prediction by comparing performances of neuronal ensemble activity (n = 733) during correct and error trials in classifying sample intervals into short or long periods. The longest and shortest time intervals were excluded from this analysis because of low error rates (from short to long durations, 6.4 ± 0.6, 17.1 ± 0.7, 36.0 ± 1.1, 35.3 ± 1.3, 17.1 ± 0.9, and 7.8 ± 0.7% per session, respectively), and the discriminant function was generated using only correct trials (i.e., neural activity in each trial was compared with averaged neural activity in the remaining correct trials). As expected, opposite patterns of neural decoding were observed for correct and error trials (Fig. 13A), indicating that mPFC neural activity was tightly correlated with the animal's choice of target. We also compared decoding of the elapse of time based on neural activity during correct and error trials. As expected, error-trial neural decoding tended to underestimate elapsed time when the correct choice was the long target and, conversely, overestimate elapsed time when the correct choice was the short target (Fig. 13B,C).
Temporal discrimination with variable temporal ranges
Many mPFC neurons monotonically changed their activity during entire sample interval durations (up to 4784 ms) in Experiment 1, suggesting that they are not likely to represent simple sensory-related or motor preparation-related responses. Nevertheless, we cannot rule out the possibility that seemingly timing-related neural activity might actually represent sensory-related or motor preparation-related neural activity. To further investigate this matter, we examined mPFC neuronal activity in a separate group of rats (n = 3) performing a time-interval discrimination task that consisted of multiple blocks of trials with the length of time intervals varied up to 8 s (Experiment 2). The animals had to discriminate 2 versus 4 s intervals in the first block, 4 versus 8 s intervals in the second block, and then 2 versus 4 s intervals again in the third block. If neural activity during the 4 s time interval changes according to the range of time interval discrimination, it would be difficult to explain the result in terms of a timing-independent neural process (such as a simple sensory response).
The animals chose the short or long target correctly in 92.1 ± 0.8% of trials per session in the first block, 90.5 ± 0.6% in the second block, and 86.9 ± 0.9% in the third block. Thus, the animals well discriminated a given time interval (4 s) as either short or long according to the behavioral context. A total of 700 units were recorded in Experiment 2 (putative pyramidal cells, n = 581, 83.0%). Only those units with mean firing rate ≥1 Hz during sample interval presentation (n = 372, 282 putative pyramidal cells and 90 putative interneurons) were subject to analysis and only correct trials were included in the analysis of neural data. The mPFC neuronal ensemble conveyed a significant amount of temporal information (Fig. 14A–D) and the precision of temporal discrimination was lowered as a function of time (Fig. 14E–F) without a parallel increase in neuronal variability (Fig. 14G), which is more consistent with logarithmic than linear representation of time as in Experiment 1.
Figure 14.

Neural decoding of temporal information in Experiment 2. A, Classification of sample intervals into short and long periods based on activity of all recorded units (n = 372) in Blocks 1, 2, and 3 (B1, B2, and B3, respectively). Same format as in Figure 10C. B, Results of a neuron-dropping analysis for A. C, Neural decoding of elapsed time. The 8 s time interval in the second block was divided into 10 equal-duration bins and the order of the middle eight bins was decoded based on activity of all recorded units within each bin. Same format as in Figure 10G. D, Results of a neuron-dropping analysis for C. E, Precision of temporal discrimination as a function of elapsed time. Each sample interval was divided into 10 equal-duration bins and Mahalanobis distance was calculated for each pair of adjacent bins. The slopes are significantly different from 0 for all curves (p < 0.040). F, Mahalanobis distance for the simulated neural data obtained from linearly (red) or logarithmically (black) changing functions during the longest sample interval (8 s). The slope is significantly different from 0 for the logarithmic (p = 0.003), but not for linear function (p = 0.433). The error bars (SEM) are too small to see. Same analysis procedure and same format as in Figure 9. G, All neurons were grouped into quintiles according to their PC1 loading values and their mean normalized activity (z-score, left) and SD (right) are shown for all six interval durations in 50 ms time bins. The bottom panels show mean normalized activity and mean SD for all neurons. Same format as in Figure 8B.
Neuronal activity profile during the 4 s interval changed across the first and second blocks (Fig. 15A–C). PC1 during the 4 s interval in the first block was more similar to PC1 during the entire 8 s interval in the second block that was normalized in the time domain (cumulative difference based on root mean square values at 50 ms time resolution, 0.009) than PC1 during the 4 s interval in the second block (cumulative difference, 0.030; first 0.5 s of each trace was deleted to avoid effects of transient sensory responses; Fig. 15C). Thus, mPFC neurons tended to stretch their activity profiles in the time domain in proportion to the range of time interval discrimination. Unexpectedly, the magnitude of PC1 in the third block was smaller compared with PC1 in the first block (Fig. 15B,C), which could not be explained by gradual time-dependent changes in neural activity (Fig. 16). There was a significant positive correlation between the difference in behavioral performance and the difference in neural response across the first and third blocks (Fig. 15D), suggesting a potential influence of a global modulating factor (such as motivation level) on overall timing-dependent neural activity during the third block. Nevertheless, when the response magnitude was normalized across blocks, PC1 during the 4 s interval in the third block was more similar to that in the first than the second block (Fig. 15E). These results indicate that mPFC neurons tended to change their temporal activity profiles according to the range of time-interval discrimination, arguing against the possibility that timing-related mPFC neural activity merely reflected simple sensory-related or motor preparation-related neural activity.
Figure 15.

Neural activity during temporal discrimination with variable time ranges (Experiment 2). A, PC1 of neural activity during three blocks of trials. PC1 accounted for 21.2% of total variance in neural activity. The abscissa denotes time since the onset of each sample interval. B, PC1 for neural activity during the 4 s interval in each block (B1, Block 1; B2, Block 2; B3, Block 3) and PC1 for neural activity during the 8 s interval in the second block were compared. C, Same plot as in B except that the abscissa denotes normalized time [t/T, where T denotes the time range excluding the first 0.5 s (3.5 or 7.5 s)]. D, Relationship between behavioral performance and neural response. The abscissa indicates the difference in the fraction of correct choices (ΔPcorrect) and the ordinate indicates the difference in neural response (cumulative difference in neural activity during the 4 s interval) between the first and third blocks. The line was determined by linear regression (slope = 0.325, p = 0.014). E, Comparison of normalized PC1. PC1s for neural activity during the 4 s interval in Blocks 1 (B1), 2 (B2), and 3 (B3) were compared after normalizing baseline and response magnitude [normalized PC1 = (PC1 − B)/(E − B), where E and B denote the mean PC1 values during the last and initial 300 ms of the 4 s interval, respectively]. Numbers indicate cumulative differences (sum of root mean square values at 50 ms time resolution) between B1 and B2 (B1 − B2), B1 and B3 (B1 − B3), and B2 and B3 (B2 − B3) traces.
Figure 16.

Stability of neuronal activity in Experiment 2. A, An example of recorded unit signals during the first (left) and last (right) 5 min of a session. Each unit cluster is indicated in different color. Horizontal and vertical axes indicate the energy of spike signals recorded through channels 3 and 4 of a tetrode, respectively. Averaged spike waveforms recorded through four tetrode channels are shown below for each cluster in corresponding colors. Calibration: 1 ms, 0.1 mV. Only those unit clusters that were stably maintained throughout the entire recording session as shown in the example were included in the analysis. B, Stability of mean firing rates across blocks. Mean normalized firing rates (mean firing rate in each block was divided by overall mean firing rate for each neuron) across Blocks 1, 2, and 3 are shown. There was no significant variation across blocks (1-way ANOVA, p = 0.305). Error bars, SD. C, Index of firing rate change [|X − Y|/(X + Y) where X and Y are mean firing rates of a neuron during different epochs] between the first and second halves of Block 1 (B1 − B1′), between the second half of Block 1 and the first half of Block 2 (B1′ − B2), between the first and second halves of Block 2 (B2 − B2′), between the second half of Block 2 and the first half of Block 3 (B2′ − B3), and between the first and second halves of Block 3 (B3 − B3′). Particularly large changes in mean firing rate were not observed across Blocks 2 and 3. Error bars, SD. D, Stability of neural responses within each block. Neural activity during 4 s time interval in each block was analyzed. Each block was divided into four equal-trial epochs and PC1s for all four epochs were plotted together. E, F, The neurons were grouped into quintiles according to their PC1 loading values and mean normalized activity was plotted for each epoch as in D for the first (E) and last (F) quintiles of neurons.
Discussion
We examined neuronal activity in the mPFC while rats were performing a temporal discrimination task, and obtained two major findings. First, mPFC neuronal population conveyed precise information about the elapse of time, which suggests a clock function of the mPFC. Second, mPFC neurons tended to convey temporal information based on linearly changing activity on a logarithmic time scale, which provides evidence for logarithmic representation of time in the brain.
Role of PFC in interval timing
It is well established that the PFC is crucially involved in time-interval discrimination in humans (Mangels et al., 1998; Koch et al., 2003; Jones et al., 2004) and animals (Glickstein et al., 1964; Rosenkilde and Divac, 1976; Dietrich et al., 1997; Dietrich and Allen, 1998; Onoe et al., 2001; Kim et al., 2009b). However, the exact role of the PFC in interval timing behavior has not been clear. It has been suggested that estimation of a time interval (clock), its storage and retrieval (memory), and comparison with a newly estimated time interval (comparison/decision) are three basic processes for all internal clock models (Wearden, 1999). The PFC might be in charge of one or more of these steps. Alternatively, the intact PFC might be needed for interval-timing behavior because of its general executive functions (Mangels et al., 1998; Tregellas et al., 2006; Livesey et al., 2007; such as attentional control). If PFC neurons are found to convey information about time intervals only after their offsets, but not during their presentation, for example, this would be an indication that the PFC is involved in the memory or comparison/decision stage rather than the clock stage.
In a study that employed a fixed interval procedure with two different interval durations, some neurons in the rat ACC modulated their activity according to the interval duration (Matell et al., 2003). For a physiological study, a fixed or peak interval procedure suffers from confounding of timing with motor activity, because animals emit motor responses that vary with the elapse of time. Thus, it is difficult to isolate clock function-related neural activity from motor response-related neural activity using this procedure. For this reason, the previous study (Matell et al., 2003) focused on those neurons that showed differential activity between the short and long interval durations (i.e., duration-coding neurons). In our task, by contrast, timing-related neural activity was not strongly confounded with motor responses, because the animals initiated navigation only after a time-interval offset. By carefully analyzing potential influence of uncontrolled behavioral variations on neural activity, we were able to show that mPFC neurons conveyed precise information on the elapse of time that cannot be explained by behavioral variations during sample intervals. Another potential confounding variable in our task was the animal's internal decision. However, mPFC neurons conveyed information on elapsed time for all interval durations, including the shortest (i.e., well before the animal switched its decision into the long target), thus timing-related mPFC neural activity cannot be explained by the animal's internal decision. Together, our results provide compelling evidence that the mPFC conveyed significant information on elapsed time throughout the sample interval presentation. This finding is consistent with the possibility that the mPFC is part of an internal clock, although we cannot rule out the possibility that timing-related mPFC neural activity was driven by neural activity in another upstream brain structure.
Previous physiological studies have found neuronal activity that might be related to the storage and comparison processes in the PFC. Some neurons in the rat ACC showed different activity between two different interval durations (Matell et al., 2003). Also, when monkeys were required to discriminate durations of two successfully presented stimuli, some PFC neurons showed duration-dependent activity during the time period between the two stimuli (Sakurai et al., 2004; Oshio et al., 2006; Genovesio et al., 2009), suggesting the involvement of the PFC in holding the information on the first time interval as working memory, which might be a step toward long-term storage of temporal information (Wearden, 1999). Also, after presentation of the second stimulus, some PFC neurons signaled relative durations of the two stimuli (Genovesio et al., 2009), suggesting the involvement of the PFC in the comparison process as well. We also found that some neurons in the rat mPFC modulated their activity according to sample interval duration after sample interval offset. These results suggest the involvement of the mPFC in maintaining temporal information as working memory and possibly in comparing this information with a reference time interval stored in long-term memory. Collectively, the present and previous physiological studies in rats and monkeys suggest the involvement of the PFC in multiple processes of time-interval discrimination, raising the possibility that the PFC might be part of a central neural system controlling interval timing behavior. Previous physiological studies have found timing-related neuronal activity in various brain structures, such as the striatum (Matell et al., 2003), motor cortex (Lebedev et al., 2008; Mita et al., 2009; Matell et al., 2011), parietal cortex (Leon and Shadlen, 2003; Schneider and Ghose, 2012), and hippocampus (Itskov et al., 2011; MacDonald et al., 2011). It remains to be determined how the PFC works together with these brain structures in controlling interval timing behavior.
Logarithmic versus linear encoding of time
It has been controversial whether time is represented on a linear or logarithmic scale (see Introduction). Our study provides neurophysiological evidence that linearly changing neuronal activity on a logarithmic scale might be one way of representing time over the range of a few seconds. First, more than half of all recorded neurons showed monotonically changing activity profiles and logarithmic functions were superior to linear functions in explaining activity of individual mPFC neurons. Note that potential influences of behavioral variations and the animal's previous goal choice were taken into consideration in this analysis. Also the extent to which a logarithmic function explains neural activity (R2 values) was significantly correlated with the amount of temporal information each neuron carried. Second, the largest variance of neural activity was explained by a monotonically increasing function with negative acceleration (PC1) and it was in charge of a large fraction of temporal information. This was the case for all interval durations, including the shortest one (i.e., well before reaching the decision threshold). Thus it is unlikely that logarithmic activity profiles were because of variable trial-by-trial neural activity that changed abruptly at the decision threshold. Third, temporal discrimination became progressively imprecise over time without proportional increase in neuronal variability. These results are more consistent with logarithmic than linear encoding of time, which can explain why the precision of time-interval discrimination is lowered in proportion to its duration according to Weber's law.
In a study that employed a motor timing task for monkeys (Mita et al., 2009), activity of some neurons in the supplementary motor area (SMA) and pre-SMA was well described by exponential decay functions. These neurons are comparable to those mPFC neurons that gradually decreased discharge rates in the present study; they might be involved in estimating self-generated time intervals. Note that we use the term “logarithmic” in a loose sense to describe monotonically changing neuronal activity with a progressively smaller rate of change. Activity of these mPFC neurons can be equally well described by exponential or power functions. In an earlier perceptual timing task in monkeys (Leon and Shadlen, 2003), some neurons in the lateral intraparietal area monotonically increased their firing rates during the presentation of a test time interval provided that the target for “longer” judgments fell within their receptive fields. Notably, their averaged activity profile was not linear, but resembled logarithmic activity profiles of those mPFC neurons that monotonically increased their activity in the present study (Leon and Shadlen, 2003, their Fig. 3). Thus, nonlinear representation of time might be common in the brain.
Although our results provide supporting evidence for logarithmic encoding of time, they by no means indicate that logarithmic encoding is the only way of representing time in the brain. We cannot exclude the possibility that linear encoding is employed in other brain structures or in the PFC during different behavioral tasks (e.g., Komura et al., 2001; Machens et al., 2010). In addition, activity profiles of a substantial fraction of neurons were better explained by linear than logarithmic functions, although their preferential correlations with linear functions might be an outcome of noisy individual neuronal activity. At the level of individual neurons, therefore, we cannot rule out the possibility that both logarithmic and linear encoding schemes are simultaneously used for representing the elapse of time. For these reasons, our results do not provide clear evidence for or against linear encoding of time. It remains to be determined in future studies whether linear and logarithmic encoding of time are simultaneously used by different neurons in the same brain region.
Footnotes
This work was supported by the Research Center Program of the Institute for Basic Science, Korea. We thank Daeyeol Lee, Mark Laubach, and Matthew Kleinman for their helpful comments on the manuscript.
References
- Baeg EH, Kim YB, Jang J, Kim HT, Mook-Jung I, Jung MW. Fast spiking and regular spiking neural correlates of fear conditioning in the medial prefrontal cortex of the rat. Cereb Cortex. 2001;11:441–451. doi: 10.1093/cercor/11.5.441. [DOI] [PubMed] [Google Scholar]
- Baeg EH, Kim YB, Huh K, Mook-Jung I, Kim HT, Jung MW. Dynamics of population code for working memory in the prefrontal cortex. Neuron. 2003;40:177–188. doi: 10.1016/S0896-6273(03)00597-X. [DOI] [PubMed] [Google Scholar]
- Buhusi CV, Meck WH. What makes us tick? Functional and neural mechanisms of interval timing. Nat Rev Neurosci. 2005;6:755–765. doi: 10.1038/nrn1764. [DOI] [PubMed] [Google Scholar]
- Church RM, Deluty MZ. Bisection of temporal intervals. J Exp Psychol Anim Behav Process. 1977;3:216–228. doi: 10.1037/0097-7403.3.3.216. [DOI] [PubMed] [Google Scholar]
- Church RM, Gibbon J. Temporal generalization. J Exp Psychol Anim Behav Process. 1982;8:165–186. doi: 10.1037/0097-7403.8.2.165. [DOI] [PubMed] [Google Scholar]
- Coull J, Nobre A. Dissociating explicit timing from temporal expectation with fMRI. Curr Opin Neurobiol. 2008;18:137–144. doi: 10.1016/j.conb.2008.07.011. [DOI] [PubMed] [Google Scholar]
- Cowen SL, McNaughton BL. Selective delay activity in the medial prefrontal cortex of the rat: contribution of sensorimotor information and contingency. J Neurophysiol. 2007;98:303–316. doi: 10.1152/jn.00150.2007. [DOI] [PMC free article] [PubMed] [Google Scholar]
- Dietrich A, Allen JD. Functional dissociation of the prefrontal cortex and the hippocampus in timing behavior. Behav Neurosci. 1998;112:1043–1047. doi: 10.1037/0735-7044.112.5.1043. [DOI] [PubMed] [Google Scholar]
- Dietrich A, Allen JD, Bunnell BN. Is the hippocampus involved in temporal discrimination and the memory of short intervals? Int J Neurosci. 1997;90:255–269. doi: 10.3109/00207459709000642. [DOI] [PubMed] [Google Scholar]
- Durstewitz D, Seamans JK. Beyond bistability: biophysics and temporal dynamics of working memory. Neuroscience. 2006;139:119–133. doi: 10.1016/j.neuroscience.2005.06.094. [DOI] [PubMed] [Google Scholar]
- Euston DR, McNaughton BL. Apparent encoding of sequential context in rat medial prefrontal cortex is accounted for by behavioral variability. J Neurosci. 2006;26:13143–13155. doi: 10.1523/JNEUROSCI.3803-06.2006. [DOI] [PMC free article] [PubMed] [Google Scholar]
- Fuster JM. The prefrontal cortex: anatomy, physiology, and neuropsychology of the frontal lobe. 3rd edition. Philadelphia: Lippincott-Raven; 1997. [Google Scholar]
- Gallistel CR. The organization of learning. Cambridge, MA: MIT; 1990. [Google Scholar]
- Gallistel CR. Can a decay process explain the timing of conditioned responses? J Exp Anal Behav. 1999;71:264–271. doi: 10.1901/jeab.1999.71-264. discussion 293–301. [DOI] [PMC free article] [PubMed] [Google Scholar]
- Genovesio A, Tsujimoto S, Wise SP. Feature- and order-based timing representations in the frontal cortex. Neuron. 2009;63:254–266. doi: 10.1016/j.neuron.2009.06.018. [DOI] [PMC free article] [PubMed] [Google Scholar]
- Gibbon J. Scalar expectancy theory and Weber's law in animal timing. Psychol Rev. 1977;84:279–325. doi: 10.1037/0033-295X.84.3.279. [DOI] [Google Scholar]
- Gibbon J, Church RM. Time left: linear versus logarithmic subjective time. J Exp Psychol Anim Behav Process. 1981;7:87–107. doi: 10.1037/0097-7403.7.2.87. [DOI] [PubMed] [Google Scholar]
- Gibbon J, Malapani C, Dale CL, Gallistel C. Toward a neurobiology of temporal cognition: advances and challenges. Curr Opin Neurobiol. 1997;7:170–184. doi: 10.1016/S0959-4388(97)80005-0. [DOI] [PubMed] [Google Scholar]
- Glickstein M, Quigley WA, Stebbins WC. Effect of frontal and parietal lesions on timing behavior in monkeys. Psychonomic Sci. 1964;1:265–266. [Google Scholar]
- Itskov V, Curto C, Pastalkova E, Buzsáki G. Cell assembly sequences arising from spike threshold adaptation keep track of time in the hippocampus. J Neurosci. 2011;31:2828–2834. doi: 10.1523/JNEUROSCI.3773-10.2011. [DOI] [PMC free article] [PubMed] [Google Scholar]
- Ivry RB. The representation of temporal information in perception and motor control. Curr Opin Neurobiol. 1996;6:851–857. doi: 10.1016/S0959-4388(96)80037-7. [DOI] [PubMed] [Google Scholar]
- Ivry RB, Schlerf JE. Dedicated and intrinsic models of time perception. Trends Cogn Sci. 2008;12:273–280. doi: 10.1016/j.tics.2008.04.002. [DOI] [PMC free article] [PubMed] [Google Scholar]
- Jones CR, Rosenkranz K, Rothwell JC, Jahanshahi M. The right dorsolateral prefrontal cortex is essential in time reproduction: an investigation with repetitive transcranial magnetic stimulation. Exp Brain Res. 2004;158:366–372. doi: 10.1007/s00221-004-1912-3. [DOI] [PubMed] [Google Scholar]
- Kim H, Sul JH, Huh N, Lee D, Jung MW. Role of striatum in updating values of chosen actions. J Neurosci. 2009a;29:14701–14712. doi: 10.1523/JNEUROSCI.2728-09.2009. [DOI] [PMC free article] [PubMed] [Google Scholar]
- Kim J, Jung AH, Byun J, Jo S, Jung MW. Inactivation of medial prefrontal cortex impairs time interval discrimination in rats. Front Behav Neurosci. 2009b;3:38. doi: 10.3389/neuro.08.038.2009. [DOI] [PMC free article] [PubMed] [Google Scholar]
- Koch G, Oliveri M, Torriero S, Caltagirone C. Underestimation of time perception after repetitive transcranial magnetic stimulation. Neurology. 2003;60:1844–1846. doi: 10.1212/WNL.60.11.1844. [DOI] [PubMed] [Google Scholar]
- Koch G, Oliveri M, Caltagirone C. Neural networks engaged in milliseconds and seconds time processing: evidence from transcranial magnetic stimulation and patients with cortical or subcortical dysfunction. Philos Trans R Soc Lond B Biol Sci. 2009;364:1907–1918. doi: 10.1098/rstb.2009.0018. [DOI] [PMC free article] [PubMed] [Google Scholar]
- Komura Y, Tamura R, Uwano T, Nishijo H, Kaga K, Ono T. Retrospective and prospective coding for predicted reward in the sensory thalamus. Nature. 2001;412:546–549. doi: 10.1038/35087595. [DOI] [PubMed] [Google Scholar]
- Lebedev MA, O'Doherty JE, Nicolelis MA. Decoding of temporal intervals from cortical ensemble activity. J Neurophysiol. 2008;99:166–186. doi: 10.1152/jn.00734.2007. [DOI] [PubMed] [Google Scholar]
- Leon MI, Shadlen MN. Representation of time by neurons in the posterior parietal cortex of the macaque. Neuron. 2003;38:317–327. doi: 10.1016/S0896-6273(03)00185-5. [DOI] [PubMed] [Google Scholar]
- Lewis PA, Miall RC. Distinct systems for automatic and cognitively controlled time measurement: evidence from neuroimaging. Curr Opin Neurobiol. 2003a;13:250–255. doi: 10.1016/S0959-4388(03)00036-9. [DOI] [PubMed] [Google Scholar]
- Lewis PA, Miall RC. Brain activation patterns during measurement of sub- and supra-second intervals. Neuropsychologia. 2003b;41:1583–1592. doi: 10.1016/S0028-3932(03)00118-0. [DOI] [PubMed] [Google Scholar]
- Livesey AC, Wall MB, Smith AT. Time perception: manipulation of task difficulty dissociates clock functions from other cognitive demands. Neuropsychologia. 2007;45:321–331. doi: 10.1016/j.neuropsychologia.2006.06.033. [DOI] [PubMed] [Google Scholar]
- MacDonald CJ, Lepage KQ, Eden UT, Eichenbaum H. Hippocampal “time cells” bridge the gap in memory for discontiguous events. Neuron. 2011;71:737–749. doi: 10.1016/j.neuron.2011.07.012. [DOI] [PMC free article] [PubMed] [Google Scholar]
- Machens CK, Romo R, Brody CD. Functional, but not anatomical, separation of “what” and “when” in prefrontal cortex. J Neurosci. 2010;30:350–360. doi: 10.1523/JNEUROSCI.3276-09.2010. [DOI] [PMC free article] [PubMed] [Google Scholar]
- Mangels JA, Ivry RB, Shimizu N. Dissociable contributions of the prefrontal and neocerebellar cortex to time perception. Brain Res Cogn Brain Res. 1998;7:15–39. doi: 10.1016/S0926-6410(98)00005-6. [DOI] [PubMed] [Google Scholar]
- Matell MS, Meck WH, Nicolelis MA. Interval timing and the encoding of signal duration by ensembles of cortical and striatal neurons. Behav Neurosci. 2003;117:760–773. doi: 10.1037/0735-7044.117.4.760. [DOI] [PubMed] [Google Scholar]
- Matell MS, Shea-Brown E, Gooch C, Wilson AG, Rinzel J. A heterogeneous population code for elapsed time in rat medial agranular cortex. Behav Neurosci. 2011;125:54–73. doi: 10.1037/a0021954. [DOI] [PMC free article] [PubMed] [Google Scholar]
- Mauk MD, Buonomano DV. The neural basis of temporal processing. Annu Rev Neurosci. 2004;27:307–340. doi: 10.1146/annurev.neuro.27.070203.144247. [DOI] [PubMed] [Google Scholar]
- Meck WH, Benson AM. Dissecting the brain's internal clock: how frontal-striatal circuitry keeps time and shifts attention. Brain Cogn. 2002;48:195–211. doi: 10.1006/brcg.2001.1313. [DOI] [PubMed] [Google Scholar]
- Merchant H, Zarco W, Prado L. Do we have a common mechanism for measuring time in the hundreds of millisecond range? Evidence from multiple-interval timing tasks. J Neurophysiol. 2008;99:939–949. doi: 10.1152/jn.01225.2007. [DOI] [PubMed] [Google Scholar]
- Mita A, Mushiake H, Shima K, Matsuzaka Y, Tanji J. Interval time coding by neurons in the presupplementary and supplementary motor areas. Nat Neurosci. 2009;12:502–507. doi: 10.1038/nn.2272. [DOI] [PubMed] [Google Scholar]
- Narayanan NS, Laubach M. Delay activity in rodent frontal cortex during a simple reaction time task. J Neurophysiol. 2009;101:2859–2871. doi: 10.1152/jn.90615.2008. [DOI] [PMC free article] [PubMed] [Google Scholar]
- Onoe H, Komori M, Onoe K, Takechi H, Tsukada H, Watanabe Y. Cortical networks recruited for time perception: a monkey positron emission tomography (PET) study. Neuroimage. 2001;13:37–45. doi: 10.1006/nimg.2000.0670. [DOI] [PubMed] [Google Scholar]
- Oshio K, Chiba A, Inase M. Delay period activity of monkey prefrontal neurones during duration-discrimination task. Eur J Neurosci. 2006;23:2779–2790. doi: 10.1111/j.1460-9568.2006.04781.x. [DOI] [PubMed] [Google Scholar]
- Paxinos G, Watson C. The rat brain in stereotaxic coordinates. San Diego: Academic; 1998. [DOI] [PubMed] [Google Scholar]
- Penny TB, Vaitilingam L. Imaging time. In: Grondin S, editor. Psychology of time. Bingley, UK: Emerald Group; 2008. pp. 261–294. [Google Scholar]
- Roberts S. Isolation of an internal clock. J Exp Psychol Anim Behav Process. 1981;7:242–268. doi: 10.1037/0097-7403.7.3.242. [DOI] [PubMed] [Google Scholar]
- Roberts WA. Evidence that pigeons represent both time and number on a logarithmic scale. Behav Processes. 2006;72:207–214. doi: 10.1016/j.beproc.2006.03.002. [DOI] [PubMed] [Google Scholar]
- Rosenkilde CE, Divac I. Time-discrimination performance in cats with lesions in prefrontal cortex and caudate nucleus. J Comp Physiol Psychol. 1976;90:343–352. doi: 10.1037/h0077208. [DOI] [PubMed] [Google Scholar]
- Sakurai Y, Takahashi S, Inoue M. Stimulus duration in working memory is represented by neuronal activity in the monkey prefrontal cortex. Eur J Neurosci. 2004;20:1069–1080. doi: 10.1111/j.1460-9568.2004.03525.x. [DOI] [PubMed] [Google Scholar]
- Schneider BA, Ghose GM. Temporal production signals in parietal cortex. PLoS Biol. 2012;10:e1001413. doi: 10.1371/journal.pbio.1001413. [DOI] [PMC free article] [PubMed] [Google Scholar]
- Schubotz RI, von Cramon DY. Interval and ordinal properties of sequences are associated with distinct premotor areas. Cereb Cortex. 2001;11:210–222. doi: 10.1093/cercor/11.3.210. [DOI] [PubMed] [Google Scholar]
- Staddon JE, Higa JJ. Time and memory: towards a pacemaker-free theory of interval timing. J Exp Anal Behav. 1999;71:215–251. doi: 10.1901/jeab.1999.71-215. [DOI] [PMC free article] [PubMed] [Google Scholar]
- Sul JH, Kim H, Huh N, Lee D, Jung MW. Distinct roles of rodent orbitofrontal and medial prefrontal cortex in decision making. Neuron. 2010;66:449–460. doi: 10.1016/j.neuron.2010.03.033. [DOI] [PMC free article] [PubMed] [Google Scholar]
- Tregellas JR, Davalos DB, Rojas DC. Effect of task difficulty on the functional anatomy of temporal processing. Neuroimage. 2006;32:307–315. doi: 10.1016/j.neuroimage.2006.02.036. [DOI] [PubMed] [Google Scholar]
- Wearden JH. “Beyond the fields we know.”: exploring and developing scalar timing theory. Behav Processes. 1999;45:3–21. doi: 10.1016/S0376-6357(99)00006-6. [DOI] [PubMed] [Google Scholar]
- Wearden JH, Jones LA. Is the growth of subjective time in humans a linear or nonlinear function of real time? Q J Exp Psychol (Hove) 2007;60:1289–1302. doi: 10.1080/17470210600971576. [DOI] [PubMed] [Google Scholar]
- Wessberg J, Stambaugh CR, Kralik JD, Beck PD, Laubach M, Chapin JK, Kim J, Biggs SJ, Srinivasan MA, Nicolelis MA. Real-time prediction of hand trajectory by ensembles of cortical neurons in primates. Nature. 2000;408:361–365. doi: 10.1038/35042582. [DOI] [PubMed] [Google Scholar]
- Yi L. Do rats represent time logarithmically or linearly? Behav Processes. 2009;81:274–279. doi: 10.1016/j.beproc.2008.10.004. [DOI] [PubMed] [Google Scholar]