

Abstract
Lesions of striate cortex [primary visual cortex (V1)] in adult primates result in blindness. In contrast, V1 lesions in neonates typically allow much greater preservation of vision, including, in many human patients, conscious perception. It is presently unknown how this marked functional difference is related to physiological changes in cortical areas that are spared by the lesions. Here we report a study of the middle temporal area (MT) of adult marmoset monkeys that received unilateral V1 lesions within 6 weeks of birth. In contrast with observations after similar lesions in adult monkeys, we found that virtually all neurons in the region of MT that was deprived of V1 inputs showed robust responses to visual stimulation. These responses were very similar to those recorded in neurons with receptive fields outside the lesion projection zones in terms of firing rate, signal-to-noise ratio, and latency. In addition, the normal retinotopic organization of MT was maintained. Nonetheless, we found evidence of a very specific functional deficit: direction selectivity, a key physiological characteristic of MT that is known to be preserved in many cells after adult V1 lesions, was absent. These results demonstrate that lesion-induced reorganization of afferent pathways is sufficient to develop robust visual function in primate extrastriate cortex, highlighting a likely mechanism for the sparing of vision after neonatal V1 lesions. However, they also suggest that interactions with V1 in early postnatal life are critical for establishing stimulus selectivity in MT.
Introduction
In adult primates, lesions involving the striate cortex [primary visual cortex (V1)] lead to permanent blindness, which ensues even if the eyes, subcortical visual nuclei, and other cortical areas are not directly damaged (Grüsser and Landis, 1992). In cases of partial destruction of V1, a defined scotoma (an “island” of blindness) is created, which precisely follows the topographic representation of the visual field in this area (Horton and Hoyt, 1991). These observations indicate that V1 is important for conscious visual perception, having a key role in the distribution of the visual information to other cortical areas (Leopold, 2012). Nonetheless, patients with V1 lesions can retain some ability to process visual stimuli within the scotomas and modify behavior accordingly, despite lacking visual awareness. This phenomenon, often referred to as blindsight (Weiskrantz, 1990), has also been described in monkeys (Stoerig and Cowey, 1997).
The exact characteristics of blindsight depend markedly on the age at which the lesion occurs. Patients and monkeys who sustained lesions early in life often show a greater range of abilities than those who had lesions in adulthood (Blythe et al., 1987; Moore et al., 1996; Gross et al., 2004; Guzzetta et al., 2010), including, in many cases, conscious perception (Werth, 2006; Silvanto and Rees, 2011). One possibility is that this improved outcome is underpinned by compensatory changes in the response properties of higher-order (extrastriate) areas, enabled by anatomical plasticity in thalamocortical circuits (Payne and Lomber, 2002). However, little is known at present about the physiological state of neurons in the primate extrastriate cortex in the aftermath of early postnatal V1 lesions.
Studies in adult-lesioned primates showed that neurons in the middle temporal area (MT) retain the capacity to respond to stimuli presented within the resulting scotomas (Rodman et al., 1989; Rosa et al., 2000; Azzopardi et al., 2003), a result that indicates a physiological role of afferent pathways that normally bypass V1 (Stepniewska et al., 1999; Sincich et al., 2004). Although these responses are almost invariably much weaker than normal, many MT neurons continue to demonstrate selectivity to the direction of motion of visual stimuli, a defining physiological response property of MT cells (Dubner and Zeki, 1971; Maunsell and Van Essen, 1983; Albright, 1984). In the present study, we investigated whether plastic changes triggered by early V1 lesions result in a different pattern of response properties, in an attempt to clarify the functional basis of the observed greater sparing of vision.
Materials and Methods
Partial unilateral lesions of V1 were placed in five marmosets (Callithrix jacchus, three males and two females) at 2 or 6 weeks of age. In some animals, fluorescent tracers were injected in MT 2 weeks before the recording sessions (results to be reported separately). Data from 3 additional age-matched adult animals with no V1 lesion were used for comparison. All experiments were conducted in accordance with the Australian Code of Practice for the Care and Use of Animals for Scientific Purposes. All procedures were approved by the Monash University Animal Ethics Experimentation Committee, which also monitored the health and wellbeing of the animals throughout the experiments.
Cortical lesions.
The animals were anesthetized with isoflurane (1–2%). Under sterile conditions, a craniotomy was made over the occipital pole of the left hemisphere. Using a fine-tipped cautery, an excision was then made of all cortical tissue caudal to a plane extending from the dorsal surface of the occipital lobe to the cerebellar tentorium, across the entire mediolateral extent (Rosa et al., 2000). After application of hemostatic microspheres, the exposed cortex and cerebellum were protected with ophthalmic film, and the cavity was filled with Gelfoam. The skull was reconstructed, the skin was sutured, and antibiotics (Norocillin, 0.05 ml, i.m.) were administered. The marmosets were placed in a humidicrib until recovery of movement, after which they were returned to parental care. Throughout the postlesion period, they were housed in large cages with family groups, having access to both indoor and outdoor environments. Electrophysiological recording sessions did not occur until well after each animal reached sexual maturity (usually after postnatal week 70; Chandolia et al., 2006).
Electrophysiological recordings.
Each of the animals underwent a single recording session, using the same protocol used in previous studies in our laboratory (Yu et al., 2012). They were premedicated with diazepam (3.0 mg/kg) and atropine (0.2 mg/kg), and anesthesia was induced (30 min later) with alfaxalone (10 mg/kg). After tracheotomy and craniotomy, they were administered an intravenous infusion of a mixture of pancuronium bromide (0.1 mg · kg−1 · h−1), sufentanil (6 μg · kg−1 · h−1), and dexamethasone (0.4 mg · kg−1 · h−1), in a saline–glucose solution. During the recordings, they were also ventilated with nitrous oxide and oxygen (7:3).
The electrophysiological experiments consisted of two phases: (1) mapping of receptive fields of V1 neurons located along the perimeter of the lesion and (2) mapping of receptive fields in MT. In some animals, recordings were also obtained in other brain regions (data not reported). Tungsten microelectrodes (∼1 MΩ) were inserted in the cortex after the vertical stereotaxic plane, guided by coordinates obtained in previous studies (Rosa and Elston, 1998). Amplification and filtering were achieved via an AM Systems model 1800 microelectrode alternating current amplifier.
Stimulus presentation.
Stimuli were presented monocularly in a room with mesopic background illumination. A computer-controlled video projector (640 × 480 resolution, 85 Hz refresh rate) was used to generate visual patterns on the surface of a hemispheric screen (90 cm diameter), which was centered on the right (contralateral) eye (Yu and Rosa, 2010). A modified version of Expo (release 1.5.0), designed by Dr. Peter Lennie and others, was used for stimulus generation and data acquisition. The stimuli (squares, moving bars, and kinetic random dot patterns) were projected at 4.0 cd/m2 on a 0.3 cd/m2 background. A hard contact lens focused the right eye on the hemispheric screen.
To minimize sampling biases, neural activity was sampled at fixed intervals of 100–200 μm during each penetration. For each multiunit cluster, we first used a spot of light to determine an outline of the receptive field. The single-unit activity was then isolated interactively, using features of the program Expo. To quantitatively map the receptive field envelope, bright squares (86% contrast) were displayed in multiple locations around the estimated receptive field center, according to a grid (8 × 8 or 12 × 12 locations). The stimuli were typically on for 0.2 s and off for 0.2 s and were repeated 8–20 times at each location. The size of the squares was adjusted for each cell so that the entire receptive field was included, as well as the immediate surround; as shown in Figures 1D and 4–8, the size of the squares varied between 1° and 6° of visual arc, depending on the receptive field location and eccentricity. We then used moving bars and kinetic dot fields to quantify tuning properties of neurons. For moving bars, the length of the bars and the excursions of the motion covered the entire receptive fields; likewise, the diameters of the dot fields were adjusted so that they encompassed the entire receptive fields but avoided surrounding regions (to the extent that it was possible based on real-time analyses of the maps obtained by the flashed squares). A range of stimulus parameters was tested to ensure that the neurons were driven by the stimuli. The speed of motion used ranged from 1°/s to 30°/s. Direction tuning curves were obtained with stimuli moving in directions 30° apart.
Figure 1.
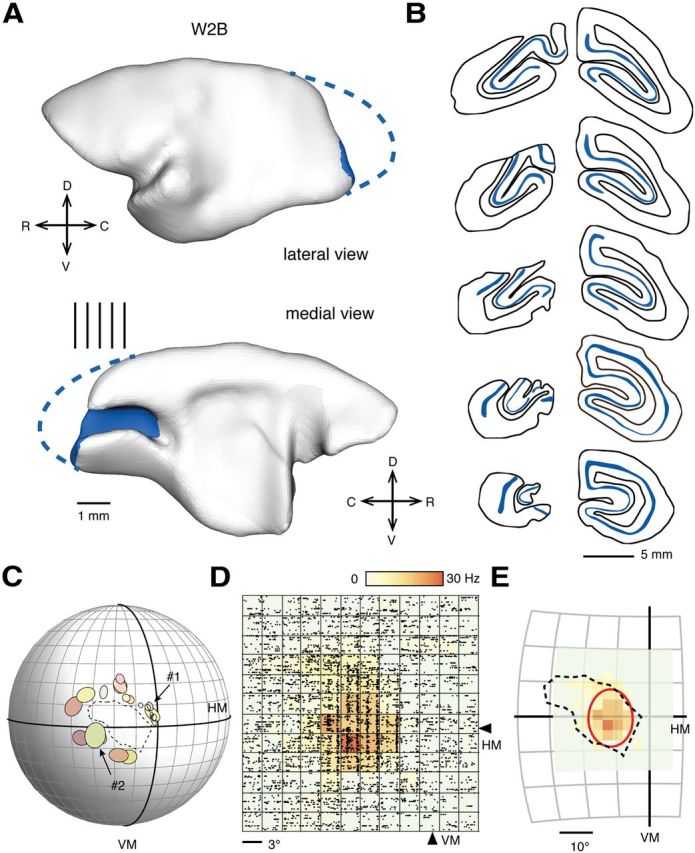
Overview of methodology. A, Lateral and medial views of the reconstructed cortex in a marmoset monkey that had a V1 lesion placed in the second postnatal week (case W2B). The remnant part of V1 is indicated in blue. C, Caudal; D, dorsal; L, lateral; V, ventral. The vertical lines near the medial view indicate the levels of the coronal sections shown in B. In these coronal sections, the heavily stained layer 4 (a characteristic histological feature of V1 revealed by the CO method; see Fig. 3B) is highlighted in blue. Sections from the other four cases are shown in Figure 2. C, Representation of the animal's visual field, in which the receptive fields of V1 neurons adjacent to the border of the lesion are plotted as ovals. The part of the visual field delineated by these receptive fields provided an estimate of the V1 scotoma (dashed line). The vertical meridian (VM) and the horizontal meridian (HM) are indicated by thicker lines, and each subdivision of the visual field corresponds to 10° of visual angle. Examples of recordings from two of the corresponding V1 neurons (#1 and #2, indicated by arrows) are illustrated in Figure 4B. D, Once the V1 scotoma was delineated, we recorded from MT cells by probing the visual field with a flashing square projected onto a grid of locations centered approximately on the point from which a maximal response could be elicited by a manually operated stimulus. The size of the grid was adjusted interactively until the entire extent of the receptive field was covered. In the figure, raster diagrams are presented corresponding to the neural activity of a neuron, elicited by a stimulus centered in each point in the grid. The above-spontaneous response rates are color-coded in a heat-scale map. For this particular recording, the size of the flashing square was 3° in diameter. The center of the grid was at the coordinate (11°, 2°). In E, the receptive field extent was quantified by fitting a five-parameter Fisher–Bingham distribution (Yu and Rosa, 2010). The best-fit function is indicated by the red contour.
Figure 4.

Response characteristics of V1 neurons near the perimeters of lesions. A, The recording sites of the neurons in case W2B which yielded two of the receptive fields (#1 and #2) shown in Figure 1C are marked by circles in the outline of a coronal section. The outline was traced from the CO section shown in Figure 3B. The blue bands illustrate the heavily stained layer 4 of V1. Receptive fields 1 and 2 were recorded in the lower and the upper bank of the calcarine sulcus. The locations of the two receptive fields are consistent with the topographical map of the marmoset's V1 (Chaplin et al., 2013). D, Dorsal; V, ventral; M, medial; L, lateral. B, Maps of receptive fields 1 and 2 and their orientation tuning curves. The receptive field maps are displayed in the same format as in Figure 1E. Arrowheads represent the coordinates of the center of the stimulus grid. In the polar plots of orientation selectivity, the vertices on the yellow polygons correspond to the mean firing rates subtracted by the mean spontaneous activities. The vertices on the blue polygons indicate above spontaneous mean firing rates plus the SEMs. The numbers below represent the maximal mean above-spontaneous firing rates. The peristimulus time histograms of the responses evoked by the mapping stimulus (a flashing square of 0.2 s duration) are also illustrated. The red line segments indicate the time interval during which the stimuli were presented. C, Orientation selectivity was quantified by cv. The distribution of 98 neurons recorded near the lesion perimeters in three cases (W2B, W6B, and W6C) was compared with that of V1 neurons with receptive field within 15° of eccentricity recorded in normal animals (Yu et al., 2010 and our unpublished data). The arrowheads mark median values. Representative tuning curves with cv approximately corresponding to the two median values are plotted in polar format. Two additional examples of cv are given in B. D, The distribution of receptive field size (qualitatively mapped with manually operated stimuli) as a function of eccentricity for 153 V1 neurons recorded near the lesion perimeters in all five cases. The dashed line represents the expected V1 receptive field size of normal animals [size = ê(−0.83 + 0.68 × log(eccentricity)], from Chaplin et al. (2013).
Figure 5.

Examples of responses of two adult MT neurons, from an animal that received a V1 lesion in the second postnatal week (case W2D). A, Receptive fields maps, illustrated relative to the V1 scotoma (dashed line). Darker color represents stronger responses to a flashed square of light. The grid divisions represent 10°. B, C, Peristimulus time histograms and polar plots representing the neuronal responses to 12 directions of motion. The format of the polar plots is the same as in Figure 4B. The red line segments indicate the normalized vector sums of the directional responses. Maximal response rates of both neurons were 60 Hz. VM, Vertical meridian; HM, horizontal meridian.
Figure 6.

Examples of receptive fields encountered during two electrode penetrations of MT in an animal lesioned at 6 weeks of age (W6C). A, Receptive fields of neurons in caudal MT form a topographic sequence across the V1 scotoma (1–10). The ovals in the left diagram represent the best-fitting ellipses of the quantitatively mapped receptive fields (displayed in the “receptive field” column). The rectangles represent receptive fields mapped by hand-operated stimuli. The corresponding recording sites, shown in a coronal section, are identified by numbers (1–10) and color-coded. The histological borders of MT, identified by dense myelination, are indicated by dashed lines in the bottom diagram. The corresponding receptive field maps and direction tuning curves (tested with dot fields) are shown on the middle column. B, Receptive fields of neurons in rostral MT, forming a sequence across the visual field peripheral to the V1 scotoma (a–f). Other conventions as in Figure 5 B and C. L, Lateral; D, dorsal; HM, horizontal meridian; VM, vertical meridian. The size of the square stimulus used for mapping receptive fields 4–10 was 4°, 3°, 3°, 3°, 2.5°, 2.5°, and 2.5° respectively. Maximal firing rates were 77.7, 20.7, 67.6, 20.2, 57.1, 36.6, and 24.5 Hz, respectively. Maximal firing rates of the direction tuning curves are displayed under the polar plots.
Figure 7.

Examples of receptive fields encountered during an electrode penetration through MT in an animal lesioned at 2 weeks of age (W2E). The format is the same as Figure 6. Direction tunings were tested with moving bars. The size of the mapping stimulus was 6° for receptive fields 1–3 and 5° for receptive fields 5–9. Maximal firing rates were 29.7, 17.1, 11.2, 28.4, 102.0, 30.7, 37.4, 76.9, and 93.2 Hz for receptive fields 1–9. Maximal firing rates of the direction tuning curves are displayed under the polar plots. D, Dorsal; L, lateral; VM, Vertical meridian; HM, horizontal meridian.
Figure 8.

A, B, Examples of receptive fields and direction tuning curves of two additional cases (W2B and W6B). The format is the same as in Figure 6. A, For case W2B, the size of the stimulus for mapping was 2.5° for receptive field 1, 3° for receptive fields 2–4, and 2° for receptive fields 5–7. Maximal firing rates were 89.1, 49.6, 23.0, 22.8, 20.3, 67.1, and 105.8 Hz for receptive fields 1–7. B, For case W6B, the size of the mapping stimulus was 5° for receptive field 3 and 4° for receptive fields 4–9 (except for 6, which was not quantitatively mapped). Maximal firing rates were 13.4, 35.6, 34.8, 34.2, 10.2, and 20.0 Hz. Maximal firing rates of the direction tuning curves are displayed under the polar plots. D, Dorsal; L, lateral; VM, Vertical meridian; HM, horizontal meridian.
Data analyses.
Receptive field shapes were estimated by fitting the neuronal responses to flashed squares to a model from which eccentricity, width, and length were estimated. The length and width were calculated as the arc length of the fitted surface above 30% of the maximal height. Model fitting (Yu and Rosa, 2010; Yu et al., 2012) was performed by fitting the above-spontaneous firing rates of a neuron to the following:
 |
where c is a scaling constant, A(D) is the spherical area of the stimulus D, (λ, φ) is the coordinate of the center of D in longitude and latitude, and f(λ, φ) is the envelope of the receptive field. The function f(λ, φ), modeled by the five-parameter Fisher–Bingham distribution, is expressed in the standard reference frame as follows:
where (x1, x2, x3) is the Cartesian coordinate of (λ*, φ*) according to (x1, x2, x3) = (cosφ*sinλ*, sinφ*, cosφ*cosλ*), κ ≥ 0 is the concentration parameter, and 0 ≤ β ≤ 1/2κ is the ovalness parameter. The term (λ*, φ*) is (λ, φ) rotated in three dimensions to the standard reference frame (i.e., the north pole with the major and minor axes aligned to the x and z axes). The method for estimating the rotation matrix has been described by Yu and Rosa (2010).
Response latency was calculated from presentation of the flashing stimuli used for receptive field mapping. Responses to the flashing stimulus were modeled as a two-stage Poisson process. Response latency was estimated as the change point of the process, using the maximal-likelihood method described by Friedman and Priebe (1998). Response strength (in hertz) to the presentation of flashing squares was measured as the peak above-spontaneous firing rate to the onset of the stimulus, using peristimulus time histograms with 10 ms bins. Signal-to-noise ratio (SNR) was calculated as the ratio between the maximal response and the baseline firing rate (Rodman et al., 1989).
Orientation selectivity and direction selectivity were quantified by the vector sum method (Swindale, 1998; Ringach et al., 2002). Let R(θj) denote the above-spontaneous firing rate of the response of a neuron to a stimulus moving at direction (0° ≤ θj < 360°, j = 0,1,… n). For quantifying direction selectivity, circular variance (cv) is defined as one minus the normalized length of the vector sum of the responses to all directions:
 |
For quantifying orientation selectivity, the angles were doubled before using the equation. The measure ranges from 0 to 1, with lower cv values indicating strong selectivity. The vector sum is visualized by line segments in red in Figures 5–8. Examples of the correspondence between the tuning curves and cv values are given in Figures 4C and 10C. cv takes responses to all stimulus directions into account. A more traditional measure, the direction index (DI) (Albright, 1984; Rodman et al., 1989), was also calculated as 1 − c/b, where b is the above-spontaneous firing rate at the preferred direction, and c is the above-spontaneous firing rate at the anti-preferred direction. Comparison of neuronal response strengths and response latencies were made using the nonparametric Mann–Whitney U test (also known as the Wilcoxon's rank-sum test).
Figure 10.

A, B, Direction selectivity tested with moving bars and moving dot fields, quantified by cv. C, Examples of direction tuning curve plotted in polar coordinates and associated cv, which are representative of the medians of the distributions.
To examine the relationship between receptive field size and other response parameters, we calculated the normalized receptive field size as (w − w̄(ecc))/w̄(ecc), where w is the width of the receptive field, ecc is the eccentricity of the receptive field, and w̄(ecc) is the expected receptive field width at the eccentricity. The function w̄(ecc) was estimated by fitting the width data to a power function (see Fig. 9D).
Figure 9.

Response characteristics of MT neurons in animals with early V1 lesion. A–C, Distributions of response strength, SNR (Rodman et al., 1989), and response latency of MT neurons with receptive fields inside the V1 scotoma, those that crossed the boundary of the V1 scotoma, and those outside the V1 scotoma. Distributions of response strength and SNR of normal animals are also illustrated. The arrows indicate median values. D, Relationship between receptive field width and receptive field center eccentricity. The lines represent the power functions fitted to data from cells with receptive fields inside and outside the V1 scotomas.
Histology.
Histological analysis was performed to examine the extents of V1 lesions, to establish the boundaries of MT, and to reconstruct the recording sites. At the end of the experiment, the animal was given a lethal dose of sodium pentobarbitone (100 mg/kg) and perfused with 0.9% saline, followed by 4% paraformaldehyde in 0.1 m phosphate buffer, pH 7.4. The brain was postfixed (24 h), cryoprotected with increasing concentrations of sucrose, and then sectioned into 40 μm coronal slices. Alternate series were stained for Nissl substance, myelin (Gallyas method), and cytochrome oxidase (CO) (see Fig. 3). Photomicrographs were obtained using a Carl Zeiss Axioplan microscope equipped with a 2.5× objective, an AxioCam ICc 5 digital camera, and the ZEN 2011 software. The retinas of some animals were preserved, embedded in plastic resin, and cross-sectioned. As expected (Weller and Kaas, 1989), ganglion cells were severely depleted in the left hemi-retinas.
Figure 3.

Micrographs of histological sections showing recording sites. A, A Nissl-stained coronal section (40 μm) showing a segment of the perimeter of V1 lesion in case W2B (the same as shown in Fig. 1). B, A section adjacent to A, stained for CO. Electrode tracks (indicated by black arrows) made during the mapping of the V1 scotoma are visible in the both figures. C, A myelin-stained coronal section showing area MT in case W6B. The boundaries of MT (black arrowheads) were identified by the myelination pattern. A black arrow on the left figure highlights an electrode track. D, An adjacent section stained for CO. A white arrowhead on the right figure shows an electrolytic lesion made at the end of the tract. Scale bars, 1 mm. D, Dorsal; V, ventral; L, lateral; M, medial.
The three-dimensional surface reconstruction shown in Figure 1A was created by manually tracing layer 4 contours from coronal histological sections (examples are shown in Fig. 1B). The contours were registered and assembled into a three-dimensional surface using Caret (Van Essen et al., 2001).
Results
Determination of the parts of the visual field affected by lesions and physiological state of V1 in adult monkeys
We created lesions of the occipital lobe in five marmoset monkeys aged between 2 and 6 postnatal weeks (Table 1), a period during which both V1 and MT are still undergoing rapid biochemical and functional changes associated with the maturation of their neuronal circuits (Bourne and Rosa, 2006). The surgeries removed the majority of V1 in one hemisphere (Figs. 1, 2), with variable involvement of the second visual area (V2). Examples of histological sections showing the perimeter of V1 lesion in one case (W2B) are shown in Figure 3, A and B. After recovery into adulthood, the visual field defects resulting from each lesion were delineated by quantitative mapping of the receptive fields of cells in the surviving parts of V1 and V2, with particular attention being paid to the perimeters of the lesions (Fig. 1C). These recordings confirmed that representations of large regions of the visual field (29–56° wide in azimuth, and 16–43° in elevation) were absent from V1; hereafter, these regions will be referred to as “V1 scotomas.”
Table 1.
Summary of the characteristics of the five cases
| Animal ID | Age (postnatal days) | Sex | Scotoma length (°) | Scotoma width (°) | Scotoma area (°)2 | Number of MT receptive fields inside scotoma | Number of MT receptive fields on boundary | Number of MT receptive fields outside scotoma |
|---|---|---|---|---|---|---|---|---|
| W2B | 399 | M | 29.0 | 16.2 | 372.7 | 20 | 9 | 16 |
| W2D | 727 | M | 50.9 | 30.2 | 1203.0 | 28 | 5 | 6 |
| W2E | 743 | F | 56.2 | 43.2 | 1883.5 | 22 | 10 | 3 |
| W6B | 420 | M | 35.4 | 16.8 | 497.5 | 5 | 8 | 6 |
| W6C | 984 | F | 36.8 | 20.2 | 586.0 | 10 | 16 | 12 |
A receptive field was considered inside, on the boundary, or outside the V1 scotoma if >80%, 10–80%, or <10% of its area (estimated by fitting a model as shown in Fig. 1E) overlapped with the V1 scotoma. Columns 7–9 report the numbers of cells that went through all tests. Data presented in Figures 10 and 11 included cells not characterized by the flashing stimuli. M, Male; F, Female.
Figure 2.

Extents of V1 lesions in four additional cases. The drawings were traced from coronal sections stained for CO. Lesions are on the left hemisphere; sections of the right hemisphere at matching rostrocaudal levels are illustrated for comparison. Consecutive drawings are 0.4 mm apart. V1 is indicated by a blue band, which was traced from the heavily stained cortical layer 4.
In no case did we detect any evidence of reorganization of the visuotopic map within the surviving parts of V1. The receptive fields of V1 neurons, even in close proximity (<1 mm) to the lesion border, were centered in the expected parts of the visual field (Chaplin et al., 2013). Stimulus-driven activities were robust (Fig. 4B), and often orientation selective. Orientation selectivity of neurons near lesion perimeters was quantified by cv, which ranges from 0 to 1 (with larger values representing broader tunings). In Figure 4C, the distribution of cv in three V1-lesioned animals (W2B, W6B, and W6C) was compared against that of V1 neurons in normal adult animals (data obtained as part of the study of Yu et al. (2010) and subsequent unpublished experiments). The median cv for lesioned animals was 0.8 (approximately corresponding to 40° in half-width–half-height bandwidth), which was slightly but significantly broader (Mann–Whitney U test = 12,603, p = 0.001) than that measured in normal animals (0.7, corresponding to 30° half-width–half-height bandwidth). Although the result might indicate a broadening of orientation tuning in the perimeter of lesions, this requires additional investigation given that the responses to different stimulus directions were sampled more coarsely in the current study (30° interval) than in the normal animal study (20° interval). This difference in method may have affected our ability to detect cells with very narrow tuning (low cv values) in V1.
We also compared the receptive field size of V1 neurons near the lesion perimeters against the receptive field size of normal animals (Chaplin et al., 2013; Fig. 4D, dashed line). Figure 4D shows that the relationship between eccentricity and receptive field size approximately followed the power law pattern found in normal V1.
MT neurons responded to visual stimuli presented within the V1 scotomas
The receptive fields of MT neurons were mapped in the same animals, and their response properties were characterized using quantitative techniques described previously in detail (Yu and Rosa, 2010). All recording sites were verified by histological reconstruction, using the dense myelination of MT as a criterion, as well as cytoarchitectural features (Allman and Kaas, 1971; Paxinos et al., 2012). Examples of histological sections showing area MT of case W6B are illustrated in Figure 3, C and D. Across cases, we characterized 85 MT cells with receptive fields encompassed within the V1 scotomas and 48 cells with receptive fields that straddled the boundaries of these regions (Table 1). For comparison, we also studied in the same animals 43 MT neurons with receptive fields in parts of the visual field that still had representation in V1, as well as 121 neurons in three age-matched, nonlesioned control animals.
Our main findings are summarized by the two examples of MT neuronal responses illustrated in Figure 5, which were recorded from an animal that received a V1 lesion in the second postnatal week. Unlike observations after adult V1 lesions (Rodman et al., 1989; Rosa et al., 2000; Collins et al., 2003), we found that cells throughout MT showed robust and consistent visual responses, whether the receptive fields were located inside or outside the V1 scotomas. More than 90% of the neurons with receptive fields within the V1 scotomas had clear boundaries, which could be mapped by flashing small patches of light in different locations (Figs. 1D, 6–8, “receptive field” columns) as well as by moving bars or random dot fields (Figs. 6–8, “direction selectivity” columns). The remaining cells also showed clear visual responses to moving stimuli, but their receptive field borders appeared more diffuse when tested with flashed stimuli. Despite these remarkable signs of resilience to the removal of V1 inputs, we found that the neuronal selectivity for direction of motion, a key physiological feature of MT, was specifically abolished among those neurons that had receptive fields inside the V1 scotomas (Fig. 5B).
The retinotopic organization of MT was preserved
In normal adult marmosets, vertical electrode penetrations crossing area MT from dorsal to ventral reveal a highly consistent topography, whereby the receptive fields move from the lower visual field to the upper visual field, forming arc-like trajectories (Rosa and Elston, 1998). The peripheral visual field is represented rostrally and the central visual field caudally. Our results indicate that these features were maintained in all animals that received early V1 lesions. Examples of receptive fields encountered during near-vertical electrode penetrations through MT are illustrated in Figures 6–8.
As expected, the topographic organization of the parts of MT that represented sectors of the visual field spared by the V1 lesions was not affected. In the example shown in Figure 6B (receptive fields a–f), the movement of receptive fields recorded in the rostral part of MT formed the expected arc-like sequence across the visual field temporal to the V1 scotoma. However, of greater significance is the fact that a penetration in caudal MT, which passed through the deafferented zone, also yielded receptive fields that drifted gradually as the electrode traversed MT, crossing the V1 scotoma without interruption (Fig. 6A, receptive fields 1–10). A normal topographic pattern was observed in all 22 penetrations in five cases, including a 2-week lesioned animal in which most of V1 was destroyed (Fig. 7; for data from two additional cases, see Fig. 8).
The above results contrast with observations in MT of adult-lesioned animals, in which the many recording sites yield cells with poorly defined receptive fields, or unresponsive cells (Rodman et al., 1989; Azzopardi et al., 2003; Collins et al., 2003). Moreover, we found no evidence of regions in which the receptive fields were systematically displaced toward parts of the visual field around the V1 scotoma (Rosa et al., 2000).
The response strength, latency, and SNR were similar within and outside the V1 scotomas
We used the mean firing rate elicited by flashing squares, after subtraction of spontaneous activity, as a measure of the strength of the responses of MT cells. The median response strengths of neurons with receptive fields inside and outside the V1 scotomas were not significantly different (77.0 vs 82.1 Hz; Mann–Whitney U = 1899, p = 0.72; Fig. 9A; Table 2). The median values of response strength to the flashed squares in our lesioned animals were even higher than in the nonlesioned control animals (median, 41.5 Hz), although the overall distributions covered a similar range in both groups. When measured with moving bars, response strengths of neurons with receptive fields inside and outside the V1 scotomas were also similar (median values were 147.5 and 143.75 Hz; Mann–Whitney U = 1831, p = 0.802025).
Table 2.
| Inside | Boundary | Outside | Normal | |
|---|---|---|---|---|
| Strength (Hz) | ||||
| Mean | 84.2 ± 10.5 | 69.9 ± 13.5 | 87.5 ± 15.3 | 55.3 ± 8.4 |
| Median | 77.0 | 62.7 | 82.1 | 41.5 |
| SNR | ||||
| Mean | 13.5 ± 2.9 | 9.1 ± 2.9 | 21.1 ± 12.0 | 11.0 ± 3.0 |
| Median | 9.0 | 5.8 | 9.1 | 4.8 |
| Latency (ms) | ||||
| Mean | 53.0 ± 2.2 | 54.6 ± 3.7 | 53.4 ± 4.4 | NA |
| Median | 51 | 55 | 53 | NA |
| cv | ||||
| Mean | 0.87 ± 0.02 | 0.73 ± 0.05 | 0.62 ± 0.05 | 0.57 ± 0.04 |
| Median | 0.90 | 0.81 | 0.64 | 0.62 |
| DI | ||||
| Mean | 0.20 ± 0.04 | 0.46 ± 0.09 | 0.65 ± 0.07 | 0.73 ± 0.06 |
| Median | 0.17 | 0.39 | 0.67 | 0.7 |
For measurements of direction selectivity (cv and DI), tuning curves measured with moving bars and with moving dots were combined. The ± values indicate 95% confidence intervals. NA, Not applicable.
Rodman et al. (1989) reported that the SNR of MT responses was altered among cells with receptive fields within the scotomas because of combination of low response rates and burst-like spontaneous activity. A quantitative analysis in the present cases (Fig. 9B) showed no evidence of this effect. The median spontaneous activity of cells with receptive fields inside the V1 scotomas was 9.6 Hz, which was nearly identical to that of cells with receptive fields outside the scotomas (10.2 Hz; Mann–Whitney U = 1749, p = 0.98). Likewise, there was no difference in SNR according to receptive field location (median SNR; cells with receptive fields inside the scotomas, 9.0; outside the scotomas, 9.1; Mann–Whitney U = 1707, p = 0.69). The median SNR measured with presentation of flashing squares in our control data was in fact lower (median, 4.8) than in the lesioned cases, although the distributions overlapped extensively (Fig. 9B).
Finally, the distributions of response latency to flashed stimuli did not differ between cells with receptive fields within and outside the V1 scotomas (Mann–Whitney U = 1860, p = 0.87; Fig. 9C). Some of the neurons with receptive fields within the V1 scotomas responded as early as 40 ms after a flashed stimulus, similar to the earliest latencies recorded with similar methods in normal marmoset V1 (Yu et al., 2012). The above results contrast markedly with observations in MT of adult-lesioned monkeys, in which sluggish responses and long latencies are the norm (Azzopardi et al., 2003).
Receptive field sizes were affected
The receptive fields of single neurons in normal area MT grow markedly in size with increasing eccentricity (Albright and Desimone, 1987; Fiorani et al., 1989; Rosa and Elston, 1998) To investigate whether early V1 lesions altered this aspect of cortical organization, we used the five-parameter Fisher–Bingham distribution, the analog of the Gaussian distribution defined on the sphere, to model the envelope of each receptive field (Fig 1E; Yu and Rosa, 2010), and estimated receptive field widths as the shorter diameter of the best-fitting ovals. As illustrated in Figure 9D, there was considerable overlap between the distributions of receptive field width inside and outside the V1 scotomas at comparable eccentricities. Nonetheless, this proved to be a significant factor in determining the slopes and intercepts of the best-fitting power functions (analysis of covariance, p < 0.001 for both), indicating that receptive fields within the V1 scotomas were on the average larger than those outside.
Selectivity to direction of motion was affected in cells with receptive fields within the V1 scotomas
Finally, we examined selectivity for stimulus direction, a characteristic physiological property of normal MT neurons (Born and Bradley, 2005). Using either moving bars or random dot fields, we found that direction selectivity was compromised in a very specific manner among cells with receptive fields inside the V1 scotomas (Figs. 6–8, the “direction selectivity” column). A comparison between cells with receptive fields inside versus outside the V1 scotoma, using cv (Ringach et al., 2002) as a measure of direction selectivity (Fig. 10A,B), revealed very different distributions (moving bar, Kolmogorov–Smirnov D = 2.93027, p < 0.001; moving dot field, D = 2.54614, p < 0.001). Cells with receptive fields that partially included the borders of the scotomas were also affected, although a reduced degree of direction selectivity was still evident when long bars were used as stimuli (Fig. 10A). As an alternative to cv, direction selectivity can also be quantified by the more traditional measure, the DI (Albright, 1984; Rodman et al., 1989). Figure 11B illustrates the distributions of DI, with data collected using moving bars and dot fields combined. As with cv, the DI distributions for neurons with receptive fields inside and outside the V1 scotomas were significantly different (Kolmogorov–Smirnov D = 4.34348, p < 0.001), with median values of 0.17 and 0.67, respectively. For additional comparison, we also collected direction tuning data in normal animals, using drifting gratings (Fig. 11). Whether cv (Fig. 11A) or DI (Fig. 11B) were used as the basis for quantification, we found that direction selectivity of neurons with receptive fields outside the scotomas was similar to those found in normal animals (cv, Kolmogorov–Smirnov D = 0.707385, p = 0.583; DI, D = 0.836487, p = 0.388).
Figure 11.

Direction selectivity of MT neurons in animals with lesions and without lesions. Direction selectivity was quantified by cv (A) and DI (B).
Finally, given the significantly larger estimates of receptive field size for cells with receptive fields located inside the V1 scotoma (Fig. 9D), we explored the relationship between receptive field size (normalized by the expected size at the eccentricity of the receptive field) and direction selectivity (quantified by cv). This analysis revealed a significant positive correlation between the two measures (correlation coefficient = 0.35, p = 0.00077). Normalized receptive field size was also negatively correlated with response latency (correlation coefficient = −0.45, p = 0.003). These analyses indicated that largest receptive fields inside the scotomas tended to be the least direction selective and to have the shortest latencies. However, it is important to note that slopes of the regression lines were, in both cases, rather shallow, indicating that the effects were very subtle. In our data, as the normalized receptive field changes from the minimal to the maximal (−0.5 to 0.4), the values predicted by the regression line for cv only vary from 0.82 to 0.93 and those for latency from 62.5 to 45.5 ms.
Discussion
Our results demonstrate that many normal physiological features of MT neurons, including their brisk, short-latency responses to visual stimuli and receptive field topography, can be preserved in the adult brain despite the removal of V1 inputs from an early age. This is in contrast to monkeys with V1 damage incurred in adulthood, in which a significant proportion of MT neurons become nonresponsive, or show weak, long-latency responses (Rodman et al., 1989; Rosa et al., 2000; Azzopardi et al., 2003; Collins et al., 2003). This difference is likely to be a significant factor in the greater preservation of vision after V1 lesions in youth (Silvanto and Rees, 2011), attributable not only to neural processing performed within MT but also the role of this area in distribution of visual information (Ungerleider and Desimone, 1986; Krubitzer and Kaas, 1990).
The cortical blindness that follows V1 lesions in adults has been traditionally interpreted in light of a hierarchical model, whereby most visual inputs to extrastriate areas, including MT, are channeled through a processing stage that involves V1 (Movshon and Newsome, 1996; Born and Bradley, 2005). This interpretation is compatible with the profound effect of adult V1 lesions on the responses of MT neurons. In contrast, in the present cases, robust visual responses were observed throughout MT. This result demonstrates that compensatory plasticity involving other neural pathways to MT can overcome, to a large extent, the effects of the removal of V1 in early life. In normal adults, the thalamocortical pathways that bypass V1 (Stepniewska et al., 1999; O'Brien et al., 2001; Sincich et al., 2004; Warner et al., 2010) are usually regarded as relatively meager compared with the predominant visual input relayed via V1. However, it has been shown recently that, even from early stages of postnatal development, MT receives afferents from the retinorecipient part of the pulvinar complex, whereas V1 projections to MT develop gradually, over several postnatal weeks (Warner et al., 2012). In the present study, all lesions were placed during the period in which the pulvinar complex still receives dense retinal afferents, and its projections to MT outnumber V1 inputs. Thus, the removal of V1 inputs may have triggered plastic processes that allow the preservation and subsequent potentiation of a direct pathway from the retina, through the pulvinar, to MT. Alternatively, neurons in the part of MT affected by the V1 lesion may be driven by neurons in the LGN. Although the majority of LGN neurons die after V1 lesions early in life, some resist retrograde degeneration and undergo a process of hypertrophy, which may support expanded projections to extrastriate cortex (Hendrickson and Dineen, 1982; Rodman et al., 2001). We have, in fact, observed that hypertrophic LGN neurons form synapses with MT (Rosa et al., 2012). In cats, large lesions involving V1 in infancy are accompanied by preservation of strong responses in the lateral geniculate nucleus and amplification of the projections from this structure to extrastriate cortex (Tumosa et al., 1989; Lomber et al., 1995; MacNeil et al., 1997).
Despite the significant capacity for plastic reorganization revealed in immature MT, we found that direction selectivity, the hallmark response property of this area, failed to develop in cells with receptive fields within the V1 scotomas. In this respect, area MT differs from its putative carnivore homolog (the lateral suprasylvian area), in which direction-selective responses emerge despite removal of V1 and adjacent areas in the early postnatal period (Tong et al., 1984; Illig et al., 2000). The extent of the involvement of V1 in MT direction selectivity has been a controversial issue. The observation that MT neurons remain direction selective after V1 removal or inactivation has been interpreted as indicating that at least part of the circuitry underlying direction selectivity is intrinsic to MT (Rodman et al., 1989; Girard et al., 1992). However, others have suggested that the direction selectivity of MT cells is derived from previous computations occurring in V1 (Movshon and Newsome, 1996; Livingstone et al., 2001). The present results suggest that V1 inputs are likely to play a key instructive role in the genesis of direction selectivity in MT, as part of a developmental process occurring in early postnatal life. However, once the underlying neural circuits are formed, at least a population of MT cells appears to be able to retain this property independent of V1 (Rodman et al., 1989; Girard et al., 1992; Rosa et al., 2000).
In summary, whereas interactions between the developing area MT and projections from the pulvinar and/or lateral geniculate complexes are sufficient to establish basic response properties, the development of direction selectivity depends on an intact V1. One of the outstanding questions raised by our findings is the duration of the critical period for the reorganization of visual pathways that lead to the observed relative sparing of function in MT. Our results obtained in animals lesioned at 2 and 6 postnatal weeks were not different but stood in marked contrast with observations after adult lesions. In reality, the dependence of MT responses on V1 inputs is likely to decline gradually, as indicated by anatomical results in the marmoset (Warner et al., 2012) and the analysis of clinical cases (Blythe et al., 1987; Guzzetta et al., 2010; Silvanto and Rees, 2011). Considering that there is considerable scope for improvement in visual function over time, even after V1 lesions in adults (Das and Huxlin, 2010), knowledge about the physiological mechanisms underlying differences in visual function may provide clues to help the future design of treatments that make the best possible use of spared neuronal circuits.
Footnotes
The research was funded by National Health and Medical Research Council Grants 491022 and 1003906 and by Australian Research Council's Special Research Initiative on Bionic Vision and Technology Grant SRI 100006. We thank Paul Martin, Farshad Mansouri, and Rowan Tweedale for comments in this manuscript. We also thank Janssen-Cilag for donation of sufentanil citrate.
The authors declare no competing financial interests.
References
- Albright TD. Direction and orientation selectivity of neurons in visual area MT of the macaque. J Neurophysiol. 1984;52:1106–1130. doi: 10.1152/jn.1984.52.6.1106. [DOI] [PubMed] [Google Scholar]
- Albright TD, Desimone R. Local precision of visuotopic organization in the middle temporal area (MT) of the macaque. Exp Brain Res. 1987;65:582–592. doi: 10.1007/BF00235981. [DOI] [PubMed] [Google Scholar]
- Allman JM, Kaas JH. A representation of the visual field in the caudal third of the middle temporal gyrus of the owl monkey (Aotus trivirgatus) Brain Res. 1971;31:85–105. doi: 10.1016/0006-8993(71)90635-4. [DOI] [PubMed] [Google Scholar]
- Azzopardi P, Fallah M, Gross CG, Rodman HR. Response latencies of neurons in visual areas MT and MST of monkeys with striate cortex lesions. Neuropsychologia. 2003;41:1738–1756. doi: 10.1016/S0028-3932(03)00176-3. [DOI] [PubMed] [Google Scholar]
- Blythe IM, Kennard C, Ruddock KH. Residual vision in patients with retrogeniculate lesions of the visual pathways. Brain. 1987;110:887–905. doi: 10.1093/brain/110.4.887. [DOI] [PubMed] [Google Scholar]
- Born RT, Bradley DC. Structure and function of visual area MT. Annu Rev Neurosci. 2005;28:157–189. doi: 10.1146/annurev.neuro.26.041002.131052. [DOI] [PubMed] [Google Scholar]
- Bourne JA, Rosa MG. Hierarchical development of the primate visual cortex, as revealed by neurofilament immunoreactivity: early maturation of the middle temporal area (MT) Cereb Cortex. 2006;16:405–414. doi: 10.1093/cercor/bhi119. [DOI] [PubMed] [Google Scholar]
- Chandolia RK, Luetjens CM, Wistuba J, Yeung CH, Nieschlag E, Simoni M. Changes in endocrine profile and reproductive organs during puberty in the male marmoset monkey (Callithrix jacchus) Reproduction. 2006;132:355–363. doi: 10.1530/rep.1.01186. [DOI] [PubMed] [Google Scholar]
- Chaplin TA, Yu HH, Rosa MG. Representation of the visual field in the primary visual area of the marmoset monkey: magnification factors, point-image size, and proportionality to retinal ganglion cell density. J Comp Neurol. 2013;521:1001–1019. doi: 10.1002/cne.23215. [DOI] [PubMed] [Google Scholar]
- Collins CE, Lyon DC, Kaas JH. Responses of neurons in the middle temporal visual area after long-standing lesions of the primary visual cortex in adult new world monkeys. J Neurosci. 2003;23:2251–2264. doi: 10.1523/JNEUROSCI.23-06-02251.2003. [DOI] [PMC free article] [PubMed] [Google Scholar]
- Das A, Huxlin KR. New approaches to visual rehabilitation for cortical blindness: outcomes and putative mechanisms. Neuroscientist. 2010;16:374–387. doi: 10.1177/1073858409356112. [DOI] [PubMed] [Google Scholar]
- Dubner R, Zeki SM. Response properties and receptive fields of cells in an anatomically defined region of the superior temporal sulcus in the monkey. Brain Res. 1971;35:528–532. doi: 10.1016/0006-8993(71)90494-X. [DOI] [PubMed] [Google Scholar]
- Fiorani M, Jr, Gattass R, Rosa MG, Sousa AP. Visual area MT in the Cebus monkey: location, visuotopic organization, and variability. J Comp Neurol. 1989;287:98–118. doi: 10.1002/cne.902870108. [DOI] [PubMed] [Google Scholar]
- Friedman HS, Priebe CE. Estimating stimulus response latency. J Neurosci Methods. 1998;83:185–194. doi: 10.1016/S0165-0270(98)00075-2. [DOI] [PubMed] [Google Scholar]
- Girard P, Salin PA, Bullier J. Response selectivity of neurons in area MT of the macaque monkey during reversible inactivation of area V1. J Neurophysiol. 1992;67:1437–1446. doi: 10.1152/jn.1992.67.6.1437. [DOI] [PubMed] [Google Scholar]
- Gross CG, Moore T, Rodman HR. Visually guided behavior after V1 lesions in young and adult monkeys and its relation to blindsight in humans. Prog Brain Res. 2004;144:279–294. doi: 10.1016/S0079-6123(03)14419-6. [DOI] [PubMed] [Google Scholar]
- Grüsser OJ, Landis T. The visual world shrinks: visual field defects, hemianopias and cortical blindness. In: Grüsser OJ, Landis T, editors. Vision and visual dysfunction, Vol 12, Visual agnosias and other disturbances of visual perception and cognition. London: Macmillan; 1992. pp. 136–157. [Google Scholar]
- Guzzetta A, D'Acunto G, Rose S, Tinelli F, Boyd R, Cioni G. Plasticity of the visual system after early brain damage. Dev Med Child Neurol. 2010;52:891–900. doi: 10.1111/j.1469-8749.2010.03710.x. [DOI] [PubMed] [Google Scholar]
- Hendrickson A, Dineen JT. Hypertrophy of neurons in dorsal lateral geniculate nucleus following striate cortex lesions in infant monkeys. Neurosci Lett. 1982;30:217–222. doi: 10.1016/0304-3940(82)90402-5. [DOI] [PubMed] [Google Scholar]
- Horton JC, Hoyt WF. The representation of the visual field in human striate cortex: a revision of the classic Holmes map. Arch Ophthalmol. 1991;109:816–824. doi: 10.1001/archopht.1991.01080060080030. [DOI] [PubMed] [Google Scholar]
- Illig KR, Danilov YP, Ahmad A, Kim CB, Spear PD. Functional plasticity in extrastriate visual cortex following neonatal visual cortex damage and monocular enucleation. Brain Res. 2000;882:241–250. doi: 10.1016/S0006-8993(00)02902-4. [DOI] [PubMed] [Google Scholar]
- Krubitzer LA, Kaas JH. Cortical connections of MT in four species of primates: areal, modular, and retinotopic patterns. Vis Neurosci. 1990;5:165–204. doi: 10.1017/S0952523800000213. [DOI] [PubMed] [Google Scholar]
- Leopold DA. Primary visual cortex: awareness and blindsight. Annu Rev Neurosci. 2012;35:91–109. doi: 10.1146/annurev-neuro-062111-150356. [DOI] [PMC free article] [PubMed] [Google Scholar]
- Livingstone MS, Pack CC, Born RT. Two-dimensional structure of MT receptive fields. Neuron. 2001;30:781–793. doi: 10.1016/S0896-6273(01)00313-0. [DOI] [PubMed] [Google Scholar]
- Lomber SG, MacNeil MA, Payne BR. Amplification of thalamic projections to middle suprasylvian cortex following ablation of immature primary visual cortex in the cat. Cereb Cortex. 1995;5:166–191. doi: 10.1093/cercor/5.2.166. [DOI] [PubMed] [Google Scholar]
- MacNeil MA, Lomber SG, Payne BR. Thalamic and cortical projections to middle suprasylvian cortex of cats: constancy and variation. Exp Brain Res. 1997;114:24–32. doi: 10.1007/PL00005620. [DOI] [PubMed] [Google Scholar]
- Maunsell JH, Van Essen DC. Functional properties of neurons in the middle temporal visual area of the macaque monkey. I. Selectivity for stimulus direction, speed, and orientation. J Neurophysiol. 1983;49:1127–1147. doi: 10.1152/jn.1983.49.5.1127. [DOI] [PubMed] [Google Scholar]
- Moore T, Rodman HR, Repp AB, Gross CG, Mezrich RS. Greater residual vision in monkeys after striate cortex damage in infancy. J Neurophysiol. 1996;76:3928–3933. doi: 10.1152/jn.1996.76.6.3928. [DOI] [PubMed] [Google Scholar]
- Movshon JA, Newsome WT. Visual response properties of striate cortical neurons projecting to area MT in macaque monkeys. J Neurosci. 1996;16:7733–7741. doi: 10.1523/JNEUROSCI.16-23-07733.1996. [DOI] [PMC free article] [PubMed] [Google Scholar]
- O'Brien BJ, Abel PL, Olavarria JF. The retinal input to calbindin-D28k-defined subdivisions in macaque inferior pulvinar. Neurosci Lett. 2001;312:145–148. doi: 10.1016/S0304-3940(01)02220-0. [DOI] [PubMed] [Google Scholar]
- Paxinos G, Watson C, Petrides M, Rosa MGP, Tokuno H. The marmoset brain in stereotaxic coordinates. New York: Academic; 2012. [Google Scholar]
- Payne BR, Lomber SG. Plasticity of the visual cortex after injury: what's different about the young brain? Neuroscientist. 2002;8:174–185. doi: 10.1177/107385840200800212. [DOI] [PubMed] [Google Scholar]
- Ringach DL, Shapley RM, Hawken MJ. Orientation selectivity in macaque V1: diversity and laminar dependence. J Neurosci. 2002;22:5639–5651. doi: 10.1523/JNEUROSCI.22-13-05639.2002. [DOI] [PMC free article] [PubMed] [Google Scholar]
- Rodman HR, Gross CG, Albright TD. Afferent basis of visual response properties in area MT of the macaque. I. Effects of striate cortex removal. J Neurosci. 1989;9:2033–2050. doi: 10.1523/JNEUROSCI.09-06-02033.1989. [DOI] [PMC free article] [PubMed] [Google Scholar]
- Rodman HR, Sorenson KM, Shim AJ, Hexter DP. Calbindin immunoreactivity in the geniculo-extrastriate system of the macaque: implications for heterogeneity in the koniocellular pathway and recovery from cortical damage. J Comp Neurol. 2001;431:168–181. doi: 10.1002/1096-9861(20010305)431:2<168::AID-CNE1063>3.0.CO;2-N. [DOI] [PubMed] [Google Scholar]
- Rosa MG, Elston GN. Visuotopic organization and neuronal response selectivity for direction of motion in visual areas of the caudal temporal lobe of the marmoset monkey (Callithrix jacchus): middle temporal area, middle temporal crescent, and surrounding cortex. J Comp Neurol. 1998;393:505–527. doi: 10.1002/(SICI)1096-9861(19980420)393:4<505::AID-CNE9>3.0.CO;2-4. [DOI] [PubMed] [Google Scholar]
- Rosa MG, Tweedale R, Elston GN. Visual responses of neurons in the middle temporal area of new world monkeys after lesions of striate cortex. J Neurosci. 2000;20:5552–5563. doi: 10.1523/JNEUROSCI.20-14-05552.2000. [DOI] [PMC free article] [PubMed] [Google Scholar]
- Rosa MG, Yu HH, Chaplin TA, Verma R, Reser DH, Worthy KH. Anatomical and physiological organisation of the lateral geniculate nucleus following lesions of primary visual cortex in early life. Proc Aust Neurosci Soc. 2012;2012:15. [Google Scholar]
- Silvanto J, Rees G. What does neural plasticity tell us about role of primary visual cortex (V1) in visual awareness? Front Psychology. 2011;2:6. doi: 10.3389/fpsyg.2011.00006. [DOI] [PMC free article] [PubMed] [Google Scholar]
- Sincich LC, Park KF, Wohlgemuth MJ, Horton JC. Bypassing V1: a direct geniculate input to area MT. Nat Neurosci. 2004;7:1123–1128. doi: 10.1038/nn1318. [DOI] [PubMed] [Google Scholar]
- Stepniewska I, Qi HX, Kaas JH. Do superior colliculus projection zones in the inferior pulvinar project to MT in primates? Eur J Neurosci. 1999;11:469–480. doi: 10.1046/j.1460-9568.1999.00461.x. [DOI] [PubMed] [Google Scholar]
- Stoerig P, Cowey A. Blindsight in man and monkey. Brain. 1997;120:535–559. doi: 10.1093/brain/120.3.535. [DOI] [PubMed] [Google Scholar]
- Swindale NV. Orientation tuning curves: empirical description and estimation of parameters. Biol Cybern. 1998;78:45–56. doi: 10.1007/s004220050411. [DOI] [PubMed] [Google Scholar]
- Tong L, Kalil RE, Spear PD. Critical periods for functional and anatomical compensation in lateral suprasylvian visual area following removal of visual cortex in cats. J Neurophysiol. 1984;52:941–960. doi: 10.1152/jn.1984.52.5.941. [DOI] [PubMed] [Google Scholar]
- Tumosa N, McCall MA, Guido W, Spear PD. Responses of lateral geniculate neurons that survive long-term visual damage in kittens and adult cats. J Neurosci. 1989;9:280–298. doi: 10.1523/JNEUROSCI.09-01-00280.1989. [DOI] [PMC free article] [PubMed] [Google Scholar]
- Ungerleider LG, Desimone R. Cortical connections of visual area MT in the macaque. J Comp Neurol. 1986;248:190–222. doi: 10.1002/cne.902480204. [DOI] [PubMed] [Google Scholar]
- Van Essen DC, Drury HA, Dickson J, Harwell J, Hanlon D, Anderson CH. An integrated software system for surface-based analyses of cerebral cortex. J Am Med Inform Assoc. 2001;8:443–459. doi: 10.1136/jamia.2001.0080443. [DOI] [PMC free article] [PubMed] [Google Scholar]
- Warner CE, Goldshmit Y, Bourne JA. Retinal afferents synapse with relay cells targeting the middle temporal area in the pulvinar and lateral geniculate nuclei. Front Neuroanat. 2010;4:8. doi: 10.3389/neuro.05.008.2010. [DOI] [PMC free article] [PubMed] [Google Scholar]
- Warner CE, Kwan WC, Bourne JA. The early maturation of visual cortical area MT is dependent on input from the retinorecipient medial portion of the inferior pulvinar. J Neurosci. 2012;32:17073–17085. doi: 10.1523/JNEUROSCI.3269-12.2012. [DOI] [PMC free article] [PubMed] [Google Scholar]
- Weiskrantz L. Blindsight: a case study and its implications. New York: Oxford UP; 1990. [Google Scholar]
- Weller RE, Kaas JH. Parameters affecting the loss of ganglion cells of the retina following ablations of striate cortex in primates. Vis Neurosci. 1989;3:327–349. doi: 10.1017/S0952523800005514. [DOI] [PubMed] [Google Scholar]
- Werth R. Visual functions without the occipital lobe or after cerebral hemispherectomy in infancy. Eur J Neurosci. 2006;24:2932–2944. doi: 10.1111/j.1460-9568.2006.05171.x. [DOI] [PubMed] [Google Scholar]
- Yu HH, Rosa MG. A simple method for creating wide-field visual stimulus for electrophysiology: mapping and analyzing receptive fields using a hemispheric display. J Vis. 2010;10:15. doi: 10.1167/10.14.15. [DOI] [PubMed] [Google Scholar]
- Yu HH, Verma R, Yang Y, Tibballs HA, Lui LL, Reser DH, Rosa MG. Spatial and temporal frequency tuning in striate cortex: functional uniformity and specializations related to receptive field eccentricity. Eur J Neurosci. 2010;31:1043–1062. doi: 10.1111/j.1460-9568.2010.07118.x. [DOI] [PubMed] [Google Scholar]
- Yu HH, Chaplin TA, Davies AJ, Verma R, Rosa MG. A specialized area in limbic cortex for fast analysis of peripheral vision. Curr Biol. 2012;22:1351–1357. doi: 10.1016/j.cub.2012.05.029. [DOI] [PubMed] [Google Scholar]