

Abstract
Young infants discriminate phonetically relevant speech contrasts in a universal manner, that is, similarly across languages. This ability fades by 12 months of age as the brain builds language-specific phonemic maps and increasingly responds preferentially to the infant's native language. However, the neural mechanisms that underlie the development of infant preference for native over non-native phonemes remain unclear. Since gamma-band power is known to signal infants' preference for native language rhythm, we hypothesized that it might also indicate preference for native phonemes. Using high-density electroencephalogram/event-related potential (EEG/ERP) recordings and source-localization techniques to identify and locate the ERP generators, we examined changes in brain oscillations while 6-month-old human infants from monolingual English settings listened to English and Spanish syllable contrasts. Neural dynamics were investigated via single-trial analysis of the temporal-spectral composition of brain responses at source level. Increases in 4–6 Hz (theta) power and in phase synchronization at 2–4 Hz (delta/theta) were found to characterize infants' evoked responses to discrimination of native/non-native syllable contrasts mostly in the left auditory source. However, selective enhancement of induced gamma oscillations in the area of anterior cingulate cortex was seen only during native contrast discrimination. These results suggest that gamma oscillations support syllable discrimination in the earliest stages of language acquisition, particularly during the period in which infants begin to develop preferential processing for linguistically relevant phonemic features in their environment. Our results also suggest that by 6 months of age, infants already treat native phonemic contrasts differently from non-native, implying that perceptual specialization and establishment of enduring phonemic memory representations have been initiated.
Introduction
During the first year of life, infants' perceptual abilities develop from a wide-ranging capacity to discriminate general sensory information to a more finely tuned capability that favors processing of selective, more relevant input from their environment (Lewkowicz and Ghazanfar, 2009). Ontogenic specialization (perceptual narrowing) promotes neural representation and efficient processing of essential information, and is particularly important when infants assemble the foundations of their native language (Werker and Tees, 2005; Gervain and Mehler, 2010).
As early as 30 weeks of gestation, the cortical organization of premature neonates allows discrimination of phonemic variations between syllables (Mahmoudzadeh et al., 2013; Maitre et al., 2013). Subsequently, exposure to native language in the natural environment fosters construction of language-specific phonemic maps and commitment to their native language (Kuhl et al., 2006). As infants become language experts they preferentially process characteristic features of their native language (Werker et al., 2012). Newborns and young infants begin favoring distinctive suprasegmental elements (rhythm, intonation, stress) of their own language (Mehler et al., 1988; Jusczyk, 2002; Kuhl, 2004; Friederici et al., 2007). Shortly after birth, they show enhanced electrophysiological responses (Cheour et al., 1998) and better behavioral categorization of familiar than nonfamiliar vowels (Kuhl et al., 1992; Moon et al., 2013). At 6–8 months of age, infants still discriminate most native and non-native consonant contrasts, but ∼10–12 months, the ability to discriminate foreign contrasts attenuates whereas discrimination of native language phonemes strengthens (Werker and Tees, 1984; Best et al., 1995; Rivera-Gaxiola et al., 2005; Tsao et al., 2006). Despite strong evidence about the time line of transition from universal phoneme discrimination to native-language phoneme specialization, the neural mechanisms underlying this transition remain unclear.
In adults, speech perception is considered a multitime resolution process, involving brain activation of synchronized oscillatory activity in delta, theta, and gamma frequency bands (Poeppel et al., 2008; Giraud and Poeppel, 2012). Therefore, examining spectrotemporal brain dynamics in infants may reveal basic mechanisms that relate to language acquisition. Electrical signals recorded at the scalp reflect variations in neuronal oscillatory activity (Başar et al., 2000; Buzsáki and Draguhn, 2004) and provide information about infant brain function at rest (Benasich et al., 2008) or after stimulus presentation (Peña et al., 2010). During sensory stimulation neuronal networks respond with transient oscillatory enhancement of evoked (phase-locked) and induced (nonphase-locked) rhythmic activity (Başar et al., 2000; Buzsáki, 2006).
Enhancement of induced gamma power was found in 3 month olds when they listened to utterances in their native, and in a rhythmically similar language, implying analogous neural mechanisms in processing native and non-native languages (Peña et al., 2010). However, at 6 months, gamma power increased only for native sentences' processing, suggesting a specific role for gamma oscillations in native language specialization. In the current study we used time-frequency analysis of source-localized electroencephalogram (EEG) activity to examine brain dynamics in 6-month-old infants during discrimination of native and non-native phonemic contrasts. We hypothesize that variations in the spectrotemporal dynamics of neuronal oscillations, particularly gamma oscillations, in response to syllable contrasts may reflect, at least in part, ongoing native language specialization at the phonemic level.
Materials and Methods
Participants.
The present study includes a subset of 28 (19 males), 6-month-old typically developing infants that were originally part of a large developmental study. All infants had uneventful prenatal and perinatal circumstances and were born healthy, full-term (mean gestational age: 39.84 weeks, SD: 1.36), and with normal birth weight (mean: 3554.6 g, SD: 409.4) into middle to upper-middle socioeconomic class (Hollingshead, 1975) monolingual English families. Infants were recruited from urban and suburban communities in New Jersey, and had no family history of specific language impairment, autism, hearing loss, no repeated episodes of otitis media, or other medical, neurological, or psychiatric disorders. Parents were compensated for their time and infants received a toy after the visit. The study was conducted in accordance with the Declaration of Helsinki and informed consent approved by the Rutgers University Human Subjects Institutional Review Board was obtained before inclusion in the study.
Procedure
Event-related potentials.
Stimuli: As infants are mapping phonemic representations at this age, consonant-vowel (CV) syllables were used to investigate at the prelexical level, sensory processing of speech sounds from two phonemic categories: those that cross and those that do not cross native phonemic boundaries. Three CV syllables that varied in voice-onset time (VOT) were presented to the infants. VOT is an acoustic feature characteristic of stop consonants, defined by the interval between the release of air and the onset of vocal-cord vibration (voicing), critical for perceptual discrimination of phonemes that have the same place of articulation (Eimas et al., 1971; Abramson and Lisker, 1973; Eimas, 1974; Aslin et al., 1981). The standard stimulus was a CV syllable phonetically relevant in both English and Spanish and heard as /da/ by native English speakers and as /ta/ by native Spanish speakers (VOT: +12 ms). Two CV syllables were used as deviants: a native English deviant /ta/ (VOT: +46 ms) and a non-native Spanish deviant, phonetically relevant and heard in Spanish as /da/ (VOT: −24 ms). Thus, both phonemic contrasts had similar VOT divergence: the VOT difference between the standard and native deviant was 34 ms and between the standard and non-native deviant 36 ms. The duration of each CV syllable was 230 ms including 5 ms rise and fall times with a fundamental frequency of 180 Hz (Fig. 1). The stimuli were presented in a passive oddball paradigm that contained a standard (80%), a native deviant (10%), and a non-native deviant (10%) for a total of 1000 stimuli. The stimulus onset-to-onset interval was 930 ms (a more detailed description of these stimuli and the paradigm used can be found in Rivera-Gaxiola et al., 2005). Auditory stimuli were matched for intensity and presented binaurally in a sound-attenuated free field environment at 69 dB SPL. In a previous study, the same stimuli were presented to both English-raised and Spanish-raised infants and the results showed that ERP responses from 10- to 13-month-old infants of different language backgrounds were similar for their respective native contrast processing (Rivera-Gaxiola et al., 2007). To probe the stimuli presented to infants, it was tested in a sample of 16 healthy, right-handed monolingual English adults (8 males) mean age 25.4 years confirming that adults only discriminated the native syllable contrast.
Figure 1.
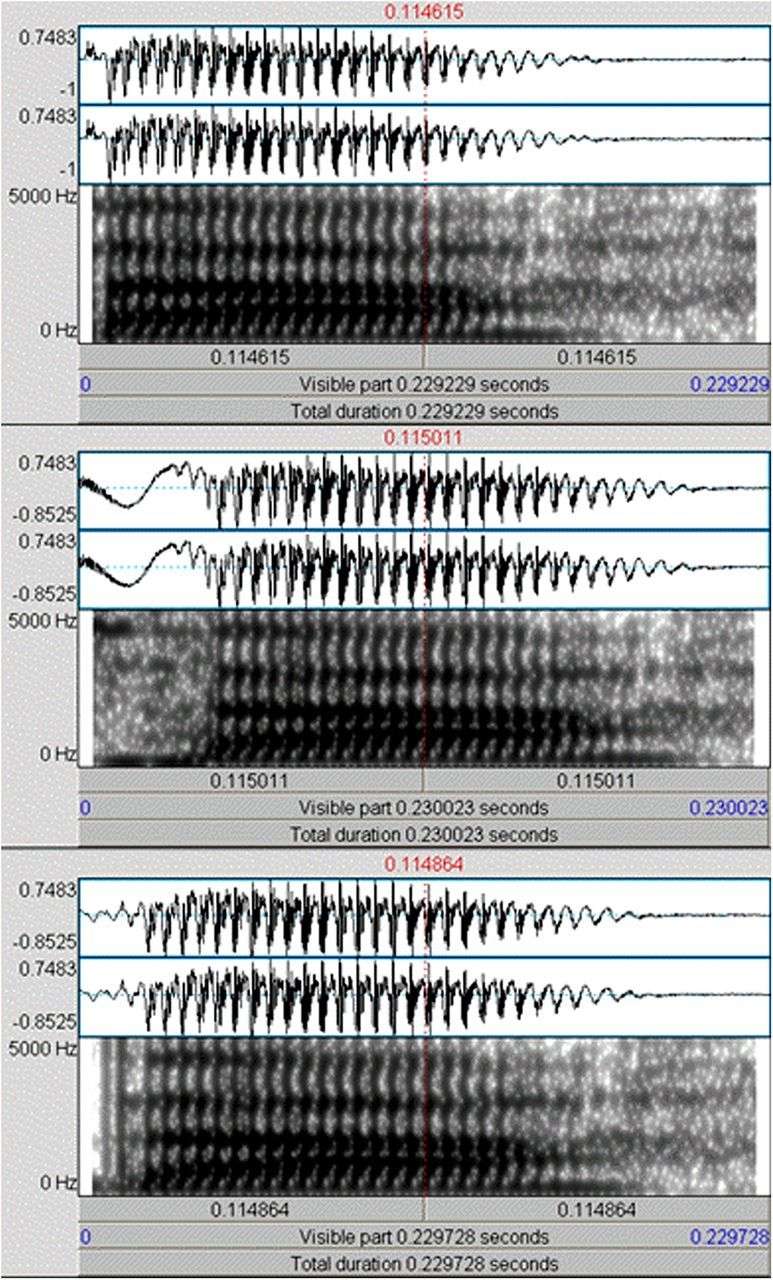
Sound wave and spectrogram of the CV syllables presented to the infants. First row: syllable used as standard, phonetically relevant in both English (heard as /da/) and Spanish (heard as /ta/), VOT +12 ms. Second row: voiced syllable used as native deviant phonetically relevant in English (heard as /ta/), VOT +46 ms. Third row: voiceless syllable used as non-native deviant, phonetically relevant in Spanish (heard as /da/), VOT −24 ms.
EEG recording and data processing.
Dense array EEG/ERP recordings were acquired while participants were seated in their parent's lap, watching a silent movie or entertained with silent toys to keep them calm and engaged. EEG was recorded using a 62 Ag/AgCl channel EGI sensor net (Electrical Geodesics) with vertex electrode used as on-line reference, sampling rate of 250 Hz, and high/low pass filters of 0.1 and 100 Hz, respectively. Artifact correction of eye movements was completed on the raw data using Brain Electrical Source Analysis (BESA GmbH) software's automatic correction algorithm (Principal Component Analysis method). ERPs were processed with BESA software using an off-line bandpass filter of 1–15 Hz and re-referenced to an average reference. EEG data were then segmented into epochs according to stimulus type (standard, native deviant, and non-native deviant), with 300 ms prestimulus and 930 ms poststimulus time, and 100 ms before stimulus onset used as baseline. Epochs with signals exceeding ±300 μV from the baseline were excluded. A minimum of 70% artifact-free epochs was required for each stimulus (average for standard: 149, range: 138–178; for native deviant: 77, range: 70–92; for non-native deviant: 75, range: 70–87) to be included in ERP averaging. To ensure similar signal-to-noise ratio between responses to standard and deviant contrasts, only the standard epochs that preceded the deviants were included in the averaged standard response.
Magnetic resonance imaging.
Given that the infant brain and surrounding structures undergo large anatomical changes throughout the first year of life, structural magnetic resonance images (MRIs) were acquired for a subset of the sample, and age-appropriate tissue thicknesses and conductivity values were calculated and used in locating the generators of the ERP responses (Hämäläinen et al., 2011; Ortiz-Mantilla et al., 2012). MR images were obtained from nonsedated, naturally sleeping infants, 16 of whom were participants in this study. In the imaging suite, normal bedtime routines for the child were replicated as closely as possible by including soft lullaby music, rocking chair, crib, and any other objects or materials that might encourage sleeping (for a detailed explanation of the scanning procedures, see Raschle et al., 2012). T1-weighted 3D SPGR images were collected on a GE 1.5 T Echospeed MRI scanner using a standard head coil. The following parameters were used for T1 acquisition: field of view = 25 cm, TR/TE = 24/10 ms, flip angle = 30°, matrix size = 256 × 192, slice thickness = 1.5 mm, number of slices = 124, sagittal orientation, bandwidth = 15.63 kHz.
An MRI brain template for 6 month olds was created by affine transform of 19 MRI images into the MRI space of an infant with the median age of the sample and combined into an average image. Using the BrainVoyager QX program the average brain template was aligned and transformed into Talairach space. Original individual and average (template) MRIs were imported into BESA Research 5.3 software for source localization of the ERP generators using age-appropriate parameters for thickness (skull: 1.5 mm; scalp: 2.5 mm; subarachnoid space: 1.7 mm) and conductivity (skull bone: 0.0581) of the infant structures (for a complete description of the technique used, please refer to Hämäläinen et al., 2011; Ortiz-Mantilla et al., 2012).
Source localization of ERP generators.
To localize the generators of the ERP responses, the data were mapped onto the MR images using BESA and Brain Voyager QX software programs (Scherg et al., 2010). For 16 infants, the standard electrode positions were fitted onto their individual MRIs. Twelve infants, for whom individual MRIs were not available, had the electrode positions fitted onto the average MRI template. Peaks for responses to standard and to native and non-native deviants were identified from the grand average waveform and from the individual ERPs; a time window of ±20 ms around the peak was used for dipole fitting. A dipole source model (Scherg and Von Cramon, 1985) using a 4-shell ellipsoidal head model, and a confirmatory distributed source model calculated using Classic LORETA Recursively Applied (CLARA) method (Hoechstetter et al., 2010) were applied to the ERPs for source analysis. Peaks for each condition and source were identified and amplitude and latency of the source peaks submitted to statistical analyses.
Single-trial time-frequency analyses in source space.
Examination of spectrotemporal changes in event-related oscillations (EROs) during perception of native and non-native contrasts was accomplished using single-trial analysis in source space. Data from 25 infants that had reliable source localization of the generators of the ERP responses for all three stimuli were submitted to time-frequency analyses using the coherence module available in BESA Research software. In the first step, the individual source montages generated during dipole fitting of the first positive ERP response for each stimulus were applied to the corresponding raw EEG recording to transform the continuous EEG into source space (Hoechstetter et al., 2004). To preserve all frequency information, no filters were applied to the raw EEG data. A complex demodulation method with 1 Hz wide frequency bins and 50 ms time resolution, from −300 to 930 ms in the range of 2–80 Hz was used for decomposing the single-trial EEG data into time-frequency representation. To examine event-related changes in oscillatory amplitude of frequency bands relative to the baseline (Tallon-Baudry et al., 1996; Hari and Salmelin, 1997; Tallon-Baudry and Bertrand, 1999) we used temporal spectral evolution (TSE). The TSE value is comprised of induced (random-phase/nonphase-locked) and evoked (phase-locked) changes in amplitude of oscillatory activity related to stimulus presentation. To isolate the specific contribution of random-phase from locked-phase oscillations the evoked response signal was subtracted from the single-trial time series before computation of the TSE, which allowed separation of the induced activity (Hoechstetter et al., 2004). The intertrial phase-locking (ITPL) factor measures variations in phase alignment thus indexing evoked oscillatory activity, and in particular, how consistently the phase at different frequency bands locks to stimulation presented across trials over time (Tallon-Baudry et al., 1996; Tallon-Baudry and Bertrand, 1999). ITPL is reported between 0 and 1 with 0 indicating random phase across trials and 1 perfect intertrial phase alignment of the neural oscillations. TSE overall, TSE induced, and ITPL measurements were obtained at the three sources previously identified: left and right auditory cortices and frontal at the level of the anterior cingulate cortex (ACC) for each of the three stimuli (standard, native deviant, non-native deviant) presented to the infants. TSE and ITPL individual results generated for each source and stimulus were exported to MATLAB (MathWorks) for plotting graphics across subjects.
Statistical analyses
The statistical analyses were conducted using PASW Statistics 19 (SPSS) software. The positive and negative ERP peak amplitudes for the three stimuli were confirmed to be significantly different from zero baseline using one-sample t tests (ps = 0.000). The source strength and latency were examined separately using 3 × 3 [Source (left auditory, right auditory, ACC) × Stimulus (standard, native deviant, non-native deviant)] repeated-measures ANOVA. For time-frequency analysis, statistics were conducted in two steps: First, we detected time-frequency regions with significant increase in overall amplitude (TSE) and phase synchrony (ITPL) using BESA Statistics 1.0 (BESA GmbH) software. BESA Statistics calculates a preliminary Student's t test between conditions per data point followed by parameter-free permutation testing in combination with data clustering to deal with the problem of having multiple comparisons (a complete description of the method used can be found in the BESA Statistics Manual, 2011). In this way, we identified “data clusters of significance” between conditions across participants in the time-frequency domain. In the second step, repeated-measures ANOVAs [Source (left auditory, right auditory, ACC) × Stimulus (standard, native deviant, non-native deviant)] were performed using the mean of each significant cluster as follows: TSE for theta (from 4 to 6 Hz between 150 and 400 ms) and gamma (from 30 to 34 Hz between 100 and 400 ms) frequency bands, and ITPL for the delta/theta (from 2 to 4 Hz between 100 and 300 ms) frequency range. Post hoc t tests were conducted to examine significant main effects and interactions. Additionally, to investigate laterality, paired t test comparisons were conducted between the standard and native deviant and the standard and non-native deviant at left and right auditory sources for TSE and ITPL measurements.
Results
Source analyses
Infant ERP responses to the standard, native deviant, and non-native deviant stimuli closely resembled those reported in other studies using the same paradigm (Rivera-Gaxiola et al., 2005, 2007; Ortiz-Mantilla et al., 2012). Each syllable's response was characterized by a frontocentral (Fcz) positive-going deflection at ∼200 ms, followed by a negative deflection at ∼400 ms (Fig. 2), with inversion of polarity observed at the mastoids and posterior channels.
Figure 2.

Grand average ERP waveforms are shown for infants at Fcz channel. Response to the native deviant is shown in red, non-native deviant in green, and standard in blue. Negativity is plotted up. Amplitude of the responses is given in microvolts (μV) and latency in milliseconds (ms).
Source locations of the generators of infant ERP responses to native deviant, non-native deviant, and standard stimuli were identified from the original ERP waveforms. To examine prelexical, phonemic sensory processing we focused our source analysis on the first positive ERP response occurring at ∼200 ms after stimulus presentation. As the posterior superior temporal lobe bilaterally has been suggested to be the primary substrate for constructing sound-based representation of speech (Hickok and Poeppel, 2000) a two-dipole model was freely fitted for the first positive ERP response of each of the stimuli. The dipoles were placed in both auditory cortices explaining ∼85% of the variance. Distributed source model (CLARA) confirmed bilateral activation to the auditory cortex, showing an additional source of activation in the mid-frontal area, at the level of the ACC. A three-dipole model was then used, finding and locating sources at left and right auditory cortices and at the level of ACC for each of the stimuli (Fig. 3). The positive response for the native deviant stimulus could be modeled for all 28 infants, the response for the standard for 26 infants, and the response for the non-native deviant in 25 children. Thus, to allow comparison between the responses to both syllable contrasts only data from the 25 participants that had reliably modeled sources at all locations are included in the present study. Source activity for all three stimuli was convergently located (Fig. 3) and the source waveforms followed the positive–negative complex pattern observed in the original ERP waveforms (Fig. 4). The three-dipole model for the positive peak explained ∼96% of the variance (residual variance in the grand average for standard: 4.0, native deviant: 3.9; non-native deviant: 3.0).
Figure 3.
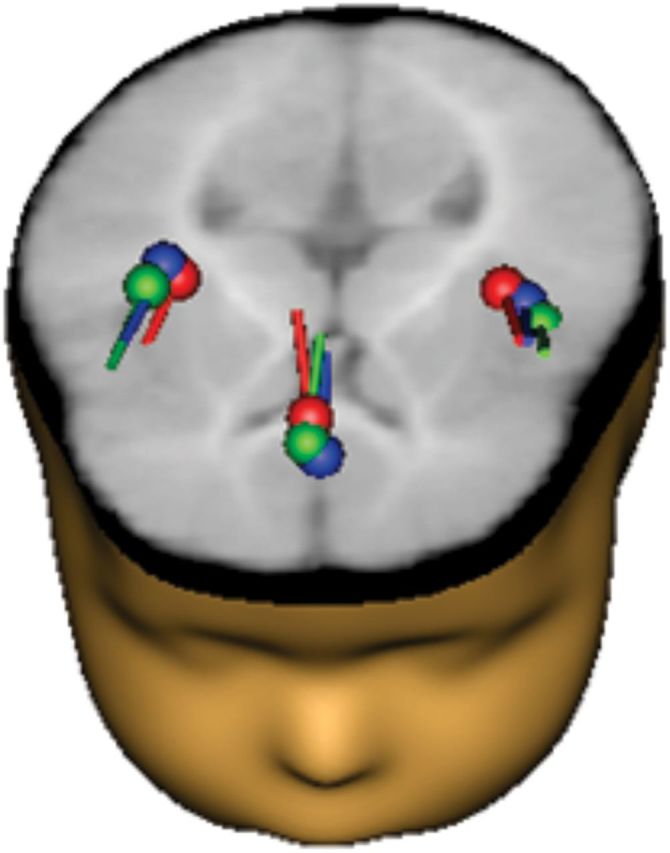
Dipole source solutions based on grand average ERPs for the positive response are shown in a 6-month-old infant brain template and reconstructed head surface; similar source locations at the auditory cortices and ACC were found for each stimulus (native deviant, red; non-native deviant, green; standard, blue).
Figure 4.

Grand average source waveforms of the responses to the stimuli. A–C, Native deviant (A; red), non-native deviant (B; green), and Standard (C; blue) are shown at left auditory cortex (LAC) in solid color line, at right auditory cortex (RAC) in small-dotted color line, and in the ACC in large-dotted color line. Positive is plotted up; strength of the source dipole moment is given in nanoampere meters (nAm) and latency in milliseconds (ms).
A 3 × 3 Source × Stimulus ANOVA examining amplitude of the positive response in the source waveforms revealed a main effect of source (F(2,46) = 13.639, p = 0.000) and main effect of stimulus (F(2,46) = 12.555, p = 0.000, ε = 0.794). The ACC source showed less strength as compared with the left and right auditory sources (ps < 0.002). The peak amplitude to the standard stimulus was smaller than those to native and non-native deviant stimuli (ps < 0.003) supporting the premise that at 6 months, infants do discriminate phonemes in both native and non-native languages. Source analyses of the peak latency also showed source (F(2,46) = 8.184, p = 0.004, ε = 0.662) and stimulus main effects (F(2,46) = 10.579, p = 0.000). The ACC source peaked earlier than the left auditory source (p = 0.001) and the response latency to the standard stimulus was shorter than either of the deviant stimuli (ps < 0.009).
Time-frequency analyses
To measure amplitude and synchrony of neuronal oscillations as a result of syllable presentation, single-trial epochs were decomposed into time-frequency representation in source space. Grand average plots showed enhanced oscillatory activity relative to baseline in theta and gamma bands for TSE (Fig. 5) and in the delta/theta band for ITPL synchronized activity (Fig. 6). Permutation testing in combination with data clustering was then conducted in these frequency ranges to identify clusters with significant changes in magnitude and phase alignment of oscillatory activity. Results of this analysis showed for the TSE, a significant cluster in the theta range (4–6 Hz) between 150 and 400 ms (Fig. 5A). TSE percentage of amplitude change in the theta band was larger in magnitude at the left auditory source (LAC), followed by the right auditory (RAC) and ACC sources and larger at the right than at the ACC source (LAC>RAC>ACC; Source effect: F(2,48) = 17.572, p = 0.000; post hoc pairwise comparisons: left/right: p = 0.03; left/ACC: p = 0.000; right/ACC: p = 0.009). To explore stimulus contributions to left > right hemispheric asymmetry, paired t test comparisons were conducted. Mean percentage of theta amplitude change was higher for the native deviant in the left auditory source as compared to the right (t(24) = 2.403, p = 0.024). Although close to significance, no laterality effect was found for the non-native deviant (t(24) = 1.811, p = 0.083); and no left/right asymmetry was found for the standard stimuli (t(24) = 0.599, p = 0.554).
Figure 5.

A, TSE grand average plots (2–12 Hz) of the single-trial source waveforms at left auditory cortex (LAC), ACC, and right auditory cortex (RAC) sources for native deviant (first row), non-native deviant (second row), and standard (third row) stimuli. Increased percentage of amplitude change relative to baseline of mixed induced and evoked oscillatory activity is shown in the theta band. Time (from left to right) is presented in seconds (s) and frequency (from bottom to top) in hertz (Hz). B, TSE grand average plots (28–40 Hz) showing enhancement of oscillatory activity at the ACC source in the low gamma band (30–34 Hz) exclusively for native deviant.
Figure 6.
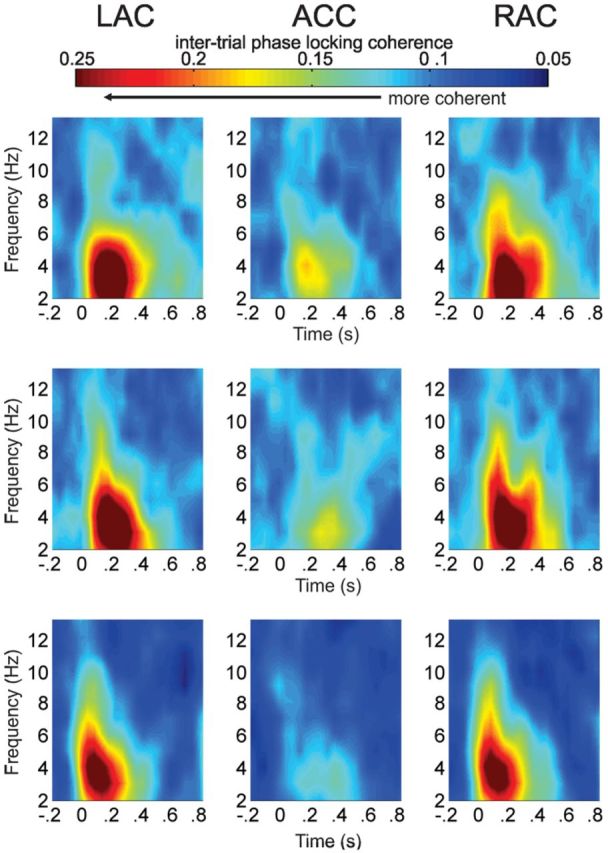
ITPL grand average plots (2–12 Hz) at left auditory cortex (LAC), ACC, and right auditory cortex (RAC) sources for native deviant (first row), non-native deviant (second row), and standard (third row) stimuli. Increased phase locking across trials, a reflection of intertrial coherence, is shown in the delta/theta band (2–4 Hz) predominantly in auditory sources with small activity in the ACC. Frequency is given in hertz (Hz) and time in seconds (s).
Within the ACC source, we also found a cluster of increased oscillatory activity in the 30–34 Hz gamma range, between 100 and 400 ms (Fig. 5B). This gamma burst was only present for the native deviant (Source × Stimulus interaction: F(4,96) = 3.996, p = 0.005) and showed significantly higher gamma amplitude for native than for the non-native deviant (post hoc comparisons: t(24) = 3.166, p = 0.003) or the standard (t(24) = −2.82, p < 0.009) stimulus responses. As noted above, the TSE value reflects the average percentage of spectral amplitude changes over single trials regardless of phase differences, that is, the TSE value includes both induced and evoked oscillatory activity. To isolate the induced activity, subtraction of the evoked response signal from the single-trial time series before computation of the TSE (Hoechstetter et al., 2004) was then conducted and submitted to statistical analysis. One-sample t tests confirmed that the difference in amplitude in the ACC source (native deviant minus non-native deviant) was significantly greater than zero (TSE overall [evoked + induced gamma]: t(24) = 3.166, p = 0.004; induced gamma: t(24) = 3.275, p = 0.003). ANOVA for the ACC source showed that only the response to the native deviant syllable resulted in induced gamma enhancement (Stimulus effect: F(2,48) = 8.108, p = 0.001; post hoc comparisons: larger native than non-native deviant: t(24) = −3.193, p = 0.004; larger native deviant than standard: t(24) = 3.415, p = 0.002). To test if induced gamma oscillations differed in discriminating native as compared to non-native contrasts, second-level analyses were conducted. Larger induced gamma power was found for discrimination of native (native deviant minus standard) as compared to non-native (non-native deviant minus standard) contrasts (t(24) = 3.275, p = 0.002).
We subsequently analyzed phase synchrony by examining how consistently the phase locked to stimulus presentation in different frequency bands across time (ITPL). The ITPL showed an increase in phase alignment from 100 to 300 ms, in the 2–4 Hz delta/theta range (Fig. 6). Less phase alignment was found in the ACC source than in the auditory sources (Source effect: F(2,48) = 76.853, p = 0.000; post hoc pairwise comparisons: left: p = 0.000; right: p = 0.000) and larger phase synchronization was seen for the responses to the native and non-native deviant stimuli than for the response to the standard stimulus (Stimulus effect: F(2,48) = 7.795, p = 0.001; post hoc pairwise comparisons: native deviant: p = 0.004; non-native deviant: p = 0.014) thus supporting the common finding that at 6 months of age, infants can discriminate speech signals in both native and non-native languages. Due to the fact that phase alignment was considerably smaller in the ACC than in auditory cortices we were not able to explore ITPL differences in the processing of native versus non-native deviants using the repeated-measures ANOVA. Separate analyses for the ITPL values originating from the ACC identified a significant cluster of phase synchronization between 150 and 250 ms from 3 to 5 Hz. Paired t test comparisons of the cluster mean showed more phase alignment for the native than for the non-native deviant (t(24) = 2.541, p = 0.018).
Discussion
Results from this study show that at 6 months, infants have already begun to preferentially process segmental/phonemic information of their native language. The presence of induced gamma oscillations exclusively during processing of the native contrast may indicate the beginning of perceptual tuning to native language phonemics. This is a novel result, as it was previously thought that phonemic preference for native consonants occurred toward the end of the first year of life as infants established their phonemic maps (Werker and Tees, 1984; Best et al., 1995; Phillips, 2001; Rivera-Gaxiola et al., 2005). Although our findings show differences in the time period in which this preference develops, they are in line with recent studies reporting induced gamma as a marker of infant preference for suprasegmental rhythmic features of their native language (Peña et al., 2010).
To investigate neural mechanisms that may underpin infant processing of syllable contrasts we examined the dynamics of the EEG signal in source space. Sources were found in bilateral auditory cortices and in frontal cortex, at the level of ACC. Time-frequency analysis of single-trial data transformed from sensor space into source space permitted the separation of the spectrotemporal content of different brain regions that normally overlap at the scalp surface. We found that when processing non-native syllable contrasts, infants demonstrated enhanced oscillations only in the theta range, but when infants listened to native, and hence more familiar syllabic information, increases in oscillatory activity were observed in both theta and gamma bands. Thus, while theta/delta oscillations appear to be specifically engaged in syllable processing, gamma bursts signal enhanced processing of native syllables. Slower frequency ranges, such as delta and theta bands, may capture the activity of connected neuronal populations and possibly be involved in information transfer between brain areas (Wang et al., 2005; Wang, 2010; Saby and Marshall, 2012). Activity in the gamma range is thought to represent the synchronized activity of local neuronal populations typically engaged when binding of information about perceptual features takes place (Herrmann et al., 2004; Ribary, 2005; Buzsáki, 2006; Uhlhaas et al., 2010; Wang, 2010). Thus, gamma activity plays a role in sensory and cognitive processes such as arousal, perceptual integration, attention, memory, object recognition, and language processing among others (Yordanova et al., 1997; Başar et al., 2000; Csibra et al., 2000; Ward, 2003; Fan et al., 2007; Grossmann et al., 2007; Benasich et al., 2008; Gou et al., 2011). One possible explanation of these results is that at 6 months of age, non-native syllable processing may recruit global auditory regions, whereas native syllable discrimination recruits both global and more selective neuronal populations.
Delta/theta oscillations
Enhancement of oscillatory activity in lower frequency bands was predominantly observed in auditory sources with indications of larger activation in left auditory cortex. Our findings are in line with previous reports showing left-lateralized language processing in premature neonates processing phonemic contrasts (Mahmoudzadeh et al., 2013), in neonates listening to syllable sequences (Gervain et al., 2008), and in 3-month-old infants listening to ongoing native speech (Dehaene-Lambertz et al., 2002). In the current study, 6-month-old infants showed predominantly left-lateralized enhancement of theta power for syllable processing. Larger left-than-right theta activation was found for the native deviant and for the non-native deviant, the hemispheric difference was close to significance, perhaps indicating that left auditory cortex specialization for native phonemic processing is in the initial stages. Our results are in accord with a previous study reporting larger left-lateralized hemodynamic responses for native than non-native sentences in 4 month olds (Minagawa-Kawai et al., 2011) and expand the preferential left auditory processing of native features from the sentence level to the phonetic level. The stimuli used contained fast VOT changes for both phonemic contrasts, thus enhancement of theta oscillations specifically in the left auditory cortex, known to be specialized for rapid temporal processing (Zatorre and Belin, 2001) is not surprising. However, this finding provides further support for the assertion that, similar to adults, the left auditory cortex in infancy already shows preferential treatment of speech stimuli containing rapidly changing information. In addition, our findings within the theta band expand the current view of low-frequency sampling in auditory regions. We show that delta/theta oscillations in the left auditory cortex resolve phonemic information that differs over tens of milliseconds and that synchrony of evoked low-frequency oscillations encodes acoustic information across CV syllables. Therefore, in early development, theta oscillations may represent a generalized mechanism transiently used in left auditory areas to index acoustic differences at the segmental/phonetic level. A small burst of theta activity was also elicited at the level of ACC during native deviant processing. Previous studies in adults have shown that theta activity in ACC relates to memory (Bastiaansen and Hagoort, 2003), error detection, conflict monitoring, stimulus-response mapping, familiarity, and orienting responses (Wang et al., 2005; Oliveira et al., 2007), suggesting interactions with frontal and temporal areas (Baudena et al., 1995). Increase in frontal theta power has also been found in infants attending to speech (Orekhova et al., 2006). Our data are in accord with these findings, suggesting that frontal theta activity during native deviant processing may signal a “violation of expectancy” that is not present during non-native deviant processing.
Gamma oscillations
Six-month-old infants also showed gamma enhancement in the ACC. Activation of ACC has been found in adults during attention-related tasks such as generation of word associations (Petersen et al., 1988), and in active auditory oddball tasks (Crottaz-Herbette and Menon, 2006). In passive paradigms, that do not require overt attention, ACC activation has been related to involuntary switching of attention to changes in auditory input (Waberski et al., 2001). The specific increase in gamma power during discrimination of native deviant could be due to mapping perceptual input into a long-term phonemic memory representation, or to involuntary capturing of attention by acoustic features relevant in native language, or possibly, as a function of both of these mechanisms. The fact that gamma oscillations were elicited in the ACC, an area implicated in allocation and control of attentional resources (Posner and Rothbart, 1998; Bush et al., 2000), and at relatively early stages of sensory processing, suggests involuntary switching of attention, from the visual stimuli (movie, puppets, toys) to the auditory domain, triggered by change detection of language-specific phonemic features. Attention modulation might well represent an important mechanism during this crucial period when infants are assembling their phonemic maps and thus may facilitate acquisition of native language. The attention switch could also be due to greater environmental familiarity for native than non-native syllables; however, “familiarity” implies some form of long-term memory representation. To recognize speech as familiar, one must be able to compare the incoming stimulus against memory representations derived from earlier experience. Another possibility is that change detection-related feedback mechanisms at the sensory level may help to shape the auditory system by increasing sensitivity to acoustic/phonetic features critical for phonetic mapping, or perhaps, to co-occurring contextual cues, which would assist infants in recognizing and reprioritizing the salience of phonetic categories (Werker and Tees, 2005; Werker et al., 2012). However, no contextual cues were present in this experiment. Acoustic differences may also elicit stronger responses for native than non-native syllables regardless of degree of familiarity. For instance, stop consonants with voicing lags such as the English /t/ are easier to discriminate than Spanish equivalents, which contain a shorter voicing lag (Abramson and Lisker, 1973). Despite the acoustic differences between English and Spanish deviants, infants showed clear evidence of discrimination of both contrasts.
Increases in induced gamma activity during presentation of ongoing native language, but not when utterances in a rhythmically alike non-native language were played, was reported in 6-month-old infants. However, at 3 months of age infants showed increased gamma power to both languages, implying the infants had not attained the required level of maturation to properly recognize native prosody (Peña et al., 2010). If, as suggested, the presence of induced gamma power in 6 month olds was a marker of specialization for processing native suprasegmental information (rhythm), we might expect as well that gamma power would signal segmental (phonemic) specialization. Following this idea, and given the reported developmental time line for phonemic specialization, we expected that at 6 months of age, infants would show increased gamma activation for both phonemic contrasts. However, our results showed that induced gamma power was increased only for the native contrast processing suggesting that (1) 6-month-old infants have already begun to organize speech sounds into linguistically relevant categories to create enduring phonemic representations, (2) specialization for processing phonemic information may occur earlier than was previously thought, and (3) enhancement of gamma oscillations for native processing might well be a marker for established linguistic preferences.
In summary, examining the spectrotemporal dynamics of EROs to syllable contrasts expands our understanding of the mechanisms that may underlie and facilitate early language acquisition, and reveal candidate neural mechanisms that contribute to syllable processing. In 6-month-old infants, auditory discrimination of syllabic information may be subserved by increases in oscillatory power and phase alignment in the delta/theta range within auditory cortices, while frontal gamma power may indicate preferential processing of specific native features. Although 6 month olds can discriminate phonemic information across languages, the enhancement of gamma oscillations seen during discrimination of native contrasts supports the premise that at this age, infants have already begun to differentiate native phonemic features to form memory representations and as a consequence, much earlier than current literature suggests, favor native over non-native phonemic processing.
Footnotes
This work was funded by the Santa Fe Institute Consortium, the Elizabeth H. Solomon Center for Neurodevelopmental Research, and by National Science Foundation (NSF) Grant SMA-1041755 to the Temporal Dynamics of Learning Center (TDLC), an NSF Science of Learning Center to A.A.B., TDLC trainee award YR6INCA43 to S.O.-M., and by Grant 127277 to J.A.H. from the Academy of Finland. Special thanks go to our colleagues at the Center for Molecular and Behavioral Neuroscience for assistance during data collection and processing, to the children who participated in this study, and to their families.
The authors declare no competing financial interests.
References
- Abramson AS, Lisker L. Voice-timing perception in Spanish word-initial stops. J Phonetics. 1973;1:1–8. [Google Scholar]
- Aslin RN, Pisoni DB, Hennessy BL, Perey AJ. Discrimination of voice onset time by human infants: new findings and implications for the effects of early experience. Child Dev. 1981;52:1135–1145. doi: 10.2307/1129499. [DOI] [PMC free article] [PubMed] [Google Scholar]
- Başar E, Başar-Eroglu C, Karakaş S, Schürmann M. Brain oscillations in perception and memory. Int J Psychophysiol. 2000;35:95–124. doi: 10.1016/S0167-8760(99)00047-1. [DOI] [PubMed] [Google Scholar]
- Bastiaansen M, Hagoort P. Event-induced theta responses as a window on the dynamics of memory. Cortex. 2003;39:967–992. doi: 10.1016/S0010-9452(08)70873-6. [DOI] [PubMed] [Google Scholar]
- Baudena P, Halgren E, Heit G, Clarke JM. Intracerebral potentials to rare target and distractor auditory and visual stimuli: 3. Frontal cortex. Electroencephalogr Clin Neurophysiol. 1995;94:251–264. doi: 10.1016/0013-4694(95)98476-O. [DOI] [PubMed] [Google Scholar]
- Benasich AA, Gou Z, Choudhury N, Harris KD. Early cognitive and language skills are linked to resting frontal gamma power across the first 3 years. Behav Brain Res. 2008;195:215–222. doi: 10.1016/j.bbr.2008.08.049. [DOI] [PMC free article] [PubMed] [Google Scholar]
- Best CT, McRoberts GW, LaFleur R, Silver-Isenstadd J. Divergent developmental patterns for infants' perception of two non-native consonant contrasts. Infant Behav Dev. 1995;18:339–350. doi: 10.1016/0163-6383(95)90022-5. [DOI] [Google Scholar]
- Bush G, Luu P, Posner MI. Cognitive and emotional influences in anterior cingulate cortex. Trends Cogn Sci. 2000;4:215–222. doi: 10.1016/S1364-6613(00)01483-2. [DOI] [PubMed] [Google Scholar]
- Buzsáki G. Rhythms of the brain. New York: Oxford UP; 2006. [Google Scholar]
- Buzsáki G, Draguhn A. Neuronal oscillations in cortical networks. Science. 2004;304:1926–1929. doi: 10.1126/science.1099745. [DOI] [PubMed] [Google Scholar]
- Cheour M, Ceponiene R, Lehtokoski A, Luuk A, Allik J, Alho K, Näätänen R. Development of language-specific phoneme representations in the infant brain. Nat Neurosci. 1998;1:351–353. doi: 10.1038/1561. [DOI] [PubMed] [Google Scholar]
- Crottaz-Herbette S, Menon V. Where and when the anterior cingulate cortex modulates attentional response: combined fMRI and ERP evidence. J Cogn Neurosci. 2006;18:766–780. doi: 10.1162/jocn.2006.18.5.766. [DOI] [PubMed] [Google Scholar]
- Csibra G, Davis G, Spratling MW, Johnson MH. Gamma oscillations and object processing in the infant brain. Science. 2000;290:1582–1585. doi: 10.1126/science.290.5496.1582. [DOI] [PubMed] [Google Scholar]
- Dehaene-Lambertz G, Dehaene S, Hertz-Pannier L. Functional neuroimaging of speech perception in infants. Science. 2002;298:2013–2015. doi: 10.1126/science.1077066. [DOI] [PubMed] [Google Scholar]
- Eimas PD. Auditory and linguistic processing of cues for place of articulation by infants. Percept Psychophys. 1974;16:513–521. doi: 10.3758/BF03198580. [DOI] [Google Scholar]
- Eimas PD, Siqueland ER, Jusczyk P, Vigorito J. Speech perception in infants. Science. 1971;171:303–306. doi: 10.1126/science.171.3968.303. [DOI] [PubMed] [Google Scholar]
- Fan J, Byrne J, Worden MS, Guise KG, McCandliss BD, Fossella J, Posner MI. The relation of brain oscillations to attentional networks. J Neurosci. 2007;27:6197–6206. doi: 10.1523/JNEUROSCI.1833-07.2007. [DOI] [PMC free article] [PubMed] [Google Scholar]
- Friederici AD, Friedrich M, Christophe A. Brain responses in 4-month-old infants are already language specific. Curr Biol. 2007;17:1208–1211. doi: 10.1016/j.cub.2007.06.011. [DOI] [PubMed] [Google Scholar]
- Gervain J, Mehler J. Speech perception and language acquisition in the first year of life. Annu Rev Psychol. 2010;61:191–218. doi: 10.1146/annurev.psych.093008.100408. [DOI] [PubMed] [Google Scholar]
- Gervain J, Macagno F, Cogoi S, Peña M, Mehler J. The neonate brain detects speech structure. Proc Natl Acad Sci U S A. 2008;105:14222–14227. doi: 10.1073/pnas.0806530105. [DOI] [PMC free article] [PubMed] [Google Scholar]
- Giraud AL, Poeppel D. Cortical oscillations and speech processing: emerging computational principles and operations. Nat Neurosci. 2012;15:511–517. doi: 10.1038/nn.3063. [DOI] [PMC free article] [PubMed] [Google Scholar]
- Gou Z, Choudhury N, Benasich AA. Resting frontal gamma power at 16, 24 and 36 months predicts individual differences in language and cognition at 4 and 5 years. Behav Brain Res. 2011;220:263–270. doi: 10.1016/j.bbr.2011.01.048. [DOI] [PMC free article] [PubMed] [Google Scholar]
- Grossmann T, Johnson MH, Farroni T, Csibra G. Social perception in the infant brain: gamma oscillatory activity in response to eye gaze. SCAN. 2007;2:284–291. doi: 10.1093/scan/nsm025. [DOI] [PMC free article] [PubMed] [Google Scholar]
- Hämäläinen JA, Ortiz-Mantilla S, Benasich AA. Source localization of event-related potentials to pitch change mapped onto age-appropriate MRIs at 6 months of age. Neuroimage. 2011;54:1910–1918. doi: 10.1016/j.neuroimage.2010.10.016. [DOI] [PubMed] [Google Scholar]
- Hari R, Salmelin R. Human cortical oscillations: a neuromagnetic view through the skull. Trends Neurosci. 1997;20:44–49. doi: 10.1016/S0166-2236(96)10065-5. [DOI] [PubMed] [Google Scholar]
- Herrmann CS, Munk MH, Engel AK. Cognitive functions of gamma-band activity: memory match and utilization. Trends Cogn Sci. 2004;8:347–355. doi: 10.1016/j.tics.2004.06.006. [DOI] [PubMed] [Google Scholar]
- Hickok G, Poeppel D. Towards a functional neuroanatomy of speech perception. Trends Cogn Sci. 2000;4:131–138. doi: 10.1016/S1364-6613(00)01463-7. [DOI] [PubMed] [Google Scholar]
- Hoechstetter K, Bornfleth H, Weckesser D, Ille N, Berg P, Scherg M. BESA source coherence: a new method to study cortical oscillatory coupling. Brain Topogr. 2004;16:233–238. doi: 10.1023/b:brat.0000032857.55223.5d. [DOI] [PubMed] [Google Scholar]
- Hoechstetter K, Berg P, Scherg M. BESA research tutorial 4: distributed source imaging. 2010 [Google Scholar]
- Hollingshead AB. The four-factor index of social status. New Haven: Department of Sociology, Yale University; 1975. [Google Scholar]
- Jusczyk PW. How infants adapt speech-processing capacities to native-language structure. Curr Dir Psychol Sci. 2002;11:15–18. doi: 10.1111/1467-8721.00159. [DOI] [Google Scholar]
- Kuhl PK. Early language acquisition: cracking the speech code. Nat Rev Neurosci. 2004;5:831–843. doi: 10.1038/nrn1533. [DOI] [PubMed] [Google Scholar]
- Kuhl PK, Williams KA, Lacerda F, Stevens KN, Lindblom B. Linguistic experience alters phonetic perception in infants by 6 months of age. Science. 1992;255:606–608. doi: 10.1126/science.1736364. [DOI] [PubMed] [Google Scholar]
- Kuhl PK, Stevens E, Hayashi A, Deguchi T, Kiritani S, Iverson P. Infants show a facilitation effect for native language phonetic perception between 6 and 12 months. Dev Sci. 2006;9:F13–F21. doi: 10.1111/j.1467-7687.2006.00468.x. [DOI] [PubMed] [Google Scholar]
- Lewkowicz DJ, Ghazanfar AA. The emergence of multisensory systems through perceptual narrowing. Trends Cogn Sci. 2009;13:470–478. doi: 10.1016/j.tics.2009.08.004. [DOI] [PubMed] [Google Scholar]
- Mahmoudzadeh M, Dehaene-Lambertz G, Fournier M, Kongolo G, Goudjil S, Dubois J, Grebe R, Wallois F. Syllabic discrimination in premature human infants prior to complete formation of cortical layers. Proc Natl Acad Sci U S A. 2013;110:4846–4851. doi: 10.1073/pnas.1212220110. [DOI] [PMC free article] [PubMed] [Google Scholar]
- Maitre NL, Lambert WE, Aschner JL, Key AP. Cortical speech sound differentiation in the neonatal intensive care unit predicts cognitive and language development in the first 2 years of life. Dev Med Child Neurol. 2013;55:834–839. doi: 10.1111/dmcn.12191. [DOI] [PMC free article] [PubMed] [Google Scholar]
- Mehler J, Jusczyk P, Lambertz G, Halsted N, Bertoncini J, Amiel-Tison C. A precursor of language acquisition in young infants. Cognition. 1988;29:143–178. doi: 10.1016/0010-0277(88)90035-2. [DOI] [PubMed] [Google Scholar]
- Minagawa-Kawai Y, van der Lely H, Ramus F, Sato Y, Mazuka R, Dupoux E. Optical brain imaging reveals general auditory and language-specific processing in early infant development. Cereb Cortex. 2011;21:254–261. doi: 10.1093/cercor/bhq082. [DOI] [PMC free article] [PubMed] [Google Scholar]
- Moon C, Lagercrantz H, Kuhl PK. Language experienced in utero affects vowel perception after birth: a two-country study. Acta Paediatr. 2013;102:156–160. doi: 10.1111/apa.12098. [DOI] [PMC free article] [PubMed] [Google Scholar]
- Oliveira FT, McDonald JJ, Goodman D. Performance monitoring in the anterior cingulate is not all error related: expectancy deviation and the representation of action-outcome associations. J Cogn Neurosci. 2007;19:1994–2004. doi: 10.1162/jocn.2007.19.12.1994. [DOI] [PubMed] [Google Scholar]
- Orekhova EV, Stroganova TA, Posikera IN, Elam M. EEG theta rhythm in infants and preschool children. Clin Neurophysiol. 2006;117:1047–1062. doi: 10.1016/j.clinph.2005.12.027. [DOI] [PubMed] [Google Scholar]
- Ortiz-Mantilla S, Hämäläinen JA, Benasich AA. Time course of ERP generators to syllables in infants: a source localization study using age-appropriate brain templates. Neuroimage. 2012;59:3275–3287. doi: 10.1016/j.neuroimage.2011.11.048. [DOI] [PubMed] [Google Scholar]
- Peña M, Pittaluga E, Mehler J. Language acquisition in premature and full-term infants. Proc Natl Acad Sci U S A. 2010;107:3823–3828. doi: 10.1073/pnas.0914326107. [DOI] [PMC free article] [PubMed] [Google Scholar]
- Petersen SE, Fox PT, Posner MI, Mintun M, Raichle ME. Positron emission tomographic studies of the cortical anatomy of single-word processing. Nature. 1988;331:585–589. doi: 10.1038/331585a0. [DOI] [PubMed] [Google Scholar]
- Phillips C. Levels of representation in the electrophysiology of speech perception. Cogn Sci. 2001;25:711–731. doi: 10.1207/s15516709cog2505_5. [DOI] [Google Scholar]
- Poeppel D, Idsardi WJ, van Wassenhove V. Speech perception at the interface of neurobiology and linguistic. Philos Trans R Soc Lond B Biol Sci. 2008;363:1071–1086. doi: 10.1098/rstb.2007.2160. [DOI] [PMC free article] [PubMed] [Google Scholar]
- Posner MI, Rothbart MK. Attention, self-regulation and consciousness. Philos Trans R Soc Lond B Biol Sci. 1998;353:1915–1927. doi: 10.1098/rstb.1998.0344. [DOI] [PMC free article] [PubMed] [Google Scholar]
- Raschle N, Zuk J, Ortiz-Mantilla S, Sliva DD, Franceschi A, Grant PE, Benasich AA, Gaab N. Pediatric neuroimaging in early childhood and infancy: challenges and practical guidelines. Ann NY Acad Sci. 2012;1252:43–50. doi: 10.1111/j.1749-6632.2012.06457.x. [DOI] [PMC free article] [PubMed] [Google Scholar]
- Ribary U. Dynamics of thalamo-cortical network oscillations and human perception. Prog Brain Res. 2005;150:127–142. doi: 10.1016/S0079-6123(05)50010-4. [DOI] [PubMed] [Google Scholar]
- Rivera-Gaxiola M, Silva-Pereyra J, Kuhl PK. Brain potentials to native and non-native speech contrasts in 7- and 11-month-old American infants. Dev Sci. 2005;8:162–172. doi: 10.1111/j.1467-7687.2005.00403.x. [DOI] [PubMed] [Google Scholar]
- Rivera-Gaxiola M, Silva-Pereyra J, Klarman L, Garcia-Sierra A, Lara-Ayala L, Cadena-Salazar C, Kuhl P. Principal component analysis and scalp distribution of the auditory P150–250 and N250–550 to speech contrasts in Mexican and American infants. Dev Neuropsychol. 2007;31:363–378. doi: 10.1080/87565640701229292. [DOI] [PubMed] [Google Scholar]
- Saby JN, Marshall PJ. The utility of EEG band power analysis in the study of infancy and early childhood. Dev Neuropsychol. 2012;37:253–273. doi: 10.1080/87565641.2011.614663. [DOI] [PMC free article] [PubMed] [Google Scholar]
- Scherg M, Von Cramon D. Two bilateral sources of the late AEP as identified by a spatio-temporal dipole model. Electroencephalogr Clin Neurophysiol. 1985;62:32–44. doi: 10.1016/0168-5597(85)90033-4. [DOI] [PubMed] [Google Scholar]
- Scherg M, Berg P, Hoechstetter K. BESA research tutorial 2: EEG-fMRI coregistration, preprocessing, ERP and source analysis. 2010 [Google Scholar]
- Tallon-Baudry C, Bertrand O. Oscillatory gamma activity in humans and its role in object representation. Trends Cogn Sci. 1999;3:151–162. doi: 10.1016/S1364-6613(99)01299-1. [DOI] [PubMed] [Google Scholar]
- Tallon-Baudry C, Bertrand O, Delpuech C, Pernier J. Stimulus specificity of phase-locked and non-phase locked 40 Hz visual responses in humans. J Neurosci. 1996;16:4240–4249. doi: 10.1523/JNEUROSCI.16-13-04240.1996. [DOI] [PMC free article] [PubMed] [Google Scholar]
- Tsao FM, Liu HM, Kuhl PK. Perception of native and non-native affricative-fricative contrasts: cross-language tests on adults and infants. J Acoust Soc Am. 2006;120:2285–2294. doi: 10.1121/1.2338290. [DOI] [PubMed] [Google Scholar]
- Uhlhaas PJ, Roux F, Rodriguez E, Rotarska-Jagiela A, Singer W. Neural synchrony and the development of cortical networks. Trends Cogn Sci. 2010;14:72–80. doi: 10.1016/j.tics.2009.12.002. [DOI] [PubMed] [Google Scholar]
- Waberski TD, Kreitschmann-Andermahr I, Kawohl W, Darvas F, Ryang Y, Rodewald M, Gobbelé R, Buchner H. Spatio-temporal source imaging reveals subcomponents of the human auditory mismatch negativity in the cingulum and right inferior temporal gyrus. Neurosci Lett. 2001;308:107–110. doi: 10.1016/S0304-3940(01)01988-7. [DOI] [PubMed] [Google Scholar]
- Wang C, Ulbert I, Schomer DL, Marinkovic K, Halgren E. Responses of human anterior cingulate cortex microdomains to error detection, conflict monitoring, stimulus-response mapping, familiarity, and orienting. J Neurosci. 2005;25:604–613. doi: 10.1523/JNEUROSCI.4151-04.2005. [DOI] [PMC free article] [PubMed] [Google Scholar]
- Wang XJ. Neurophysiological and computational principles of cortical rhythms in cognition. Physiol Rev. 2010;90:1195–1268. doi: 10.1152/physrev.00035.2008. [DOI] [PMC free article] [PubMed] [Google Scholar]
- Ward LM. Synchronous neural oscillations and cognitive processes. Trends Cogn Sci. 2003;7:553–559. doi: 10.1016/j.tics.2003.10.012. [DOI] [PubMed] [Google Scholar]
- Werker JF, Tees RC. Cross-language speech perception: evidence for perceptual reorganization during the first year of life. Infant Behav Dev. 1984;7:49–63. doi: 10.1016/S0163-6383(84)80022-3. [DOI] [Google Scholar]
- Werker JF, Tees RC. Speech perception as a window for understanding plasticity and commitment in language systems of the brain. Dev Psychobiol. 2005;46:233–251. doi: 10.1002/dev.20060. [DOI] [PubMed] [Google Scholar]
- Werker JF, Yeung HH, Yoshida KA. How do infants become experts at native-speech perception? Curr Dir Psychol Sci. 2012;21:221–226. doi: 10.1177/0963721412449459. [DOI] [Google Scholar]
- Yordanova J, Kolev V, Demiralp T. The phase-locking of auditory gamma band responses in humans is sensitive to task processing. Neuroreport. 1997;8:3999–4004. doi: 10.1097/00001756-199712220-00029. [DOI] [PubMed] [Google Scholar]
- Zatorre RJ, Belin P. Spectral and temporal processing in human auditory cortex. Cereb Cortex. 2001;11:946–953. doi: 10.1093/cercor/11.10.946. [DOI] [PubMed] [Google Scholar]