

Abstract
It is now accepted that glial cells actively interact with neurons and modulate their activity in many regions of the nervous system. Importantly, modulation of synaptic activity by glial cells depends on the proper detection and decoding of synaptic activity. However, it remains unknown whether glial cells are capable of decoding synaptic activity and properties during early postdevelopmental stages, in particular when different presynaptic nerve terminals compete for the control of the same synaptic site. This may be particularly relevant because a major determinant of the outcome of synaptic competition process is the relative synaptic strength of competing terminals whereby stronger terminals are more likely to occupy postsynaptic territory and become stabilized while weaker terminals are often eliminated. Hence, because of their ability to decode synaptic activity, glial cells should be able to integrate neuronal information of competing terminals. Using simultaneous glial Ca2+ imaging and synaptic recordings of dually innervated mouse neuromuscular junctions, we report that single glial cells decipher the strength of competing nerve terminals. Activity of single glial cells, revealed by Ca2+ responses, reflects the synaptic strength of each competing nerve terminal and the state of synaptic competition. This deciphering is mediated by functionally segregated purinergic receptors and intrinsic properties of glial cells. Our results indicate that glial cells decode ongoing synaptic competition and, hence, are poised to influence its outcome.
Introduction
Glial cells were long considered as a support element for neurons providing essential energy metabolites and maintaining the ionic balance of the extracellular environment. However, there is now a large body of evidence revealing that glial cells actively interact with neurons and are important for proper information processing in the nervous system. Indeed, glial cells detect synaptic activity at the synapse and, in turn, release neuroactive molecules that modulate neurotransmission (Robitaille, 1998; Fellin et al., 2004; Panatier et al., 2006; Henneberger et al., 2010; Todd et al., 2010; Panatier et al., 2011).
Involvement of glial cells in the regulation of synaptic activity and plasticity heavily depends on their ability to detect and decode synaptic activity (Auld and Robitaille, 2003; Todd et al., 2010; Panatier et al., 2011). However, these neuron–glia interactions were addressed solely in the mature nervous system, whereas their activity at immature synapses remains ill-defined despite their essential role in synapse formation and elimination (Ullian et al., 2004; Christopherson et al., 2005; Eroglu and Barres, 2010). An event where the ability of glial cells to detect synaptic activity could come to play is the postnatal synaptic competition that occurs between supernumerary nerve terminals competing for the same synaptic territory (Lohof et al., 1996; Chen and Regehr, 2000; Wyatt and Balice-Gordon, 2003). This competition results in the strengthening of certain synaptic inputs and weakening and elimination of others (Colman et al., 1997; Kopp et al., 2000; Keller-Peck et al., 2001; Walsh and Lichtman, 2003; Bishop et al., 2004). Synaptic competition and elimination are in part dependent on the relative activity of the competing nerve terminals (Balice-Gordon and Lichtman, 1994; Stellwagen and Shatz, 2002; Buffelli et al., 2003) where the most active inputs (i.e., releasing more neurotransmitters) are more likely to be strengthened and maintained (Busetto et al., 2000; Buffelli et al., 2003). Hence, glial cells could alter the outcome of synaptic competition because of their ability to detect and modulate transmitter release. However, a fundamental prerequisite remains undetermined: glial cells must be able to detect ongoing synaptic competition and decipher the strength of each competing nerve terminal. To address this question, we used the mammalian neuromuscular junction (NMJ), a well-characterized model for the study of synaptic competition (Kopp et al., 2000; Walsh and Lichtman, 2003; Chung and Barres, 2009) and neuron–glia interactions (Robitaille, 1998; Todd et al., 2010).
Using simultaneous Ca2+ imaging of perisynaptic Schwann cells (PSCs), glial cells at the NMJ, and synaptic recordings of dually innervated NMJs, we show that a single PSC deciphers ongoing synaptic competition. Based on their intrinsic properties and segregated functional P2Y receptors, PSCs decode the properties of each competing input, identifying the strong from the weak input. Hence, PSCs are in tune with the synaptic competition process, selectively decoding the state of each competing nerve terminals.
Materials and Methods
Animals and nerve-muscle preparation.
All experiments were performed in accordance with the guidelines of the Canadian Council of Animal Care and the Comité de déontologie animale of Université de Montréal.
P7–P8 male CD-1 mice (Charles River) were anesthetized by a lethal intraperitoneal injection of a ketamine (15 mg/ml) and xylazine (1 mg/ml) mixture. The soleus muscle (SOL) and its innervation to the ventral roots were dissected according to Kopp et al. (2000) under oxygenated (95% O2, 5% CO2) Rees' Ringer's solution (in mm): 110 NaCl, 5 KCl, 1 MgCl2, 25 NaHCO3, 2 CaCl2, 11 glucose, 0.3 glutamate, 0.4 glutamine, 5 BES, 4.34 × 10⁻⁷ cocarboxylase and 0.036 choline chloride. The pH of oxygenated solution was at 7.3. The SOL and its innervation were pinned in a Sylgard-coated recording chamber, and the ventral roots were carefully divided in three segments that were independently stimulated by three suction-stimulating electrodes (square pulses; 0.1 mV to 2.0 V, 0.1 ms duration) using a Master-8 stimulator (AMPI). This preparation allowed us to stimulate two distinct inputs competing at single NMJ, as described in Figure 1A.
Figure 1.
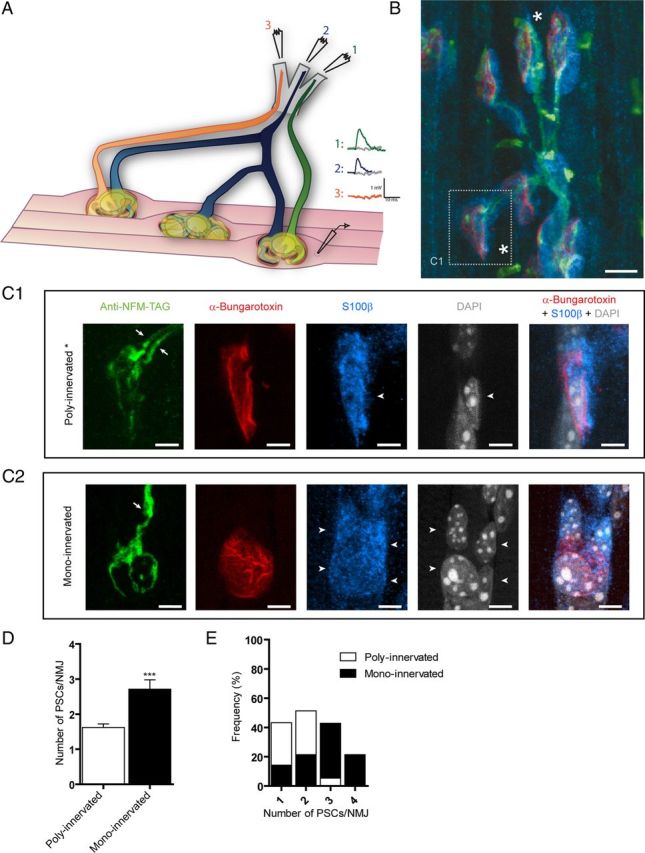
PSCs during synaptic competition at the mammalian NMJ. A, Diagram illustrating the experimental situation where transmitter release from a dually innervated NMJ was recorded with a sharp microelectrode and synaptic responses evoked by independent stimulation of two different ventral roots. B, Labeling of presynaptic terminals (green), PSCs (blue), and postsynaptic nAChR (red) of P7 Soleus NMJs. At this age, most NMJs were poly-innervated (as shown in C1 and marked with “*”), but some NMJs were already mono-innervated. C1, At dually innervated NMJs, two independent axonal branches (in green, arrows) converged at the same endplate area (red). Also note that a single PSC (blue) covered the whole endplate area and both nerve terminals. PSCs counted (arrowheads) were positive for S100β (blue) and DAPI (gray) staining and were located at the endplate (red). C2, At mono-innervated NMJs, one axon (in green, arrow) was observed at the endplate area (red). This NMJ was from another muscle preparation than in B and C1. D, Histogram of the number of PSCs at poly-innervated and mono-innervated NMJs. Note that there were more PSCs at mono-innervated than poly-innervated NMJs. Unpaired t test, p < 0.0001. E, Distribution of the number of PSCs at mono-innervated and poly-innervated NMJs. Note that most poly-innervated NMJs had 1 or 2 PSCs. Scale bars: B, 10 μm; C1, C2, 5 μm.
Immunohistochemistry of NMJ components.
Immunohistochemical labeling was performed according to Todd et al. (2010). In brief, dissected SOL muscles were pinned in a Sylgard-coated dish and fixed for 10 min in 4% formaldehyde at room temperature and then permeabilized in 100% cold methanol for 6 min at −20°C. Nonspecific labeling was minimized by incubating the muscles in a solution of 10% normal donkey serum (NDS) and 0.01% Triton X-100 for 20 min. Nerve-muscle preparations were incubated overnight at 4°C with a rabbit anti-S100β (1:250, Dako, with 0.01% Triton X-100 and 2% NDS). After rinsing, muscles were incubated in a goat anti-neurofilament (1:250; SC16143, Santa Cruz Biotechnology) and chicken anti-synaptotagmin (1:250; AB9356, Millipore Bioscience Research Reagents) for 90 min. Secondary antibodies (Alexa 488 α-goat, FITC α-chicken and 647 α-rabbit, 1:500) were incubated together for 60 min at room temperature. Muscles were incubated with α-bungarotoxin (Alexa 594, 0.75 μg/ml) for 45 min. After each step, muscles were rinsed in PBS containing 0.01% Triton X-100 for 5 min. The preparations were then mounted in the Prolong Gold antifade reagent containing DAPI (Invitrogen) to visualize nuclear material. All labels were observed simultaneously using the spectral detection feature of an Olympus FV1000 confocal microscope. Pinholes were set to obtain an airy disk value of 1. No further manipulations of the images were performed after the acquisition.
The identification and count of PSCs at NMJs were performed on muscles that were either used for electrophysiological recordings or freshly dissected and processed directly for immunostaining. When the same muscles were used for electrophysiological recordings and immunostaining, the recorded NMJs were identified post hoc using their specific location on the muscle using the distance of the fiber from the nerve entry as reference and the pattern of nerve branching since only one NMJ was present on each muscle fiber. The following parameters were used to identify and count PSCs at NMJs: cells needed to be S100β immunopositive, labeled by DAPI and located within the endplate area. PSCs somata were well separated and easily identified even though their processes are known to intermingle around the nerve terminals.
Immunohistochemistry of P2Y1 receptors.
We could not label PSCs using the rabbit anti-S100β as indicated above because type 1 P2Y receptors (P2Y1R) were labeled using a polyclonal antibody also generated in rabbit. Instead, PSCs were selectively loaded using a single cell electroporation method. Dissected SOL muscles were pinned in a Sylgard-coated recording chamber and constantly perfused with oxygenated Rees' Ringer's solution. A glass pipette (5–8 MΩ) was filled with 5 mg/ml fixable anionic Dextran, AlexaFluor-594 (10,000 MW; Invitrogen). The pipette was mounted on a pipette holder with a platinum stimulating wire connected to a Master-8 stimulator (AMPI), and the reference electrode was placed in the bath. The pipette was positioned close to the soma of a PSC using a micromanipulator under visual guidance. One to 3 single square pulses (10 ms duration; 10 V amplitude) were applied to open the cell membrane (Nevian and Helmchen, 2007) and allow the loading of AlexaFluor-594 into the cell. The procedure was repeated to load other visible PSCs at the same NMJ. PSCs from 3 to 4 NMJs were loaded per muscle. Muscles were allowed to rest for 30 min before fixation and immunohistochemistry staining. Loaded PSCs/NMJs were identified post hoc using the specific shape of the PSCs and the fiber distance from the nerve entry as a reference as indicated above. Three muscles were used as control to confirm that electroporated PSCs were also immunopositive for S100β (data not shown).
Muscles were then incubated overnight with a rabbit antibody against P2Y1 receptors (1:1500; 34–7200, Invitrogen). After rinsing, muscles were incubated in a goat antineurofilament (1:250; SC16143, Santa Cruz Biotechnology) and mouse antisynaptic vesicular protein SV2 IgG1 (1:1500; Developmental Studies Hybridoma Bank) for 120 min at room temperature. Preparations were incubated with Alexa Fluor 488 α-goat and Alexa Fluor 647 α-rabbit (1:500) secondary antibodies for 60 min and then incubated with DL488 α-mouse IgG1 (1:500) for 60 min at room temperature. Finally, muscles were incubated with α-bungarotoxin (Alexa Fluor 594, 0.75 μg/ml) for 45 min. After each step, muscles were washed in PBS containing 0.01% Triton X-100 (3 times, 5 min each). The preparations were then mounted in the Prolong Gold antifade reagent and all labels observed simultaneously using the spectral detection feature of an Olympus FV1000 confocal microscope.
Immunohistochemistry of muscarinic receptors M5 and M3.
For labeling muscarinic receptors (mAChRs), muscles were incubated overnight at 4°C with a rabbit anti-S100β (1:250, Dako) to label PSCs. After rinsing, muscles were incubated with a chicken antineurofilament to label axons and nerve terminals (1:1000; 212–901-D84, Rockland), mouse anti-SV2 IgG1 to label active zones (1:1500; Developmental Studies Hybridoma Bank), and goat anti-M3 (1:500, SC31486, Santa Cruz Biotechnology) or M5 (1:500, SC7478, Santa Cruz Biotechnology) to label mAChRs, all at room temperature for 120 min. Nerve-muscle preparations were then sequentially incubated in the following secondary antibody solutions for 60 min at room temperature: Alexa Fluor 488 α-chicken (1:500, antineurofilament primary antibody) with Alexa Fluor 647 α-goat (1:500 for M5 or 1:1000 for M3), DL488 α-mouse IgG1 (1:500; anti SV2 primary antibody), and finally Alexa Fluor 405 α-rabbit (1:500). Preparations were rinsed with PBS containing 0.01% Triton X-100 (3 times, 5 min each) in between each antibody incubation. Finally, muscles were incubated with α-bungarotoxin (Alexa Fluor 594, 0.75 μg/ml) for 45 min and, after washout, preparations were mounted in the Prolong Gold antifade reagent. All labels were observed simultaneously using an Olympus FV1000 confocal microscope.
Electrophysiological recordings of synaptic transmission.
Intracellular recordings of endplate potentials (EPPs) were performed at 28°C-30°C using glass microelectrodes (40–70 MΩ, filled with KCl, 3M). Only NMJs that showed EPPs evoked by the independent stimulation of two of the three ventral roots were studied. Each suction electrode contained only a single axon that innervated the NMJ because only a single EPP with given amplitude and rise time was induced by the stimulation. Increasing threshold stimulation intensity never evoked any sudden increase in EPP amplitude (EPP steps), as would be expected if multiple axons innervating a single poly-innervated NMJs were present within the stimulated stimulating electrode (Redfern and Thesleff, 1971; Busetto et al., 2000; Buffelli et al., 2002). Synaptic responses were recorded using an Axoclamp 2B amplifier (Axon Instruments) and further amplified (100×) and filtered at 2 kHz by a Warner Instruments DC amplifier. EPPs were recorded with WinWCP software (John Dempster, University of Strathclyde, Strathclyde, United Kingdom).
Synaptic strength of each nerve terminal in competition at a given NMJ was determined by measuring their respective quantal content and paired-pulse facilitation. These were determined using a modified Ringer's solution with low Ca2+ (1 mm)/high Mg2+ (6–7 mm) solution. The ventral roots were stimulated at a frequency of 0.2 Hz with an intensity that was twice the threshold for eliciting EPPs. Quantal content (m) for each input was determined using the method of failures (Del Castillo and Katz, 1954): m = loge (no. of nerve impulses/no. of failures).
To determine the paired-pulse facilitation (F), two stimuli (0.1 ms duration) were given with an interval of 10 ms and facilitation was calculated as the mean amplitude of the second responses (B) divided by the mean amplitude of the first responses (A) (including failures).
Ca2+ imaging of PSCs.
PSCs were loaded with the Ca2+ indicator fluo-4AM (10 μm, Invitrogen) by incubating nerve-muscle preparations for two times 35 min at room temperature. The loading solution also contained 0.02% pluronic acid (Invitrogen) and 0.5% dimethylsulfoxide (Sigma) added to the preoxygenated normal Ringer solution. This method is known to load preferentially PSCs at NMJs, and cells were easily identifiable in fluorescent illumination for the Ca2+ indicator (fluo-4) and transmitted light (Rochon et al., 2001; Rousse et al., 2010; Todd et al., 2010). Ca2+ responses were elicited in PSCs by independently stimulating each ventral root at 50 Hz for 30 s. Preparations were allowed to rest for 20 min between stimulation of the two competing inputs.
Changes in fluorescence intensity were monitored using a Bio-Rad MRC600 laser-scanning confocal microscope equipped with an argon ion laser. The imaging area was focused on a single NMJ, and all PSCs present at that NMJ were imaged at once. The preparation was excited with a 488 nm laser line and the emitted fluorescence was detected through a long-pass filter at 590 nm. A 60× water-immersion lens was used (0.90 NA; Olympus). Relative changes in fluorescence intensity were analyzed over PSCs soma and were expressed as %ΔF/F = F − Frest/Frest × 100.
In some experiments, Ca2+ responses in PSCs were elicited by agonists applied locally using a Picospritzer II (Parker Instruments, positive pressure pulses of 10 PSI, 150 ms) from a glass pipette (5 MΩ, ∼2-μm-tip diameter) positioned at proximity of the cells. Agonists, ATP (3 μm, Sigma), muscarine (5 μm, Sigma), or acetylcholine (5 μm) were diluted in the extracellular Ringer solution used for the experiment.
All Ca2+ imaging experiments were performed in normal Ca2+/Mg2+ concentration Ringer's solution at 28°C to 30°C. Muscle contractions were prevented by blocking postsynaptic cholinergic receptors with d-tubocurarine chloride (2.8–3.9 μm, Sigma) or 20 μm α-bungarotoxin (Invitrogen). For experiments where synaptic strength was first established in low Ca2+/high Mg2+ Rees' solution, preparations were perfused with normal Ca2+/Mg2+ Ringer for 30 min before imaging Ca2+.
Antagonist applications.
In some experiments, antagonists of P2Y (Reactive Blue 2 [RB2], 20 μm, Alexis) or muscarinic receptors (atropine, 20–80 μm or scopolamine, 20 μm, Sigma) were bath applied for 20–45 min before the start of the experiment. Stock solutions were prepared in the same extracellular Rees' solutions.
TEA application.
Neurotransmitter released by either weak or strong nerve terminal was increased using a K+ channel blocker, tetraethyl ammonium (TEA, 0.5 mm). First, a dually innervated NMJ was identified and synaptic strength of competing terminals determined. The nonpotentiated input was stimulated first at high frequency (50 Hz for 30 s), and evoked PSC Ca2+ responses were recorded under normal Ringer solution. Then, TEA was bath applied for 30 min and synaptic activity was monitored. Then, the second input (now potentiated by TEA) was stimulated at high frequency and the corresponding PSC Ca2+ responses were recorded. In some control experiments, agonists (ATP, 10 μm) were locally applied in the presence of TEA by micropressure as indicated above.
Statistical analysis.
Results are presented as mean ± SEM, and N represents the number of PSCs. Unless otherwise stated, only one PSC/NMJ was kept for further analyses. Paired t tests were performed when comparing responses induced by the two competing terminals during the same experiment. When data were found not to conform to normality, Mann–Whitney U tests were used. Unpaired t tests were performed to compare two different conditions from different experiments. One-way Kruskal–Wallis ANOVA test with Dunn's Multiple-Comparison post-test were used to compare three groups or more. Analyses were deemed significant at p < 0.05.
Results
The NMJ has proven to be one of the most useful models to study synaptic competition and elimination. However, although the presynaptic and postsynaptic changes have been studied, very little is known about PSCs during synaptic competition and elimination at the NMJ.
In this work, we investigated PSC properties and activity at P7–P8 dually innervated NMJs and their ability to decipher ongoing synaptic competition.
PSCs at dually innervated NMJs
More than 60% of NMJs are poly-innervated and undergoing synaptic competition at P7–P8 mice (Kopp et al., 2000). Lichtman and colleagues showed that each competing nerve terminal could occupy a segregated territory of endplate area (Gan and Lichtman, 1998; Walsh and Lichtman, 2003; Bishop et al., 2004), whereas Hirata et al. (1997) showed that one or two PSCs are present at poly-innervated rat NMJs.
Here, the state of synaptic innervation was determined using the presence of synaptic responses evoked by independent stimulation of ventral roots (Fig. 1A) and by immunohistological labeling of PSCs and presynaptic and postsynaptic elements (Fig. 1B). The number of PSCs was based on the criteria described in the experimental procedures using S100β labeling of PSCs combined with nuclear staining with DAPI (Fig. 1C1–2). Consistent with Hirata et al. (1997), we found an average of 1.6 ± 0.1 (8 muscles, 37 NMJs) PSCs at poly-innervated NMJs and 2.7 ± 0.2 at mono-innervated NMJs (Fig. 1D, E; 8 muscles, 14 NMJs; unpaired t test, p < 0.0001).We observed that 43.3% of poly-innervated NMJs were covered by one PSC, whereas 51.3% were covered by two PSCs. Only two NMJs had three PSCs (5.4%). In contrast, mono-innervated NMJs were generally associated with two or more PSCs (14.3% with one PSC, 21.4% with two PSCs, 42.9% with three PSCs, and 21.4% with four PSCs; Fig. 1E). Importantly, it appears that the number of PSCs is directly related to the state of synaptic competition (i.e., mono-innervated vs poly-innervated) where fewer cells appear to be present during the course of synaptic competition. Furthermore, these results show that both competing nerve terminals at a poly-innervated NMJ were often covered by a single PSC. In this work, only dually innervated NMJs were studied while the number of PSCs present was determined.
A single PSC detects neurotransmitter release from competing nerve terminals at dually innervated NMJs
A fundamental prerequisite for PSCs to decode ongoing synaptic competition is that they are synaptically responsive, detecting synaptic activity generated by both competing nerve terminals. To test this possibility, we examined the ability of PSCs to respond to synaptic activity of each individual competing nerve terminal evoked by independent ventral root stimulation. Dually innervated NMJs with one or two PSCs were chosen, and each competing nerve terminal was independently stimulated at 50 Hz for 30 s, a pattern and frequency reported in vivo for tonic firing of motor neurons innervating the SOL at P7–P8 (Gorassini et al., 2000; Eken et al., 2008). PSC activity was assessed by monitoring changes in intracellular Ca2+ levels, known to be a reliable reporter of their level of excitation and responsiveness (Jahromi et al., 1992; Robitaille, 1998; Rochon et al., 2001).
As shown in Figure 2, independent stimulation of each competing nerve terminal induced a Ca2+ response at the soma of the same PSC. From all tested NMJs, 85.7% of PSCs responded to independent neurotransmitter release from each competing input (36 PSCs of 42). The average amplitude of PSC Ca2+ response to the activity of the first input was 76.2 ± 14.9% ΔF/F0, whereas it was 62.4 ± 20.3% ΔF/F0 in response to the stimulation of the second input (Fig. 2D; N = 11, paired t test, p > 0.05).
Figure 2.
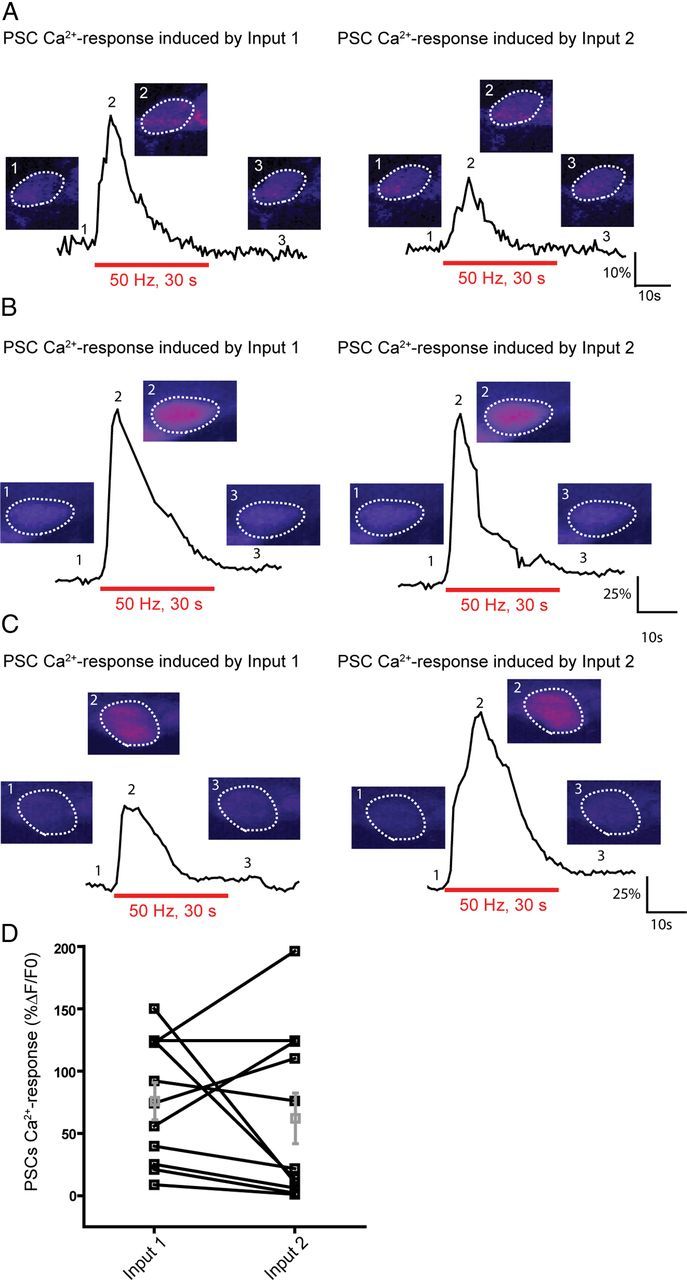
A single PSC detects synaptic activity of competing nerve terminals at dually innervated NMJs. A, Example of Ca2+ responses elicited in a PSC by independent stimulation of the two competing nerve terminals (Input 1 and Input 2). False color images of the changes in fluorescence of Fluo-4 illustrating Ca2+ levels before, at the peak of the response, and after the stimulation. Note that the first input (Input 1) induced a bigger Ca2+ response than the second one (Input 2). B, An example of PSC Ca2+ responses where both inputs induced similar PSC Ca2+ responses. C, A third example where the first input induced a smaller PSC Ca2+ response than the second one. D, Plot illustrating the diversity of PSC Ca2+ responses induced by two inputs at poly-innervated NMJs.
These results indicate that PSCs at dually innervated NMJs detect transmitter release from the two competing nerve terminals. As such, these results indicate that PSCs are synaptically responsive.
A single PSC decodes the synaptic strength of competing nerve terminals
Although a single PSC at a dually innervated endplates responded to transmitters released by each individual nerve terminal, our data revealed a large variability in the amplitude of the responses evoked by the two terminals (Fig. 2D). Indeed, we observed that the amplitude of PSC Ca2+ responses induced by the stimulation of the first competing input was sometimes higher than those induced by the second input in 51% of the tested NMJs (Fig. 2A, D), similar in 25% (Fig. 2B, D) or lower in 24% (Fig. 2C, D) of the remaining responding PSCs.
One possibility might be that Ca2+ responses in PSCs reflected the level of synaptic strength of each competing terminal. This would be consistent with the properties of PSCs at mature NMJs that decode different levels of synaptic activity by producing different Ca2+ responses (Rousse et al., 2010; Todd et al., 2010). Based on the disparity in synaptic strength between competing terminals (Colman et al., 1997; Kopp et al., 2000) and the relationship between transmitter release and the responsiveness of PSCs, we hypothesized that the weaker of the competing nerve terminals would induce smaller PSC Ca2+ responses than the stronger one.
To test this hypothesis, we performed simultaneous intracellular recordings from dually innervated NMJs combined with PSCs Ca2+ imaging. Synaptic strength of each nerve terminal was determined using two approaches; the quantal content (m) using a binomial analysis of the failure rate and paired pulse facilitation (Fig. 3A, B). At dually innervated NMJs, it is known that strong inputs show bigger quantal content and smaller paired pulse facilitation than weak ones (Kopp et al., 2000). We only considered an input to be stronger than the other when its quantal content was higher and its facilitation significantly smaller than the other one (Fig. 3A, B).
Figure 3.
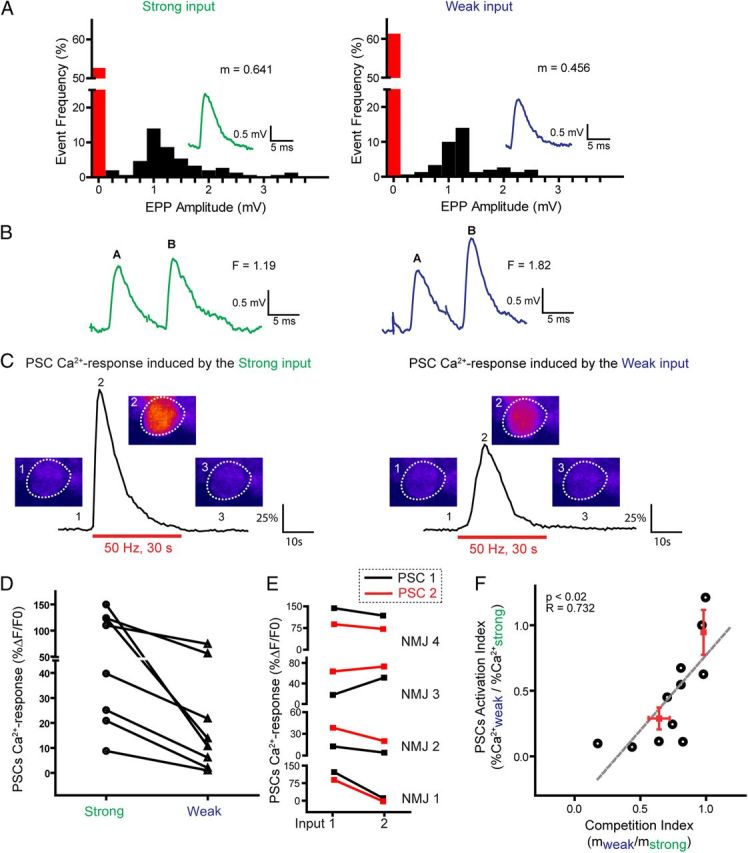
A single PSC decodes synaptic strength of competing nerve terminals at dually innervated NMJs. A, Distribution of EPP amplitude induced by stimulation of the strong and weak inputs, including failures. Inset, Examples of EPPs and calculated quantal content (m). B, Examples of EPPs and facilitation values (F) obtained from the paired-pulse (10 ms interval) independent stimulation of strong and weak inputs shown in A. C, Ca2+ responses elicited in a PSC by independent stimulation of the strong and weak competing inputs (same as in A and B). False color confocal images of changes in fluorescence of Fluo-4 illustrating Ca2+ levels before, at the peak of the response, and after stimulation. D, Plot of the amplitude of PSC Ca2+ responses induced by strong (circle) and weak (triangle) terminals. PSC Ca2+ responses induced by terminals in competition at the same NMJ are connected with a black line. Note that strong inputs always induced larger Ca2+ responses than weak inputs. E, Ca2+ responses induced in two PSCs at the same dually innervated NMJs. Note that the relationship between Ca2+ responses elicited by the two inputs was the same for both PSCs (black and red) at the same NMJ. F, Relationship between the relative synaptic strength of the competing nerve terminals (CI, x-axis) and the relative responsiveness of the PSCs upon their activation by the independent activity of the competing nerve terminals (PSC activation index, y-axis). Each point (●) represents an individual experiment, and the red points are the average for the experiments where synaptic strength ratio was close to 1 and close to 0.5. The strong linear relationship (r = 0.732; p < 0.02) indicates that PSC responsiveness is tightly influenced by the disparity of the strength of the competing nerve terminals.
Interestingly, sustained and repeated activity of strong inputs (50 Hz, 30 s) always elicited larger Ca2+ responses in PSCs than the weak ones (75.3 ± 20.1% ΔF/F0 vs 23.2 ± 9.6% ΔF/F0, N = 8; paired t test, p = 0.02) (Fig. 3C, D). Importantly, stimulating the weak input before the strong one or vice-versa, did not influence the ability of PSCs to respond to the synaptic activity and did not influence the size of the Ca2+ response elicited (data not shown). As a direct corollary of this observation, one would predict that competing inputs with similar synaptic strength at the same NMJ should trigger similar Ca2+ responses in PSCs. As expected, competing nerve terminals with similar synaptic strength (quantal content 0.32 ± 0.06 vs 0.33 ± 0.06, N = 4; paired t test, p > 0.05) showed similar PSC Ca2+ responses (119.2 ± 27.9% ΔF/F0 vs 107.3 ± 9.4% ΔF/F0, N = 4; paired t test, p > 0.05). Interestingly, similar observations were made when two PSCs were present at dually innervated NMJs (Fig. 3E), indicating that both PSCs performed the same decoding of synaptic strength and underwent similar interactions with both competing nerve terminals.
Decoding by PSCs may be limited simply to the determination of the weakest and strongest inputs, leading to a bimodal distribution. Alternatively, it is also possible that PSCs decode the relative strength of each input, whereby a linear relationship between PSC Ca2+ responses and synaptic strength should be observed. To examine this possibility, we represented synaptic competition and the state of relative synaptic efficacy of competing nerve terminals using a competition index (CI). The CI was calculated as follows: CI = quantal content of weak input/quantal content of strong input.
It represented the disparity in the synaptic strength of the competing nerve terminals, a key parameter of synaptic competition. A CI of 1 indicated that the two competing terminals had similar synaptic strength, whereas a CI < 1 meant that an input was stronger than the other. We then plotted the relative PSC responsiveness to the competing nerve terminals using a PSC activation index (PAI). PAI was calculated as follows: PAI = PSC Ca2+ response induced by weak input/PSC Ca2+ response induced by strong input.
It represented the disparity in PSC Ca2+ responses induced by each competing nerve terminals. A PAI of 1 indicated that the two terminals induced similar PSC Ca2+ responses, and a PAI < 1 meant that one input induced a bigger PSC Ca2+ response than the other.
As shown in Figure 3F, the PAI is tightly related to the CI (linear regression, r = 0.732; slope significantly non-0, p < 0.02). Competing terminals with similar synaptic strength (CI ≈ 1) induced similar PSC Ca2+ responses (PAI ≈ 1), whereas those with different synaptic strength (CI < 1) induced different PSC Ca2+ responses (PAI < 1). Importantly, the state of the competition was directly reflected in PSC responsiveness as indicated by the tight relationship between PAI and CI. Hence, these results suggest that PSC responsiveness was tightly related to the relative synaptic strength of competing terminals. Furthermore, a single PSC at a dually innervated NMJ differentiated weak and strong inputs and decoded their relative synaptic strength.
Decoding by PSCs does not solely depend on neurotransmitter release
Because of PSC sensitivity to neurotransmitter release, the difference in their responsiveness to strong and weak nerve terminals may simply be the result of the different level of transmitter release produced by each terminal. However, it is also known that the responsiveness of PSCs at adult NMJs is also in part determined by their intrinsic properties (Rousse et al., 2010). Hence, we examined whether differential PSC responses to the activity of competing nerve terminals were solely the result of the level of transmitter release or whether their intrinsic properties were adapted to each competing nerve terminal. To test this hypothesis, we increased the level of neurotransmitter released by the weak nerve terminal using a K+ channel blocker, TEA (0.5 mm). TEA did not directly alter the responsiveness of PSCs to local application of agonists (data not shown). This is consistent with the observation that PSC Ca2+ responses are not dependent on voltage-gated channels and membrane excitability but rather on G-protein coupled receptors (Robitaille, 1998; Wang et al., 2006; Rousse et al., 2010). If PSC responsiveness were solely determined by the level of transmitter release, one would predict that Ca2+ responses elicited by an increased level of transmitter release from the weak nerve terminal should evoke larger Ca2+ responses in PSCs.
We first determined in control situation the amount of transmitter released during the high-frequency stimulation because this was the synaptic activity that triggered PSC activation. We calculated the cumulative quantal release of neurotransmitters by strong and weak competing inputs during the high-frequency stimulation (HFS; 50 Hz, 30 s): EPP amplitude (% Ctrl) × quantal content, at each time point during the HFS. As expected, the strongest input had a higher cumulative quantal release than the weakest one, suggesting that more neurotransmitter was released (Fig. 4A–C). At the end of the HFS (time 30 s), the strongest input had a cumulative quantal release of 289.9 ± 40.8, which was significantly higher than the cumulative quantal release of the weakest input (161.9 ± 18.1, N = 4; paired t test, p < 0.05). Importantly, this difference was noticeable early during the HFS, a period during which PSC activation took place. Indeed, the strongest input had a cumulative quantal release of 35. ± 5.1 after the first 3 s, which was significantly higher than the one of the weakest input (21.5 ± 2.3, N = 4; paired t test, p < 0.05, Fig. 4C). Also, as shown before, the strong input that released more neurotransmitter induced larger PSC Ca2+ responses than the weak input (strong: 127.0 ± 8.3% ΔF/F0 vs weak: 38.6 ± 15.7% ΔF/F0; N = 4; paired t test p < 0.05).
Figure 4.
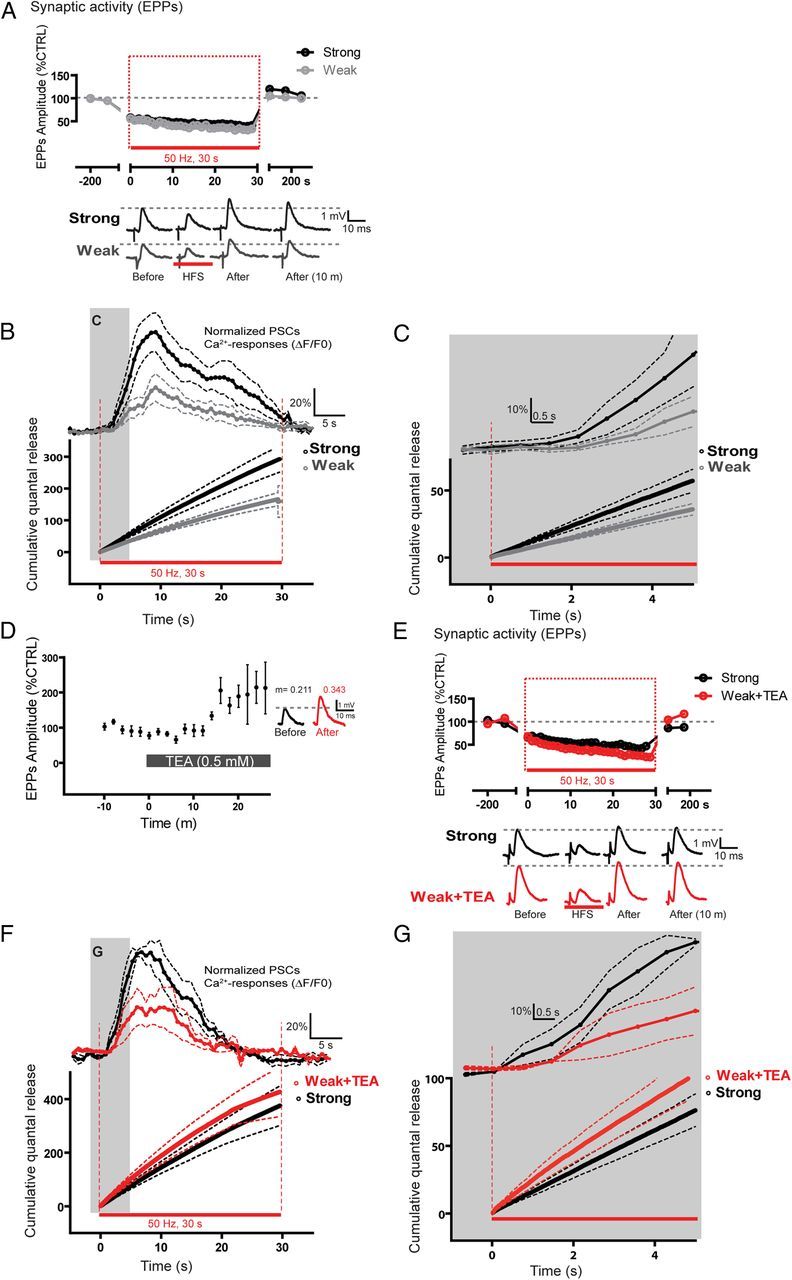
PSC Ca2+ responses do not solely depend on the amount of neurotransmitters released. A, Top, Changes in EPP amplitude before, during, and after motor nerve stimulation (red bar) of the strong (black) and weak (gray) competing inputs at the same NMJ. Period of high-frequency stimulation used to elicit PSCs Ca2+ responses is highlighted (red rectangle). Bottom, Examples of EPPs induced by stimulation of strong and weak inputs before, during, and after high-frequency stimulation. B, Cumulative quantal release ± SEM (dotted lines) obtained during the high-frequency stimulation (red box in A) of strong (black) and weak inputs (gray) at dually innervated NMJs. Top, Corresponding average PSC Ca2+ responses ± SEM (dotted lines) induced by synaptic activity of weak (gray) and strong (black) inputs. Ca2+ responses are temporally aligned with the timing of the synaptic activity. Note that the strong input had a higher cumulative quantal release and evoked larger PSC Ca2+ responses. The gray zone frames the part illustrated in C. C, Similar representation as in B, but illustrating the first 5 s of the stimulation period to emphasize the different kinetics of transmitter release and PSC responses at the onset of activity. D, Effect of TEA (0.5 mm) bath application on EPP amplitude of weak inputs at dually innervated NMJs. Inset, Examples of EPPs and the calculated quantal content (m) before and during TEA application. Note that TEA increased both EPP amplitude and quantal content of weak terminals. E, Top, Changes in EPP amplitude before, during, and after motor nerve stimulation (red bar) for the strong (black) and weak TEA-potentiated (red) competing inputs of the same NMJ. The period of high-frequency stimulation eliciting PSC Ca2+ responses is highlighted (red rectangle). Bottom, Examples of EPPs induced by the stimulation of strong and weak inputs before, during, and after high-frequency stimulation. F, Cumulative quantal release ± SEM (dotted lines) obtained during high-frequency stimulation (red rectangle in E) of weak TEA-potentiated (red) and strong inputs (black) at dually innervated NMJs. Transmitter release of the weak nerve terminal was potentiated by TEA (0.5 mm) so that it was similar or even slightly larger than the levels observed at nonpotentiated strong inputs. Top, Average of the corresponding PSC Ca2+ responses ± SEM (dotted lines) induced by synaptic activity of the unchanged strong (black) and the weak potentiated input by TEA (red). Note that PSC Ca2+ responses triggered by potentiated weak input were still smaller than those triggered by the nonpotentiated strong input. The gray zone frames the part of the figure illustrated in G. G, Similar representation as in F, but illustrating the first 5 s of the stimulation period.
In another set of experiments, we determined the basal level of quantal release and synaptic strength of competing nerve terminals; and then, the strong input was stimulated (HFS; 50 Hz, 30 s), monitored PSC Ca2+ responses, and calculated the cumulative quantal release of neurotransmitters (Fig. 4F). Then, TEA (0.5 mm) was bath applied, and changes in transmitter release of the weak terminal were monitored. As shown in Figure 4D, bath application of TEA potentiated transmitter release of the weak nerve terminal to 189.1 ± 31.6% of control after 20 min (N = 4; paired t test, p < 0.05). TEA raised the quantal content of the weak nerve terminal from 0.11 ± 0.03 to 0.59 ± 0.17 (N = 4; paired t test, p < 0.05), a level that was no longer significantly smaller than the one of the nonpotentiated strong nerve terminal. The cumulative quantal release from the weak TEA-potentiated input was not different from the strong input in absence of TEA (strong: 375.3 ± 73.76 vs weak + TEA: 427.1 ± 92.19; N = 4; paired t test, p > 0.05, Fig. 4E–G).
If decoding by PSCs solely depended on the amount of neurotransmitters released, the potentiated weak input should have induced larger PSC Ca2+ responses. However, as shown in Figure 4F, G, average amplitude of PSCs Ca2+ responses induced by neurotransmitters released from the potentiated weak terminals was 25.7 ± 11.0% ΔF/F0, which remained significantly lower than those induced by the strong terminals in the absence of TEA (45.1 ± 13.4% ΔF/F0, N = 4; paired t test, p < 0.05). These data indicate that increasing neurotransmission from the weak input did not alter the amplitude of PSC Ca2+ responses. Similar results were obtained when potentiating the strong input (data not shown). Thus, this strongly suggests that decoding of synaptic competition by PSCs did not solely depend on the amount of neurotransmitter released but relied also on their intrinsic properties.
A single PSC decodes the synaptic strength of competing nerve terminals via functionally segregated sets of receptors
We next examined the mechanisms by which a single PSC selectively detected and decoded ongoing synaptic competition, which could be part of PSC intrinsic properties. It has been shown that competing presynaptic terminals are spatially separated and facing their own pool of postsynaptic nicotinic receptors (Gan and Lichtman, 1998; Keller-Peck et al., 2001; Walsh and Lichtman, 2003; Wyatt and Balice-Gordon, 2003; Bishop et al., 2004). We tested whether PSCs used also dedicated pools of receptors to differentiate competing inputs. We used the properties of PSC receptor desensitization known to occur at mature NMJs. PSC receptor desensitization caused a reduction of the amplitude of Ca2+ responses at the same PSC when elicited by two series of sustained synaptic activity at interval of 20 min (Rochon et al., 2001). Hence, one would predict that a rundown of the Ca2+ response would be observed if PSCs used the same sets of receptors to detect the activity of competing nerve terminals.
First, we examined whether a rundown of Ca2+ responses was observed at PSCs of dually innervated NMJs by stimulating the same nerve terminal twice at 20 min interval and monitoring Ca2+ responses in the PSC. If PSCs at immature NMJs expressed the same property as in the adult, one would expect to see a rundown of the Ca2+ response, with the amplitude of the response evoked by the second stimulation being smaller than the first one. As shown in Figure 5A, D, a rundown was indeed observed in PSC Ca2+ responses where the amplitude to a second motor nerve stimulation was significantly smaller than the first one (first stimulation, 37.5 ± 16.4% ΔF/F0 vs second stimulation, 14.1 ± 11.1% ΔF/F0, N = 5; paired t test, p = 0.02). Importantly, the rundown of the PSC Ca2+ response cannot be attributed to a decrease in neurotransmission. Indeed, Figure 5B shows that EPP amplitude evoked during the first and second HFS was not significantly different (normalized EPP amplitude: first stimulation, 58.60 ± 7.53% vs second stimulation, 66.09 ± 8.37%, N = 5; paired t test, p > 0.05).
Figure 5.
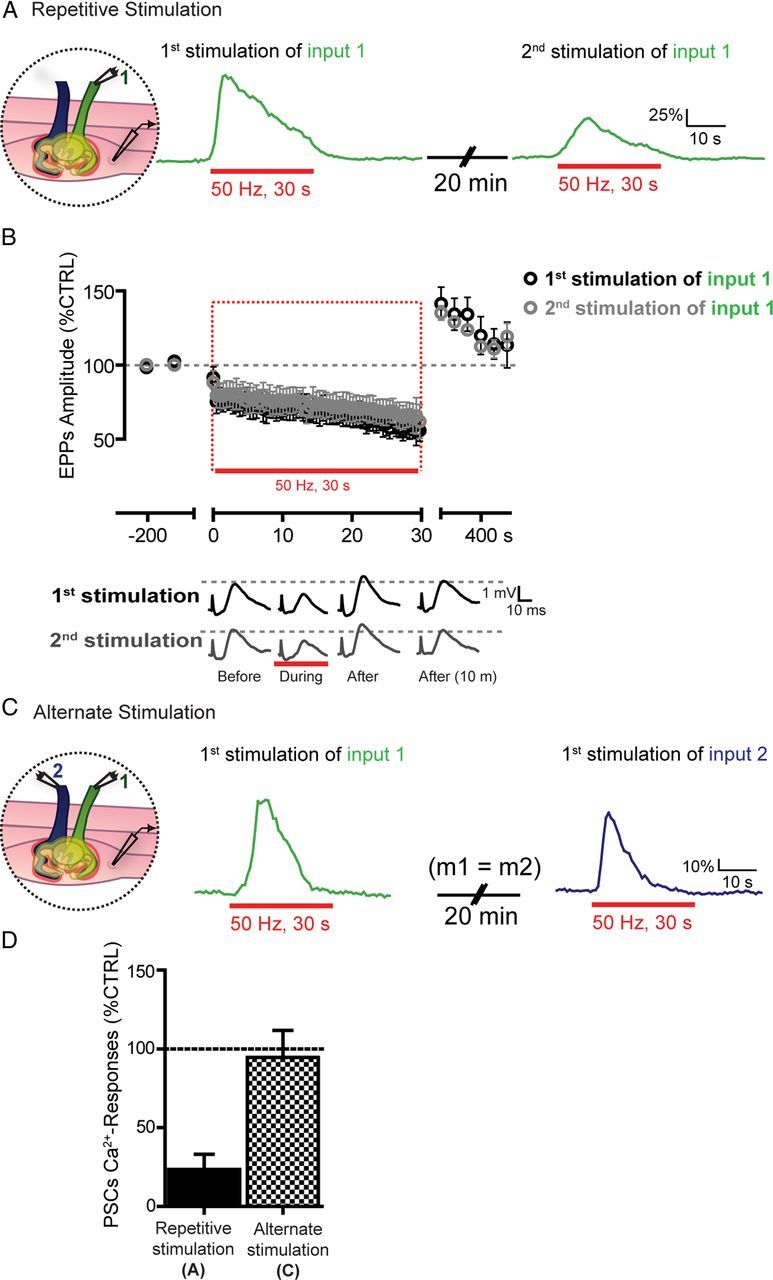
Rundown in PSC Ca2+ responses after repetitive stimulations. A, PSC Ca2+ responses induced by the sustained stimulation of the same input (Input 1). Note that the second PSC Ca2+ response induced by the second stimulation of the same input was smaller than the first one. B, Top, Changes in EPP amplitude ± SEM before, during, and after the first (black) and second (gray) nerve stimulation of the same input (Input 1). The period of high-frequency stimulation used to elicit PSCs Ca2+ responses is highlighted (red rectangle). Bottom, Examples of EPPs induced by the first and second stimulation of Input 1 before, during, and after the high-frequency stimulation. Note that EPP amplitudes induced by the first and second stimulation of the same input are similar. C, PSC Ca2+ responses induced by the alternate stimulation of Input 1 followed, 20 min later, by the stimulation of Input 2 at NMJs where both inputs had similar quantal content (m1 indicates the quantal content of Input 1; and m2, the quantal content of Input 2). Note that Ca2+ responses from both PSCs were similar, with no evident rundown. D, Histogram showing the mean of the normalized amplitude of the second PSC Ca2+ responses in the repetitive (same input, black, A) and alternate paradigms (alternate inputs, gray, C).
The rundown of PSC Ca2+ responses should not be observed with alternate sequential stimulation of each input whether a PSC decoded synaptic strength of the two competing terminals via different sets of receptors. In this specific set of experiments, we only studied dually innervated NMJs where competing terminals had similar synaptic strength to avoid any variability in PSC responses because of differences in synaptic strength of the terminals. As shown in Figure 5C, D, no rundown in PSC Ca2+ response was observed when alternate stimulation of the two competing nerve terminals was performed. The amplitude of the first Ca2+ response was 119.2 ± 27.9% ΔF/F0, whereas the amplitude of the response elicited 20 min later by stimulating the second nerve terminal was 107.3 ± 9.4% ΔF/F0 (Fig. 5C, N = 4; paired t test, p > 0.05). These results suggest that a single PSC detected neurotransmitter release and decoded synaptic strength of the competing nerve terminals via functionally segregated sets of receptors.
PSCs activation is not mediated by muscarinic receptors
One possible mechanism that might explain the difference in the responsiveness of PSCs to weak and strong nerve terminals was that PSCs used different types of receptors for each competing input. At adult NMJs, it is known that PSC Ca2+ responses are mediated by cholinergic and purinergic receptors activated by the presynaptic release of ACh and ATP during synaptic activity (Robitaille, 1995; Rochon et al., 2001). We used selective antagonist for each receptor type to test their relative contribution to the activation of PSCs by the competing terminals. Because of the rundown of Ca2+ responses, amplitude of responses elicited by the strong and weak terminals presented in Figure 3C, D was used as control.
We first tested the contribution of muscarinic receptors (mAChR) because they are the main receptor system through which PSCs are activated in adult NMJs (Rochon et al., 2001). To test the contribution of these receptors in the decoding of synaptic strength by PSCs, we stimulated independently each of the competing terminals in the presence of the general muscarinic receptor antagonist atropine (60 μm) applied in the bath. Atropine is known to block synaptic-dependent activation of PSCs of adult mammalian NMJs (Rochon et al., 2001). Surprisingly, atropine had no effect on PSC Ca2+ responses induced by the stimulation of the strong or weak input (Fig. 6A, C). Indeed, the amplitude of PSC Ca2+ responses induced by neurotransmission from the strong input in the presence of atropine was not different from control (70.5 ± 22.1% ΔF/F0 in atropine, N = 4 vs 75.3 ± 20.1% ΔF/F0 in control, N = 8; one-way Kruskal–Wallis ANOVA test, Dunn's Multiple-Comparison post-test, p > 0.05). This was also the case for PSC Ca2+ responses induced by neurotransmission from the weak input where no significant difference was noticed (37.6 ± 18.8% ΔF/F0 in atropine, N = 4 vs 26.3 ± 10.4% ΔF/F0 in control, N = 7; one-way Kruskal–Wallis ANOVA test, Dunn's Multiple-Comparison post-test, p > 0.05). Similar results were obtained with scopolamine, another large spectrum muscarinic antagonist (data not shown).
Figure 6.
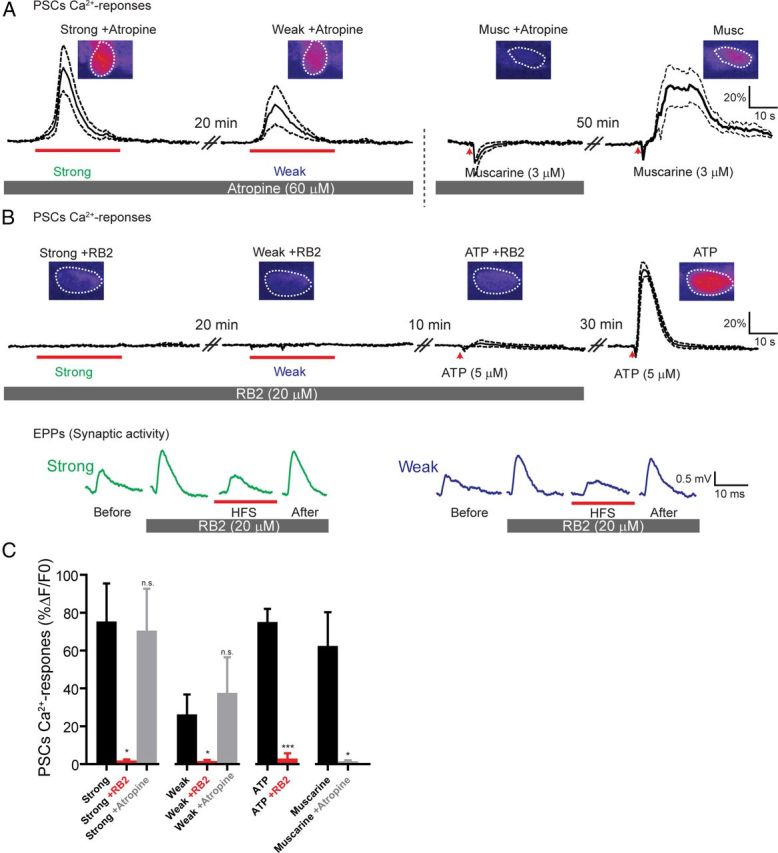
PSCs Ca2+ responses are mediated by P2Y receptors, not muscarinic receptors. A, PSC responsiveness to ventral root stimulation during bath application of the mAChR antagonist, atropine (60 μm). Note that atropine did not prevent PSC Ca2+ responses induced by the strong and the weak input stimulations but antagonized responses induced by local application of the mAChR agonist, muscarine (3 μm). The dark trace represents the average of PSC Ca2+ responses; and the dotted lines represent SEM. Inset, False color confocal images showing changes in fluorescence of Fluo-4 at the peak of the response. B, Top, PSC Ca2+ activity evoked in the presence of the P2Y receptor antagonist, RB2 (20 μm). Note that no Ca2+ responses were evoked in the presence of RB2 either by stimulation of the strong or the weak input. Also, responses induced by local application of the P2Y receptor agonist, ATP (3 μm), were antagonized. Bottom, Examples of EPPs induced by the strong and weak inputs before and during RB2 application. Note that the lack of PSC Ca2+ responses cannot be attributed to the absence of synaptic activity because EPPs were still elicited by motor nerve stimulation. C, Histogram showing PSC Ca2+ responses induced by strong and weak inputs and local application of agonists in the different conditions studied.
We next examined whether the lack of contribution of mAChR to PSC activation was the result of the absence of functional mAChR. We tested this possibility by locally applying the mAChR agonist muscarine (3 μm) on PSCs. As shown in Figure 6A, C, local application of muscarine elicited PSC Ca2+ responses after atropine washout (62.45 ± 17.84% ΔF/F0, N = 4). No Ca2+ responses were induced by local muscarine application in the presence of atropine (1.524 ± 0.5374% ΔF/F0, N = 4, paired t test, p < 0.05, Fig. 6C), further confirming the efficiency of the muscarinic antagonist.
These results indicates that PSC mAChRs were not activated by neurotransmitter release from the strong or the weak input with the stimulation parameters used and were not required for the proper decoding of the synaptic strength by PSCs in the experimental conditions tested.
PSC activation is mediated by purinergic receptors
We next tested the contribution of purinergic receptors because synaptic ATP is known to activate PSCs via these receptors (Rochon et al., 2001; Todd and Robitaille, 2006). We stimulated independently each of the competing terminals in the presence of the general P2Y receptor antagonist, RB2 (Claes et al., 2004; De Lorenzo et al., 2006), applied in the bath perfusion. As shown in Figure 6B, C, neither the stimulation of the strong nor the weak input elicited a detectable PSC Ca2+ response in the presence of RB2 (strong with RB2, 2.0 ± 0.5% ΔF/F0, N = 5 vs control, 75.3 ± 20.1% ΔF/F0 N = 8; weak with RB2, 2.0 ± 0.6% ΔF/F0, N = 5 vs control, 26.3 ± 10.4% ΔF/F0 N = 7, one-way Kruskal–Wallis ANOVA test, Dunn's Multiple-Comparison post-test, p < 0.05, Fig. 6C). Differences in PSC Ca2+ responses induced by the stimulation of the strong or weak input were no longer noticeable because no responses were induced. Furthermore, the absence of synaptic-induced Ca2+ responses in PSCs cannot be explained by a reduction in transmitter release. Indeed, intracellular recordings showed that EPPs were still evoked by the stimulation of the strong or the weak input in the presence of RB2 (Fig. 6B). Hence, the lack of PSC Ca2+ responses was not the result of the absence of synaptic activity but the blockade of P2Y receptors on PSCs.
The responsiveness of PSCs to ATP was further tested by local application of ATP (5 μm) as the agonist. ATP did not elicit Ca2+ responses in presence of RB2 (2.9 ± 2.8% ΔF/F0, N = 4) but fully recovered after 30 min of washout (75.1 ± 6.9% ΔF/F0, N = 4; paired t test p = 0.0007; washout vs RB2). Therefore, this strongly suggests that decoding of synaptic strength of competing nerve terminals by PSCs was mediated by P2Y receptors. Together, these results show that PSCs used the same type of receptors, P2Y receptors, to detect the activity of competing nerve terminals. Although they were present and functional, muscarinic receptors were not used for synaptic communication with PSCs at immature NMJs in the paradigm studied.
Localization and distribution of P2Y receptors on PSCs
Our data indicate that PSCs decoded synaptic competition via functionally segregated P2Y receptors, whereas muscarinic receptors did not participate in this decoding even though they were present and functional. This differential involvement of the two receptor systems may have a morphological basis such that the purinergic receptors were preferentially associated with release sites whereas muscarinic receptors were not. Hence, we performed a series of immunohistochemical labeling to determine the relative distribution of purinergic and muscarinic receptors and assessed their respective distribution in relation with presynaptic and glial markers.
We first examined the spatial distribution of P2Y receptors at poly-innervated NMJs. Poly-innervation was confirmed by the presence of two axons innervating the same endplate, revealed by the neurofilament labeling. We focused on P2Y1R based on the pharmacological signature of the Ca2+ responses (Robitaille, 1995; Rochon et al., 2001). As shown in Figure 7A, C, P2Y1R were present at poly-innervated NMJs (13 NMJs, 6 muscles). P2Y1R labeling was localized at the endplate area along with the presynaptic (SV2 and neurofilament) and postsynaptic (α-bungarotoxin) markers. Interestingly, the P2Y1R labeling was punctuated with puncta of different sizes and intensity distributed over the NMJ area.
Figure 7.

P2Y1Rs at poly-innervated NMJs. A, z-stack of false color of 9 confocal images of immunohistochemical labeling of type 1 P2Y receptors (P2Y1R; green), postsynaptic nAChRs (α-bungarotoxin; red), and presynaptic terminals (NF-SV2; gray) at a P7 poly-innervated NMJ. Note that P2Y1Rs were arranged in “hotspots,” with a punctuated distribution throughout the endplate area (in red). B, A single focal plane of the NMJ presented in A showing P2Y1Rs (green) and postsynaptic nAChRs (red). Note that P2Y1Rs and nAChRs are located at a different level and do not colocalize (dashed lines and arrows represent 2 regions where P2Y1R and nAChR did not overlap). C, Confocal z-stack of 5 images of en face view of a P7 poly-innervated NMJ showing P2Y1R (green), presynaptic terminals (NF-SV2; red), and dextran-loaded PSCs (gray). Note that P2Y1R labeling was present in the area of the dextran-loaded PSCs. Dotted boxes in the right panel highlight the regions enlarged in D and E. D, Higher magnification of a part of the NMJ presented in C. Note the puncta of P2Y1Rs (green) over the area of the PSCs, interspersed in between presynaptic labeling and closely associated with presynaptic active zones (NF-SV2; red). Note also that very few P2Y1 hotspots colocalized with presynaptic elements (yellow spots, asterisks in right panel). E, Same as in D but illustrating the E dotted box highlighted in C. F, An image of a single plane focusing on the top of the NMJ showing hotspots of P2Y1R (green) localized within the dextran-loaded PSC (gray) where the presynaptic staining (NF -SV2; red) was out of focus (arrows). Scale bars: A–C, F, 5 μm; D, E, 2 μm.
We next determined with which synaptic compartment the P2Y1R labeling was associated. First, we determined whether the labeling was on the postsynaptic side of the endplate area or whether it was preferentially located in the presynaptic/PSC area. To determine this, we observed NMJs located on the side of muscle fibers. If located in the postsynaptic side, the P2Y1R labeling should be intermingled with the α-bungarotoxin staining. However, as shown in Figure 7B, the P2Y1R labeling was located above the postsynaptic receptor staining, indicating that it was located in the presynaptic and/or PSC compartments.
Next, we used two strategies to determine whether the P2Y1R were preferentially located in the presynaptic elements or in the PSCs. PSCs were identified using the single-cell electroporation technique (Fig. 7C) as the S100β antibody cross-reacted with the one used for labeling the P2Y1R. First, we analyzed the distribution of P2Y1R puncta (green) in relation with the SV2 labeling, indicative of active zone labeling (red). If the two labels overlapped, indicative of a presynaptic localization, one should see a significant level of yellow pixels (green and red gives yellow) in the overlay image. However, whether the two labels did not overlap, the initial colors of the labels should be unaltered when overlaid. As shown in Figure 7D, E, only a few yellow hotspots were observed within the boundary of the PSCs. Interestingly, the hotspots of P2Y1R were often juxtaposed to active zones revealed by the SV2 labeling. Second, we observed a number of P2Y1R hotspots located at focal planes above the presynaptic labeling (Fig. 7F), probably in PSC compartments that sit on top of the presynaptic terminals. Hence, the presence of P2YRs in PSCs above the presynaptic terminals and the very poor overlap between the P2Y1R labeling and the presynaptic markers strongly argue that these receptors were preferentially located in PSCs, juxtaposed to the presynaptic release sites. This is consistent with their role in the detection of transmitter released by the competing nerve terminals.
Localization and distribution of muscarinic receptors on PSCs
We next examined the presence and distribution of muscarinic receptors to determine their distribution in relation with presynaptic markers. Because our data revealed that PSC functional muscarinic receptors were not required for decoding synaptic strength of competing terminals, we hypothesized that muscarinic receptors, unlike P2Y receptors, were not in close juxtaposition with SV2 positive sites, thus limiting their activation. To test this possibility, we labeled type 3 (mAChR3) and 5 (mAChR5) muscarinic receptors to study their distribution at the NMJ.
As shown in Figure 8, these receptors were present at the NMJ, as revealed by their immunolabeling associated with presynaptic and postsynaptic markers. Similarly to P2Y1 receptors, muscarinic receptors were not found in the postsynaptic compartment as indicated by the distribution of the labeling located above the α-bungarotoxin staining observed on NMJs located on the side of the muscle fiber (Fig. 8B).
Figure 8.

Type 5 and Type 3 mAChRs at poly-innervated NMJs. A, False color confocal z-stack of 10 images of immunohistochemical labeling of Type 5 mAChRs (mAChR5; green), postsynaptic nAChRs (α-bungarotoxin; red), and presynaptic terminals (NF-SV2; gray) at a P7 poly-innervated NMJ. Note the diffuse organization of mAChR5 that covers most of the endplate area in red. B, A single focal plane of the NMJ presented in A showing mAChR5 (green) and postsynaptic nAChRs (red). Note that mAChR5 and nAChR were located at a different level and did not colocalize (hyphenated lines and arrows show 2 regions where mAChR5 and nAChR did not overlap). C, False color confocal z-stack of 5 images of quadruple immunohistochemical labeling of another P7 poly-innervated NMJ showing the diffuse distribution of mAChR5 (green), postsynaptic nAChRs (α-bungarotoxin; red), presynaptic terminals (NF -SV2; gray), and PSCs (S100β; cyan). D, False color confocal z-stack of 5 images of quadruple immunohistochemical labeling of another P7 poly-innervated NMJ showing the distribution mAChR3. As for mAChR5, mAChR3 labeling was diffuse and uniform throughout the endplate area (red). Scale bars, 5 μm.
We next examined the muscarinic receptor distribution to determine whether they were clustered in hotspots. As shown in Figure 8C, D, even though hotspots and clustering of receptors were sometimes observed, the labeling of mAChR5 and mAChR3 was mostly unstructured (14 NMJs, 5 muscles for mAChR5; 11 NMJs, 4 muscles for mAChR3), presenting a more uniform and even distribution throughout the area of the NMJ. This is similar to what has been reported for muscarinic receptors distribution at NMJs of newborn rats (Garcia et al., 2005). This uniformity in the receptor labeling prevented further characterization of the localization of the synaptic compartments in which they were present. Hence, these data suggest that the muscarinic receptors, unlike P2Y1Rs, were not specifically associated with active zones.
Is there a territorial distribution of P2Y receptors?
We finally examined the overall distribution of P2YR to determine whether the decoding of the strong and weak inputs by PSCs could be explained by a preferential association of the P2YR with the strong nerve terminal. Knowing that competing nerve terminals can occupy defined territories, we postulated that the overall distribution of P2YR should reflect this territorial organization, resulting in a preferential accumulation of P2YR hotspots on a portion of the PSC, presumably reflecting the nerve terminal territories.
As shown in Figure 9A, it was indeed possible to observe such uneven distribution of P2YRs whereby some areas showed more numerous and/or brighter hotspots than another area of the poly-innervated NMJ. However, we also observed examples where the overall distribution of P2YRs hotspots was more evenly spread (Fig. 9B). These results may reflect the variability in the strength of the competing nerve terminals.
Figure 9.

Territorial distribution of P2Y1R receptors at poly-innervated and mono-innervated NMJs. A, False color confocal z-stack of 16 images of P2Y1R labeling (left; blue) showing two regions (dotted lines and arrows) of different fluorescence intensity at the NMJ. Black/dark blue represents low pixel intensity; and light blue/white, higher intensities. The corresponding AChR labeling delineates the endplate area (right; α-bungarotoxin in gray). Note that the region on the right shows higher fluorescence intensity than the left one, suggesting that more P2Y1Rs were present. B, z-stack of 10 images of another poly-innervated NMJ showing a more uniform distribution of P2Y1Rs (left, blue) throughout the endplate area (right, α-bungarotoxin in gray). C, z-stack of 8 images of a P7 mono-innervated NMJ showing a nonuniform distribution of P2Y1Rs where the left region had higher fluorescence intensity than the right one, suggesting that more P2Y1Rs were present (dotted lines and arrows) over the endplate area (right; α-bungarotoxin in gray). D, z-stack of 10 images of another P7 mono-innervated NMJ showing a more uniform distribution of P2Y1Rs (left; blue) throughout the NMJ (right; α-bungarotoxin in gray). Scale bars, 5 μm.
To ascertain this possibility, we examined the distribution of P2YRs at mono-innervated NMJs as it could not be influenced by the state of innervation and territorial organization. As shown in Figure 9, we also observed both uneven (Figure 9C) and more uniform (Figure 9D) distributions of P2YR hotspots on mono-innervated NMJs. This indicates that the state of innervation and the presence of the overall synaptic strength of each nerve terminal did not account for the distribution of P2YRs.
Discussion
Here we show that glial cells at immature NMJs undergo similar interactions with their neuronal counterparts, as was shown for mature synapses. However, we reveal an additional level of sophistication whereby a single PSC interacts with two independent competing inputs at the same NMJ by decoding their synaptic efficacy based on selective activation of different receptor pools, level of transmitter release, and intrinsic properties of PSCs. These properties should allow PSCs to intervene actively in activity-dependent modulation of synaptic competition.
Responsiveness of PSCs
For PSCs to influence synaptic competition in an activity-dependent manner, an important requirement was that they detect synaptic activity of competing nerve terminals. Similar to adult NMJs (Rochon et al., 2001; Todd et al., 2010), we showed that PSCs were as efficient in detecting transmitter release at this age and developmental stage as indicated by a reliable activation of PSCs (high percentage of responsive cells) that elicited robust and consistent Ca2+ elevation.
Interestingly, PSCs at mature and developing NMJs differ by the type of activated receptors. Indeed, PSCs at mature NMJs detect neurotransmitters using a combination of purinergic and muscarinic receptors (Rochon et al., 2001), whereas PSC activation solely depends on P2Y receptors during synaptic competition at the age studied. Hence, it appears that the purinergic receptor system is predominant during early developmental stages, even though the muscarinic receptor system was present and functional. The lack of muscarinic contribution to synaptic-induced PSC activation, even though the receptors are functional, may be the result of the absence of structured distribution of muscarinic receptors at proximity of active zones.
Therefore, a switch from a purinergic to a mixed muscarinic/purinergic signaling during synapse maturation surely underlies a change in the properties and functions of the PSCs themselves. This is supported by changes in PSC properties after denervation and the expression of glial fibrillary acidic protein known to be regulated by muscarinic receptors (Georgiou et al., 1999). An interesting possibility is that different receptors play different roles so that the muscarinic regulation would mainly stabilize PSCs while the purinergic system would be less restrictive, thus more prominent during synapse formation and maturation where large functional and morphological changes occur. This is also supported by a study showing that PSCs at immature NMJs are highly dynamic, becoming more quiescent with age (Brill et al., 2011).
One PSC, two synaptic inputs
One of the challenges during synaptic competition and elimination is that a single PSC must integrate synaptic information from both competing inputs. A main constraint for a single PSC in such context is to elaborate a strategy to detect synaptic activity from both nerve terminals while maintaining its ability to segregate and identify each activation to a given nerve terminal.
As a whole, our data strongly argue that the selective detection of competing nerve terminals is achieved by maintaining a functional segregation of receptors, with P2YR clustered in hotspots at proximity of active zones. However, there was no clear territorial distribution of these receptors on a portion of a PSC, associated with a given nerve terminal, that could have explained their differential responsiveness to each input. Instead, our data suggest that this segregation is based on functional properties rather than on a nonuniform distribution of the receptors. Interestingly, the functional segregation of P2YRs and their preferential clustering at proximity of active zones are in accordance with the general organization of NMJs in the midsts of synaptic competition because each presynaptic terminal uses exclusive sets of postsynaptic receptors (Gan and Lichtman, 1998; Keller-Peck et al., 2001; Walsh and Lichtman, 2003; Wyatt and Balice-Gordon, 2003; Bishop et al., 2004). Knowing that the occupancy of the synaptic territory is quite dynamic and changes during the course of the competition (Turney and Lichtman, 2012), it would be of interest to determine whether PSC receptor properties and distribution also follow similar dynamic alteration in the course of the process.
Receptor distribution and density could also be a determining factor establishing PSC intrinsic properties. Indeed, the inability of TEA to further increase the size of Ca2+ responses elicited by synaptic activity could be explained by the presence of different number of receptors and/or receptors at some distance from the release sites. In these conditions, releasing more neurotransmitter would have little effect on PSC Ca2+ response because all receptors would be already optimally activated or that there would be sufficient time for the ecto-enzymes to degrade ATP before it reaches the PSC receptors (Robitaille, 1995). Furthermore, PSC receptor distribution and segregation may be regulated by the level of synaptic activity where PSCs could organize the distribution of its fine processes and receptors to optimize the detection of transmitter release occurring at single active zones. The distribution of purinergic receptors, but not the muscarinic ones, in the vicinity of active zones (identified by the SV2 labeling) strongly argues in favor of this interpretation.
In this study, specific Ca2+ responses to weak and strong terminals occur throughout the PSC soma. This has two main implications for the decoding of the two inputs. First, the different size of the Ca2+ transients does not carry the same information, possibly by activating different Ca2+-dependent mechanisms with different affinity for Ca2+. Second, because of the lack of evidence of morphological segregated distribution of receptors, we propose that the segregated functional distribution of receptors is complemented by the segregation of downstream intracellular machinery. Mechanisms, such as differential cellular machinery distribution or different calcium sources targeted to each nerve terminal, could be present. Such important intrinsic characteristics of PSCs properties will need to be further explored.
Finally, the differential coverage of competing terminals by PSCs could have been another mechanism explaining their differential activation. However, our data are not consistent with this observation. Indeed, according to this scenario at dually innervated NMJs where two PSCs are present, one could predict that each PSC would cover preferentially a synaptic territory associated with a given nerve terminal whereas the other one would preferentially interact with the other. Hence, if the differential coverage dictates the sensitivity of PSCs, a given PSC would systematically respond with a large Ca2+ response from the activity of a given terminal and smaller ones by the activity of the other. This situation would be reversed for the other PSC. However, as shown in Figure 3F, we never observed such a phenomenon, suggesting that the level of PSC coverage is not a determinant parameter and that Ca2+ responses of both PSCs reflected the state of synaptic competition. This is also in accordance with recent evidence showing that PSCs highly intermingle and overlap during early postdevelopmental stages while they occupy segregated, well-delineated territories in adulthood (Brill et al., 2011).
Impact of PSCs decoding in synaptic competition and elimination
The possible involvement of PSCs in the regulation of synaptic competition has been questioned in previous works where it was proposed that they served more a role of support for axon retraction (Hirata et al., 1997). However, their ability to dynamically decode synaptic strength using their Ca2+-dependent excitability provides strong evidence that PSCs are poised to play a critical role in influencing synaptic competition.
The PSC decoding ability could have different consequences for the regulation of synaptic competition and elimination. First, because of their ability to decipher between strong and weak inputs, as indicated by the different Ca2+ responses, it is possible that, in turn, PSCs differentially modulate synaptic efficacy of the competing terminals. For instance, consistent with their ability to decipher levels of synaptic activity at mature NMJs (Rousse et al., 2010; Todd et al., 2010), PSCs could further potentiate synaptic activity of the strong input, at the expense of the weakest one. Such modulation would bias the competition toward the strong input and, ultimately, the outcome of synaptic competition and elimination.
A second consequence could be related to the elimination of the redundant inputs. PSCs are known to actively clear cellular debris at developing NMJs, a critical feature of the developing nervous system (Song et al., 2008). Perhaps their ability to sort out the weak from the strong input would allow them to selectively target this metabolism to the weak terminal, thus participating actively in the shedding of axon terminals (Chung and Barres, 2009). This could be a central feature of synapse elimination because the mechanism of selecting the branches destined for elimination remains unknown (Song et al., 2008).
Glial cells on synaptic elimination in the CNS
The involvement of glial cells in the refinement of synaptic connectivity has also been addressed in the CNS. For instance, immature astrocytes participate in the axon pruning of redundant inputs by initiating the activation of the complement cascade (Cullheim and Thams, 2007; Stevens et al., 2007; Alexander et al., 2008). Also, genetic manipulation of Ca2+-permeable channels in Bergmann glia caused the retraction of glial processes ensheathing synapses, increased multiple innervations of Purkinje cells by climbing fibers and delayed synapse elimination (Iino et al., 2001). Hence, it is appealing to propose that astrocytes pruning of synapses could be related to their ability to interact with competing inputs and decoding their activity similarly to PSCs at the NMJ.
In conclusion, we report that PSCs decode ongoing synaptic competition and the state of competency and strength of each competing inputs. Because of their ability to modulate and control synaptic activity, their ability to decipher the state of synaptic competition would endow PSCs with a powerful mechanism to alter the outcome of synaptic competition, hence, the quality and reliability of synaptic wiring.
Footnotes
This work was supported by the Canadian Institutes for Health Research Operating Grant MOP-14137 to R.R., the Canadian Foundation of Innovation (equipment grant) and Fonds Recherches Quebec-Santé (FRQ-S, infrastructure grant) to the Groupe de recherche sur le Système Nerveux Central. R.R. was a Chercheur-National of FRQ-S. H.D. held an FRQ-S studentship. D.A. held a studentship from the National Science Engineering Research Council of Canada. We thank Dr Aude Panatier for reading the manuscript and for generous and insightful discussion over the course of this work, Dr Jaideep Bains and Dr Keith Murai for reading the manuscript, and Dr Arlette Kolta for the use of her confocal system.
The authors declare no competing financial interests.
References
- Alexander JJ, Anderson AJ, Barnum SR, Stevens B, Tenner AJ. The complement cascade: Yin-Yang in neuroinflammation–neuro-protection and -degeneration. J Neurochem. 2008;107:1169–1187. doi: 10.1111/j.1471-4159.2008.05668.x. [DOI] [PMC free article] [PubMed] [Google Scholar]
- Auld DS, Robitaille R. Glial cells and neurotransmission: an inclusive view of synaptic function. Neuron. 2003;40:389–400. doi: 10.1016/s0896-6273(03)00607-x. [DOI] [PubMed] [Google Scholar]
- Balice-Gordon RJ, Lichtman JW. Long-term synapse loss induced by focal blockade of postsynaptic receptors. Nature. 1994;372:519–524. doi: 10.1038/372519a0. [DOI] [PubMed] [Google Scholar]
- Bishop DL, Misgeld T, Walsh MK, Gan WB, Lichtman JW. Axon branch removal at developing synapses by axosome shedding. Neuron. 2004;44:651–661. doi: 10.1016/j.neuron.2004.10.026. [DOI] [PubMed] [Google Scholar]
- Brill MS, Lichtman JW, Thompson W, Zuo Y, Misgeld T. Spatial constraints dictate glial territories at murine neuromuscular junctions. J Cell Biol. 2011;195:293–305. doi: 10.1083/jcb.201108005. [DOI] [PMC free article] [PubMed] [Google Scholar]
- Buffelli M, Busetto G, Cangiano L, Cangiano A. Perinatal switch from synchronous to asynchronous activity of motoneurons: link with synapse elimination. Proc Natl Acad Sci U S A. 2002;99:13200–13205. doi: 10.1073/pnas.202471199. [DOI] [PMC free article] [PubMed] [Google Scholar]
- Buffelli M, Burgess RW, Feng G, Lobe CG, Lichtman JW, Sanes JR. Genetic evidence that relative synaptic efficacy biases the outcome of synaptic competition. Nature. 2003;424:430–434. doi: 10.1038/nature01844. [DOI] [PubMed] [Google Scholar]
- Busetto G, Buffelli M, Tognana E, Bellico F, Cangiano A. Hebbian mechanisms revealed by electrical stimulation at developing rat neuromuscular junctions. J Neurosci. 2000;20:685–695. doi: 10.1523/JNEUROSCI.20-02-00685.2000. [DOI] [PMC free article] [PubMed] [Google Scholar]
- Chen C, Regehr WG. Developmental remodeling of the retinogeniculate synapse. Neuron. 2000;28:955–966. doi: 10.1016/s0896-6273(00)00166-5. [DOI] [PubMed] [Google Scholar]
- Christopherson KS, Ullian EM, Stokes CC, Mullowney CE, Hell JW, Agah A, Lawler J, Mosher DF, Bornstein P, Barres BA. Thrombospondins are astrocyte-secreted proteins that promote CNS synaptogenesis. Cell. 2005;120:421–433. doi: 10.1016/j.cell.2004.12.020. [DOI] [PubMed] [Google Scholar]
- Chung WS, Barres BA. Selective remodeling: refining neural connectivity at the neuromuscular junction. PLoS Biol. 2009;7:e1000185. doi: 10.1371/journal.pbio.1000185. [DOI] [PMC free article] [PubMed] [Google Scholar]
- Claes P, Van Kolen K, Roymans D, Blero D, Vissenberg K, Erneux C, Verbelen JP, Esmans EL, Slegers H. Reactive blue 2 inhibition of cyclic AMP-dependent differentiation of rat C6 glioma cells by purinergic receptor-independent inactivation of phosphatidylinositol 3-kinase. Biochem Pharmacol. 2004;67:1489–1498. doi: 10.1016/j.bcp.2003.12.017. [DOI] [PubMed] [Google Scholar]
- Colman H, Nabekura J, Lichtman JW. Alterations in synaptic strength preceding axon withdrawal. Science. 1997;275:356–361. doi: 10.1126/science.275.5298.356. [DOI] [PubMed] [Google Scholar]
- Cullheim S, Thams S. The microglial networks of the brain and their role in neuronal network plasticity after lesion. Brain Res Rev. 2007;55:89–96. doi: 10.1016/j.brainresrev.2007.03.012. [DOI] [PubMed] [Google Scholar]
- Del Castillo J, Katz B. Quantal components of the end-plate potential. J Physiol. 1954;124:560–573. doi: 10.1113/jphysiol.1954.sp005129. [DOI] [PMC free article] [PubMed] [Google Scholar]
- De Lorenzo S, Veggetti M, Muchnik S, Losavio A. Presynaptic inhibition of spontaneous acetylcholine release mediated by P2Y receptors at the mouse neuromuscular junction. Neuroscience. 2006;142:71–85. doi: 10.1016/j.neuroscience.2006.05.062. [DOI] [PubMed] [Google Scholar]
- Eken T, Elder GC, Lømo T. Development of tonic firing behavior in rat soleus muscle. J Neurophysiol. 2008;99:1899–1905. doi: 10.1152/jn.00834.2007. [DOI] [PubMed] [Google Scholar]
- Eroglu C, Barres BA. Regulation of synaptic connectivity by glia. Nature. 2010;468:223–231. doi: 10.1038/nature09612. [DOI] [PMC free article] [PubMed] [Google Scholar]
- Fellin T, Pascual O, Gobbo S, Pozzan T, Haydon PG, Carmignoto G. Neuronal synchrony mediated by astrocytic glutamate through activation of extrasynaptic NMDA receptors. Neuron. 2004;43:729–743. doi: 10.1016/j.neuron.2004.08.011. [DOI] [PubMed] [Google Scholar]
- Gan WB, Lichtman JW. Synaptic segregation at the developing neuromuscular junction. Science. 1998;282:1508–1511. doi: 10.1126/science.282.5393.1508. [DOI] [PubMed] [Google Scholar]
- Garcia N, Santafé MM, Salon I, Lanuza MA, Tomàs J. Expression of muscarinic acetylcholine receptors (M1-, M2-, M3- and M4-type) in the neuromuscular junction of the newborn and adult rat. Histol Histopathol. 2005;20:733–743. doi: 10.14670/HH-20.733. [DOI] [PubMed] [Google Scholar]
- Georgiou J, Robitaille R, Charlton MP. Muscarinic control of cytoskeleton in perisynaptic glia. J Neurosci. 1999;19:3836–3846. doi: 10.1523/JNEUROSCI.19-10-03836.1999. [DOI] [PMC free article] [PubMed] [Google Scholar]
- Gorassini M, Eken T, Bennett DJ, Kiehn O, Hultborn H. Activity of hindlimb motor units during locomotion in the conscious rat. J Neurophysiol. 2000;83:2002–2011. doi: 10.1152/jn.2000.83.4.2002. [DOI] [PubMed] [Google Scholar]
- Henneberger C, Papouin T, Oliet SH, Rusakov DA. Long-term potentiation depends on release of D-serine from astrocytes. Nature. 2010;463:232–236. doi: 10.1038/nature08673. [DOI] [PMC free article] [PubMed] [Google Scholar]
- Hirata K, Zhou C, Nakamura K, Kawabuchi M. Postnatal development of Schwann cells at neuromuscular junctions, with special reference to synapse elimination. J Neurocytol. 1997;26:799–809. doi: 10.1023/a:1018570500052. [DOI] [PubMed] [Google Scholar]
- Iino M, Goto K, Kakegawa W, Okado H, Sudo M, Ishiuchi S, Miwa A, Takayasu Y, Saito I, Tsuzuki K, Ozawa S. Glia-synapse interaction through Ca2+-permeable AMPA receptors in Bergmann glia. Science. 2001;292:926–929. doi: 10.1126/science.1058827. [DOI] [PubMed] [Google Scholar]
- Jahromi BS, Robitaille R, Charlton MP. Transmitter release increases intracellular calcium in perisynaptic Schwann cells in situ. Neuron. 1992;8:1069–1077. doi: 10.1016/0896-6273(92)90128-z. [DOI] [PubMed] [Google Scholar]
- Keller-Peck CR, Walsh MK, Gan WB, Feng G, Sanes JR, Lichtman JW. Asynchronous synapse elimination in neonatal motor units: studies using GFP transgenic mice. Neuron. 2001;31:381–394. doi: 10.1016/s0896-6273(01)00383-x. [DOI] [PubMed] [Google Scholar]
- Kopp DM, Perkel DJ, Balice-Gordon RJ. Disparity in neurotransmitter release probability among competing inputs during neuromuscular synapse elimination. J Neurosci. 2000;20:8771–8779. doi: 10.1523/JNEUROSCI.20-23-08771.2000. [DOI] [PMC free article] [PubMed] [Google Scholar]
- Lohof AM, Delhaye-Bouchaud N, Mariani J. Synapse elimination in the central nervous system: functional significance and cellular mechanisms. Rev Neurosci. 1996;7:85–101. doi: 10.1515/revneuro.1996.7.2.85. [DOI] [PubMed] [Google Scholar]
- Nevian T, Helmchen F. Calcium indicator loading of neurons using single-cell electroporation. Pflugers Arch. 2007;454:675–688. doi: 10.1007/s00424-007-0234-2. [DOI] [PubMed] [Google Scholar]
- Panatier A, Theodosis DT, Mothet JP, Touquet B, Pollegioni L, Poulain DA, Oliet SH. Glia-derived D-serine controls NMDA receptor activity and synaptic memory. Cell. 2006;125:775–784. doi: 10.1016/j.cell.2006.02.051. [DOI] [PubMed] [Google Scholar]
- Panatier A, Vallée J, Haber M, Murai KK, Lacaille JC, Robitaille R. Astrocytes are endogenous regulators of basal transmission at central synapses. Cell. 2011;146:785–798. doi: 10.1016/j.cell.2011.07.022. [DOI] [PubMed] [Google Scholar]
- Redfern P, Thesleff S. Action potential generation in denervated rat skeletal muscle. I. Quantitative aspects. Acta Physiol Scand. 1971;81:557–564. doi: 10.1111/j.1748-1716.1971.tb04932.x. [DOI] [PubMed] [Google Scholar]
- Robitaille R. Purinergic receptors and their activation by endogenous purines at perisynaptic glial cells of the frog neuromuscular junction. J Neurosci. 1995;15:7121–7131. doi: 10.1523/JNEUROSCI.15-11-07121.1995. [DOI] [PMC free article] [PubMed] [Google Scholar]
- Robitaille R. Modulation of synaptic efficacy and synaptic depression by glial cells at the frog neuromuscular junction. Neuron. 1998;21:847–855. doi: 10.1016/s0896-6273(00)80600-5. [DOI] [PubMed] [Google Scholar]
- Rochon D, Rousse I, Robitaille R. Synapse-glia interactions at the mammalian neuromuscular junction. J Neurosci. 2001;21:3819–3829. doi: 10.1523/JNEUROSCI.21-11-03819.2001. [DOI] [PMC free article] [PubMed] [Google Scholar]
- Rousse I, St-Amour A, Darabid H, Robitaille R. Synapse-glia interactions are governed by synaptic and intrinsic glial properties. Neuroscience. 2010;167:621–632. doi: 10.1016/j.neuroscience.2010.02.036. [DOI] [PubMed] [Google Scholar]
- Song JW, Misgeld T, Kang H, Knecht S, Lu J, Cao Y, Cotman SL, Bishop DL, Lichtman JW. Lysosomal activity associated with developmental axon pruning. J Neurosci. 2008;28:8993–9001. doi: 10.1523/JNEUROSCI.0720-08.2008. [DOI] [PMC free article] [PubMed] [Google Scholar]
- Stellwagen D, Shatz CJ. An instructive role for retinal waves in the development of retinogeniculate connectivity. Neuron. 2002;33:357–367. doi: 10.1016/s0896-6273(02)00577-9. [DOI] [PubMed] [Google Scholar]
- Stevens B, Allen NJ, Vazquez LE, Howell GR, Christopherson KS, Nouri N, Micheva KD, Mehalow AK, Huberman AD, Stafford B, Sher A, Litke AM, Lambris JD, Smith SJ, John SW, Barres BA. The classical complement cascade mediates CNS synapse elimination. Cell. 2007;131:1164–1178. doi: 10.1016/j.cell.2007.10.036. [DOI] [PubMed] [Google Scholar]
- Todd KJ, Darabid H, Robitaille R. Perisynaptic glia discriminate patterns of motor nerve activity and influence plasticity at the neuromuscular junction. J Neurosci. 2010;30:11870–11882. doi: 10.1523/JNEUROSCI.3165-10.2010. [DOI] [PMC free article] [PubMed] [Google Scholar]
- Todd KJ, Robitaille R. Purinergic modulation of synaptic signalling at the neuromuscular junction. Pflugers Arch. 2006;452:608–614. doi: 10.1007/s00424-006-0068-3. [DOI] [PubMed] [Google Scholar]
- Turney SG, Lichtman JW. Reversing the outcome of synapse elimination at developing neuromuscular junctions in vivo: evidence for synaptic competition and its mechanism. PLoS Biol. 2012;10:e1001352. doi: 10.1371/journal.pbio.1001352. [DOI] [PMC free article] [PubMed] [Google Scholar]
- Ullian EM, Christopherson KS, Barres BA. Role for glia in synaptogenesis. Glia. 2004;47:209–216. doi: 10.1002/glia.20082. [DOI] [PubMed] [Google Scholar]
- Walsh MK, Lichtman JW. In vivo time-lapse imaging of synaptic takeover associated with naturally occurring synapse elimination. Neuron. 2003;37:67–73. doi: 10.1016/s0896-6273(02)01142-x. [DOI] [PubMed] [Google Scholar]
- Wang X, Lou N, Xu Q, Tian GF, Peng WG, Han X, Kang J, Takano T, Nedergaard M. Astrocytic Ca2+ signaling evoked by sensory stimulation in vivo. Nat Neurosci. 2006;9:816–823. doi: 10.1038/nn1703. [DOI] [PubMed] [Google Scholar]
- Wyatt RM, Balice-Gordon RJ. Activity-dependent elimination of neuromuscular synapses. J Neurocytol. 2003;32:777–794. doi: 10.1023/B:NEUR.0000020623.62043.33. [DOI] [PubMed] [Google Scholar]