

Abstract
Stroke usually affects people with underlying medical conditions. In particular, diabetics are significantly more likely to have a stroke and the prognosis for recovery is poor. Because diabetes is associated with degenerative changes in the vasculature of many organs, we sought to determine how hyperglycemia affects blood flow dynamics after an ischemic stroke. Longitudinal in vivo two-photon imaging was used to track microvessels before and after photothrombotic stroke in a diabetic mouse model. Chronic hyperglycemia exacerbated acute (3–7 d) ischemia-induced increases in blood flow velocity, vessel lumen diameter, and red blood cell flux in peri-infarct regions. These changes in blood flow dynamics were most evident in superficial blood vessels within 500 μm from the infarct, rather than deeper or more distant cortical regions. Long-term imaging of diabetic mice not subjected to stroke indicated that these acute stroke-related changes in vascular function could not be attributed to complications from hyperglycemia alone. Treating diabetic mice with insulin immediately after stroke resulted in less severe alterations in blood flow within the first 7 d of recovery, but had more variable results at later time points. Analysis of microvessel branching patterns revealed that stroke led to a pruning of microvessels in peri-infarct cortex, with very few instances of sprouting. These results indicate that chronic hyperglycemia significantly affects the vascular response to ischemic stroke and that insulin only partially mitigates these changes. The combination of these acute and chronic alterations in blood flow dynamics could underlie diabetes-related deficits in cortical plasticity and stroke recovery.
Keywords: two photon imaging, microvessel, ischemia, stroke recovery, diabetes, blood flow
Introduction
Blood flow dynamics in response to stroke have been well characterized, particularly in the very early stages of ischemia (minutes to hours after occlusion), using in vivo confocal or two-photon microscopy of fluorescently labeled blood plasma (Tomita et al., 2005; Nishimura et al., 2006, 2007, 2010; Schaffer et al., 2006; Shih et al., 2009; Blinder et al., 2010). During a stroke, blood flow drops in microvessels up to 350 μm from an occluded arteriole (Tomita et al., 2005; Nishimura et al., 2007). In response, blood flow direction rapidly reverses in downstream blood vessels (Schaffer et al., 2006) and nearby arterioles dilate (Pinard et al., 2000; Shih et al., 2009) to direct blood toward the occluded vessel and reinstate perfusion. Following the initial drop in peri-infarct blood flow, studies have reported either a persistent decrease (Mies et al., 1983; Mostany et al., 2010) or increase (Lin et al., 2002; Tomita et al., 2005; Martín et al., 2012) in blood flow lasting for several days to weeks (Kazmi et al., 2013). Concomitantly, peri-infarct vessels undergo long-term changes in lumen diameter (Wei et al., 2001; Guo et al., 2011) and density (Brown et al., 2007).
Despite this previous research, it remains largely unknown what demands a pre-existing vascular condition, such as diabetes, places on microvascular structure and function during recovery from stroke (Biessels et al., 2002; Moskowitz et al., 2010). A significant proportion of North Americans (∼8%) are currently living with diabetes, which is known to have deleterious effects on the body's vascular system (Centers for Disease Control and Prevention, 2011). In the brain, diabetes progressively compromises the vascular endothelium, making vessel walls thicker, more permeable and less responsive to endogenous modulators of vascular tone (Vinik and Flemmer, 2002; Li et al., 2010b; Prakash et al., 2012). Thus, it is not surprising that diabetes is linked to a 2- to 6-fold increase in the risk of ischemic stroke and a poor prognosis for recovery (Toni et al., 1992; Iemolo et al., 2002; Vinik and Flemmer, 2002; Wei et al., 2010; Ergul et al., 2012). We recently showed that poor recovery after ischemic cortical stroke in a diabetic mouse model was associated with deficits in functional rewiring of circuits in surviving peri-infarct cortex (Sweetnam et al., 2012). Because the restoration of cortical function after stroke is intricately linked to blood flow changes, particularly at the microvessel level (Brown et al., 2007; Zhang and Murphy, 2007; Li and Murphy, 2008; Masamoto et al., 2012), we hypothesized that poor behavioral recovery and limited cortical rewiring in stroke-affected diabetic mice may be due to acute and/or chronic dysfunction of the brain's normal microvascular response to ischemia.
We used in vivo two-photon imaging to track microvessels before and after stroke to address the following questions. What is the impact of chronic hyperglycemia on vascular dynamics when challenged by stroke? Are these changes widespread or spatially restricted? Finally, can treatment of hyperglycemia mitigate abnormal vascular responses to stroke?
Materials and Methods
Subjects.
Two- to 4-month-old male GFP-M line mice on a C57BL/6 background were used in the present study. Mice were singly housed under a 12 h light/dark cycle and given ad libitum access to water and standard laboratory diet. All experiments were conducted according to the guidelines laid out by the Canadian Council of Animal Care and approved by the University of Victoria Animal Care Committee.
Cranial window surgeries.
Chronically implanted cranial window surgeries were conducted as previously described (Trachtenberg et al., 2002; Mostany and Portera-Cailliau, 2008; Brown et al., 2010; Shih et al., 2012). Two-month-old mice were anesthetized with isoflurane in oxygen (2% induction, 1.5% maintenance) and fitted into a custom-made stereotax. Body temperature was maintained at 37°C using a rectal thermoprobe and a temperature feedback regulator. The fur on the scalp was trimmed and a 0.05 ml bolus of lidocaine was injected subcutaneously to induce local analgesia. A midline incision was made and the scalp was retracted to expose the skull overlying the right somatosensory cortex. A thin layer of cyanoacrylate glue was applied to the exposed and dried skull. A 0.03 ml bolus of 2% dexamethasone was given intramuscularly to reduce inflammation during and after the procedure. Using a high-speed dental drill, a 4 mm diameter circular craniotomy was made from ∼0–4 mm lateral to bregma and 0–4 mm posterior to the coronal suture line, overlying the forelimb and hindlimb areas of the somatosensory cortex. Cold HEPES-buffered artificial CSF (ACSF) was applied to the skull intermittently during the drilling procedure to keep the brain cool and reduce inflammation. Dura was left intact and the brain surface was kept moist with cold ACSF. A 5 mm coverslip (no. 1 thickness) was placed over the brain and secured to the surrounding skull with cyanoacrylate glue and dental cement. The surrounding skin was then secured to the edges of the cranial window with cyanoacrylate glue. Mice were allowed to recover under a heat lamp before being returned to their home cage. Mice that showed any loss of clarity to the imaging window before stroke were excluded from the study. Mice were separated into five experimental groups: nondiabetic stroke (n = 7), diabetic stroke (n = 11), diabetic stroke + insulin (n = 5), nondiabetic sham (n = 7), and diabetic sham (n = 7). An a priori power analysis based on a previous study (Clarkson et al., 2011) indicated that a sample size of five mice per group was necessary to detect significant differences in infarct size at 80% power with an α level of 0.05.
Induction of diabetes and blood glucose monitoring.
Diabetes was induced 2 weeks following cranial window implantation. A 2 d induction protocol was followed over consecutive days. On each day, mice were deprived of food for 4 h, and then given an intraperitoneal injection of streptozotocin (STZ; 75 mg/kg) dissolved in 50 mm (pH 4.5) sodium citrate buffer. Nondiabetic controls were administered buffer alone. Mice were given 5% sucrose water for 24 h after each day's injection to prevent sudden hypoglycemia. Blood glucose levels were measured (Accu-Chek, Aviva, Roche) every 1–2 weeks by fasting mice for 2–3 h and then withdrawing a drop of blood from the tail vein. Body weights were measured concurrently. To help lower blood sugar levels in a subset of diabetic mice, one slow-release insulin pellet (0.1 U/24 h/implant, LinBit) was implanted subcutaneously between the scapulae immediately following stroke. Blood glucose was tested once weekly and additional insulin pellets were implanted if levels exceeded 15 mmol/L. It should be noted that this model presents with a greater level of chronic hyperglycemia than is typically seen in the majority of human diabetics. This may be due to the higher metabolism of the mouse or to differences between the animal model and the human condition. For simplicity, mice that exhibit STZ-induced hyperglycemia will be referred to as “diabetic” in the remainder of the paper.
Photothrombotic stroke.
A targeted photothrombotic stroke (Watson et al., 1985) was induced through the chronically implanted cranial window 1–3 d after the second baseline imaging session (Fig. 1A). Mice were anesthetized with isoflurane in medical air (2% induction, 1.5% maintenance) and placed in a custom-made stereotaxic stage under an Olympus BX61WI microscope. A green light-emitting diode (LED; 532 nm, 25.8 mW at the back aperture) was focused onto the cortical surface through a 10× objective. LED illumination was targeted to a ∼1 mm diameter area of the forelimb somatosensory cortex, located in the anterior-most portion of the window. The clear delineation between intact and infarcted tissue and the absence of a large penumbra in the photothrombotic stroke model allowed us to position the infarct such that the border was adjacent to “peri-infarct” areas imaged before stroke without severely damaging the imaging areas. Mice received a single injection of 1% rose bengal solution (100 mg/kg in HEPES-buffered ACSF, i.p.) and the targeted stroke area was illuminated for ∼20 min. Evidence of occlusion was visually confirmed by the presence of small clots and halted blood flow in the illuminated region of cortex. Animals that showed no evidence of stroke (lost surface vasculature, white appearance of cortical tissue in infarct area) at the first poststroke imaging time point were excluded from the study. Sham animals received either LED illumination or rose bengal injection, but not both, and showed no evidence of damage to cortical tissue or surface vasculature. Following stroke or sham procedures, mice were allowed to recover under a heat lamp and returned to their home cage.
Figure 1.

Longitudinal in vivo imaging of fluorescently labeled blood vessels was conducted through chronically implanted cranial windows. A, Timeline of longitudinal imaging experiments. Dark gray arrows indicate two-photon imaging sessions. B, A representative brightfield image of a cranial window at 3 d poststroke in a nondiabetic mouse. The infarct border is indicated by a white dotted line. Peri-infarct (∼25–500 μm from infarct border) and distant (∼500–1500 μm from infarct border) imaging areas are indicated as black squares. C, A maximum intensity z-projection of 150 planar two-photon images (2 μm apart) of fluorescently labeled vasculature in the peri-infarct cortex. D, A side x-z-projection of the same images showing the view through the depth of the 300 μm stack. The distinction between superficial and deep microvessels is indicated by the white dotted line 150 μm below the pial surface. E, Brightfield (left) and epi-fluorescent images of rhodamine dextran labeled vessels (right) in a cranial window taken 3 d after stroke. The infarct border is clearly delineated in the epi-fluorescent images by the absence of small surface vessels.
Longitudinal two-photon imaging.
Baseline imaging sessions began 4–5 weeks after cranial window surgeries and 2–3 weeks after diabetes induction (Fig. 1A). Previous studies have shown that any surgery induced inflammation and gliosis has subsided by 3–4 weeks postcranial window implantation (Holtmaat et al., 2009; Brown et al., 2010). Mice were anesthetized for ∼90 min per imaging session with isoflurane mixed in medical air (2% induction, 1.5% maintenance). A 2.5 cm stabilization bar (1 mm thickness) was affixed to the medial side of the cranial window with cyanoacrylate glue and the mouse was fitted into a custom-made frame. Rhodamine dextran (0.1 ml, 5% solution in 0.9% saline; Sigma-Aldrich) was injected into the tail vein immediately before the start of imaging.
High-resolution in vivo two-photon images were generated using an Olympus FV1000MPE multiphoton laser scanning microscope (Olympus) equipped with a mode-locked Ti:sapphire laser tuned to 850 nm for rhodamine dextran excitation. Excitation power measured at the back aperture of the objective was typically between 17 and 48 mW, and was adjusted to achieve near identical levels of fluorescence within each imaging session. Images were acquired with a 40× Olympus IR-LUMPlanFl water-immersion objective (NA = 0.8), using Olympus Fluoview FV10-ASW software.
Three imaging areas per mouse were chosen based on proximity to the forelimb area of the somatosensory cortex (the prospective infarct location), such that two areas would be located within 500 μm of the putative infarct border and one area would be located 750–1000 μm from the infarct border (Fig. 1B). Using low-resolution images of the surface vasculature and epifluorescence imaging, the same imaging areas were easily identified between sessions.
In each of the three imaging areas, blood vessels were imaged to a depth of 300 μm below the pial surface (Fig. 1C,D). During each imaging session, image stacks were collected at 2 μm steps covering an area of 287 × 287 μm (1024 × 1024 pixels, 0.28 μm per pixel), averaging two images per section. Image stacks were saved as multitiff files for later image processing and analysis with ImageJ software. For analysis of blood flow velocity, line scans were conducted on six easily identifiable microvessels (<10 μm diameter) in each of the three imaging areas. Each selected vessel was subject to a series of three line scans, with a 10–20 s waiting period between each scan. Animals were imaged twice before stroke and on days 3, 7, 14, and 28 after the stroke (Fig. 1A).
Analysis of vascular dynamics.
Two-photon images were analyzed for blood flow velocity, vessel lumen diameter, and red blood cell (RBC) flux. All analysis was conducted by an experimenter blinded to experimental condition and imaging time point. Blood flow velocity measurements were taken from line scan images by determining the inverse slope (Δ time/Δ distance) of the linear paths of RBCs (Shih et al., 2012). Only vessels that had linear slopes were analyzed, and those with curvilinear slopes were excluded (Chhatbar and Kara, 2013). Vessel lumen diameters were measured from multitiff image stacks using ImageJ software. A 20 pixel line approximately three times the diameter of the vessel was overlaid perpendicularly across the vessel and a fluorescence intensity profile was generated. The vessel diameter was calculated as the width of the intensity value distributions at half-maximal intensity (Shih et al., 2012). RBC flux was calculated from measurements of blood flow velocity and vessel lumen diameter based on previous work by Kleinfeld's group (Shih et al., 2009, 2012), using the following equation: Flux=π/8 × velocity × diameter2. Microvessels were separated into “superficial” and “deep” vessels based on the distance from the pial surface on the z-axis (Fig. 1D). Superficial vessels <150 μm from the pial surface were binned together, whereas vessels located 150–300 μm from the surface were considered to be deep vessels. Every effort was made to analyze the same microvessels in each animal throughout the entire study. In cases in which a microvessel segment was lost or obscured (such as by a dilated surface arteriole), measurements were collected from a nearby connected microvessel.
To determine whether any changes in vascular dynamics were associated with the formation or elimination of blood vessels after stroke, we measured the density and branching patterns of cortical microvessels in peri-infarct areas across imaging sessions. To measure the density of blood vessels, we z-projected 70 optical sections (2 μm apart; bins of 10 images each) located in superficial cortical areas (<150 μm under the pial surface). A median filter (radius = 1) was applied to each image to reduce noise and images were thresholded. ImageJ software was then used to calculate the percentage of surface area occupied by blood vessels. We further used ImageJ software to manually trace penetrating microvessels, counting the number of branch points made as the vessel dove through the 300 μm multitiff stack (Harb et al., 2013). Two microvessels per peri-infarct imaging area were chosen for analysis. We typically chose vessels that dove through the center of the image stack to ensure that the same vessels could be traced throughout all imaging time points.
Systemic measurements of physiological parameters.
Physiological parameters were measured twice before stroke and on days 3, 7, 14, and 28 after the stroke in diabetic (n = 3) and nondiabetic (n = 4) mice. These mice were not included in the imaging portion of the study, but were matched for age, sex, and length of time since diabetes induction. Animals were anesthetized with isofluorane in medical air (2% induction, 1.5% maintenance) and the fur on the right hindlimb was removed using depilatory cream. A thigh cuff was placed onto the mouse and physiological parameters were measured using the MouseOx small animal vital signs monitor (Starr Life Sciences) for a total of 20 min at each time point. The mean heart and breath rates were determined by averaging across the 20 min session.
Histology and measurement of infarct volume.
Mice were killed 6 weeks after stroke with an overdose of sodium pentobarbital (175 mg/kg, i.p.) and perfused intracardially with 0.1 m phosphate buffer and 4% paraformaldehyde. Brains were postfixed for 1 week in paraformaldehyde at 4°C and sliced into 50-μm-thick coronal sections using a Leica VT1000 vibratome (Leica Biosystems). Every third section was mounted onto charged slides and stained with cresyl violet. ImageJ software was used to measure the area of intact tissue in the hemispheres ipsilateral and contralateral to the infarct. Cavalieri's method was used to calculate the total remaining tissue volume as the product of summed section areas and distance between sections (Henery and Mayhew, 1989). Lesion volume was indirectly estimated as the difference between the volumes of the damaged and intact cortices (Tennant and Jones, 2009).
Statistics.
Blood flow velocity and lumen diameter data were analyzed for the presence of outliers using Grubbs' test (value >2.5 SDs from the mean; GraphPad software) before the calculation of RBC flux. All other statistical analyses were conducted using SPSS software. A one-way ANOVA was used to compare baseline measurements of vascular parameters across experimental groups. To analyze changes in vascular dynamics over time, mixed repeated-measures ANOVAs were conducted to determine main effects of imaging time point and experimental group, and interactions between time and group. Separate analyses were conducted for blood flow velocity, lumen diameter, RBC flux, vessel density, and microvascular branching. Sham and stroke groups were considered separately to individually evaluate the effect of hyperglycemia in the presence or absence of stroke. Post hoc Bonferroni-corrected two-way t tests were used to determine differences between groups at individual time points. In instances in which a significant effect of time was found, a univariate repeated-measures ANOVA was run for each individual group, with time as a within-subject variable, to determine how vascular measurements changed over time relative to baseline values. Bonferroni-corrected pairwise comparisons were conducted to determine differences between time points. A mixed repeated-measures ANOVA was conducted to determine group and time differences in physiological parameters, body weights, and blood glucose measurements. A one-way ANOVA was conducted to determine differences in infarct volume across groups. p < 0.05 was considered significant for all ANOVAs. Bonferroni-corrected tests were significant at the p ≤ 0.01 level. All data are means ± SEM.
Results
Systemic physiological parameters and infarct volume measurements
Blood glucose and body weight measurements of nondiabetic, uncontrolled diabetic, and insulin-treated diabetic mice at each time point are presented in Table 1. Nondiabetic mice were euglycemic (blood glucose levels <15 mmol/L) at all experimental time points. Diabetic mice had significantly elevated blood glucose levels (>20 mmol/L; t(32) = 6.69, p < 0.001), which were steadily maintained throughout the experiment. Diabetic mice that received insulin treatment immediately after stroke had significantly lower blood glucose compared with uncontrolled diabetics during the first week after stroke (p = 0.007–0.01). However, over the course of the study, blood glucose levels became more variable and trended back toward hyperglycemia despite continued and even increased doses of insulin.
Table 1.
Blood glucose and body weight measurements
| BL | PD3 | PW1 | PW2 | PW4 | |
|---|---|---|---|---|---|
| Blood glucose | |||||
| Nondiabetic | 11.9 ± 0.3 | 9.3 ± 0.8 | 11.9 ± 0.8 | 14.3 ± 0.4 | 11.6 ± 0.8 |
| Diabetic | 23.6 ± 1.5** | 25.2 ± 1.5** | 26.1 ± 1.4** | 25.4 ± 1.6** | 24.1 ± 1.4** |
| Diabetic + insulin | 24.8 ± 0.8** | 16.3 ± 2.5*† | 17.1 ± 2.1*† | 19.9 ± 3.4* | 25.4 ± 4.3* |
| Body weight | |||||
| Nondiabetic | 26.6 ± 0.6 | 26.5 ± 0.6 | 26.8 ± 0.6 | 26.8 ± 0.6 | 27.2 ± 0.6 |
| Diabetic | 25.1 ± 0.5 | 24.7 ± 0.5 | 24.8 ± 0.5 | 24.6 ± 0.7 | 24.5 ± 0.7* |
| Diabetic + insulin | 24.3 ± 0.7 | 23.6 ± 0.7 | 24.4 ± 0.5 | 24.8 ± 0.6 | 25.9 ± 0.7 |
Blood glucose was measured in mmol/L. Body weight was measured in grams. Data are mean ± SEM.
*p < 0.01,
**p < 0.001 versus nondiabetic mice,
†p < 0.01, insulin-treated versus uncontrolled diabetics. BL, Baseline; PD3, post-stroke day 3; PW1, post-stroke week 1; PW2, post-stroke week 2; PW4, post-stroke week 4.
For body weights, diabetic and nondiabetic mice had similar weights at baseline (t(32) = 2.06, p = 0.05). After 8 weeks of uncontrolled hyperglycemia, diabetic mice weighed significantly less than nondiabetic controls (t(32) = 2.75, p = 0.01). Insulin treatment helped mice maintain more typical body weights (p > 0.01 compared with nondiabetics at all poststroke time points).
We used the MouseOx pulse oximeter to determine whether diabetes or stroke produced any systemic changes in physiological parameters (heart and breath rate). Neither stroke nor diabetes were associated with significant changes in heart rate (F(4,20) = 2.17, p = 0.11) or breath rate (F(4,20) = 1.24, p = 0.33) at any experimental time point (Table 2).
Table 2.
Systemic physiological measurements
| BL | PD3 | PW1 | PW2 | PW4 | |
|---|---|---|---|---|---|
| Heart rate | |||||
| Nondiabetic | 466 ± 23 | 539 ± 16 | 539 ± 22 | 564 ± 32 | 547 ± 20 |
| Diabetic | 451 ± 9 | 503 ± 22 | 532 ± 32 | 491 ± 76 | 487 ± 11 |
| Breath rate | |||||
| Nondiabetic | 91 ± 2 | 82 ± 12 | 102 ± 14 | 78 ± 7 | 98 ± 7 |
| Diabetic | 89 ± 7 | 69 ± 6 | 85 ± 11 | 95 ± 19 | 87 ± 7 |
Heart and breath rates were measured in beats or breaths/min, respectively. BL, Baseline; PD3, post-stroke day 3; PW1, post-stroke week 1; PW2, post-stroke week 2; PW4, post-stroke week 4.
Analysis of cresyl violet stained brain sections indicated that ischemic stroke was localized to the forelimb somatosensory cortex (Fig. 2A). Similar to previously published data from our laboratory (Sweetnam et al., 2012), we found that diabetes did not significantly affect the size of the infarct 6 weeks after stroke (F(2,20) = 0.13, p = 0.88; Fig. 2B).
Figure 2.

Diabetes did not significantly alter the size of stroke damage. A, Representative series of cresyl violet stained coronal sections throughout the extent of the infarct in nondiabetic and diabetic mice at 6 weeks recovery from stroke. B, Infarct volumes did not differ significantly between experimental groups.
Blood flow velocity
Microvascular hemodynamics were monitored before and after stroke using high resolution in vivo two-photon microscopy (Fig. 1). Photothrombotic stroke was used because of the ease with which it can be induced noninvasively through the cranial window and the precision with which specific brain regions can be targeted. Precise control of stroke location was critical for repeated imaging of the same microvessels in cortical zones that were preassigned to be peri-infarct (Fig. 1B). Epi-fluorescent images of the cortical surface were used to define the exact border of the infarct (Fig. 1E) and measure the distance from the center of each imaging area to the infarct border. On average, peri-infarct areas were located 192 ± 15 μm from the border (ranging from 26 to 334 μm), whereas distant areas were 978 ± 48 μm from the border (ranging from 479 to 1419 μm). There was no significant difference in these measurements between any of the experimental groups (peri-infarct: F(2,45) = 2.53, p = 0.09; distant: F(2,22) = 2.37, p = 0.12). Within each imaging area, blood flow velocity measurements were taken from line scan images by determining the inverse slope (Δ time/Δ distance)−1 of the linear paths of RBCs (Fig. 3A,B).
Figure 3.
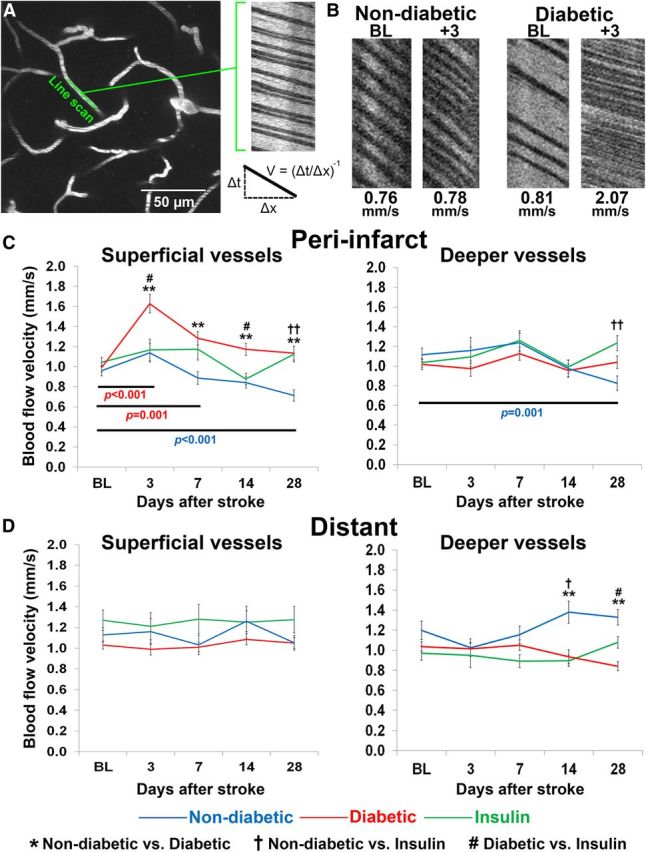
Diabetes exacerbates stroke-related changes in peri-infarct blood flow velocity. A, A maximum intensity z-projection of 30 planar images (2 μm apart) of fluorescently labeled vasculature. Line scans were run on linear segments of microvessels that were oriented parallel to the imaging plane. The result is a streaking pattern of diagonal lines with nonfluorescent red blood cells appearing dark and fluorescent plasma appearing white. Velocity is measured by calculating the slope of the RBC streaks. B, Representative line scans from baseline and poststroke time points in nondiabetic and diabetic mice. C, Peri-infarct blood flow velocity measurements across time in superficial (left) and deep (right) microvessels. D, Blood flow velocity measurements across time in superficial (left) and deep (right) microvessels located at distant sites from the infarct. **p < 0.001 nondiabetic versus diabetic; †p < 0.01, ††p < 0.001 nondiabetic versus insulin; #p < 0.01 diabetic versus insulin. Colored p values refer to within group differences between time points in nondiabetic (blue) and uncontrolled diabetic mice (red).
Before stroke, blood flow velocities in superficial microvessels were similar across the three experimental groups (F(2,429) = 0.54, p = 0.58). A mixed repeated-measures ANOVA revealed a significant main effect of stroke (F(4,1716) = 14.70, p < 0.001) and experimental group (F(2,429) = 14.17, p < 0.001) and a significant interaction between the two (F(8,1716) = 4.42, p < 0.001) on blood flow in superficial peri-infarct vessels. At 3 d after the stroke, only diabetic mice showed a significant increase in blood flow compared with baseline values (p < 0.001; Fig. 3C). Blood flow velocity in superficial vessels remained elevated in the diabetic peri-infarct region throughout the first week (p = 0.001) and returned to baseline levels by 2 weeks after the stroke (p = 0.18). By contrast, superficial peri-infarct blood flow velocities in nondiabetic mice did not increase after stroke (p = 0.59) and were significantly lower than diabetic mice at all subsequent imaging time points (p < 0.001; Fig. 3C). Blood flow measurements in diabetic mice treated with insulin after stroke were more variable across experimental time points and generally ranged in between those recorded for diabetic and nondiabetic mice (Fig. 3C). Similar to nondiabetic mice, blood flow in superficial vessels did not increase significantly three d after stroke relative to baseline measurements (p = 1.00). However, blood flow in the insulin-treated group did not progressively drop over the 4 week imaging period.
Blood flow in deeper microvessels of the peri-infarct cortex was relatively unaffected by stroke, at least in the first 2 weeks of recovery (p = 0.21–1.00, baseline vs poststroke days 3–14; Fig. 3C). Similar to observations in superficial microvessels, we saw a decline in peri-infarct blood flow velocity in deeper microvessels relative to baseline measurements in nondiabetic mice (F(4,552) = 4.65, p = 0.001; Fig. 3C). This progressive decrease was not seen in deeper vessels of uncontrolled or insulin-treated diabetic mice.
To assess the spatial extent of stroke related changes in blood flow (Brown et al., 2007, 2008; Mostany et al., 2010), we imaged cortical areas more distant from the infarct (∼1000 μm away from the infarct border). These distant regions also served as a control for any systemic or global changes in circulation that might have been associated with diabetes. Blood flow in superficial vessels in more distant cortical regions was not significantly affected by stroke (F(4,848) = 0.96, p = 0.43; Fig. 3D), or experimental group (F(2,212) = 2.77, p = 0.07). In deeper vessels, blood flow was not significantly affected in the acute poststroke phase (F(4,852) = 0.93, p = 0.45). However, over the 4 week stroke recovery period, there was a significant increase in blood flow that was only seen in nondiabetic mice (main effect of group: F(2,213) = 8.09, p < 0.001; interaction of time and group: F(8,852) = 4.23, p < 0.001; Figure 3D). To summarize, these results show that blood flow is primarily affected in superficial microvessels close to the stroke, and diabetes exacerbates stroke-related changes in blood flow.
Vessel lumen diameter
Blood flow velocity changes are often accompanied by changes in vessel diameter (Stefanovic et al., 2008; Shih et al., 2009, 2012). Here, we also observed a significant dilation of peri-infarct microvessels in response to stroke (Fig. 4A–C). A mixed repeated-measures ANOVA revealed that stroke led to a significant dilation of both superficial (F(4,564) = 32.12, p < 0.001) and deep (F(4,564) = 30.86, p < 0.001) microvessels in the peri-infarct cortex. As shown in Figure 4C, the dilation of peri-infarct microvessels was most pronounced 3 d after stroke and was evident in all three experimental groups. Interestingly, although diabetic mice showed marked vessel dilation in superficial vessels after stroke, there was a less robust response in deeper microvessels (p = 0.02) compared with the response of both nondiabetic and insulin-treated mice (p < 0.001). After 7 d of recovery, superficial and deep microvessel lumen diameters in both nondiabetic and insulin treated groups returned to baseline levels. In contrast, microvessel lumen diameters in diabetic mice took 14 d to recover to baseline levels.
Figure 4.
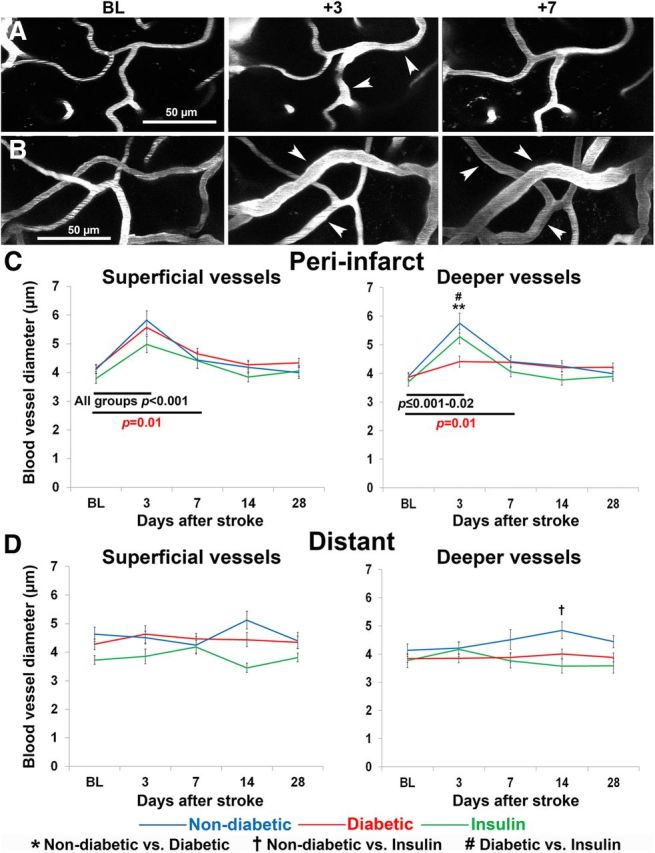
Stroke leads to a transient dilation of microvessels in peri-infarct cortex A, B, Representative images of dilated blood vessels from baseline and poststroke time points in (A) a nondiabetic mouse and (B) a diabetic mouse. Images are maximum intensity z-projections of 20–30 planar images (2 μm apart) of fluorescently labeled superficial vasculature. White arrowheads indicate dilated vessels. C, Peri-infarct vessel lumen diameter measurements across time in superficial (left) and deep (right) microvessels. D, Lumen diameter measurements across time in superficial (left) and deep (right) microvessels located at distant sites from the infarct. **p < 0.001 nondiabetic versus diabetic; †p < 0.01 nondiabetic versus insulin; #p < 0.01 diabetic versus insulin. Red p values refer to within group differences between time points in uncontrolled diabetic mice. Black p values refer to within group differences that were apparent in all three experimental groups.
Unlike peri-infarct regions, superficial microvessels in more distant cortical regions were not significantly dilated at any time point after stroke (F(1,69) = 0.10, p = 0.91; Fig. 4D). In deeper vessels, lumen diameter was not acutely affected by stroke (F(4,276) = 1.20, p = 0.31; Fig. 4D). However, there was a significant increase in lumen diameter after 14 d of recovery in nondiabetic mice (interaction of time and group: F(8,276) = 2.62, p = 0.01). In summary, these results show that vasodilation occurs in both deep and superficial microvessels close to the stroke, and vessels stay dilated for a longer period of time in the diabetic brain.
RBC flux
RBC flux provides an estimate of the total volume of fluid traveling through an area of blood vessel over time and is useful for determining how much blood is being delivered to a specific area after stroke. All experimental groups had similar baseline levels of RBC flux (F(2,141) = 0.08, p = 0.92). Three days after stroke, RBC flux increased significantly in superficial peri-infarct microvessels in all groups, particularly diabetic mice (F(4,564) = 8.25, p < 0.001; Fig. 5A). The initial increase in RBC flux in superficial vessels was followed by a return to baseline values by 7 d recovery. RBC flux in deeper microvessels of the peri-infarct cortex was not significantly affected by stroke (p = 0.10–1.00, baseline vs poststroke days 3–7). Of note, RBC flux in more distant cortical regions was not significantly affected by stroke or experimental group (p = 0.52–0.82; Fig. 5B). In summary, these results show that stroke leads to a transient increase in RBC flux primarily within superficial microvessels close to the stroke.
Figure 5.

Stroke induces a transient increase in RBC flux in the superficial vessels of peri-infarct cortex. A, Peri-infarct RBC flux measurements across time in superficial (left) and deep (right) microvessels. B, RBC flux measurements across time in superficial (left) and deep (right) microvessels located at distant sites from the infarct. Black p values refer to within group differences between time points that were apparent in all three experimental groups.
Microvascular remodeling
To determine whether stroke was associated with the formation or elimination of blood vessels, we first measured the density of blood vessels in peri-infarct cortex (Fig. 6A). Before stroke, there were no differences in vessel density between experimental groups (F(2,20) = 4.75, p = 0.89). Three days after stroke, the density of peri-infarct vessels increased significantly (F(4,80) = 24.33, p < 0.001), but was not affected by diabetes (F(1,20) = 0.20, p = 0.82). After 1 week of recovery, vascular density had returned to baseline in all experimental groups (p = 0.07–0.71).
Figure 6.

Stroke was associated with an increase in vascular density but a progressive loss of microvessel branch segments. A, Surface area occupied by blood vessels in peri-infarct cortex per experimental group before and after stroke. B, Representative time-lapse images of microvessel branches in a nondiabetic mouse. The yellow arrow points to a vessel branch that was permanently lost after stroke. The majority of vessel branches were stable. C, The percentage of microvessel branches remaining at each poststroke time point relative to baseline. Note the progressive loss of microvessels after stroke in each experimental group. Black p values refer to within group differences between time points that were apparent in all three experimental groups. BL, Baseline.
Next we analyzed the branching patterns of microvessels over time (Fig. 6B) to determine whether the stroke related increases in vessel density could be explained by microvessel sprouting. At baseline, the number of vessel branches analyzed did not differ between the three experimental groups (F(2,20) = 2.42, p = 0.12). After stroke (Fig. 6C), there was a small but significant decline in the number of vessel branches (F(4,80) = 9.50, p < 0.001) in all experimental groups (F(1,20) = 0.97, p = 0.40). It should be noted that putative new microvessel formation was observed, but on a very infrequent basis (<1% of counted branch points). In summary, these results show that stroke leads to a transient increase in vascular density, but not formation of new vessels, followed by a progressive elimination of existing microvessel branches in peri-infarct cortex.
Sham animals: effect of chronic hyperglycemia on vascular dynamics
To determine whether chronic uncontrolled hyperglycemia alone could alter vascular dynamics over time, we analyzed the effects of time and experimental group in diabetic and nondiabetic animals that underwent sham stroke surgeries (Fig. 7). Our analysis indicated that sham procedures had no effect on blood flow velocity (F(4,1000) = 1.65, p = 0.16), lumen diameter (F(4,328) = 2.23, p = 0.07), or RBC flux (F(4,328) = 0.71, p = 0.58; Fig. 7A–C). However, we did find that diabetes significantly altered blood flow dynamics 6–8 weeks into the experiment (2–4 weeks after sham procedures). Diabetic mice had significantly greater blood flow velocity in deep vessels 28 d after sham procedures (F(4,1000) = 6.68, p < 0.001; Fig. 7A). They also had larger blood vessel diameters (F(4,328) = 2.94, p = 0.02) and higher RBC flux (F(4,328) = 3.09, p = 0.02) compared with nondiabetics, but only at later experimental time points (Fig. 7B,C). In summary, these results show that diabetes begins to affect vascular dynamics only when hyperglycemia has been uncontrolled for at least 6–8 weeks.
Figure 7.
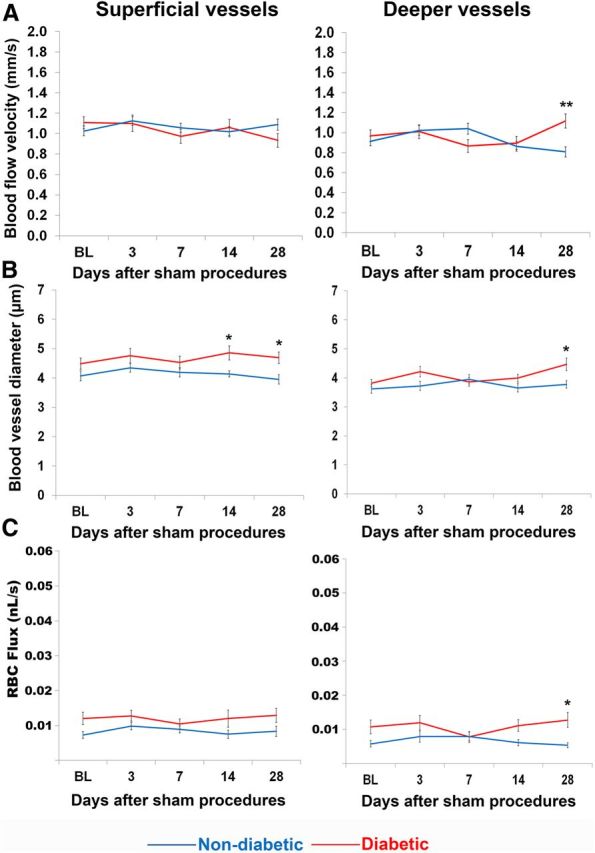
Chronic, uncontrolled hyperglycemia only had minor effects on blood flow parameters in the absence of stroke. A, Blood flow velocity, (B) vessel lumen diameter, and (C) RBC flux measurements across time in superficial (left) and deep (right) microvessels of sham operated mice. *p < 0.01, **p < 0.001 diabetic versus nondiabetic.
Discussion
We have previously shown that poor behavioral recovery of sensorimotor function after photothrombotic stroke in diabetic mice was not due to larger infarcts, but associated with deficits in cortical rewiring in peri-infarct areas (Sweetnam et al., 2012). Because recovery of cortical and paw function is dependent on blood flow to this tissue (Wei et al., 2001; Zhang and Murphy, 2007; Li and Murphy, 2008; Brown et al., 2009; Blinder et al., 2010; Mostany et al., 2010; Risher et al., 2010; Masamoto et al., 2012; Clarkson et al., 2013), we hypothesized that chronic hyperglycemia, as seen in diabetes alters microvascular hemodynamics in the acute and/or chronic periods of stroke recovery. Our data show that uncontrolled hyperglycemia exaggerated both the degree and duration of acute ischemia-induced changes in microvessel blood flow. Changes were most evident in superficial blood vessels of the peri-infarct cortex, rather than deeper vessels or regions more distant to the infarct. Insulin treatment initiated immediately after stroke mitigated the extreme vascular reaction associated with uncontrolled hyperglycemia, but only in the acute poststroke phase. In the chronic phase of recovery, blood flow velocity progressively decreased in peri-infarct regions in nondiabetic controls (Mostany et al., 2010), but remained elevated in both uncontrolled and insulin-treated diabetics.
Diabetes is well known to have deleterious effects on the vascular system of many organs. In the brain, diabetes has been associated with a thicker, more permeable vascular endothelium that is less responsive to endogenous modulators of vascular tone (Vinik and Flemmer, 2002; Li et al., 2010b; Prakash et al., 2012). This progressive deterioration of the endothelium leads to an increased risk of cardiovascular complications, such as heart attack, stroke, and vascular dementia (Centers for Disease Control and Prevention, 2011). In cases of stroke, diabetic stroke survivors have more difficulty regaining function after stroke (Kruyt et al., 2008), even when provided with similar treatment (Toni et al., 1992; Iemolo et al., 2002; Vinik and Flemmer, 2002; Wei et al., 2010; Ergul et al., 2012). Histological studies using animal models of type 2 diabetes have shown that uncontrolled hyperglycemia, even in the absence of brain damage, can increase the tortuosity, density, and collateralization between vessels in the cerebral cortex (Li et al., 2010b; Prakash et al., 2012, 2013). In the present work, we focused our attention on imaging dynamic aspects of microvascular structure and function in vivo in the presence or absence of ischemic stroke. For our baseline measurements (collected 2–4 weeks after the injection of STZ or vehicle), microvessel blood flow, lumen diameter and RBC flux were not significantly different between diabetic and nondiabetic mice. However, when hyperglycemia was left uncontrolled for the entire 8 week experiment in animals that underwent sham procedures, some differences in vascular parameters emerged at the latest experimental time points. These results indicate that, unlike models of type 2 diabetes, several weeks of hyperglycemia was required before significant changes in vascular function took place in our model. More importantly, our diabetic sham data suggest that the significant changes in blood flow, lumen diameter, and RBC flux observed in the first 2 weeks after stroke were caused by the stroke itself and were not simply a complication of prolonged hyperglycemia. However, it is unknown whether the stroke-induced changes in blood flow in type 1 diabetic mice would occur to the same extent in other models of diabetes.
Although chronic hyperglycemia did not significantly alter baseline blood flow dynamics, it did affect the microvascular response to stroke. For example, diabetes exacerbated the magnitude and duration of stroke-induced increases in blood flow velocity in peri-infarct cortex, but not more distant regions. The regional selectively of these changes, in tandem with our measurements of physiological parameters, suggest that increased blood flow velocity was not related to any global changes in cardiovascular function (heart or breath rate) or differences in the depth of anesthesia during imaging. The enhancement of blood flow velocity in peri-infarct cortex is consistent with laser doppler experiments showing greater cerebral perfusion 24 h after middle cerebral artery occlusion in type 2 diabetic rat models (Li et al., 2010b). In contrast, nondiabetic animals, who show greater recovery of forepaw function after photothrombotic stroke (Sweetnam et al., 2012), did not exhibit a significant increase in peri-infarct blood flow velocity. Instead, blood flow velocity in peri-infarct tissues declined after stroke (especially at later time points), which parallels the findings of a recent longitudinal two-photon imaging study in nondiabetic mice (Mostany et al., 2010). The functional significance of abnormally high blood flow velocity in diabetic animals will require further investigation, but it is conceivable that the oxygenation of peri-infarct tissues could be compromised (Jespersen and Østergaard, 2012) or the leakage of blood plasma or hemorrhage after stroke could be aggravated by the diabetic condition (Li et al., 2010b). Alternatively, higher velocity could be a consequence of an impairment in maintaining vascular tone or neurovascular coupling (Stefanovic et al., 2008; Lindvere et al., 2010; Chinta et al., 2012). It is interesting to note that our laboratory has recently discovered that diabetes increases dendritic spine loss after stroke (Holmes et al., 2012) and impairs the progressive reorganization of forelimb related sensory circuits in peri-infarct cortex (Sweetnam et al., 2012). Therefore, the altered microvascular response to ischemia in the diabetic brain could negatively impact the function or plasticity of neural circuits in cortical areas recovering from stroke.
Another common explanation for why diabetics have difficulty recovering from stroke is the assumption that hyperglycemia exacerbates tissue damage, thereby limiting the ability of surrounding areas to take on lost functions. Although there are some reports of larger cerebral infarcts after hypoxia or middle cerebral artery occlusion (Vannucci et al., 2001; MacDougall and Muir, 2011), our laboratory and others have previously shown either no difference or smaller infarct sizes in diabetic animal models (Ergul et al., 2007; Li et al., 2010a; Elgebaly et al., 2011; Sweetnam et al., 2012). In the current study, we saw a slight nonsignificant trend toward larger and more variable infarcts in diabetic mice. Partial control of blood glucose levels with insulin treatment immediately after photothrombotic stroke had no effect on infarct size. It is doubtful that any slight differences in infarct size were responsible for the observed differences in poststroke vascular dynamics between diabetics and nondiabetics. Because peri-infarct imaging areas were chosen before stroke induction and the infarct was targeted in such a way that the border would be ∼200 μm from these imaging areas, we would have expected to see destruction of peri-infarct imaging areas with significantly larger infarcts. In reality, we saw only two instances (one nondiabetic and one insulin-treated diabetic) in which a peri-infarct imaging area was damaged so badly by the stroke that we were unable to collect images. Additionally, we did not see greater loss of arterial branches in peri-infarct regions in diabetics as compared with nondiabetics. Thus, our data suggest that poor recovery in diabetics cannot be fully explained by differences in tissue damage or the elimination of peri-infarct blood vessels.
One of the benefits of longitudinal in vivo two-photon imaging is the opportunity to directly observe microvessel sprouting or pruning. Contrary to our initial expectations, neither diabetes nor stroke was associated with a significant amount of microvessel sprouting in peri-infarct cortex. Instead, there was a slight but significant trend toward pruning of microvessels after stroke. This finding is consistent with other chronic in vivo imaging studies that reported relatively little or no angiogenesis in adult mice (>3 months of age) exposed to chronic hypoxia (Harb et al., 2013) or ischemia (Mostany et al., 2010; Guo et al., 2011). In agreement with histological and acute two-photon imaging studies that showed increased vessel density in the ischemic border zone (Zhang et al., 2000; Brown et al., 2007; Zhang and Chopp, 2009; Gertz et al., 2012), we did find a transient increase in vascular density in peri-infarct cortex, but this was likely related to the observed increases in vessel lumen diameters (Zhang et al., 2002; Guo et al., 2011) rather than formation of new vessels, because dilated vessels occupy a greater surface area. However, it is possible that we could have missed angiogenic events at the infarct border or possibly within the ischemic core because our peri-infarct imaging areas were typically centered 26–334 μm from the edge of the infarct. This discrepancy may also be explained by the fact that photothrombosis often generates very sharp borders between ischemic and nonischemic zones. Therefore, gradients of hypoxia which might be favorable for vessel sprouting in other models of stroke may not have occurred in our study.
Footnotes
This work was supported by operating, salary, and equipment grants to C.E.B. from the Canadian Institutes of Health Research, Heart, and Stroke Foundation, Michael Smith Foundation for Health Research, Natural Sciences, and Engineering Research Council of Canada, and Canada Foundation for Innovation. K.A.T. was supported by a Michael Smith Foundation for Health Research postdoctoral fellowship. We thank Patrick Reeson and Drs Gautam Awatramani, Richard Dyck, and Patrick Nahirney for their insightful comments on the paper. We also thank Krista-Linn Lockhart for help with vessel diameter analysis, Farid Jalali for assistance and advice on two-photon microscopy, and Jennifer Graham for mouse colony management.
The authors declare no competing financial interests.
References
- Biessels GJ, van der Heide LP, Kamal A, Bleys RL, Gispen WH. Ageing and diabetes: implications for brain function. Eur J Pharmacol. 2002;441:1–14. doi: 10.1016/S0014-2999(02)01486-3. [DOI] [PubMed] [Google Scholar]
- Blinder P, Shih AY, Rafie C, Kleinfeld D. Topological basis for the robust distribution of blood to rodent neocortex. Proc Natl Acad Sci U S A. 2010;107:12670–12675. doi: 10.1073/pnas.1007239107. [DOI] [PMC free article] [PubMed] [Google Scholar]
- Brown CE, Li P, Boyd JD, Delaney KR, Murphy TH. Extensive turnover of dendritic spines and vascular remodeling in cortical tissues recovering from stroke. J Neurosci. 2007;27:4101–4109. doi: 10.1523/JNEUROSCI.4295-06.2007. [DOI] [PMC free article] [PubMed] [Google Scholar]
- Brown CE, Wong C, Murphy TH. Rapid morphologic plasticity of peri-infarct dendritic spines after focal ischemic stroke. Stroke. 2008;39:1286–1291. doi: 10.1161/STROKEAHA.107.498238. [DOI] [PubMed] [Google Scholar]
- Brown CE, Aminoltejari K, Erb H, Winship IR, Murphy TH. In vivo voltage-sensitive dye imaging in adult mice reveals that somatosensory maps lost to stroke are replaced over weeks by new structural and functional circuits with prolonged modes of activation within both the peri-infarct zone and distant sites. J Neurosci. 2009;29:1719–1734. doi: 10.1523/JNEUROSCI.4249-08.2009. [DOI] [PMC free article] [PubMed] [Google Scholar]
- Brown CE, Boyd JD, Murphy TH. Longitudinal in vivo imaging reveals balanced and branch-specific remodeling of mature cortical pyramidal dendritic arbors after stroke. J Cereb Blood Flow Metab. 2010;30:783–791. doi: 10.1038/jcbfm.2009.241. [DOI] [PMC free article] [PubMed] [Google Scholar]
- Centers for Disease Control and Prevention. National diabetes fact sheet: national estimates and general information on diabetes and prediabetes in the United States, 2011. Atlanta, GA: U.S. Department of Health and Human Services, Centers for Disease Control and Prevention; 2011. [Google Scholar]
- Chhatbar PY, Kara P. Improved blood velocity measurements with a hybrid image filtering and iterative radon transform algorithm. Front Neurosci. 2013;7:106. doi: 10.3389/fnins.2013.00106. [DOI] [PMC free article] [PubMed] [Google Scholar]
- Chinta LV, Lindvere L, Dorr A, Sahota B, Sled JG, Stefanovic B. Quantitative estimates of stimulation-induced perfusion response using two-photon fluorescence microscopy of cortical microvascular networks. Neuroimage. 2012;61:517–524. doi: 10.1016/j.neuroimage.2012.04.009. [DOI] [PubMed] [Google Scholar]
- Clarkson AN, Overman JJ, Zhong S, Mueller R, Lynch G, Carmichael ST. AMPA receptor-induced local brain-derived neurotrophic factor signaling mediates motor recovery after stroke. J Neurosci. 2011;31:3766–3775. doi: 10.1523/JNEUROSCI.5780-10.2011. [DOI] [PMC free article] [PubMed] [Google Scholar]
- Clarkson AN, López-Valdés HE, Overman JJ, Charles AC, Brennan KC, Thomas Carmichael S. Multimodal examination of structural and functional remapping in the mouse photothrombotic stroke model. J Cereb Blood Flow Metab. 2013;33:716–723. doi: 10.1038/jcbfm.2013.7. [DOI] [PMC free article] [PubMed] [Google Scholar]
- Elgebaly MM, Ogbi S, Li W, Mezzetti EM, Prakash R, Johnson MH, Bruno A, Fagan SC, Ergul A. Neurovascular injury in acute hyperglycemia and diabetes: a comparative analysis in experimental stroke. Transl Stroke Res. 2011;2:391–398. doi: 10.1007/s12975-011-0083-3. [DOI] [PMC free article] [PubMed] [Google Scholar]
- Ergul A, Elgebaly MM, Middlemore ML, Li W, Elewa H, Switzer JA, Hall C, Kozak A, Fagan SC. Increased hemorrhagic transformation and altered infarct size and localization after experimental stroke in a rat model type 2 diabetes. BMC Neurol. 2007;7:33. doi: 10.1186/1471-2377-7-33. [DOI] [PMC free article] [PubMed] [Google Scholar]
- Ergul A, Kelly-Cobbs A, Abdalla M, Fagan SC. Cerebrovascular complications of diabetes: focus on stroke. Endocr Metab Immune Disord Drug Targets. 2012;12:148–158. doi: 10.2174/187153012800493477. [DOI] [PMC free article] [PubMed] [Google Scholar]
- Gertz K, Kronenberg G, Kälin RE, Baldinger T, Werner C, Balkaya M, Eom GD, Hellmann-Regen J, Kröber J, Miller KR, Lindauer U, Laufs U, Dirnagl U, Heppner FL, Endres M. Essential role of interleukin-6 in post-stroke angiogenesis. Brain. 2012;135:1964–1980. doi: 10.1093/brain/aws075. [DOI] [PMC free article] [PubMed] [Google Scholar]
- Guo H, Itoh Y, Toriumi H, Yamada S, Tomita Y, Hoshino H, Suzuki N. Capillary remodeling and collateral growth without angiogenesis after unilateral common carotid artery occlusion in mice. Microcirculation. 2011;18:221–227. doi: 10.1111/j.1549-8719.2011.00081.x. [DOI] [PubMed] [Google Scholar]
- Harb R, Whiteus C, Freitas C, Grutzendler J. In vivo imaging of cerebral microvascular plasticity from birth to death. J Cereb Blood Flow Metab. 2013;33:146–156. doi: 10.1038/jcbfm.2012.152. [DOI] [PMC free article] [PubMed] [Google Scholar]
- Henery CC, Mayhew TM. The cerebrum and cerebellum of the fixed human brain: efficient and unbiased estimates of volumes and cortical surface areas. J Anat. 1989;167:167–180. [PMC free article] [PubMed] [Google Scholar]
- Holmes AD, Tennant K, Moore J, Rosenberg P, Brown CE. Imaging dendritic spine plasticity in diabetic mice during recovery from photothrombotic stroke. Society for Neuroscience Annual Meeting; New Orlean, LA. 2012. [Google Scholar]
- Holtmaat A, Bonhoeffer T, Chow DK, Chuckowree J, De Paola V, Hofer SB, Hübener M, Keck T, Knott G, Lee WC, Mostany R, Mrsic-Flogel TD, Nedivi E, Portera-Cailliau C, Svoboda K, Trachtenberg JT, Wilbrecht L. Long-term, high-resolution imaging in the mouse neocortex through a chronic cranial window. Nat Protoc. 2009;4:1128–1144. doi: 10.1038/nprot.2009.89. [DOI] [PMC free article] [PubMed] [Google Scholar]
- Iemolo F, Beghi E, Cavestro C, Micheli A, Giordano A, Caggia E. Incidence, risk factors and short-term mortality of stroke in Vittoria, southern Italy. Neurol Sci. 2002;23:15–21. doi: 10.1007/s100720200018. [DOI] [PubMed] [Google Scholar]
- Jespersen SN, Østergaard L. The roles of cerebral blood flow, capillary transit time heterogeneity, and oxygen tension in brain oxygenation and metabolism. J Cereb Blood Flow Metab. 2012;32:264–277. doi: 10.1038/jcbfm.2011.153. [DOI] [PMC free article] [PubMed] [Google Scholar]
- Kazmi SM, Parthasarthy AB, Song NE, Jones TA, Dunn AK. Chronic imaging of cortical blood flow using multi-exposure speckle imaging. J Cereb Blood Flow Metab. 2013;33:798–808. doi: 10.1038/jcbfm.2013.57. [DOI] [PMC free article] [PubMed] [Google Scholar]
- Kruyt ND, Nys GM, van der Worp HB, van Zandvoort MJ, Kappelle LJ, Biessels GJ. Hyperglycemia and cognitive outcome after ischemic stroke. J Neurol Sci. 2008;270:141–147. doi: 10.1016/j.jns.2008.02.020. [DOI] [PubMed] [Google Scholar]
- Li P, Murphy TH. Two-photon imaging during prolonged middle cerebral artery occlusion in mice reveals recovery of dendritic structure after reperfusion. J Neurosci. 2008;28:11970–11979. doi: 10.1523/JNEUROSCI.3724-08.2008. [DOI] [PMC free article] [PubMed] [Google Scholar]
- Li W, Kelly-Cobbs AI, Mezzetti EM, Fagan SC, Ergul A. Endothelin-1-mediated cerebrovascular remodeling is not associated with increased ischemic brain injury in diabetes. Can J Physiol Pharmacol. 2010a;88:788–795. doi: 10.1139/Y10-040. [DOI] [PMC free article] [PubMed] [Google Scholar]
- Li W, Prakash R, Kelly-Cobbs AI, Ogbi S, Kozak A, El-Remessy AB, Schreihofer DA, Fagan SC, Ergul A. Adaptive cerebral neovascularization in a model of type 2 diabetes: relevance to focal cerebral ischemia. Diabetes. 2010b;59:228–235. doi: 10.2337/db09-0902. [DOI] [PMC free article] [PubMed] [Google Scholar]
- Lin TN, Sun SW, Cheung WM, Li F, Chang C. Dynamic changes in cerebral blood flow and angiogenesis after transient focal cerebral ischemia in rats: evaluation with serial magnetic resonance imaging. Stroke. 2002;33:2985–2991. doi: 10.1161/01.STR.0000037675.97888.9D. [DOI] [PubMed] [Google Scholar]
- Lindvere L, Dorr A, Stefanovic B. Two-photon fluorescence microscopy of cerebral hemodynamics. Cold Spring Harb Protoc. 2010;2010:pdb.prot5494. doi: 10.1101/pdb.prot5494. [DOI] [PubMed] [Google Scholar]
- MacDougall NJ, Muir KW. Hyperglycaemia and infarct size in animal models of middle cerebral artery occlusion: systematic review and meta-analysis. J Cereb Blood Flow Metab. 2011;31:807–818. doi: 10.1038/jcbfm.2010.210. [DOI] [PMC free article] [PubMed] [Google Scholar]
- Martín A, Macé E, Boisgard R, Montaldo G, Thézé B, Tanter M, Tavitian B. Imaging of perfusion, angiogenesis, and tissue elasticity after stroke. J Cereb Blood Flow Metab. 2012;32:1496–1507. doi: 10.1038/jcbfm.2012.49. [DOI] [PMC free article] [PubMed] [Google Scholar]
- Masamoto K, Tomita Y, Toriumi H, Aoki I, Unekawa M, Takuwa H, Itoh Y, Suzuki N, Kanno I. Repeated longitudinal in vivo imaging of neuro-glio-vascular unit at the peripheral boundary of ischemia in mouse cerebral cortex. Neuroscience. 2012;212:190–200. doi: 10.1016/j.neuroscience.2012.03.034. [DOI] [PubMed] [Google Scholar]
- Mies G, Auer LM, Ebhardt G, Traupe H, Heiss WD. Flow and neuronal density in tissue surrounding chronic infarction. Stroke. 1983;14:22–27. doi: 10.1161/01.STR.14.1.22. [DOI] [PubMed] [Google Scholar]
- Moskowitz MA, Lo EH, Iadecola C. The science of stroke: mechanisms in search of treatments. Neuron. 2010;67:181–198. doi: 10.1016/j.neuron.2010.07.002. [DOI] [PMC free article] [PubMed] [Google Scholar]
- Mostany R, Portera-Cailliau C. A method for 2-photon imaging of blood flow in the neocortex through a cranial window. J Vis Exp. 2008;12:e678. doi: 10.3791/678. [DOI] [PMC free article] [PubMed] [Google Scholar]
- Mostany R, Chowdhury TG, Johnston DG, Portonovo SA, Carmichael ST, Portera-Cailliau C. Local hemodynamics dictate long-term dendritic plasticity in peri-infarct cortex. J Neurosci. 2010;30:14116–14126. doi: 10.1523/JNEUROSCI.3908-10.2010. [DOI] [PMC free article] [PubMed] [Google Scholar]
- Nishimura N, Schaffer CB, Friedman B, Tsai PS, Lyden PD, Kleinfeld D. Targeted insult to subsurface cortical blood vessels using ultrashort laser pulses: three models of stroke. Nat Methods. 2006;3:99–108. doi: 10.1038/nmeth844. [DOI] [PubMed] [Google Scholar]
- Nishimura N, Schaffer CB, Friedman B, Lyden PD, Kleinfeld D. Penetrating arterioles are a bottleneck in the perfusion of neocortex. Proc Natl Acad Sci U S A. 2007;104:365–370. doi: 10.1073/pnas.0609551104. [DOI] [PMC free article] [PubMed] [Google Scholar]
- Nishimura N, Rosidi NL, Iadecola C, Schaffer CB. Limitations of collateral flow after occlusion of a single cortical penetrating arteriole. J Cereb Blood Flow Metab. 2010;30:1914–1927. doi: 10.1038/jcbfm.2010.157. [DOI] [PMC free article] [PubMed] [Google Scholar]
- Pinard E, Engrand N, Seylaz J. Dynamic cerebral microcirculatory changes in transient forebrain ischemia in rats: involvement of type I nitric oxide synthase. J Cereb Blood Flow Metab. 2000;20:1648–1658. doi: 10.1097/00004647-200012000-00004. [DOI] [PubMed] [Google Scholar]
- Prakash R, Somanath PR, El-Remessy AB, Kelly-Cobbs A, Stern JE, Dore-Duffy P, Johnson M, Fagan SC, Ergul A. Enhanced cerebral but not peripheral angiogenesis in the Goto-Kakizaki model of type 2 diabetes involves VEGF and peroxynitrite signaling. Diabetes. 2012;61:1533–1542. doi: 10.2337/db11-1528. [DOI] [PMC free article] [PubMed] [Google Scholar]
- Prakash R, Johnson M, Fagan SC, Ergul A. Cerebral neovascularization and remodeling patterns in two different models of type 2 diabetes. PLoS One. 2013;8:e56264. doi: 10.1371/journal.pone.0056264. [DOI] [PMC free article] [PubMed] [Google Scholar]
- Risher WC, Ard D, Yuan J, Kirov SA. Recurrent spontaneous spreading depolarizations facilitate acute dendritic injury in the ischemic penumbra. J Neurosci. 2010;30:9859–9868. doi: 10.1523/JNEUROSCI.1917-10.2010. [DOI] [PMC free article] [PubMed] [Google Scholar]
- Schaffer CB, Friedman B, Nishimura N, Schroeder LF, Tsai PS, Ebner FF, Lyden PD, Kleinfeld D. Two-photon imaging of cortical surface microvessels reveals a robust redistribution in blood flow after vascular occlusion. PLoS Biol. 2006;4:e22. doi: 10.1371/journal.pbio.0040022. [DOI] [PMC free article] [PubMed] [Google Scholar]
- Shih AY, Friedman B, Drew PJ, Tsai PS, Lyden PD, Kleinfeld D. Active dilation of penetrating arterioles restores red blood cell flux to penumbral neocortex after focal stroke. J Cereb Blood Flow Metab. 2009;29:738–751. doi: 10.1038/jcbfm.2008.166. [DOI] [PMC free article] [PubMed] [Google Scholar]
- Shih AY, Driscoll JD, Drew PJ, Nishimura N, Schaffer CB, Kleinfeld D. Two-photon microscopy as a tool to study blood flow and neurovascular coupling in the rodent brain. J Cereb Blood Flow Metab. 2012;32:1277–1309. doi: 10.1038/jcbfm.2011.196. [DOI] [PMC free article] [PubMed] [Google Scholar]
- Stefanovic B, Hutchinson E, Yakovleva V, Schram V, Russell JT, Belluscio L, Koretsky AP, Silva AC. Functional reactivity of cerebral capillaries. J Cereb Blood Flow Metab. 2008;28:961–972. doi: 10.1038/sj.jcbfm.9600590. [DOI] [PMC free article] [PubMed] [Google Scholar]
- Sweetnam D, Holmes A, Tennant KA, Zamani A, Walle M, Jones P, Wong C, Brown CE. Diabetes impairs cortical plasticity and functional recovery following ischemic stroke. J Neurosci. 2012;32:5132–5143. doi: 10.1523/JNEUROSCI.5075-11.2012. [DOI] [PMC free article] [PubMed] [Google Scholar]
- Tennant KA, Jones TA. Sensorimotor behavioral effects of endothelin-1 induced small cortical infarcts in C57BL/6 mice. J Neurosci Methods. 2009;181:18–26. doi: 10.1016/j.jneumeth.2009.04.009. [DOI] [PMC free article] [PubMed] [Google Scholar]
- Tomita Y, Kubis N, Calando Y, Tran Dinh A, Méric P, Seylaz J, Pinard E. Long-term in vivo investigation of mouse cerebral microcirculation by fluorescence confocal microscopy in the area of focal ischemia. J Cereb Blood Flow Metab. 2005;25:858–867. doi: 10.1038/sj.jcbfm.9600077. [DOI] [PubMed] [Google Scholar]
- Toni D, Sacchetti ML, Argentino C, Gentile M, Cavalletti C, Frontoni M, Fieschi C. Does hyperglycaemia play a role on the outcome of acute ischaemic stroke patients? J Neurol. 1992;239:382–386. doi: 10.1007/BF00812155. [DOI] [PubMed] [Google Scholar]
- Trachtenberg JT, Chen BE, Knott GW, Feng G, Sanes JR, Welker E, Svoboda K. Long-term in vivo imaging of experience-dependent synaptic plasticity in adult cortex. Nature. 2002;420:788–794. doi: 10.1038/nature01273. [DOI] [PubMed] [Google Scholar]
- Vannucci SJ, Willing LB, Goto S, Alkayed NJ, Brucklacher RM, Wood TL, Towfighi J, Hurn PD, Simpson IA. Experimental stroke in the female diabetic, db/db, mouse. J Cereb Blood Flow Metab. 2001;21:52–60. doi: 10.1097/00004647-200101000-00007. [DOI] [PubMed] [Google Scholar]
- Vinik A, Flemmer M. Diabetes and macrovascular disease. J Diabetes Complications. 2002;16:235–245. doi: 10.1016/S1056-8727(01)00212-4. [DOI] [PubMed] [Google Scholar]
- Watson BD, Dietrich WD, Busto R, Wachtel MS, Ginsberg MD. Induction of reproducible brain infarction by photochemically initiated thrombosis. Ann Neurol. 1985;17:497–504. doi: 10.1002/ana.410170513. [DOI] [PubMed] [Google Scholar]
- Wei JW, Heeley EL, Wang JG, Huang Y, Wong LK, Li Z, Heritier S, Arima H, Anderson CS ChinaQUEST Investigators. Comparison of recovery patterns and prognostic indicators for ischemic and hemorrhagic stroke in China: the ChinaQUEST (QUality evaluation of stroke care and treatment) Registry study. Stroke. 2010;41:1877–1883. doi: 10.1161/STROKEAHA.110.586909. [DOI] [PubMed] [Google Scholar]
- Wei L, Erinjeri JP, Rovainen CM, Woolsey TA. Collateral growth and angiogenesis around cortical stroke. Stroke. 2001;32:2179–2184. doi: 10.1161/hs0901.094282. [DOI] [PubMed] [Google Scholar]
- Zhang S, Murphy TH. Imaging the impact of cortical microcirculation on synaptic structure and sensory-evoked hemodynamic responses in vivo. PLoS Biol. 2007;5:e119. doi: 10.1371/journal.pbio.0050119. [DOI] [PMC free article] [PubMed] [Google Scholar]
- Zhang ZG, Chopp M. Neurorestorative therapies for stroke: underlying mechanisms and translation to the clinic. Lancet Neurol. 2009;8:491–500. doi: 10.1016/S1474-4422(09)70061-4. [DOI] [PMC free article] [PubMed] [Google Scholar]
- Zhang ZG, Zhang L, Jiang Q, Zhang R, Davies K, Powers C, Bruggen Nv, Chopp M. VEGF enhances angiogenesis and promotes blood–brain barrier leakage in the ischemic brain. J Clin Invest. 2000;106:829–838. doi: 10.1172/JCI9369. [DOI] [PMC free article] [PubMed] [Google Scholar]
- Zhang ZG, Zhang L, Tsang W, Soltanian-Zadeh H, Morris D, Zhang R, Goussev A, Powers C, Yeich T, Chopp M. Correlation of VEGF and angiopoietin expression with disruption of blood–brain barrier and angiogenesis after focal cerebral ischemia. J Cereb Blood Flow Metab. 2002;22:379–392. doi: 10.1097/00004647-200204000-00002. [DOI] [PubMed] [Google Scholar]