

Abstract
Memory consolidation transforms initially labile memory traces into more stable representations. One putative mechanism for consolidation is the reactivation of memory traces after their initial encoding during subsequent sleep or waking state. However, it is still unknown whether consolidation of individual memory contents relies on reactivation of stimulus-specific neural representations in humans. Investigating stimulus-specific representations in humans is particularly difficult, but potentially feasible using multivariate pattern classification analysis (MVPA). Here, we show in healthy human participants that stimulus-specific activation patterns can indeed be identified with MVPA, that these patterns reoccur spontaneously during postlearning resting periods and sleep, and that the frequency of reactivation predicts subsequent memory for individual items. We conducted a paired-associate learning task with items and spatial positions and extracted stimulus-specific activity patterns by MVPA in a simultaneous electroencephalography and functional magnetic resonance imaging (fMRI) study. As a first step, we investigated the amount of fMRI volumes during rest that resembled either one of the items shown before or one of the items shown as a control after the resting period. Reactivations during both awake resting state and sleep predicted subsequent memory. These data are first evidence that spontaneous reactivation of stimulus-specific activity patterns during resting state can be investigated using MVPA. They show that reactivation occurs in humans and is behaviorally relevant for stabilizing memory traces against interference. They move beyond previous studies because replay was investigated on the level of individual stimuli and because reactivations were not evoked by sensory cues but occurred spontaneously.
Introduction
Two-step theories of memory formation suggest that an initial encoding stage, during which transient and hippocampus-dependent memory representations are formed, is followed by a second step called consolidation, which supports the conversion of these representations into more stable memory traces (Buzsáki, 1989; Squire, 1992; McClelland et al., 1995). Consolidation can be measured as stabilization of memory against interference (Muller and Pilzecker, 1900; McGaugh, 2000; Ellenbogen et al., 2006). A potential neuronal mechanism underlying consolidation consists in a reactivation of hippocampal memory traces and hippocampal–neocortical interactions (Buzsáki, 1989; Squire, 1992; McClelland et al., 1995; van Dongen et al., 2011). Evidence for the role of reactivation in memory consolidation comes from three different lines of research. First, studies in rodents have provided conclusive evidence that action potential sequences of spatially selective hippocampal place cells reoccur spontaneously during subsequent sleep (Skaggs and McNaughton, 1996; Ji and Wilson, 2007), but also during awake resting periods (Foster and Wilson, 2006; Karlsson and Frank, 2009; Carr et al., 2011; Jadhav et al., 2012). This reactivation is linked to hippocampal sharp wave-ripples (SWRs; Buzsáki et al., 1992), and both reactivations (Dupret et al., 2010) and SWRs (Axmacher et al., 2008; Girardeau et al., 2009) are behaviorally relevant for subsequent memory recall. Second, several functional magnetic resonance imaging (fMRI) studies in humans have reported that brain structures that were involved in learning are reactivated during subsequent slow-wave sleep (SWS; Rasch et al., 2007; Diekelmann et al., 2011), during spindle activity in both light and SWS (Bergmann et al., 2012), as well as during resting wakefulness (Peigneux et al., 2006; Tambini et al., 2010). Third, a recent study showed that subliminal presentation of acoustic cues that had previously been paired with place–image associations improved later recall performance of these associations after sleep in humans (Rudoy et al., 2009). Based on these results, one can hypothesize that spontaneous reactivation of individual memory contents improves later memory performance. To our knowledge, no previous study investigated the neuronal basis of spontaneous (uncued) replay of individual memory contents related to consolidation in humans.
Here, we used multivariate pattern analysis (MVPA) on fMRI data to investigate whether spontaneous reoccurrence of stimulus-specific activity patterns supports memory consolidation. MVPA is a multivariate technique that allows one to discriminate neural representations of object categories (Haxby et al., 2001; Polyn et al., 2005; Haynes and Rees, 2006; Eger et al., 2009; Fuentemilla et al., 2010). In particular, we tested the following two questions: First, is there spontaneous reoccurrence of activity patterns associated with previously learned stimuli (“replay”)? Second, does the replay frequency of individual stimuli predict subsequent memory for these stimuli?
In a simultaneous electroencephalogram (EEG) and 3 tesla fMRI study, participants underwent an associative memory task twice and tried to have an afternoon nap (“main resting period”) in between. We investigated spontaneous reoccurrence of neuronal activity associated with objects learned before the nap (compared with objects learned after) and related the frequency of such reoccurrence to subsequent memory success.
Materials and Methods
Participants.
Seventeen healthy right-handed participants (10 female; age, 24.1 ± 2.6 years), with no history of a neurological or psychiatric disease, participated in this study. The study was approved by the local ethics committee, and all participants provided written informed consent. To increase the likelihood of falling asleep, participants were instructed to sleep 2 h less than usual in the night before the experiment and to refrain from drinking alcohol or going out late. In principle, even this mild form of sleep deprivation may disturb sleep structure in a subsequent nap. However, such a procedure is difficult to avoid in fMRI sleep studies; we even used a milder sleep-deprivation scheme than in previous studies (Rasch et al., 2007; Bergmann et al., 2012). Also, sleep structure was relatively typical for an afternoon nap.
Participants were also told to refrain from consuming caffeine, smoking cigarettes, and taking any medication on the day of the experiment. Participants arrived between 12.30 and 1.30 P.M. After we familiarized participants with the surroundings and procedures, gave them instructions, and applied the EEG cap, we started the MRI scanning and actual experiment between 2 and 3 P.M. The experiment took 7–8 h but included several breaks (described in detail below). Participants were reimbursed for their time.
One participant aborted the experiment due to the need of a restroom break, one participant had to be excluded because of excessive movement inside the MR scanner, and five participants were not analyzed further because of low general classifier performance (see below), resulting in a final dataset of 10 participants (six female; age, 23.7 ± 2.8 years).
Stimuli.
We used bitmap pictures of 32 real-life objects from the internet that were cut out and presented on a black background. These 32 objects were grouped into two sets (A and B) for use in the two different tasks. For every object, six different exemplars were used, e.g., six different pictures of a red frog, six different pictures of German Chancellor Angela Merkel, etc. (an overview of all image categories is shown in Fig. 1B). The use of different exemplars was intended to make sure that processing of the stimuli was not solely based on low-level visual features. Thus, the classifier was actually trained on a generalized version of each stimulus, which should facilitate the recognition of slightly altered activity patterns during the resting periods. In summary, we used two sets of 16 objects represented by six different exemplars each, resulting in 2 × 16 × 6 = 192 pictures.
Figure 1.

Overview of experimental paradigm. A, Subjects learned associations between 32 different stimuli (e.g., a red frog) and spatial locations that were indicated by a white square. Every object was presented 30 times followed by the corresponding location. Half of the object–location associations had to be learned in the first part of the experiment, the other half in the second part. During the main resting period between the two learning sessions, subjects slept inside an MRI scanner with simultaneous EEG. Both memory tasks were flanked by 5 min of resting state scanning (“task-adjacent resting periods”). In a memory test subsequent to the second learning task, each of the 32 objects was presented again and subjects had to indicate the position of the associated white square. B, Overview of all stimuli categories used. Note that six different exemplars were used for each stimulus type (e.g., 6 different pictures of German Chancellor Angela Merkel).
The 16 objects in each set cannot be readily grouped into obvious categories but were carefully selected to differ on dimensions, such as large/small real-life size, rare/common, living/nonliving, natural/man-made. The two sets were balanced with regard to luminance and spatial extent of the objects.
Paradigm.
A general overview of the experiment is given in Figure 1. Each participant had to learn 16 object–place associations during two separate sessions. Between these sessions, they attempted to take an afternoon nap inside the MRI scanner (“main resting period”). Because of the long duration of the experiment (7–8 h, including ∼4 h MRI scanning), subjects were allowed breaks outside the scanner immediately before and after the main resting period. The second, postresting memory task was included because it served as a control condition for reactivation of the first set of stimuli. Also, it introduced interference with the stimulus–position associations learned in the first task and consolidation should predominantly stabilize memories against such interference (Muller and Pilzecker, 1900; McGaugh, 2000; Ellenbogen et al., 2006).
During each of the two associative memory tasks, 16 objects were paired with 16 locations on the screen as marked by a white square. The six different exemplars of each object were all associated with the same position as they were supposed to represent one object. Every object–place association was presented 30 times. Five minutes of scanning preceding and following each of the two tasks were included, resulting in four short resting periods (“task-adjacent resting periods”).
Each trial consisted of presentation of the object for 1000 ms, followed by presentation of the corresponding location for 1000 ms and a fixation cross for 3000 ms before the next trial started. The delay between presentation of the item and the associated spatial position was introduced because we aimed at designing a hippocampus-dependent learning paradigm, and previous studies had shown that the hippocampus is particularly relevant for the formation of memory associations across a temporal distance (Staresina and Davachi, 2009). The stimuli used in our memory tasks are complex stimuli as they are a combination of objects and locations. The neuronal processes underlying the binding of these features into unified memory contents have recently been investigated more closely (Haskins et al., 2008; Staresina and Davachi, 2010; Manelis et al., 2012) and the emerging picture is that different subregions in the medial temporal lobe are involved in processing of different stimulus categories and features and that the hippocampus plays a major role for the binding of features into unified memory contents. The approach used in our study assumes that neuronal activity patterns during encoding are spontaneously reactivated during subsequent resting states. However, activity patterns and involved regions may change during the experiment and only certain aspects may be reactivated in identical form. Future research should be devoted to disentangling different aspects associated with neuronal processing of complex associative stimuli (such as “object coding” vs “place coding”) as well as processes that are involved in “binding” disparate events.
Each trial lasted exactly as long as the acquisition of two fMRI volumes and the next trial would only start with the beginning of a new volume. This was designed to always capture the same part of the cognitive task in an MRI volume. Using trial lengths at a constant multiple of the repetition time is nonoptimal for general linear models, but consistent with previous pattern classification studies, which are not based on a general linear model (Kay et al., 2008; Bode and Haynes, 2009; Harrison and Tong, 2009). Each of the two experiments was divided into five blocks, separated by a 1 min break. In each block, every object was presented six times by showing each of the six different exemplars once. Within each block, stimuli were presented in randomized order. One stimulus set (“Set 1”) was presented in the first memory task (before the nap), the other in the second task (after the nap, “Set 2”). Note that Set 1 and Set 2 refers to the order in which objects were presented and not to whether they were really Set A or Set B (Fig. 1B). The order of stimulus Sets A and B was counter-balanced across 17 participants, and in the 10 subjects who met the inclusion criteria, six participants saw stimulus Set A first.
Participants were instructed to memorize the location of the white square for every object, and they were told that after finishing the second memory task, they would be shown every object again and would be required to indicate the position of the white square. They were not told that there would also be a free recall (naming every object they had seen). In addition, they were asked to give a subjective “like/don't like” evaluation of the object presented in every trial, captured by pressing a button with the left or right thumb while the image was presented. Of the 10 participants who met the inclusion criteria, seven pressed the right thumb to indicate a “like” decision and the left thumb for a “dislike” decision. In the remaining three participants, the contingency was opposite. The “like/don't like” evaluation was asked of the participants to make sure they were attending the task and to induce a deeper level of processing. However, any possible influence of these judgments on memory recall or reactivation was also investigated (see Results).
After the first memory task, which lasted ∼50 min, participants left the scanner for a 5 min break, then returned inside the scanner and attempted to fall asleep. Participants were told to take their time trying to fall asleep and to notify experimenters if either they felt they could not manage to fall asleep anymore, or if they had woken up and felt they would not fall asleep again. If they did not notify the experimenters, the main resting period ended after 120 min. We permitted a variable duration of the main resting period being fully aware that time since encoding is a major factor for retrieval success and would influence performance in the final memory test. However, we felt that such an instruction would permit participants to feel more relaxed and in control during this period, making it easier for them to actually fall asleep. The main objective of this study was not to determine the general effects of sleep, sleep duration, and time since encoding on memory performance, but to investigate neuronal correlates of spontaneous replay during rest and sleep. Whenever we related replay to memory performance, we did so intraindividually, thus preventing bias resulting from interindividual differences in sleep length and depth.
Importantly, the time between the first memory task and the main resting period was matched with the time between the main resting period and the second memory task, so that the temporal distance between the two tasks and the main resting period was always symmetrical. This is a necessary prerequisite for several of our analyses.
After the main resting period, participants were again allowed to spend some time outside the scanner and then returned inside the scanner to perform the second memory task, which also lasted 50 min. After finishing the second task, participants left the scanner. Outside the scanner, we first tested memory for stimuli from the first task and then for stimuli from the second task. We first asked participants to name all objects they could remember from either task (free recall), then showed them one exemplar of each object and asked them to indicate with a mouse cursor the position of the corresponding white square (cued recall; Rudoy et al., 2009). While the free recall task resulted in a binary remembered/forgotten measure of memory performance, the cued recall task allowed us to evaluate memory performance with a continuous metric, i.e., the closer the indicated position was to the actual position, the better we deemed the recall. The use of pattern classification analyses required a learning task with repeated presentation of the same or very similar stimuli to yield sufficient data for classifier training. This precludes testing recognition memory (“Have you seen this picture before?”) as performance would likely be at ceiling.
The entire experimental paradigm was presented using Presentation software. Images were transmitted inside the scanner via MR-compatible video-goggles (NordicNeuroLab) with a resolution of 800 × 600dpi.
Statistical analyses.
Statistical analyses were performed with IBM SPSS statistics 20 (http://www-01.ibm.com/software/analytics/spss/) or Microsoft Excel (http://office.microsoft.com/de-de/excel/). Effect size calculations for all ANOVA-based testing (η2) were performed with SPSS. Effect size calculations for one-sample t tests (d) or paired two-sample t tests (dz) were performed with G*Power 3 (Faul et al., 2007). When results were investigated in multiple experimental phases, Bonferroni correction for multiple comparisons was performed for eight phases [pre-Task 1 (Pre1), post-Task 1 (Post1), main resting period, waking state, Sleep Stage 1 (S1), Sleep Stage 2 (S2), pre-Task 2 (Pre2), post-Task 2 (Post2)].
fMRI.
MR scanning was performed with a 3 tesla scanner (TRIO, Siemens) using echoplanar imaging. For each volume, we measured 37 slices covering the whole brain with a thickness of 2.5 mm at 2500 ms repetition time, 35 ms echo time, a field of view of 210 mm, and a distance factor of 25%. In addition, a high-resolution structural T1-weighted image of the whole brain was collected for coregistration purposes with 160 slices, each with a thickness of 1 mm, at 1570 ms repetition time, 3.42 ms echo time, a field of view of 256 mm, and a distance factor of 50%.
Functional images were transformed from DICOM to NIfTI format using MRIcron (http://www.cabiatl.com/mricro/mricron/dcm2nii.html). Preprocessing was done with FMRIB Software Library (FSL; Smith et al., 2004; Woolrich et al., 2009). The steps included motion correction, 5 mm Gaussian spatial smoothing, and a linear detrending. Participants who exceeded a mean relative movement of 0.2 mm as estimated by FSL were excluded from further analysis (one participant of the original group of 17 participants). A z-transformation was then performed to have the same mean activity in each of the three scanning sessions. We then spatially aligned the images from the two memory task sessions to the images from the sleep session. Note that both task sessions were thus not in their original space but symmetrically mapped onto a third space.
EEG recording and sleep staging.
We simultaneously recorded a 14-channel EEG along with fMRI for sleep staging during the resting period. We used an Easycap MR-compatible cap with 10 cortical electrodes, two of which also served to record eye-muscle activity, three EMG electrodes at the chin, and one electrocardiogram electrode at the back. This layout followed guidelines of the American Academy of Sleep Medicine (Iber et al., 2007). All electrodes were sintered Ag/AgCl electrodes suitable for use in a 3 tesla scanner as was the BrainProducts MR Plus amplifier (Brain Products). Data were sampled at 5000 Hz.
Offline processing of the data included scanner artifact removal, cardioballistic artifact removal, notch filtering at 50 Hz, and high-pass filtering at 0.01 Hz, using the available modules from Brain Vision Analyzer 2.0 (Brain Products). Data were then segmented into 20 s epochs and scored for sleep stages according to Rechtschaffen and Kales (Rechtschaffen et al., 1968).
Multivoxel pattern classification.
All pattern classification analysis of the fMRI data was performed using the PyMVPA toolbox (Hanke et al., 2009a,b) for Python. For all classification tasks, linear support vector machines (linSVMs) with a coefficient of C = 0.1 were used. Classifiers were always trained within participants, never across participants. The third MRI volume after stimulus onset was used for training to account for the latency in the peak of the hemodynamic response. At a TR of 2500 ms, this volume encompassed the time window of 5000–7500 ms after stimulus onset. Classification was not based on all fMRI voxels but on a subset of voxels (features) that were most discriminative: for each of the ∼50,000 voxels, a one-way ANOVA was conducted before classification with the 32 different objects as independent or group variable and the BOLD signal during the presentations as dependent variable (based on the respective training dataset only to avoid circularity; see below). One thousand voxels with the highest F values in these ANOVAs were then selected for classification (Ethofer et al., 2009; Johnson et al., 2009). The F value in this case represents a measure of general variability of a given voxel with regard to the 32 different objects. After voxels were selected, they were treated identically during classifier training, regardless of the size of their F value.
Classifier accuracy.
To assess the classifier's ability to distinguish between the neural representations of individual objects, we used a cross-validation procedure. A linSVM was trained on four of the five blocks from the paradigm (training dataset) and made predictions on the remaining block (testing dataset). This was done five times, so that every block served as testing dataset once. Comparing the classifier's output (prediction) for a given trial with the actually presented object (target) across all 960 trials in all testing datasets yields an estimate of classifier accuracy. Please bear in mind that there was a 1 min break between every block in our paradigm; the classifier was thus trained on data that are temporally separated from the testing data. Any confounds artificially increasing accuracy due to hemodynamic similarity of neighboring trials were thus avoided.
For the cross-validation, corresponding blocks from the two memory tasks were combined into one block, e.g., the first block of the first memory task and the first block of the second memory task were combined into one block, so that during every cross-validation run, four blocks of both memory tasks were in the training dataset and one block from every memory task was in the validation dataset.
Excellent classifier accuracy was an important prerequisite in our study. Therefore, we excluded participants with insufficient classifier accuracy. To determine a suitable cutoff, we trained linSVMs in the same way as we did with the real experimental data, except that we shuffled the data with regard to the contingency between samples and labels. In effect, classifiers were thus trained on nonsense data. Data were shuffled within the two experimental blocks only to preserve the overall structure of the data. The shuffling was done 50 times during each of the five cross-validation runs for each participant. The nonsense-trained classifier was then applied to the respective testing dataset and accuracy was determined as it was determined in the real data. We thus obtained 250 surrogate accuracy values for each of the 17 participants.
We used the resulting distribution of accuracy values to determine a cutoff value and excluded all participants in whom classifier accuracy for either Experiment 1 or Experiment 2 objects was worse than the maximal value of the surrogate distribution plus 3 SDs.
Evaluating classifier predictions for objects from Set 1 and Set 2.
During the paradigm-free periods of the experiment, there is no direct way to assess the external validity of the classifier predictions. Classifiers were trained on all data from the two memory tasks and returned one vote per MRI volume of the resting state. This vote reflected which stimulus from the training data the given resting state MRI volume was most similar to and either referred to a stimulus from Set 1 (before the main resting period) or from the stimulus Set 2, which served as a control. The ratio of classifier votes for Set 1 objects to all classifier votes in a given period will be termed “Set 1 ratio.” If the classifier were not able to detect any valid information in the main resting period fMRI, then the Set 1 ratio should be at 0.5 (the classifier making random guesses, evenly distributed across all 32 stimuli).
On a more theoretical note, we acknowledge that it is very unlikely that every fMRI volume during the main resting period (or even most of the volumes) contains an actual replay event. However, our logic in analysis was that if there is an actual replay event, and if the classifier is able to detect it, then it should be more likely for the classifier to return a vote for a Set 1 object than for a Set 2 object in the vicinity of this replay event. Thus, on average, we hypothesized that the classifier votes more often for Set 1 objects than for Set 2 objects.
One major problem for this analysis is that data from the two memory tasks and the main resting period were recorded in three different sessions. Despite careful preprocessing and coregistering, subtle differences between sessions are likely to remain. When training the classifier on the objects of the different sessions, it is hard to determine whether it is picking up on differences in the data that are merely session-related. For example, including a voxel that is completely inside the brain in one session, and only half inside the brain in the other session, will allow the classifier to distinguish Set 1 objects from Set 2 objects. In addition, slow, long-term changes in brain activity over the sessions may contribute to a classifier bias. To elucidate these session-specific and temporal effects, we again used a surrogate approach: we trained linSVMs on data in which labels were shuffled trial-wise, but independently within Memory Task 1 and Memory Task 2. The structure of the experiment was thus conserved and allowed us to determine the potential bias introduced by temporal and spatial proximity to the resting periods. We shuffled the data 100 times for each participant, trained linSVMs on the shuffled data, and derived the votes for the different resting periods analogous to the approach with real data, resulting in a surrogate distribution of Set 1 ratios. The median of this distribution for each participant was taken as comparison value for pairwise t tests.
The linSVM not only returns a prediction about the “winner” for every given volume, but also a probability value for every class it was trained on, even when this class did not obtain the highest vote. These probability values reflect the certainty of the classifier in a given prediction. The values add up to unity across all categories. With 32 different classes, this means that probability values for single classes in this study are quite small. The class with the highest probability value is automatically returned as the “winning vote.” Taking into consideration these probability values in addition to the “winning vote” may permit additional insights. Thus, in an additional analysis, we only considered “winning votes” exceeding three times the chance probability (for a similar approach, see Fuentemilla et al., 2010).
Relating classifier predictions to memory performance.
In addition to analyzing the ratio of votes for Set 1 object to all votes in the resting periods, we also correlated classification frequency of individual items from Set 1 and Set 2 to subsequent memory success in the cued recall task. Spatiotemporal bias due to different sessions does not play a role here as Set 1 objects and Set 2 objects are analyzed separately, and objects from the same set were always presented in the same encoding session, evenly distributed across the five blocks of the task. To maximize power, we analyzed all votes during the four different resting states following the first memory task (i.e., all phases during which replay is possible). We obtained classification frequency values for each of the 16 objects of a set and for each participant calculated a Spearman correlation between these frequencies and the respective memory error values at later recall. Correlation coefficients were then tested against zero with a one-sided t test. As we expected more replay to be associated with less memory error, correlation coefficients were expected to be below zero, resulting in negative t values. This analysis was further validated using surrogate statistics. We randomly shuffled the classification frequency for individual objects found in the resting periods with respect to the item-specific memory performance within each participant and again calculated a correlation coefficient based on these shuffled data. Then, we calculated a t test against zero with the resulting Fisher-z-transformed correlation coefficients across participants in the same way as we did for the real data. Ten thousand permutations were computed in this fashion. We then tested whether the t value from the empirical data was below (more negative than) the fifth percentile of this surrogate distribution.
Replay may not correlate with the continuous measure of associative retrieval during cued recall, but also with memory for the individual items. Therefore, we also calculated a logistic regression between the number of classifier votes for individual stimuli from the first memory task (again during the combined resting periods after presentation of the first memory task) and the remembered/forgotten dichotomous values from the free recall memory task, during which participants either did or did not freely remember each object that had been presented. For every participant, a logistic regression was calculated with “number of classifier votes” as predictor and “remembered/not-remembered during free recall” as criterion. The β coefficients were again tested against zero with a one-sided t test.
Results
Sleep staging
All 10 participants considered here reached at least S2 (Fig. 2). The mean time spent inside the scanner during the resting period is 88.8 ± 30.2 (mean ± STD) min. Subjects spent 27.4 ± 25.6 (mean ± STD) min awake, 26.5 ± 23.5 min in S1, and 25.8 ± 19.4 in S2. Five subjects reached S3 and S4 for 13.1 ± 6.1 min. Four subjects reached rapid eye movement sleep for 6.8 ± 5 min.
Figure 2.
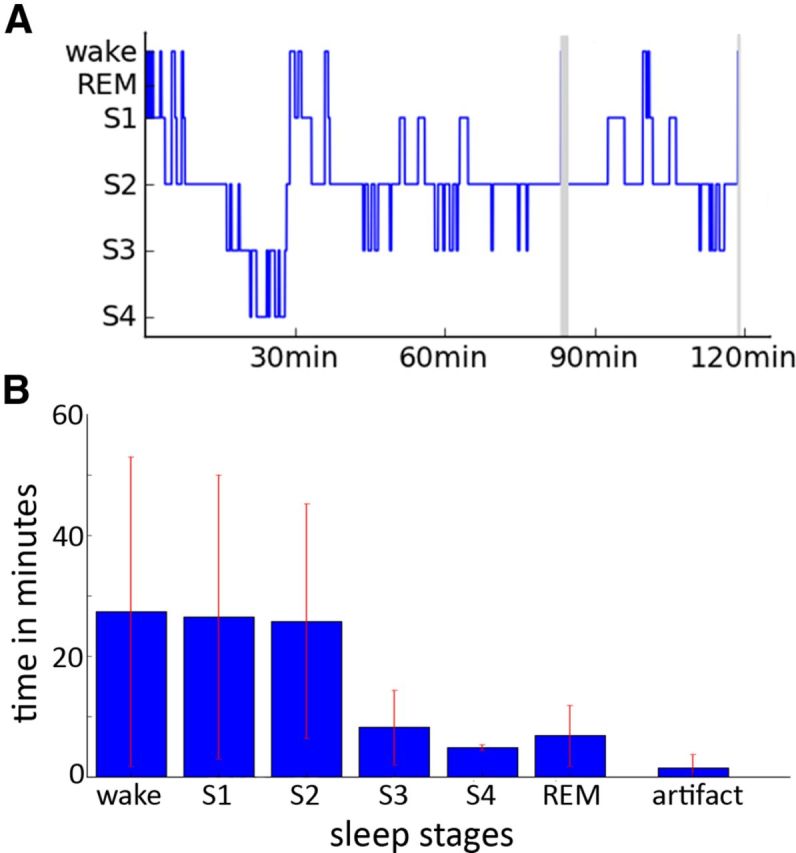
Sleep staging and sleep duration. A, Example of a hypnogram for one participant. Gray areas indicate phases in which sleep staging was not possible due to scanner artifacts. B, Average time spent in waking state and different sleep stages across participants. Note that for S3 and S4 only five and for rapid eye movement sleep (REM) only four participants were taken into the average as the others did not reach those stages.
Behavioral performance
In the free-recall condition, subjects had to name every object that they remembered from the memory tasks. Participants remembered 5.5 ± 2.1 (mean ± STD) objects from the first memory task and 10.5 ± 3.3 objects from the second memory task. This increase in memory performance was highly significant (t(9) = −4.4, p = 0.0017; effect size dz = 1.462) and is probably due to the relative recency of objects from Memory Task 2. The relatively bad memory performance during free recall (mean: 5.5 items) might be explained by the transfer-appropriate processing theory (Morris et al., 1977; Stein, 1978), since participants were prepared for cued recall, but not for free recall.
Results from cued recall show the same direction, but the difference is not significant. Memory performance in the cued-recall task was operationalized as the distance in millimeters from the correct position of the white square (“correct position”) to the position indicated by the participant (“estimated position”; Fig. 3). Thus, larger values indicate worse memory performance. This distance was 50.6 ± 28.1 mm for objects from the first memory task and 45.1 ± 28.0 mm for objects from the second memory task (t(9) = 0.84, p = 0.42; Fig. 3).
Figure 3.

Behavioral results from memory recall. Memory performance was measured as the distance between the correct and the indicated spatial position of the square associated with an item during the encoding phase. The box plots showing median and variance of memory performance across all recall trials and participants demonstrate relatively high intraindividual and interindividual variability.
Pattern classification accuracy
In the 16 participants who completed the study, classification accuracy for the 32 different objects from Set 1 and Set 2 varied between 12 and 59% (mean ± STD: 33 ± 15.3%), which was highly above chance level (100%/32 = 3.125%; t(15) = 8.27; p < 0.0001; effect size d = 1.95). As excellent classifier performance was a prerequisite for the identification of possible stimulus-specific reactivation during the resting periods, participants with insufficient classifier accuracy were excluded (cutoff determined by a surrogate approach: 15.12%), resulting in a final sample of 10 participants (Fig. 4A). Classification of the experimental stimuli was mainly based on voxels from the visual cortex, which extended into the ventral visual stream and even the posterior parahippocampal gyrus (Fig. 4B).
Figure 4.

Extraction of stimulus-specific representations by multivariate pattern analysis. A, Pattern classification accuracy as assessed by a cross-validation approach. Each red point indicates results from one participant. The red line indicates chance performance (3.125%). B, The classifier was trained on the 1000 most discriminative features (i.e., voxels) from each subject. The figure shows the regional distribution of features that were selected most often, which were most abundant in the occipital lobe but reached into inferior temporal cortex.
The order of the two stimulus sets was randomly assigned in each participant. In the final group of 10 participants who met the inclusion criteria, six participants were presented first with items from Set A, and the other four participants with items from Set B. The classifier accuracy between the two sets of stimuli was not significantly different (two-sided paired t test: t(9) = 1.274, p = 0.234).
One of the major concerns with pattern classification approaches is that classifiers might be overfitted to the data. We reduced the risk of overfitting by limiting the feature space to 1000 voxels and by choosing as classifier a linSVM that has been successfully used in fMRI decoding studies (Bode and Haynes, 2009; Eger et al., 2009; Chadwick et al., 2011). Furthermore, demonstrating good classification performance in the cross-validation approach is another way of showing that the classifier is not overfitted: overfitting would have substantially reduced classification accuracy.
The following results all refer to classifier behavior during resting periods, in which classifier performance cannot be directly assessed. We compared the classifier output in these resting periods with assumptions that are derived from two-step models of memory formation, namely that Set 1 objects should be detected more often and that their detection frequency should correlate with behavior.
It is also of interest to which degree the study patterns match the rest patterns. For this, we assessed the probability values that were associated with the “winning vote” of predictions during the encoding phase (which were taken from the cross-validation approach) and compared them to the probabilities of the winning votes of predictions in the resting phase. Across participants, we found no significant difference in the mean probability level of winning votes between encoding and the main resting period in a paired two-sided t test (t(9) = 0.94, p = 0.37).
Pattern classifier predictions for Set 1 versus Set 2 objects
Figure 5 provides an overview of classifier predictions during all resting periods when trained on empirical data and on trial-shuffled surrogate data. The main resting period can be further divided into waking state and the five different sleep stages. A repeated-measures ANOVA revealed significant differences of classifier votes (ratio of Set 1 votes to all votes) during the eight different resting periods (Pre1, Post1, complete main resting period, wake, S1, S2, Pre2, and Post2; F(7,63) = 4.66, p < 0.001, effect size η2 = 0.341). The ratio of Set 1 votes to all votes was significantly >0.5 in all periods except Post2 (t(9) = 1.477, puncorr = 0.088). When correcting for multiple comparisons, only phases “Post1” and “wake” remain significant (Post1: t(9) = 3.37; pcorr = 0.033; wake: t(9) = 4.00; pcorr = 0.012). This result is in accordance with our predictions for the main resting period. Surprisingly, however, we also found that classifier predictions favor objects from Set 1 already during phase Pre1 (t(9) = 2.64, puncorr = 0.013, pcorr = 0.107, effect size d = 0.888), during which no replay is possible. Even though this latter effect does not survive correction for multiple comparisons, it should be investigated further and it is discussed below.
Figure 5.

Spontaneous replay of stimulus-specific activity during resting state. A, Results from the main resting period between the two experiments. Bars depict the frequency with which objects from the first memory task were voted for by the classifier compared with the total amount of votes. Gray bars indicate results derived from a surrogate approach. Orange bars refer to results in the empirical data. Objects from Experiment 1 are voted for significantly more often than would be expected by chance in both empirical and surrogate data, but ratios for Experiment 1 votes to all votes are significantly higher in the empirical than in the surrogate data. B, Frequency of votes for objects from the first memory task in the task-adjacent resting periods (Pre1, Post1, Pre2, Post2) and in the different stages of the main resting period in the empirical and surrogate data. The ratio of votes for objects from the first memory task to all votes was higher in the empirical versus the surrogate classifier during the waking period, as well as during Pre2 and Post2. One star denotes puncorr < 0.05; two stars denote pcorr < 0.05.
To better understand this apparent bias, we investigated votes from a surrogate classifier trained on trial-shuffled data. Again, an ANOVA revealed significantly different votes during the different stages (F(7,63) = 7.29, p < 0.001, effect size η2 = 0.447). During the entire experiment (Pre1, Post1, main resting period, Pre2, Post2), the ratio of Set 1 votes to all votes decreased monotonically for the surrogate classifier, as indicated by a significant linear trend (F(1,9) = 14.56, p = 0.004, effect size η2 = 0.592).
Next, we compared the results from the empirical and the surrogate classifier during the different stages. We found that the empirical classifier generated a significantly higher ratio of Set 1 votes to all votes than the surrogate classifier during the main resting period (t(9) = 3.14, puncorr = 0.006, pcorr = 0.047, effect size dz = 0.912), as well as during Post2 (t(9) = 3.48, puncorr = 0.003, pcorr = 0.028, effect size dz = 1.039). In contrast, there was no significant difference during Pre1 [t(9) = 1.64, puncorr = 0.067, pcorr = 0.538 (note that this test, as all others, is one-sided even though we did not have a one-sided hypothesis for Pre1, making this test conservative)] or Post1 (t(9) = 1.49, puncorr = 0.085, pcorr = 0.680). This result strongly suggests that the apparent bias during the Pre1 period, but not the effect during the main resting period, is attributable to the temporal proximity of the presentation of Set 1 items. When we analyzed the different stages of alertness, we found a significantly higher ratio of Set 1 votes to all votes generated by the empirical versus the surrogate classifier only during the waking state (t(9) = 3.87, puncorr = 0.002, pcorr = 0.015, effect size dz = 1.250). Moreover, the difference in the ratio of Set 1 votes to all votes between empirical data and surrogate data was significantly greater during waking state than during Pre1 (t(9) = 3.07, puncorr = 0.007, pcorr = 0.047, effect size dz = 0.990; in this result, there are seven possible comparisons—all of the other seven phases against Pre1). Currently, we do not have a clear explanation for the lack of reactivation for objects from the second memory task in the short resting period after learning (Post2). Speculatively, it may be explained by conscious rehearsal of associations learned in the first task by the participants because they knew that they would have to perform a memory test on these older, possibly weakened object–place associations soon.
We tentatively thresholded the results at a probability value of 0.10 (which for our dataset corresponded to more than three times the chance level). At this threshold, the ratio of votes for Experiment 1 objects to all objects did not differ from the ratios in the original, nonthresholded data. It may be noted that during Phase Post1, the ratio of votes for Experiment 1 objects to all objects was on average smaller in the thresholded compared with the nonthresholded data, but only if not corrected for multiple comparisons (paired two-sided t test: t(9) = 3.00, puncorr = 0.015, pcorr = 0.118, effect size dz = 0.993). Similar effects were not seen in any other stage. This suggests that using a reasonably high probability threshold does not affect the results much.
Association of classifier votes with memory performance
Next, we analyzed whether reactivation of individual Set 1 stimuli was related to subsequent memory of the positions associated with these stimuli (Fig. 6). Importantly, this analysis is independent from the analysis of the ratio of Set 1 votes to all votes reported above. For example, there can be a high correlation with behavioral accuracy for objects from the first memory task, even when the total ratio of all votes for objects from the first memory task is low and vice versa. Memory was tested by presenting each stimulus and asking the participant to indicate the associated position. Recall error (the distance between the correct and the indicated position) is then an inverse measure of memory accuracy. For each participant, we calculated a Spearman's correlation between the number of classifier votes for an individual stimulus (classification frequency) and recall error. For stimuli from the first task, we expected a significant negative correlation between the amount of replay and recall error during all resting periods after presentation of the first task. In contrast, there should be no correlation with memory performance during Pre1. For stimuli from the second task, there should be a significant negative correlation during the Post2 period, but not during the other resting periods.
Figure 6.

Replay of stimulus-specific activity correlates with memory performance. A, Illustrative scatter plot for one participant of the relationship between the number of classifier votes for a given stimulus and the distance to target during memory recall for the respective stimulus. Right, Fisher-z-transformed correlation coefficients between stimulus-wise error during behavioral recall and stimulus-wise number of classifier votes for objects from the first memory task (orange) and the second memory task (blue). B, Fisher-z-transformed Spearman's correlation coefficients for objects from the first memory task (orange) and objects from the second memory task (blue) across different phases of the experiment, including waking state, S1, S2, SWS (S3 + 4) and rapid eye movement sleep (REM). Combined resting period (CRP) includes all resting periods following presentation of the first memory task, i.e., all resting periods where replay is possible. Fisher-z-transformed correlation coefficients were tested for consistent negativity across subjects with a one-sided t test against zero. Stars indicate phases in which there was significant consistent negativity (puncorr < 0.05; in CRP, no correction for multiple comparisons was applied). There was no consistent negativity in any phases for correlations involving objects from the second memory task.
We found that the (Fisher-z-transformed) correlation coefficients across 10 participants were significantly <0 (one-sided t test: t(9) = −2.20; p = 0.027; effect size d = 0.739; Fig. 6A; as this period is a combination of every resting period that could contain replay events, no correction for multiple comparisons was performed). This replay cannot be solely related to covert rehearsal by subjects, because the consistently negative correlation is also evident during S1 (t(9) = −2.81; puncorr = 0.028, pcorr = 0.22; effect size d = 0.734), and shows a trend during S2 (t(9) = −1.98; puncorr = 0.088, pcorr = 0.702; effect size d = 0.490), even though this does not survive correction for multiple comparisons. Importantly, no such consistently negative correlation was observed in the resting period preceding the first memory task (“Pre1”; t(9) = −1.82; puncorr > 0.1) and none for Set 2 stimuli (highest t value for any of the different phases including Post2: t(9) = 1.35; puncorr > 0.1). Data from all individual phases of the experiment are presented in Figure 6B.
These results were confirmed by a boot-strapping approach (during which the number of classifier votes was randomly permutated with respect to the item-specific memory performance): for objects from the first memory task, the t value for correlation coefficients was above the fifth percentile for the resting state before the first memory task (Pre1; percentile, 11.32), indicating lack of a significant effect, and below the fifth percentile for the combined resting period after the first task (all four resting periods after Task 1; percentile, 2.83). When we generated surrogate data in the same fashion for classifier votes for objects from the second memory task, we found that t values were never below the fifth percentile for either resting period (smallest percentile, 89.53).
There was no relationship between number of classifier votes and behavioral performance in the free recall test: for the combined resting period (see above), the β values were not significantly different from zero across participants for stimuli from the first memory task (t(9) = −1.40; puncorr = 0.19) or for stimuli from the second memory task (t(9) = −0.77; puncorr = 0.46).
Investigating alternative explanations
In the analysis of the potential influence of “like/don't like” judgments on memory reactivation, one subject had to be excluded due to erroneous use of the response pads in the face of otherwise dutiful task engagement. We found that there was no significant difference in mean “like/don't like” judgment between the two memory tasks across participants in a two-sided paired t test (t(8) = 0.41, p = 0.68). There was no association between the subjective likeability of items and classifier accuracy for these items when Fisher-z-transformed correlation coefficients were tested against zero (Experiment 1 objects: t(8) = 0.11, puncorr = 0.91; Experiment 2 objects: t(8) = 0.40, puncorr = 0.70). With the same test, we found no association between the mean likability of items and classification frequency during the main resting period (Experiment 1 objects: t(8) = 1.13, puncorr = 0.29; Experiment 2 objects: t(8) = 0.42, puncorr = 0.84). There was no evidence that likability leads to improved recall at the memory test (Experiment 1 objects: t(8) = 0.91, puncorr = 0.39; Experiment 2 objects: t(8) = 1.12, puncorr = 0.30).
To detect any potential difference in task engagement, we compared the consistency of likability ratings for the different exemplars of each stimulus between the two memory tasks. This is assuming that the likability ratings should not vary for the different exemplars of a stimulus (even though this was not explicitly stated in the instruction) and thus consistency could be taken as a marker for dutiful task execution. We calculated the percentage of “like” responses for every exemplar and calculated the SD of this percentage across the six exemplars, which is a measure of how consistent subjects responded for each stimulus. We did not find any difference in the consistency between the stimuli of the two memory tasks across subjects with a paired two-sided t test (t(8) = 1.21, p = 0.26).
We cannot completely rule out the possible influence of drowsiness on the results following the nap in the main resting period. However, it should be noted that the majority of subjects (N = 6) did not stay inside the scanner for the maximum of 2 h, but woke up by themselves and pressed the emergency button (as instructed to do when they had finished their nap). Of the remaining four subjects, only two were actually still asleep when the scanner was stopped (according to sleep staging). Thus, most participants did not wake up just when the scanner was stopped at the end of the resting period. One sign of fatigue is increased alpha activity (Craig et al., 2012). In every 20 s epoch during the encoding, the amount of occipital alpha wave pattern in seconds was noted. The sum of this alpha activity was not different between the two encoding phases (paired two-sided t test across 10 subjects: t(9) = 0.52, p = 0.614), indicating that this drowsiness-related EEG activity did not differ between the two tasks. In addition, we also found that reaction times during the “like/don't like” ratings did not differ between the two memory tasks (t(8) = 0.31, p = 0.76). This, together with the fact that memory performance for the second memory task was not worse and that there was a break between the main resting period and the memory task during which participants had time to fully wake up, led us to conclude that differences in drowsiness are unlikely to contribute to our findings in a relevant manner.
Discussion
We used MVPA on fMRI data to decode stimulus-specific activity patterns and to investigate spontaneous replay of these patterns during awake resting state and sleep. As such, this study uses a novel approach for tracking neuronal patterns in long periods of resting state and sleep. This method may be helpful in the future analysis of post-task resting states and to elucidate the processes taking place in these supposedly task-free periods.
We found more “replay” of Set 1 than Set 2 stimuli not only during the main resting period, but even during the task-adjacent resting period Pre1, i.e., before any stimuli had been presented. This apparent bias may be due to two main factors. First, the experiment was split up into three fMRI sessions due to its long duration, and participants left the scanner between the sessions. Despite coregistering the sessions to one another, images within one session will be more similar to one another than images between sessions. However, no such bias would be expected during the main resting period, which is in a different session between presentation of both Set 1 and Set 2 stimuli. Second, a bias would be expected due to MRI-related temporal autocorrelations (due to, for example, slow metabolic processes or even circadian rhythms). As the main resting period was at an equal temporal distance to both stimulus sets, this should not affect the voting behavior for the main resting period, but might be relevant for the short task-adjacent resting periods. We addressed these problems by using a surrogate approach in which we shuffled the data but conserved the temporal structure of the experiment. Even though classifiers were trained on nonsense data, classifier output still showed a bias during the task-adjacent resting periods. By showing that Set 1 ratios in the empirical data are higher than Set 1 ratios in the surrogate data in the waking state of the main resting period, we were able to demonstrate reactivation over and above any bias that may be caused by the temporal structure of the experiment.
It should be noted that even though we used 32 different stimuli in our learning tasks, we cannot exclude the possibility that the classifier differentiates between the general categories that a given stimulus belongs to rather than between each individual stimulus class. However, we tried to balance the occurrence of obvious categories (living/nonliving, faces, buildings, etc.) between the two sets and also balanced the order of which set was shown first. The fact that we found a systematic increase of activity related to items learned before rather than after the main resting period, combined with the finding that the frequency of occurrence of this activity was related to memory performance, is a strong indicator that specific aspects of the stimulus are important. In other words, even if the classifier picks up category-associated activity rather than stimulus-specific activity, this activity still has to occur before the learning task to be reactivated in the resting period, and the reactivation of category-specific activity still is associated with memory performance. Future studies are needed to elucidate the stimulus aspects that MVPA approaches are most sensitive to.
While the motivation for our study was derived from studies in rodents that show replay of hippocampal place cells after the learning of a spatial task, several technical and theoretical differences between these approaches have to be mentioned. First, electrophysiological recordings in rodents directly measure activity of individual cells. Second, the increase of neuronal firing rates on specific spatial locations represents a simple spatial rate code, which simplifies the subsequent detection of replay. On the other hand, fMRI recordings enable one to indirectly measure neuronal activity patterns in the entire brain and to explore their potential contribution to replay. Of course, the nature of “replay” activity traceable with fMRI differs drastically from single-cell recordings. One of the major differences between this study and the literature in rodents is the different time-scale of fMRI and electrophysiological recording. The EEG data that were recorded in this study could have bridged this gap. However, pattern classification of these EEG data was not successful (data not shown). This is possibly due to the relatively low number of only eight cortical recording channels of the EEG cap used here (which was specifically designed for sleep recordings) and the deterioration of EEG quality by simultaneous fMRI. We still feel that it would be worthwhile to record and analyze electrophysiological data in a similar paradigm in follow-up studies within a shielded environment and using a cap that is better suited to this approach.
In our study, spontaneous replay was investigated. This means that it was not possible to pinpoint time windows in which replay events were actually occurring or more likely to occur. However, the logic behind the study was that the pattern classifier should vote for Set 1 objects more often than chance in the vicinity of real replay events and thus, on average, predictions for Set 1 objects should be predominant over a longer period of time. Investigating spontaneous replay has its merits because it is unlikely to introduce any strange effects with cues, e.g., sensory stimulation. But it also complicates analysis because the signal-to-noise ratio is probably quite low and this might lead to some unexpected effects, especially in the very short task-adjacent resting periods. It would be helpful if, in future studies, the likely occurrence of replay events could be manipulated (e.g., cued with odors or sound) or narrowed to specific time windows (e.g., in the vicinity of spindle events).
The voxels that were used for MVPA were located mainly in the visual cortex, extending along the ventral visual stream. Hippocampal voxels, however, were not significantly involved. This might be due to the lack of topographical organization of the hippocampus: several studies in rodents have shown that the hippocampus does not display topographic organization, i.e., neighboring hippocampal neurons do not seem to encode similar stimulus features (Redish et al., 2001; Dombeck et al., 2010), which is also expressed in the theory that the hippocampus implements a random graph architecture (Buzsáki, 2006). If the hippocampus is not topographically organized, activity in a voxel in fMRI, which summarizes activation across hundreds of thousands of neurons, will not be as helpful in decoding stimuli as in topographically organized cortex regions. This is consistent with the lack of category specificity of hippocampal BOLD responses found in a recent fMRI study (Diana et al., 2008). On the other hand, studies using high-resolution fMRI of the hippocampus showed that specific spatial locations could be differentiated using pattern classification analyses (Hassabis et al., 2009). Future studies will be needed to identify more exactly the type of information that can be decoded from the hippocampus.
Interestingly, reactivation was most evident during awake resting state. These results apparently conflict with those of a recent study (Diekelmann et al., 2011) that showed that presentation of an odor cue previously paired with an associative learning paradigm only improved memory stability if it occurred during SWS, but not if it was presented during awake resting state (see also Hupbach et al., 2007). How can these differences be explained? Most importantly, reactivation was cued in the studies by Hupbach et al. (2007) and Diekelmann and colleagues (2011), whereas it occurred spontaneously in our study. Sensory stimulation triggers bottom-up information flow into the hippocampus (Hasselmo, 2005; Takeuchi et al., 2011), which might affect reactivation differently than if it occurs spontaneously. Indeed, several electrophysiological studies in rodents (Foster and Wilson, 2006; Karlsson and Frank, 2009; Carr et al., 2011; Jadhav et al., 2012) as well as fMRI (Peigneux et al., 2006; Tambini et al., 2010) and intracranial EEG results from humans (Axmacher et al., 2008) are consistent with the hypothesis that reactivation and memory consolidation may occur also during awake resting state. Alternatively, this discrepancy may be due to investigating an afternoon nap instead of night sleep, although afternoon naps appear to affect memory consolidation similar to night sleep (Takashima et al., 2006; Lau et al., 2010), even if it lasts only a few minutes (Lahl et al., 2008).
Most importantly, we found a consistently negative correlation between the amount of reactivation and later memory error for these stimuli. While we did not observe replay during phases of SWS, this might well be due to the relatively small number of subjects who actually reached SWS in our study (N = 5). Alternatively, the pattern classification algorithm might have been unable to detect the activity patterns from waking state during SWS, which shows significantly altered BOLD activation (Dang-Vu et al., 2008). So, together, the results from this study only provide a limited contribution to understanding the role of deeper sleep stages in consolidation because the periods of SWS in an afternoon nap are too short to analyze them with the same confidence as waking state and S1 and S2. Further studies designed to record longer periods of sleep, especially during the night, and possibly using electrophysiological recordings instead of fMRI are needed to clarify whether reactivation can be detected in SWS.
Footnotes
L.D. and T.A.K. were supported by Grant AX82/1-2 from the Deutsche Forschungsgemeinschaft (DFG). J.O. received a BONFOR dissertation stipend. N.A. was supported by an Emmy Noether grant by the DFG. We thank Steffen Gais and Björn Rasch for helpful discussions during designing the experiment.
References
- Axmacher N, Elger CE, Fell J. Ripples in the medial temporal lobe are relevant for human memory consolidation. Brain. 2008;131:1806–1817. doi: 10.1093/brain/awn103. [DOI] [PubMed] [Google Scholar]
- Bergmann TO, Mölle M, Diedrichs J, Born J, Siebner HR. Sleep spindle-related reactivation of category-specific cortical regions after learning face-scene associations. Neuroimage. 2012;59:2733–2742. doi: 10.1016/j.neuroimage.2011.10.036. [DOI] [PubMed] [Google Scholar]
- Bode S, Haynes JD. Decoding sequential stages of task preparation in the human brain. Neuroimage. 2009;45:606–613. doi: 10.1016/j.neuroimage.2008.11.031. [DOI] [PubMed] [Google Scholar]
- Buzsáki G. Two-stage model of memory trace formation: a role for noisy brain states. Neuroscience. 1989;31:551–570. doi: 10.1016/0306-4522(89)90423-5. [DOI] [PubMed] [Google Scholar]
- Buzsáki G. Rhythms of the brain. Oxford, New York: Oxford UP; 2006. [Google Scholar]
- Buzsáki G, Horváth Z, Urioste R, Hetke J, Wise K. High-frequency network oscillation in the hippocampus. Science. 1992;256:1025–1027. doi: 10.1126/science.1589772. [DOI] [PubMed] [Google Scholar]
- Carr MF, Jadhav SP, Frank LM. Hippocampal replay in the awake state: a potential substrate for memory consolidation and retrieval. Nat Neurosci. 2011;14:147–153. doi: 10.1038/nn.2732. [DOI] [PMC free article] [PubMed] [Google Scholar]
- Chadwick MJ, Hassabis D, Maguire EA. Decoding overlapping memories in the medial temporal lobes using high-resolution fMRI. Learn Mem. 2011;18:742–746. doi: 10.1101/lm.023671.111. [DOI] [PMC free article] [PubMed] [Google Scholar]
- Craig A, Tran Y, Wijesuriya N, Nguyen H. Regional brain wave activity changes associated with fatigue. Psychophysiology. 2012;49:574–582. doi: 10.1111/j.1469-8986.2011.01329.x. [DOI] [PubMed] [Google Scholar]
- Dang-Vu TT, Schabus M, Desseilles M, Albouy G, Boly M, Darsaud A, Gais S, Rauchs G, Sterpenich V, Vandewalle G, Carrier J, Moonen G, Balteau E, Degueldre C, Luxen A, Phillips C, Maquet P. Spontaneous neural activity during human slow wave sleep. Proc Natl Acad Sci U S A. 2008;105:15160–15165. doi: 10.1073/pnas.0801819105. [DOI] [PMC free article] [PubMed] [Google Scholar]
- Diana RA, Yonelinas AP, Ranganath C. High-resolution multi-voxel pattern analysis of category selectivity in the medial temporal lobes. Hippocampus. 2008;18:536–541. doi: 10.1002/hipo.20433. [DOI] [PMC free article] [PubMed] [Google Scholar]
- Diekelmann S, Büchel C, Born J, Rasch B. Labile or stable: opposing consequences for memory when reactivated during waking and sleep. Nat Neurosci. 2011;14:381–386. doi: 10.1038/nn.2744. [DOI] [PubMed] [Google Scholar]
- Dombeck DA, Harvey CD, Tian L, Looger LL, Tank DW. Functional imaging of hippocampal place cells at cellular resolution during virtual navigation. Nat Neurosci. 2010;13:1433–1440. doi: 10.1038/nn.2648. [DOI] [PMC free article] [PubMed] [Google Scholar]
- Dupret D, O'Neill J, Pleydell-Bouverie B, Csicsvari J. The reorganization and reactivation of hippocampal maps predict spatial memory performance. Nat Neurosci. 2010;13:995–1002. doi: 10.1038/nn.2599. [DOI] [PMC free article] [PubMed] [Google Scholar]
- Eger E, Michel V, Thirion B, Amadon A, Dehaene S, Kleinschmidt A. Deciphering cortical number coding from human brain activity patterns. Curr Biol. 2009;19:1608–1615. doi: 10.1016/j.cub.2009.08.047. [DOI] [PubMed] [Google Scholar]
- Ellenbogen JM, Hulbert JC, Stickgold R, Dinges DF, Thompson-Schill SL. Interfering with theories of sleep and memory: sleep, declarative memory, and associative interference. Curr Biol. 2006;16:1290–1294. doi: 10.1016/j.cub.2006.05.024. [DOI] [PubMed] [Google Scholar]
- Ethofer T, Van De Ville D, Scherer K, Vuilleumier P. Decoding of emotional information in voice-sensitive cortices. Curr Biol. 2009;19:1028–1033. doi: 10.1016/j.cub.2009.04.054. [DOI] [PubMed] [Google Scholar]
- Faul F, Erdfelder E, Lang AG, Buchner A. G*Power 3: a flexible statistical power analysis program for the social, behavioral, and biomedical sciences. Behav Res Methods. 2007;39:175–191. doi: 10.3758/BF03193146. [DOI] [PubMed] [Google Scholar]
- Foster DJ, Wilson MA. Reverse replay of behavioural sequences in hippocampal place cells during the awake state. Nature. 2006;440:680–683. doi: 10.1038/nature04587. [DOI] [PubMed] [Google Scholar]
- Fuentemilla L, Penny WD, Cashdollar N, Bunzeck N, Düzel E. Theta-coupled periodic replay in working memory. Curr Biol. 2010;20:606–612. doi: 10.1016/j.cub.2010.01.057. [DOI] [PMC free article] [PubMed] [Google Scholar]
- Girardeau G, Benchenane K, Wiener SI, Buzsáki G, Zugaro MB. Selective suppression of hippocampal ripples impairs spatial memory. Nat Neurosci. 2009;12:1222–1223. doi: 10.1038/nn.2384. [DOI] [PubMed] [Google Scholar]
- Hanke M, Halchenko YO, Sederberg PB, Hanson SJ, Haxby JV, Pollmann S. PyMVPA: a Python toolbox for multivariate pattern analysis of fMRI data. Neuroinformatics. 2009a;7:37–53. doi: 10.1007/s12021-008-9041-y. [DOI] [PMC free article] [PubMed] [Google Scholar]
- Hanke M, Halchenko YO, Sederberg PB, Olivetti E, Fründ I, Rieger JW, Herrmann CS, Haxby JV, Hanson SJ, Pollmann S. PyMVPA: a unifying approach to the analysis of neuroscientific data. Front Neuroinform. 2009b;3:3. doi: 10.3389/neuro.11.003.2009. [DOI] [PMC free article] [PubMed] [Google Scholar]
- Harrison SA, Tong F. Decoding reveals the contents of visual working memory in early visual areas. Nature. 2009;458:632–635. doi: 10.1038/nature07832. [DOI] [PMC free article] [PubMed] [Google Scholar]
- Haskins AL, Yonelinas AP, Quamme JR, Ranganath C. Perirhinal cortex supports encoding and familiarity-based recognition of novel associations. Neuron. 2008;59:554–560. doi: 10.1016/j.neuron.2008.07.035. [DOI] [PubMed] [Google Scholar]
- Hassabis D, Chu C, Rees G, Weiskopf N, Molyneux PD, Maguire EA. Decoding neuronal ensembles in the human hippocampus. Curr Biol. 2009;19:546–554. doi: 10.1016/j.cub.2009.02.033. [DOI] [PMC free article] [PubMed] [Google Scholar]
- Hasselmo ME. What is the function of hippocampal theta rhythm? Linking behavioral data to phasic properties of field potential and unit recording data. Hippocampus. 2005;15:936–949. doi: 10.1002/hipo.20116. [DOI] [PubMed] [Google Scholar]
- Haxby JV, Gobbini MI, Furey ML, Ishai A, Schouten JL, Pietrini P. Distributed and overlapping representations of faces and objects in ventral temporal cortex. Science. 2001;293:2425–2430. doi: 10.1126/science.1063736. [DOI] [PubMed] [Google Scholar]
- Haynes JD, Rees G. Decoding mental states from brain activity in humans. Nat Rev Neurosci. 2006;7:523–534. doi: 10.1038/nrn1931. [DOI] [PubMed] [Google Scholar]
- Hupbach A, Gomez R, Hardt O, Nadel L. Reconsolidation of episodic memories: a subtle reminder triggers integration of new information. Learn Mem. 2007;14:47–53. doi: 10.1101/lm.365707. [DOI] [PMC free article] [PubMed] [Google Scholar]
- Iber C, Ancoli-Israel S, Chesson A, Quan S. The AASM manual for the scoring of sleep and associated events: rules, terminology and technical specification. Westchester, IL: American Academy of Sleep Medicine; 2007. [Google Scholar]
- Jadhav SP, Kemere C, German PW, Frank LM. Awake hippocampal sharp-wave ripples support spatial memory. Science. 2012;336:1454–1458. doi: 10.1126/science.1217230. [DOI] [PMC free article] [PubMed] [Google Scholar]
- Ji D, Wilson MA. Coordinated memory replay in the visual cortex and hippocampus during sleep. Nat Neurosci. 2007;10:100–107. doi: 10.1038/nn1825. [DOI] [PubMed] [Google Scholar]
- Johnson JD, McDuff SG, Rugg MD, Norman KA. Recollection, familiarity, and cortical reinstatement: a multivoxel pattern analysis. Neuron. 2009;63:697–708. doi: 10.1016/j.neuron.2009.08.011. [DOI] [PMC free article] [PubMed] [Google Scholar]
- Karlsson MP, Frank LM. Awake replay of remote experiences in the hippocampus. Nat Neurosci. 2009;12:913–918. doi: 10.1038/nn.2344. [DOI] [PMC free article] [PubMed] [Google Scholar]
- Kay KN, Naselaris T, Prenger RJ, Gallant JL. Identifying natural images from human brain activity. Nature. 2008;452:352–355. doi: 10.1038/nature06713. [DOI] [PMC free article] [PubMed] [Google Scholar]
- Lahl O, Wispel C, Willigens B, Pietrowsky R. An ultra short episode of sleep is sufficient to promote declarative memory performance. J Sleep Res. 2008;17:3–10. doi: 10.1111/j.1365-2869.2008.00622.x. [DOI] [PubMed] [Google Scholar]
- Lau H, Tucker MA, Fishbein W. Daytime napping: effects on human direct associative and relational memory. Neurobiol Learn Mem. 2010;93:554–560. doi: 10.1016/j.nlm.2010.02.003. [DOI] [PubMed] [Google Scholar]
- Manelis A, Reder LM, Hanson SJ. Dynamic changes in the medial temporal lobe during incidental learning of object-location associations. Cereb Cortex. 2012;22:828–837. doi: 10.1093/cercor/bhr151. [DOI] [PMC free article] [PubMed] [Google Scholar]
- McClelland JL, McNaughton BL, O'Reilly RC. Why there are complementary learning systems in the hippocampus and neocortex: insights from the successes and failures of connectionist models of learning and memory. Psychol Rev. 1995;102:419–457. doi: 10.1037/0033-295X.102.3.419. [DOI] [PubMed] [Google Scholar]
- McGaugh JL. Memory—a century of consolidation. Science. 2000;287:248–251. doi: 10.1126/science.287.5451.248. [DOI] [PubMed] [Google Scholar]
- Morris CD, Bransford JD, Franks JJ. Levels of processing versus transfer appropriate processing. J Verb Learn Verb Behav. 1977;16:519–533. doi: 10.1016/S0022-5371(77)80016-9. [DOI] [Google Scholar]
- Muller GE, Pilzecker A. Experimentelle Beitrage zur Lehre von Gedachtnis. Zeitschrift für Psychologie. 1900;1:1–300. [Google Scholar]
- Peigneux P, Orban P, Balteau E, Degueldre C, Luxen A, Laureys S, Maquet P. Offline persistence of memory-related cerebral activity during active wakefulness. PLoS Biol. 2006;4:e100. doi: 10.1371/journal.pbio.0040100. [DOI] [PMC free article] [PubMed] [Google Scholar]
- Polyn SM, Natu VS, Cohen JD, Norman KA. Category-specific cortical activity precedes retrieval during memory search. Science. 2005;310:1963–1966. doi: 10.1126/science.1117645. [DOI] [PubMed] [Google Scholar]
- Rasch B, Büchel C, Gais S, Born J. Odor cues during slow-wave sleep prompt declarative memory consolidation. Science. 2007;315:1426–1429. doi: 10.1126/science.1138581. [DOI] [PubMed] [Google Scholar]
- Rechtschaffen A, Kales A University of California LABIS, NINDB Neurological Information Network. A manual of standardized terminology, techniques and scoring system for sleep stages of human subjects. Bethesda, MD: United States Department of Health, Education, and Welfare; 1968. [Google Scholar]
- Redish AD, Battaglia FP, Chawla MK, Ekstrom AD, Gerrard JL, Lipa P, Rosenzweig ES, Worley PF, Guzowski JF, McNaughton BL, Barnes CA. Independence of firing correlates of anatomically proximate hippocampal pyramidal cells. J Neurosci. 2001;21:RC134. doi: 10.1523/JNEUROSCI.21-05-j0004.2001. [DOI] [PMC free article] [PubMed] [Google Scholar]
- Rudoy JD, Voss JL, Westerberg CE, Paller KA. Strengthening individual memories by reactivating them during sleep. Science. 2009;326:1079. doi: 10.1126/science.1179013. [DOI] [PMC free article] [PubMed] [Google Scholar]
- Skaggs WE, McNaughton BL. Replay of neuronal firing sequences in rat hippocampus during sleep following spatial experience. Science. 1996;271:1870–1873. doi: 10.1126/science.271.5257.1870. [DOI] [PubMed] [Google Scholar]
- Smith SM, Jenkinson M, Woolrich MW, Beckmann CF, Behrens TE, Johansen-Berg H, Bannister PR, De Luca M, Drobnjak I, Flitney DE, Niazy RK, Saunders J, Vickers J, Zhang Y, De Stefano N, Brady JM, Matthews PM. Advances in functional and structural MR image analysis and implementation as FSL. Neuroimage. 2004;23:S208–S219. doi: 10.1016/j.neuroimage.2004.07.051. [DOI] [PubMed] [Google Scholar]
- Squire LR. Memory and the hippocampus: a synthesis from findings with rats, monkeys, and humans. Psychol Rev. 1992;99:195–231. doi: 10.1037/0033-295X.99.2.195. [DOI] [PubMed] [Google Scholar]
- Staresina BP, Davachi L. Mind the gap: binding experiences across space and time in the human hippocampus. Neuron. 2009;63:267–276. doi: 10.1016/j.neuron.2009.06.024. [DOI] [PMC free article] [PubMed] [Google Scholar]
- Staresina BP, Davachi L. Object unitization and associative memory formation are supported by distinct brain regions. J Neurosci. 2010;30:9890–9897. doi: 10.1523/JNEUROSCI.0826-10.2010. [DOI] [PMC free article] [PubMed] [Google Scholar]
- Stein BS. Depth of processing reexamined: The effects of the precision of encoding and test appropriateness. J Verb Learn Verb Behav. 1978;17:165–174. doi: 10.1016/S0022-5371(78)90128-7. [DOI] [Google Scholar]
- Takashima A, Petersson KM, Rutters F, Tendolkar I, Jensen O, Zwarts MJ, McNaughton BL, Fernández G. Declarative memory consolidation in humans: a prospective functional magnetic resonance imaging study. Proc Natl Acad Sci U S A. 2006;103:756–761. doi: 10.1073/pnas.0507774103. [DOI] [PMC free article] [PubMed] [Google Scholar]
- Takeuchi D, Hirabayashi T, Tamura K, Miyashita Y. Reversal of interlaminar signal between sensory and memory processing in monkey temporal cortex. Science. 2011;331:1443–1447. doi: 10.1126/science.1199967. [DOI] [PubMed] [Google Scholar]
- Tambini A, Ketz N, Davachi L. Enhanced brain correlations during rest are related to memory for recent experiences. Neuron. 2010;65:280–290. doi: 10.1016/j.neuron.2010.01.001. [DOI] [PMC free article] [PubMed] [Google Scholar]
- van Dongen E, Takashima A, Barth M, Fernández G. Functional connectivity during light sleep is correlated with memory performance for face-location associations. Neuroimage. 2011;57:262–270. doi: 10.1016/j.neuroimage.2011.04.019. [DOI] [PubMed] [Google Scholar]
- Woolrich MW, Jbabdi S, Patenaude B, Chappell M, Makni S, Behrens T, Beckmann C, Jenkinson M, Smith SM. Bayesian analysis of neuroimaging data in FSL. Neuroimage. 2009;45:S173–S186. doi: 10.1016/j.neuroimage.2008.10.055. [DOI] [PubMed] [Google Scholar]