

Abstract
Auditory neuropathy is a form of hearing loss in which cochlear inner hair cells fail to correctly encode or transmit acoustic information to the brain. Few genes have been implicated in the adult-onset form of this disease. Here we show that mice lacking the transcription factor Foxo3 have adult onset hearing loss with the hallmark characteristics of auditory neuropathy, namely, elevated auditory thresholds combined with normal outer hair cell function. Using histological techniques, we demonstrate that Foxo3-dependent hearing loss is not due to a loss of cochlear hair cells or spiral ganglion neurons, both of which normally express Foxo3. Moreover, Foxo3-knock-out (KO) inner hair cells do not display reductions in numbers of synapses. Instead, we find that there are subtle structural changes in and surrounding inner hair cells. Confocal microscopy in conjunction with 3D modeling and quantitative analysis show that synaptic localization is altered in Foxo3-KO mice and Myo7a immunoreactivity is reduced. TEM demonstrates apparent afferent degeneration. Strikingly, acoustic stimulation promotes Foxo3 nuclear localization in vivo, implying a connection between cochlear activity and synaptic function maintenance. Together, these findings support a new role for the canonical damage response factor Foxo3 in contributing to the maintenance of auditory synaptic transmission.
Introduction
Normal sound perception requires that cochlear mechanosensory inner hair cells signal to spiral ganglion neurons through ribbon synapses. Individual inner hair cells are stimulated by specific sound frequencies and, in rodents, up to 20 spiral ganglion neurons innervate each inner hair cell. Acoustic signals with different amplitudes are resolved through graded synaptic transmission. Acting in precise concert, neurons with different activation thresholds signaling together enable sound resolution in noise (Safieddine et al., 2012).
Approximately 1% of adults have hearing loss from impaired cochlear synaptic transmission, a condition termed auditory neuropathy (Starr et al., 1996; Berlin et al., 2010). In the clinical setting, the hallmarks of auditory neuropathy are elevated hearing thresholds without a parallel loss of otoacoustic emissions, indicating normal outer hair cell (OHC) function. In addition to simple hearing deficits, such patients have difficulties distinguishing speech in surrounding noise. They cannot be treated with hearing aids because the neuropathic cochlea cannot coherently transmit acoustic signals no matter how loud they are (Manchaiah et al., 2011).
A few mutations responsible for congenital auditory neuropathy have been identified (Dror and Avraham, 2010; Santarelli, 2010). The two best studied genes, otoferlin/DFNB9 and vesicular glutamate transporter-3/DFNA25, are necessary for ribbon function (Yasunaga et al., 1999; Seal et al., 2008). Demyelinating syndromes such as Charcot-Marie Tooth also cause auditory neuropathy, as does spiral ganglion loss (Kovach et al., 1999; Bao et al., 2005; Lang et al., 2006). Little is known about the genetics of adult onset auditory neuropathy.
Here we have investigated the role of Foxo3 (Brunet et al., 1999) in adult hearing. Foxo3 is a forkhead box O transcription factor that regulates the expression of stress response proteins. Foxo3 effectors may ameliorate oxidative stress, block mitosis, induce apoptosis, or promote inflammation (Greer and Brunet, 2008; Maiese et al., 2009). Foxo3 regulates the oxidative damage response in the lung to cigarette smoke (Hwang et al., 2011; Yao et al., 2012) and in the heart to myocardial infarction (Sengupta et al., 2011). Foxo3 can also be activated by mechanical stress (Kim et al., 2007). Importantly, Foxo3 integrates the neuronal stress response during excitotoxic ischemia, driving either cellular repair or apoptosis depending on the degree of insult (Davila et al., 2012).
These studies are consistent with a general role for Foxo3 in coordinating cellular responses to damage. In mammals, cochlear hair cells and their associated neurons display little regeneration (Chardin and Romand, 1995). Therefore, their ability to manage basal stress levels is crucial for delaying sensory loss with age. However, whether or how Foxo3 might function in hearing has not been described. Here we used auditory tests on adult Foxo3-knock-out (KO) mice and found that they developed high-frequency hearing loss with the hallmarks of auditory neuropathy. Although Foxo3-KO mice had normal numbers of inner hair cells, neurons, and ribbon synapses, mutant inner hair cells had alterations in synaptic architecture. We conclude that the Foxo3 contributes to the maintenance of cochlear synaptic transmission and to hearing in adult mice.
Materials and Methods
Animal usage.
All experiments were performed in compliance with the Department of Health and Human Services and were reviewed by the University Committee on Animal Resources. Heterozygous/homozygous Foxo3 (Foxo3+/2) mice (FVB;129S6-Foxo3atm1.1Rdp) were obtained from the Mutant Mouse Regional Resource Center, University of California–Davis (stock #016132-UCD; Hwang et al., 2011). Mice were maintained on a mixed FVBn/129Sv background as described previously (Castrillon et al., 2003). Both knock-out and wild-type mice were derived from heterozygous mouse matings. Both male and female adult mice were used in this study.
For genotyping, DNA was obtained from 2 mm tail samples that were digested overnight in Proteinase K (IBI Sciences) solution at 65°, followed by phenol/chloroform extraction. IProof Taq (Bio-Rad) was used in conjunction with protocol and primer sequences described previously (Castrillon et al., 2003).
Sound exposure.
Three 4-month-old wild-type mice were exposed to noise limited to the 8–16 kHz octave band at 75 decibels for 15 min. Mice were each placed into individual triangular wire mesh cages, 12 cm × 5 cm × 5 cm, in an asymmetric plywood box with a JBL2250HJ compression speaker and JBL2382A bi-radial horn mounted on the top. This apparatus was contained within a sound booth. The speaker was driven by a TDT RX6 multifunction processor and dedicated attenuator and controlled with TDT RPvdsEx sound-processing software. Five hours after sound exposure, the mice were euthanized and their cochleae collected.
Auditory testing.
Auditory testing was conducted using a Smart EP Universal Smart Box (Intelligent Hearing Systems). Eight Foxo3-KO and 8 wild-type mice were tested at both 2 months and 4 months of age. Mice were anesthetized with an intraperitoneal injection of ketamine (80 mg/kg) in a sterile acepromazine/saline mixture (3 mg/kg). A 10B+ (high-frequency transducer/stimulator) probe was placed at the opening to the external auditory meatus.
Auditory brainstem response (ABR) stimuli were 5 ms clicks or 5 ms tone pips presented at 5 frequencies between 8 and 32 kHz. Stimuli began at 75 dB amplitude and decreased by 5 dB steps to 15–25 dB. A total of 512 sweeps were averaged for each frequency and amplitude. Electrical responses were measured with three subdermal needle electrodes (Grass): one inserted beneath each pinna and a third, the ground electrode, placed at the vertex. ABR thresholds for a particular frequency were determined by the last visible trace in which waves one and two were seen for each stimulus (in decibels). Wave amplitudes and latencies were determined using IHS Software computing capabilities.
For distortion product evoked otoacoustic emissions (DP-OAEs), we measured the amplitude of evoked otoacoustic emissions to paired pure tones of frequencies f1 and f2, where f1/f2 = 1.2 and the f1 level was 10 dB above f2. Thirty-two sweeps were made in 5 dB steps starting with f1 at 65 dB and ending at 40 dB.
Quantitative PCR.
Dissected cochleae from postnatal day 2 (P2), P14, P60, and P120 wild-type mice were fixed in methacarn (60% methanol, 30% chloroform, 10% acetic acid) for 1 h at room temperature. The fixed tissue was subsequently placed in chilled 100% molecular biology grade ethanol overnight at 4°C. The tissue was postdissected in ethanol, flash frozen in liquid nitrogen, and stored at −80°C. The frozen tissue was crushed with a mortar and pestle in liquid nitrogen, dissolved in RLT buffer, and then extracted following the protocol for the RNeasy Mini Kit (Qiagen). Three or 4 biological samples were obtained from each stage. cDNA was synthesized from these mRNA preparations using qScript (Quanta Biosciences). cDNA levels for Foxo3 and β-actin were measured on a real-time iCycler (Bio-Rad) using PerfeCTa SYBR green (Quanta Biosciences). QPCR primers sequences were as follows: Foxo3, AGCCGTGTACTGTGGAGCTT and TCTTGGCGGTATATGGGAAG; β-actin, AGCCATGTACGTAGCCATCC and CTCTCAGCTGTGGTGGTGAA.
Tissue preparation for immunostaining.
Cochlear organs were dissected out of the animal, their stapes removed, and a hole was made in their apical tips to allow for adequate fluid exchange. Tissues were immersed in 4% paraformaldehyde in PBS for 1–2 h (for anti-Foxo3 staining) or at least overnight (for other antibodies). Tissues were decalcified in 0.1 m EDTA at 4°C on a rotating platform for 4 d. For cryosectioning, tissues were immersed in 30% sucrose in PBS overnight, embedded in optimal cutting temperature medium, and frozen in liquid nitrogen. For neuron quantification, the specific cochlear regions corresponding to 25–40 kHz were dissected out, embedded, and cryosectioned transversely to obtain 20 μm sections of spiral ganglion neurons in the area of interest. For hair cell counts and synapse analysis, whole-mount preparations were microdissected into turns as described previously (Liberman, 2009), and the 8–16 kHz and 24–40 kHz sections were isolated and immunostained for analysis.
Antibodies.
The following primary antibodies were used: 2 rabbit anti-Foxo3 (1:1000, Cell Signaling Technology; 1:1000, Santa Cruz Biotechnology), mouse anti-tubulin β III isoform C terminus, clone TUJ1 (1:500; Millipore), mouse anti-β-actin antibody (Pierce), goat anti-oncomodulin antibody (Santa Cruz Biotechnology), mouse anti-parvalbumin antibody (Millipore), rabbit anti-Myosin7a (1:200; Santa Cruz Biotechnology), mouse anti-Ctbp2 (1:200; BD Transduction Laboratories), and mouse anti-Gria2 (aka GluR2/GluA2; 1:2000; Millipore). The following secondary antibodies, all purchased from Jackson Laboratories, were used: donkey anti-mouse 488 (1:500), donkey anti-rabbit 594 (1:500), donkey anti-rabbit 647 (1:200), donkey anti-goat 488 (1:200), Alexa Fluor 594 goat anti-mouse (IgG1, 1:500), Alexa Fluor 488 goat anti-mouse (IgG2a, 1:500), goat anti-mouse HRP (1:1000), and goat anti-rabbit HRP (1:1000). DAPI was purchased from Fisher Scientific.
Western analysis.
Six cochleae, freshly dissected from 3 2-month-old wild-type mice, were dropped into liquid nitrogen, crushed with a mortar and pestle, extracted in 500 μl of RIPA buffer containing Halt proteinase and phosphatase inhibitors (Pierce), sonicated, and stored at −80°C. Extracts were boiled with Laemmli buffer, subjected to PAGE (Mini-Protean TGX Systems; Bio-Rad), transferred to a nitrocellulose membrane, probed with anti-Foxo3 antibody (1:1000) or anti-β-actin antibody (1:1000), and finally incubated with HRP-conjugated secondaries. Signal was revealed with chemiluminescence (Pierce) and x-ray film (Kodak). The four lanes shown in Figure 1D were duplicate samples or molecular weight (MW) markers in kilodaltons (kD) run on a single gel and transferred together to a blot. The blot was cut into two pieces, probed separately with anti-Foxo3 or anti-β-actin (β-act) antibody, and exposed on one film.
Figure 1.

Foxo3 is expressed in the adult mouse cochlea. A, Drawing of a cross-section of the adult organ of Corti. Type I spiral ganglion neurons resident in Rosenthal's canal (green) project to the mechanosensory single IHC (pink). Three OHCs (pink) are also seen. Supporting cells (gray) surround the hair cells. B, Surface view and cross-section of organ of Corti whole mount. Interphalangeal supporting cells (IP) are medial (left) to the IHCs. The apical tops of pillar cells form a line between inner and OHCs. Hensen supporting cells (Hen) are lateral (right) to the OHCs. C, Q-PCR for Foxo3 in cochlear extracts at different stages of postnatal development as indicated. Each time point is an average of 3–4 organ preparations, with error bars indicating SEM. D, Western blotting with an anti-Foxo3 antibody (first lane), compared with MW markers (second lane), with kDa values indicated (numbers), on a cochlear extract from 2-month-old mice (1/8 cochlea equivalents loaded). The Foxo3 antibody detected a band at 74 kD (arrow). Anti-β-act was used as a positive control (third lane) on a duplicate protein sample from the same gel (MW, fourth lane). E–G, Cryosections of 2-month-old spiral ganglion neurons stained with anti-acetylated tubulin (“TuJ1,” E, G, green) and anti-Foxo3 (F, G, red) antibodies. H, Whole-mount preparation of the 30 kHz region of a 2-month-old cochlea stained with anti-parvalbumin (white, IHCs), anti-oncomodulin (green, OHCs), and DAPI (blue, all nuclei). I, Same view as H stained with anti-Foxo3 antibody (red). Anti-Foxo3 labels hair cells and pillar cells. J, Colocalization of H with I; both hair cell markers are rendered in green and anti-Foxo3 staining is in red. DAPI is omitted in this view. K–P, Identical staining and preparation as in E–J using 4-month old cochlear tissue. Note how Foxo3 immunoreactivity in older spiral ganglion neurons (L, M) is excluded from the nucleus. Q–V, Identical staining and preparation as in K–P using cochlear tissue from a 4-month-old mouse exposed to 15 min of 75 dB filtered noise 5 h before being euthanized. R, S, Foxo3 immunoreactivity detected in the nucleus. Inset shows side views of a Foxo3+ neuron from confocal microscopy stacks. Scale bars: Q, 20 μm; T, 10 μm. W–BB, Enlarged view of hair cells from T–V, with hair cell markers (Pvalb, Ocm) rendered in green to better demonstrate anti-Foxo3 localization. DAPI is included in this view (blue).
Immunostaining.
For anti-Foxo3 immunostaining, sections were washed in Tris-buffered saline (TBS), pH 7.4, and then boiled in 10 mm citric acid pH 6 for 15 min at 20% power in the microwave. For anti-Foxo3 and anti-TuJ1, blocking was performed at room temperature for 2 h in 0.5% Tween and 5% donkey serum (Jackson ImmunoResearch) in TBS. Antibody incubations were performed overnight at 4° in block solution. For whole-mount staining, dissected 24–40 kHz and 8–16 kHz turns were immersed in 30% sucrose, flash frozen in liquid nitrogen, allowed to thaw, washed in room temperature Dulbecco's PBS (Invitrogen), and blocked for 1 h in 1% Triton X-100 and 5% donkey serum in PBS. Primary antibody incubations of anti-Myosin7, anti-Ctbp2, and anti-Gria2 were performed at 37° for 20 h, the tissue was washed in PBS, and secondary antibody incubation was performed at 37° for an additional 2 h. This whole-mount protocol was kindly provided by Leslie Liberman. All tissue was mounted using Fluoromount-G (Southern Biotech). Whole mounts were placed between two 50 mm coverslips.
Confocal microscopy and image processing for figures.
All imaging was done on an Olympus FV1000 laser scanning confocal microscope. ImageJ version 64 software was used to Z-project maximal brightness in confocal stacks. ImageJ was also used to quantify the area of Rosenthal's canal in transverse images of the spiral ganglia. Photoshop (Adobe) was used to set maximal and background levels of projections for the construction of figures. Composite images for hair cell quantification were assembled in Photoshop by pasting each optical section into its own layer and merging the pieces of the optical sections where hair cells were evident. Hair cells within a contiguous 300–500 μm lengths of cochlea from the 32 kHz turn were counted on these composites.
Visual quantification of synaptic structures was performed to determine the number of unpaired Ctbp2+ ribbons and Gria2+ receptor patches. Confocal stacks from either 100× (15–17 inner hair cells [IHCs]) or 200× (5–7 IHCs) were projected in ImageJ64 and counted. Up to three stacks per organ were quantified. No differences were observed in counts obtained from 100× or 200× stacks.
3D reconstructions of synaptic components and statistical analyses.
To assess synaptic number and distribution quantitatively, we used immunofluorescence and confocal microscopy in conjunction with 3D modeling. Visual inspection of confocal projections was used to quantify orphan synaptic components, whereas modeling was used to identify paired synapses for assessment of size and distribution. Anti-Ctbp2 labeled inner hair cell nuclei and presynaptic ribbon structures (Schmitz et al., 2000) and anti-Gria2 (also called GluR2/GluA2) were specific for the postsynaptic AMPA receptor (Usami et al., 1995). Anti-Myo7a antibody labeled inner hair cells (Hasson et al., 1995). We imported the confocal data into commercial image analysis software (Amira; Visualization Sciences Group) to generate 3D reconstructions. Individual inner hair cells were digitally isolated from their neighbors to better display their cytoskeletal architecture and synaptic localization.
Ctbp2+, Gria2+, and Myo7a+ staining volumes and their positions within the confocal stacks were identified computationally from Amira output files. Confocal data files (.oib) of Gria2+ (green) Ctbp2+ (red) and Myosin7+ (blue) stained inner hair cells imaged at 200× on the FV1000 were opened in Amira. The inner hair cell region was cropped. A Myo7a isosurface was created from the data, appropriately thresholded, and exported. The Ctbp2 and Gria2 datasets were processed similarly except that the isosurface was generated from the connected components region function. Nuclear Ctbp2 staining was digitally removed to avoid confounding the rest of the analysis. Methods using Amira were taught to us by members of the Liberman laboratory. All exported volumes were checked to ensure that volumes were within instrument resolution limits after threshold adjustments. Output files for all confocal sets consisted of .csv files containing (x, y, z) centroid coordinates and volume measurements for each indexed Ctbp2+ (red) and Gria2+ (green) voxel domain. Wire diagrams for Myo7a+ (blue) staining were also obtained from the isosurface (.wrl) file. These datasets were then processed with scripts written in Mathematica.
To pair presynaptic ribbons to postsynaptic structures, the actual distance between each potential synaptic domain pair was computed via a comparison of the xyz-space coordinates corresponding to each component. A distance matrix (D) was constructed by determination of the Euclidean norm (NDij) between pairing object indices k and l, respectively, for the Ctbp2 and Gria2 domains as follows:
 |
through the outer product using the spatial elements for a given domain. These domains, Rxyz or Gxyz for Ctbp2 and Gria2, respectively, where,
 |
with
 |
and element indices i and j. The radius (rv) of each voxel domain from the indexed Ctbp2 and Gria2 pairing lists was computed using a spherical approximation. The outer product sum of the resulting radii lists,
 |
resulted in a radius matrix A,
 |
indexed to each element as in D. A constraint setting was implemented for each radius element, but was set to unity for all calculations shown.
A comparison can then be made between the actual distance between Ctbp2 domains and Gria2 patch domains and their inferred pairing radius by taking the difference between D and A. For each case in which the summed radius, Rv,i + Rv,j, is larger than the distance separating domains, the Ctbp2- and Gria2-positive elements were termed as paired. Paired elements corresponding to pairing incidence >1 indicate synapse domains too small to be effectively resolved using confocal imaging techniques. Ribbon domains with pairing incidence >2 were deleted using paired ribbon indices as keys. Volumes of paired Ctbp2 doublets, ribbons associated with two Gria2 patches, were then divided equally between Ctbp2 voxel domains with Gria2 patch volumes left unadjusted. The coordinates for ribbon doublet pairing instances were also reassigned to the positions of each associated Gria2 patch using the ribbon index key. This was done to best approximate the position of each ribbon as a single-paired element with a unique associated Gria2 patch. Only data for paired structures is presented and the same analysis was followed for 32 and 16 kHz cochlear region data.
To obtain positional information for paired ribbon synapses, Myo7a+ staining was rotated to align inner hair cells to be perpendicular to the basilar membrane. Rotation was accomplished by solving for the rotation matrix as follows:
 |
which is required to invoke the needed transformation. This transform was also applied to the coordinates for each paired ribbon.
A fifth-degree polynomial was used to approximate a fit to the bottom surface of the Myo7a+ staining. To determine positional information about paired ribbon synapses, the difference along the z-axis between each paired ribbon voxel centroid and the best-fit surface was calculated. We found that lower-order polynomials did not rise with the basal surfaces when the inner hair cells were arrayed at an angle during confocal imaging (see Fig. 9). Higher-order polynomials tracked the basal surface more precisely, but created errors at hair cell interstices. Such artifacts interfered with difference value computation because they no longer represented the basal surface, therefore necessitating a more relaxed fitting condition. All statistical tests were performed in R64 using standard functions.
Figure 9.
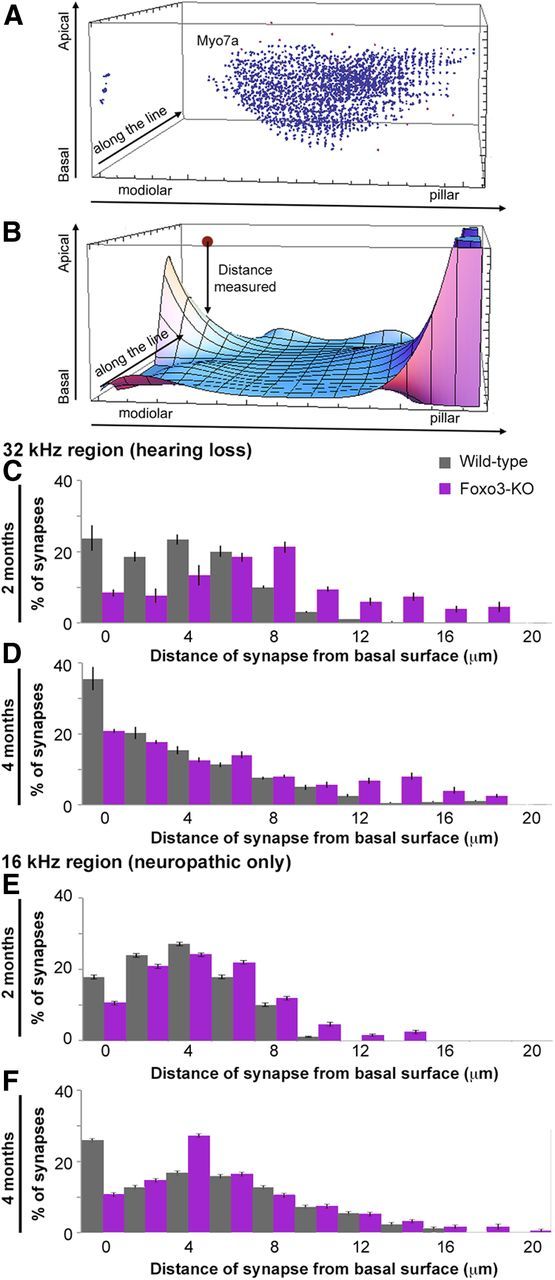
Differential distribution of synaptic components along the long axis of the IHC. A, Screen shot from rendering made in Mathematica of blue Myo7a+ voxels in the base of an IHC after the data were transformed to rotate the long axis of Myo7a staining to align to the y-axis in this volume. B, Screen shot of surface model for the base of the IHC layers. z-axis data plotted in Figure 9, C–F, were derived as the distance in micrometers between this surface and the centroids of paired ribbons (“distance measured,” see text). C, Histogram documenting distance in micrometers from the modeled basal surface layer for 317 wild-type (gray) and 331 Foxo3-KO (purple) synaptic pairs, all from the 32 kHz turn of 2-month-old animals. D, Similar histogram for data from the 32 kHz turn of 4-month-old animals using 422 wild-type (gray) and 345 Foxo3-KO (purple) synaptic pairs. E, Similar histogram for data from the 16 kHz turn of 2-month-old animals using 322 wild-type (gray) and 354 Foxo3-KO (purple) synaptic pairs. F, Similar histogram for data from the 16 kHz turn of 4-month-old animals using 349 wild-type (gray) and 424 Foxo3-KO (purple) synaptic pairs.
Calculations of synaptic distribution on the pillar-modiolar axis and population density analysis.
To analyze the distribution of synapses along the pillar-modiolar axis, we first rotated the datasets into a cross-sectional orientation. Synaptic pairs were projected onto a quadrant grid representing the pillar-modiolar axis (x-axis) and basal-apical axis (y-axis). The midpoints of both axes for each tissue sample were aligned to normalize these positions with the other data stacks of the same age, genotype, and region before analysis. A t-distribution-based expectation-maximization algorithm (Lo et al., 2008; Lo et al., 2009) was then implemented to fit each dataset to a potential population cluster model. The population clusters were chosen using the implemented Bayesian information criterion and were constrained to the 90% quantile with two possible population clusters for each dataset. The rationale for determining the populations based on only two possible population clusters was to map the positions of the ensemble modiolar and pillar synaptic component subpopulations within each region of the cochlea and to prevent oversampling of distributions. This allows for comparison of the confocal data with the established model observed by Liberman (Liberman, 1980).
Transmission electron microscopy.
Cochleae were rapidly dissected out of the cranial bone one animal at a time to minimize the amount of time between death and fixation (typically 90 s). Then, 400 μl of fixative containing 4% paraformaldehyde and 2% glutaraldehyde in 0.1 m sodium cacodylate buffer was gently pushed through the open oval window through the hole made in the apical tip. Tissues were postfixed at 4°C on a rotating platform overnight, rinsed 3 times with distilled water, decalcified in 10% EDTA in 100 mm Tris, pH 7.4, for 3 d, and then rinsed again. Cochlear segments corresponding to the 32 kHz region were carefully dissected and stored in fixative. The tissue was then postfixed in 1.0% osmium tetroxide to preserve lipid and lipoprotein structures and then processed through a graded series of alcohols, infiltrated in Spurr epoxy resin, and embedded. The resin-embedded tissue was then polymerized at 70°C overnight. Semi-thin (1.0–2.0 μm) sections were cut with a glass knife to select an appropriate area for subsequent ultrathin 70 nm sectioning with a diamond knife. Sections were placed on grids and stained with uranyl acetate and lead citrate. A Hitachi 7650 with EDS (IF Instruments) was used to examine and photograph sections.
Results
To determine whether the sensory cells of the mouse cochlea expressed Foxo3, we performed quantitative PCR, Western analysis, and immunofluorescence. Cochleae have one row of inner hair cells and three rows of OHCs, as can be seen in cross-section (Fig. 1A, pink). The OHCs amplify acoustic energy. The inner hair cell detects these vibrations and then relays the information via glutamatergic ribbon synapses to innervating spiral ganglion neurons (Fig. 1A, green). When viewed from above, inner hair cells are flanked medially by interphalangeal cells and separated from OHCs by pillar cells. Hensen's supporting cells are lateral to OHCs (Fig. 1B). Mouse whole cochlear extracts expressed significant amounts of Foxo3 mRNA, relative to β-actin, from birth through adulthood (Fig. 1C). A commercial antibody to Foxo3 detected a 74 kD protein (Biggs et al., 2001) in extracts from 2-month-old wild-type cochleae when analyzed by Western blot (Fig. 1D, arrow). The specificity of the anti-Foxo3 antibody was tested by the manufacturer and was not assessed independently for this study.
We examined cell-specific protein expression with the same antibody. In sections of 2-month-old mouse cochlea (Fig. 1E–G), spiral ganglion neurons (Fig. 1E,G, green) expressed Foxo3 protein (Fig. 1F,G, red). Overlaid images demonstrated colocalization (Fig. 1G). Cochlear inner hair cells, seen in whole mount, were revealed with an antibody to parvalbumin (Fig. 1H, white) and OHCs with anti-oncomodulin (Fig. 1H, green). Hair cells also expressed Foxo3 protein (Fig. 1I, red), as did the intervening pillar cells (cf. Fig. 1I,B). Colocalization was evident when the images were overlaid (Fig. 1J). In these preparations, anti-Foxo3 staining appears diffusely spread throughout the cytoplasm and in the nucleus, with occasional punctate appearance. Previous studies with other tissues had similar results (Cai and Xia, 2008).
We performed the same analysis on 4-month-old mouse cochlear preparations (Fig. 1K–P). Here the results were similar, with the exception that Foxo3 protein appeared excluded from the nucleus of 4-month-old spiral ganglion neurons (8.6 ± 3.4% with nuclear Foxo3, n = 3; Fig. 1K–M), although as in the younger stage, it filled the entire cell outline of inner and OHCs (cf. Fig. 1P,J). Because the 17–35 kHz cochlear turn was analyzed for both stages, it is unclear why Foxo3 localization might change in spiral ganglion neurons during adulthood. We concluded that Foxo3 immunoreactivity is present in the spiral ganglion neurons and sensory hair cells of the adult mouse cochlea.
Foxo3 nuclear localization can be induced by Ampk signaling (Davila et al., 2012) and by mechanical stress (Kim et al., 2007). We hypothesized that exposure to acoustic stimulus might promote Foxo3 nuclear import in older spiral ganglion neurons. We exposed 4-month-old mice to mild noise at 75 dB for 15 min. This degree of sound exposure is equivalent to a raised human voice and does not injure mouse hearing (Wang and Ren, 2012). In the cochlear hair cells of noise-treated mice, Foxo3 immunoreactivity was present in both the nucleus and cytoplasm, similar to controls (cf. Fig. 1T–BB,N–P). However, Foxo3 immunoreactivity was now detectable in the nuclei of spiral ganglion neurons (95% ± 3.6% with nuclear Foxo3, n = 2; Fig. 1Q–S, inset). These data suggest that acoustic stimulation can promote nuclear localization of Foxo3 protein in adult spiral ganglion neurons.
To determine whether Foxo3 function is necessary for hearing, we obtained Foxo3-KO mice. Foxo3-KO mice are on a mixed FVBn/129SV background (Castrillon et al., 2003), and both background strains have normal hearing through the first 6 months (Zheng et al., 1999). We tested 8 Foxo3-KO mice and 8 of their wild-type littermates at 2 months of age, when mice reach sexual maturity. We measured their ABR to pure tones of different frequencies, which determines the thresholds at which auditory nerve responses are detectable (Fig. 2A, circles). Overall, the thresholds between the two genotypes were not statistically different (p-value for genotypes: 0.47, 2-way ANOVA). We concluded that Foxo3 is not necessary for the development of normal hearing thresholds before adulthood.
Figure 2.

Age-dependent mild high-frequency hearing loss is observed in the Foxo3-KO mouse despite the presence of cochlear amplifier activity. A, Average ABR hearing thresholds for pure tone stimuli at 5 frequencies for 8 mice of each genotype at 2 months (circles) and 4 months (crosses). Results from wild-type mice are in black and Foxo3-KO mice in purple. B, Distortion product amplitudes for the same five frequencies performed at the same time as ABR. Results for amplitudes L1/L2 = 65 dB/55 dB are shown. NF, Noise floor. Results from wild-type mice are in black and Foxo3-KO mice in purple. C–E, DP amplitudes for 4-month-old animals plotted as a function of L2 amplitudes for 16 kHz (C), 24 kHz (D), and 32 kHz (E). Black circles, wild-type; purple X's, Foxo3-KO. NF, Noise floor. All error bars represent SEM.
We retested the hearing of the same 16 mice at 4 months of age. Foxo3-KO animals displayed a mild high-frequency hearing loss compared with the same wild-type littermates (p-value for genotypes: 6.7 × 10⁻⁶, 2-way ANOVA; Fig. 2A, cf. crosses). Between genotypes, the average thresholds at 8, 12, and 16 kHz were not different (Bonferroni adjusted p-values: 0.61, 0.75, and 0.076, respectively). At 24 kHz, Foxo3-KO auditory thresholds were elevated 17.8 ± 5.7 dB (Bonferroni adjusted p-value: 0.0094), and at 32 kHz, thresholds were elevated 26.4 ± 2.9 dB (Bonferroni adjusted p-value: 1.4 × 10⁻⁵). We concluded that the loss of Foxo3 activity contributes to premature high-frequency hearing loss in mice.
In mammals, OHCs amplify acoustic signals and therefore are thought to account for a substantial portion of auditory sensitivity (Ryan and Dallos, 1975). OHC function can be assessed by measuring DP-OAEs (Martin et al., 2006). In genetic models in which OHC loss underlies changes in hearing thresholds, linear reductions in ABR threshold correlate with linear reductions of DP-OAE amplitudes made in response to saturating stimuli (Avan et al., 2003). We measured DP-OAEs from the same mice as ABRs in the same sessions (Fig. 2B–E). The 8 Foxo3-KO mice produced DP-OAEs that were similar to their 8 wild-type littermates at 2 months of age (p-value for genotypes: 0.097, 2-way ANOVA; Fig. 2B, cf. circles). When we assessed the same Foxo3-KO mice at 4 months of age, their DP-OAE amplitudes were unchanged (p-values for stages: 0.92, 2-way ANOVA; Fig. 2B, cf. purple markers). The DP-OAE amplitudes produced by 4-month-old wild-type mice, in contrast, had significantly increased at lower frequencies compared with the earlier stage (p-values for stages: 0.0084, 2-way ANOVA; Bonferroni adjusted p-values for 8, 12, 16, 24, and 32 kHz: 7 × 10⁻⁵, 0.0002, 3 × 10⁻⁶, 0.44, and 0.77, respectively; Fig. 2B, cf. black markers). When the two genotypes are compared, all differences were seen at the lower frequencies, where the two genotypes had similar auditory thresholds (Bonferroni adusted p-values for 8, 12, and 16 kHz: 0.00012, 0.00041, and 0.0011, respectively). DP-OAE amplitudes for Foxo3-KO were similar to those of wild-type mice at 24 and 32 kHz (Bonferroni adjusted p-values: 0.056 and 0.32, respectively). These data suggest that high-frequency hearing loss observed in Foxo3-KO mice were probably not due to an OHC dysfunction that develops during adulthood.
To determine whether the high-frequency OHC activity in the Foxo3-KO was identical to that of the wild-type at this stage, we examined the fine structure of the OAE by plotting input (L2) amplitudes against DP output amplitudes for 16 kHz (Fig. 2C), 24 kHz (Fig. 2D), and 32 kHz (Fig. 2E) for all 16 animals at 4 months (Abdala and Visser-Dumont, 2001). For each frequency, Foxo3-KO DP amplitudes in response to subsaturating stimuli were significantly reduced (p-value for genotypes at 16, 24, and 32 kHz: 2.0 × 10⁻¹⁶, 2.2 × 10⁻¹⁶, and 1.1 × 10⁻⁸, respectively, 2-way ANOVA; Fig. 2C–E). These data suggest subtle differences in cochlear amplifier function. Nonetheless, the near absence of hearing thresholds at 32 kHz (Fig. 2A) combined with robust OHC responses at the same frequency (Fig. 2B,E) suggested auditory neuropathy (Starr et al., 1996).
To verify the presence of auditory neuropathy in Foxo3-KO mice, we compared the characteristics of the ABR waveform of both genotypes (Fig. 3). We examined waveforms produced in response to two different kinds of stimuli: a suprathreshold click stimulus (75 dB; Fig. 3A–F), which activates the majority of the mouse cochlea, and 16 kHz pure tones of various amplitudes (Fig. 3G–H). We chose 16 kHz for the second analysis because the wild-type and Foxo3-KO animals have similar thresholds at 16 kHz (Fig. 2A), thus allowing a comparison throughout the dynamic range of amplitudes used.
Figure 3.

Age-dependent differences in ABR peak amplitudes between wild-type and Foxo3-KO mice. A, Average ABR traces obtained in response to a 75 dB click stimulus from 6 wild-type (black) and 8 Foxo3-KO (purple) animals aged 2 months. ABR peaks are labeled with Roman numerals. B, Average amplitudes in microvolts of peaks I–V from the traces presented in A. C, Average latencies in milliseconds of peaks I–V from the traces presented in A. D, Average ABR traces obtained in response to a 75 dB click stimulus from 8 wild-type (black) and 8 Foxo3-KO (purple) animals, aged 4 months. ABR peaks are labeled I–V. E, Average amplitudes in microvolts of peaks I–V from the traces presented in D. F, Average latencies in milliseconds of peaks I–V from the traces presented in D. G, Average peak I amplitudes in microvolts obtained in response to 16 kHz pure tone stimuli of increasing amplitudes from 8 wild-type (black circles) and 8 Foxo3-KO (purple X's) animals, aged 4 months. H, Average peak II amplitudes in microvolts obtained in response to 16 kHz pure tone stimuli of increasing amplitudes from 8 wild-type (black circles) and 8 Foxo3-KO (purple X's) animals, aged 4 months. All error bars represent SEM.
At 2 months of age, the average waveforms (6–8 animals) generated in response to the click stimulus were identical for both wild-type and Foxo3-KO mice (Fig. 3A). No differences were observed in peak voltage (n = 8 per genotype, p = 0.29, 2-way ANOVA; Fig. 3B) or peak latency (p = 0.33, 2-way ANOVA; Fig. 3C) between the genotypes. In contrast, significant differences in peak voltages were observed between the genotypes at 4 months of age (n = 8 per genotype, p = 2 × 10⁻¹⁶, 2-way ANOVA; Fig. 3D,E). In particular, the wild-types' ABR traces at 4 months had increases in peak I, IV, and V, and decreases in peak II, compared with the Foxo3-KO (Fig. 3E). The Foxo3-KOs' ABR traces, in contrast, had a reduced peak I (Fig. 3D, E). Curiously, these differences could be attributed to changes with age in the wild-type trace, which exhibits a classical waveform with a large peak I at 4 months, but not 2 months. At 4 months, the Foxo3-KO ABR is more similar to that obtained at the earlier stage (p = 0.026, 2-way ANOVA; Fig. 3A,D, cf. purple traces). Peak latencies remained unaltered at 4 months (p = 0.13, 2-way ANOVA; Fig. 3F).
Normal cochleae display a linear increase in peak I amplitudes in response to increasing stimulus amplitudes, whereas neuropathic cochleae do not (Maison et al., 2003). The highest frequency we found where thresholds were similar between the two genotypes was 16 kHz (Fig. 2A). We analyzed the data obtained at that frequency to determine whether peak I amplitudes in Foxo3-KO mice increased as a function of stimulus amplitudes. Peak I amplitudes in Foxo3-KO mice did not demonstrate the linearity observed in the wild-type (R2 = 0.69 vs KO R2 = 0.06, ordinary least squares [OLS]; Fig. 3G). Wild-type peak II amplitudes at 16 kHz increased with increasing stimuli amplitudes (R2 = 0.49, OLS; Fig. 3H, black). Surprisingly, Foxo3-KO peak II amplitudes increased significantly in correlation with stimuli (R2 = 0.40, OLS; Fig. 3H, purple) although the slope of the regression line was approximately half as steep as controls. These data show that in the Foxo3-KO mouse, even when the thresholds are normal, the capacity of the spiral ganglion to transmit information to the brain is compromised. Together, these data are consistent with the interpretation that the hearing loss observed in 4-month-old Foxo3-KO animals has the hallmarks of auditory neuropathy.
We also investigated the cause of high-frequency hearing loss in the Foxo3-KO mouse. First, we tested the hypothesis that Foxo3-dependent hearing loss at 32 kHz was due to inner hair cell loss, as in carboplatin toxicity (Takeno et al., 1994; Salvi et al., 2000). We quantified hair cells for both genotypes in the 32 kHz cochlear turn. Figure 4, A and B, show composite images from 4-month-old wild-type and Foxo3-KO animals, respectively, with hair cells revealed by anti-Myosin7 immunostaining. Foxo3-KO animals had similar numbers of inner and OHCs per 100 μm cochlear length in the same region (n = 3 per genotype; Fig. 4C). Hair cell loss was not the cause of hearing loss in the aging Foxo3-KO mouse.
Figure 4.

Hair cells, spiral ganglion neurons, and myelinating glial cells are present in the 4-month-old Foxo3-KO in the 32 kHz cochlear turn. A, B, Composite images of the 32 kHz cochlear turn from 4-month-old wild-type (A) or Foxo3-KO (B) mice stained with antibodies for Myo7a. Scale bar: 100 μm. C, Quantification of IHCs and OHCs per 100 μm in the 32 kHz turns from wild-type (WT, n = 3) and Foxo3-KO (KO, n = 3) whole-mount cochlear preparations. D, E, Single optical sections showing representative images of the spiral ganglion neurons in the 32 kHz turn for wild-type (D) and Foxo3-KO (E) 4-month-old mice. Anti-acetylated tubulin is shown in green and DAPI in blue. Scale bar: 20 μm. F, Quantification of neurons per unit area (100 μm squared) in Rosenthal's canal for 4-month-old wild-type and Foxo3-KO animals (n = 5 per genotype). G, H, Transmission electron micrographs of myelination of spiral ganglion neurite projections at the habenula perforata for 4-month-old wild-type (G) and Foxo3-KO (H) mice in the 32 kHz turn. Scale bar: 5 μm. I, Latency in milliseconds for peak II in the ABR traces obtained from 4-month-old animals in response to pure tones at 16 kHz, a frequency at which peak I amplitudes are affected in the Foxo3-KO mouse (Fig. 3G). Black circles: wild-type; purple X's: Foxo3-KO.
Next, we tested the hypothesis that neuronal loss in the 32 kHz turn was responsible for the high-frequency hearing loss in Foxo3-KO mice (Schmiedt et al., 2002; Lang et al., 2006). We quantified neuronal density in transverse sections stained with anti-acetylated β-tubulin (Fig. 4D–F). The density of neurons was not statistically different between the genotypes (n = 5 animals per genotype, p = 0.17, Student's 2-tailed t test; Fig. 4F). Therefore, neuronal loss was not the cause of hearing loss in Foxo3-KO mice.
We also tested the hypothesis that demyelination was responsible for high-frequency hearing loss in Foxo3-KO mice, because demyelinating diseases can cause auditory neuropathy (Cruse et al., 1977; Hallpike et al., 1980). We examined myelination with transmission electron microscopy (TEM) in the most distal portion of the spiral ganglion nerve root, just before its entry into the organ of Corti through the habenula perforata, in the 32 kHz turn (Fig. 4G,H). No differences were found between 4-month-old Foxo3-KO and their wild-type littermates. Demyelination would also alter the latencies of the ABR waveform waves because nonmyelinated nerves have slower impulse conduction. To explore this possibility, we plotted the peak II latencies for the 16 kHz suprathreshold tone data (Fig. 3H) and found no difference between Foxo3-KO and their wild-type littermates (Fig. 4I). Therefore, changes in myelination were not the cause of auditory neuropathy in Foxo3-KO mice.
As these common explanations for neuropathic hearing loss were ruled out, we investigated the ultrastructure of Foxo3-KO inner hair cells from the cochlear region with threshold shifts. Fifteen sections from seven mutant inner hair cells were imaged with TEM and compared with 8 sections from 5 wild-type mice (n = 2 animals per genotype). Figure 5 shows comparable representative images. Low-power images (Fig. 5A,D) show inner hair cells in yellow, afferent neurites adjacent to the inner hair cells in cyan, and putative efferent neurites, identified by the presence of presynaptic vesicles, in magenta. Afferent fibers surround the bases of both wild-type inner hair cells. A higher-resolution image of the indicated region of the basal pillar quadrant shows an afferent neurite (Fig. 5B, Aff). Note how supporting cells and neurites tightly appose the plasma membrane of the inner hair cell, which also has readily identifiable ribbon synapses (Fig. 5C, arrow).
Figure 5.

Ultrastructure of wild-type and Foxo3-KO IHCs. A, TEM image of 32 kHz IHCs from a 4-month-old wild-type cochlea. IHCs (yellow), afferent neurites (cyan), and putative efferent neurites (magenta) are indicated. Scale bar: 5 μm. B, Higher-magnification image of the indicated basal pillar quadrant (square) of the left IHC from A reveals an afferent neurite (Aff). Scale bar: 1 μm. C, Typical wild-type ribbon synapse with normal morphology (arrow). Scale bar: 200 nm (also applies to F–H). D, IHCs (32 kHz) from a 4-month-old Foxo3-KO cochlea are shown. Same color code as in A. Note the presence of stereocilia. Afferent neurites are largely absent from the base of the left IHC. Scale bar: 5 μm. E, Higher-magnification image of the indicated basal pillar quadrant (square) of the left IHC from D reveals bare patches of IHC membrane and abnormal innervating structures. Scale bar: 1 μm. F, Examples of normal synapses found in Foxo3-KO sections (arrow; cf. C). G, Tiny, possibly degenerated neural structures are observed adjacent to the IHCs at the basal pillar quadrant (star). Note the regular array of microtubule structures. H, Histologically normal ribbon synapses (arrow) with an abnormal afferent nerve in the Foxo3-KO (star).
Inner hair cells in the Foxo3-KO mice had a similar morphology to wild-type, with evident stereocilia (Fig. 5D). In particular, the shape of the mutant inner hair cells, shown by the outline of their plasma membrane, looked similar to that of wild-type inner hair cells. However, some Foxo3-KO inner hair cells had broad basal stretches that lacked neurite innervation (Fig. 5D). A higher-resolution image of the indicated pillar quadrant shows that the inner hair cell membrane was exposed to the extracellular space, reminiscent of the effects of excitotoxicity (Fig. 5E and Pujol et al., 1985). Fragmentary cellular debris were observed around the inner hair cell. It is possible that these are degenerated neurites, given that some are ∼100 nm in size and have regularly arrayed microtubular-like structures (Fig. 5G, star). Irregularity in membrane form was also observed directly in an afferent neurite, leading to exposure to the extracellular space (Fig. 5H, star). Nonetheless, normal-appearing synapses were observed in the mutant (Fig. 5F,H, arrows). These data suggest that the innervation of inner hair cell could be affected in Foxo3-KO mice.
We hypothesized that Foxo3-KO mice have reduced numbers of synapses in the regions with hearing loss, similar to the effects of excitotoxic noise damage (Kujawa and Liberman, 2009). We performed a series of quantitative synaptic analyses on both genotypes and stages. To correlate changes in the synaptic profile of Foxo3-KO mice with their functional characteristics, we assessed two regions: the 32 kHz turn, where hearing loss is greatest (Fig. 6), and the 16 kHz turn, where auditory neuropathy is evident (Fig. 7).
Figure 6.
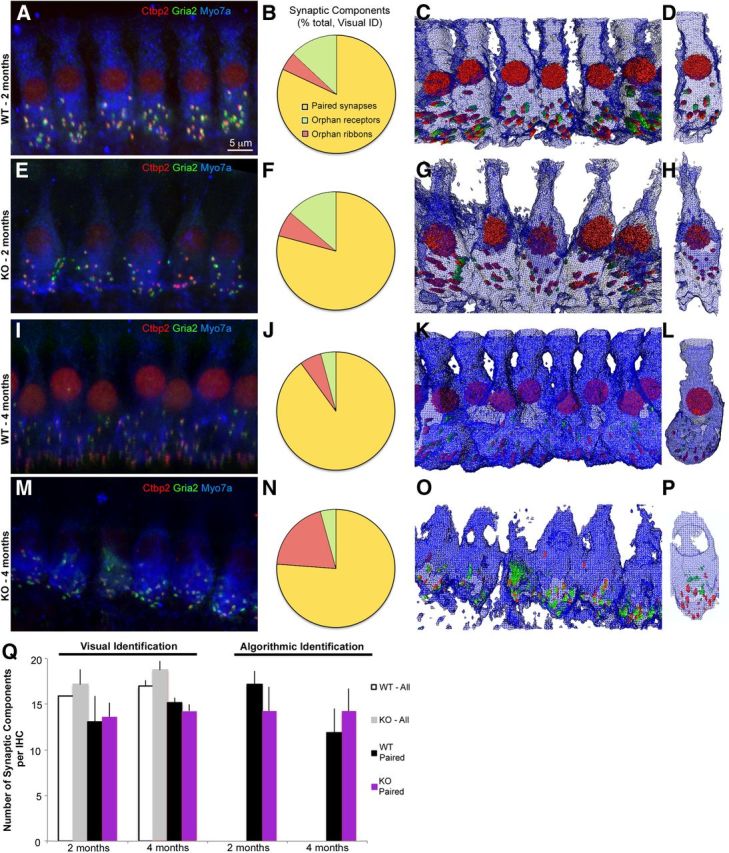
3D IHC morphology in wild-type and Foxo3-KO mice in the 32 kHz turn, which displays hearing loss. A, Confocal image projection of wild-type IHCs from a 2-month-old animal. Red: Ctbp2; green: Gria2; blue: Myo7a. Red nuclear staining is from Ctbp2. B, Pie chart displaying percentage of paired (yellow) or orphan (green: receptors; red: ribbons) synaptic structures, determined visually from A and two other animals. C, Amira 3D reconstruction of stack projected in A. Myo7a is rendered as a wire diagram, and Ctbp2 and Gria2 are rendered as red or green structures, respectively. D, Single IHC cropped from the line shown in C. E, Confocal image projection of 2-month-old Foxo3-KO IHCs stained identically to A. Red nuclear staining is Ctbp2. F, Pie chart displaying percentage of paired (yellow) or orphan (green or red) synaptic structures, determined visually from E and two other animals. G, Amira 3D reconstruction of stack projected in E. Distortion is from the perspective of the 3D volume. H, Single IHC cropped from the line shown in E. I–L, Same analysis as in A–D using 4-month-old wild-type mice. Four animals were quantified for J. M–P, Same analysis as in E–H using 4-month-old Foxo3-KO mice. Note the loss of nuclear Ctbp2 staining in M and reduced Myo7a staining in the apical hair cell. Four animals were quantified for N. Q, Comparison of numbers of synaptic components per hair cell determined visually (Visual Identification) or using the proximity algorithm (Algorithmic Identification). Visual identification enabled quantification of orphan and paired structures (WT-All, white; KO-All, gray) as well as paired structures only (WT-Paired, black; KO-Paired, purple). The algorithm could not distinguish orphan structures from background staining, so only paired structures are presented for Algorithmic Identification.
Figure 7.
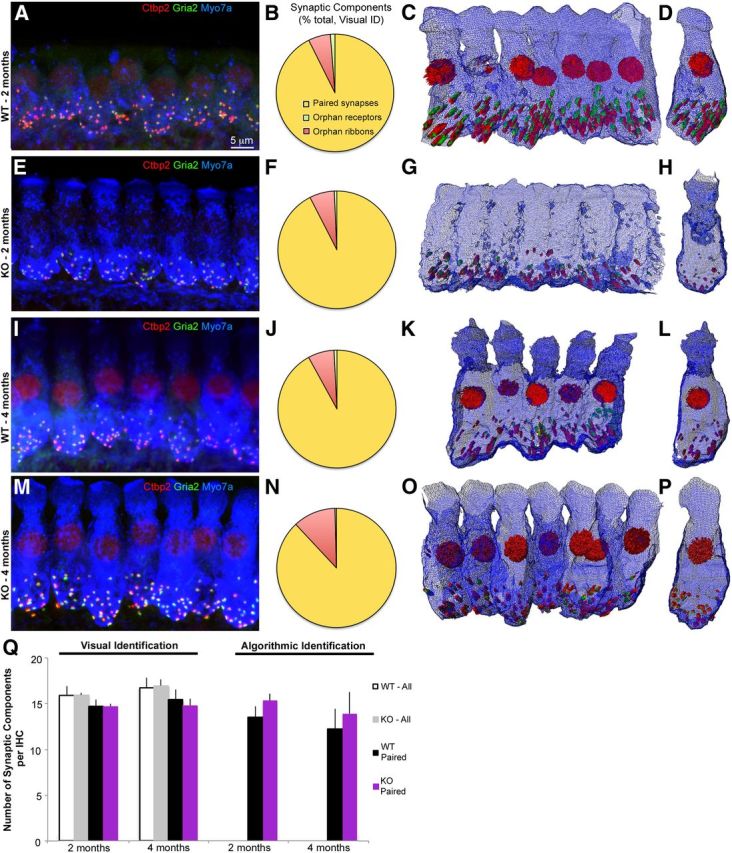
3D IHC morphology in wild-type and Foxo3-KO mice in the 16 kHz turn, which displays neuropathy only. A, Confocal image projection of wild-type IHCs from a 2-month-old animal. Red: Ctbp2; green: Gria2; blue: Myo7a. Red nuclear staining is from Ctbp2. B, Pie chart displaying percentage of paired (yellow) or orphan (green: receptors; red: ribbons) synaptic structures, determined visually from A and two other animals. C, Amira 3D reconstruction of stack projected in A. Myo7a is rendered as a wire diagram and Ctbp2 and Gria2 are rendered as red or green structures, respectively. D, Single IHC cropped from the line shown in C. E, Confocal image projection of 2-month-old Foxo3-KO IHCs, stained identically to A. Note the lack of Ctbp2 nuclear staining. F, Pie chart displaying percentage of paired (yellow) or orphan (green or red) synaptic structures, determined visually from E and two other animals. G, Amira 3D reconstruction of stack projected in E. H, Single IHC cropped from the line shown in E. I–L, Same analysis as in A–D using 4-month-old wild-type mice. Four animals were quantified for J. M–P, Same analysis as in E–H using 4-month-old Foxo3-KO mice. Note how Myo7a staining appears similar to the age-matched wild-type mouse. Four animals were quantified for N. Q, Comparison of numbers of synaptic components per hair cell determined visually (Visual Identification) or using the proximity algorithm (Algorithmic Identification). Visual identification enabled quantification of orphan and paired structures (WT-All, white; KO-All, gray) as well as paired structures only (WT-Paired, black; KO-Paired, purple). The algorithm could not distinguish orphan structures from background staining, so only paired structures are presented for Algorithmic Identification.
In the 32 kHz turn, where hearing loss is greatest, the majority of loci with either presynaptic Ctbp2+ ribbon staining or postsynaptic Gria2+ receptor staining had colocalization of both markers (n = 4 per genotype at 4 months and n = 3 at 2 months, 5–47 IHCs per animal; Fig. 6). This was true for both genotypes at 2 months (wild-type: 86%; KO: 79%) and at 4 months (wild-type: 90%; KO: 76%). In contrast to a previous report (Liberman et al., 2011), we found orphan receptors (Fig. 6B,F,J,N, green) and orphan ribbons (Fig. 6B,F,J,N, red) in both genotypes at both stages. Most of the orphan components at 2 months were receptors (wild-type and Foxo3-KO, 13.0% and 13.9%, respectively) and no difference was observed in the percentage of orphan components at this stage (p = 0.7, Student's 2-tailed t test). At 4 months of age, in contrast, the percentage of Foxo3-KO orphan ribbons had increased to 19.6% (compared with 5.9% in the wild-type, p = 0.05, Student's 2-tailed t test). Nonetheless, at 4 months of age, both genotypes exhibited similar numbers of synaptic loci (2 vs 4 months, white and gray bars, respectively, p = 0.27, two-tailed Student's t test; Fig. 6Q). These data suggest that hearing loss in the Foxo3-KO mouse is probably not due to reduced numbers of synapses.
Using these data, we compared qualitatively the appearance of inner hair cells in the Foxo3-KO with the wild-type. Figure 6 shows the 3D modeling of both the line of inner hair cells and individual examples for both genotypes and stages (Fig. 6C,D,G,H,K,L,O,P). Two-month-old wild-type inner hair cells had a slender morphology (Fig. 6C,D), but by 4 months of age, their bases had tight, interleaved packing with wide basal surfaces (Fig. 6K,L). In contrast, Foxo3-KO inner hair cells were positioned in a straight line and were somewhat dissociated from each other at the base in both stages (Fig. 6G,O). In the 2-month-old Foxo3-KO mice, Myo7a+ staining appeared narrower in the apical half of the inner hair cell compared with control (cf. Fig. 6H,D). In the 4-month-old Foxo3-KO, little Myo7a staining was seen above the nucleus and was completely absent from the apical head near the stereocilia (Fig. 6P). Nuclear Ctbp2 staining was present in the wild-type at both stages (Fig. 6A,I and Schmitz et al., 2000) and in the Foxo3-KO before hearing loss (Fig. 6E). It was absent, however, in four of four mutant animals at the older stage (Fig. 6M). Orphan ribbons without corresponding receptor patches could be readily observed in reconstructions and appeared to be displaced from the basal surface (Fig. 6P).
To further analyze sizes and positions of synapses, we implemented a pairing algorithm to automate synapse identification from 3D reconstructions (see Materials and Methods). We compared total numbers of synaptic pairs identified computationally with the number of pairs identified by visual inspection. On average, we found between 12 and 17 complete synapses per inner hair cell, depending on stage, genotype, and method of identification; however, no statistical differences were seen between groups (p = 0.45, 3-way ANOVA; Fig. 6Q, black and purple bars).
In the 16 kHz region where the Foxo3-KO displays only neuropathy, we found fewer differences between the two genotypes (Fig. 7). As in the 32 kHz turn, the great majority of loci with any synaptic staining contained both ribbons and receptors at 2 months (wild-type, 93%; Foxo3-KO, 93%; Fig. 7A,B,E,F) and at 4 months (wild-type, 92%; Foxo3-KO, 88%; Fig. 7I,J,M,N). Most of the orphan components were ribbons (2 months wild-type, 6.1%, Foxo3-KO, 6.8%, 4 months wild-type, 7.2%, Foxo3-KO, 11.5%) and there was no statistical difference between the genotypes (p = 0.53, Student's 2-tailed t test). In 3D reconstructions, Myo7a staining in the Foxo3-KO was quite similar to the wild-type and is readily observed in the apical head (Fig. 7C,D,G,H,K,L,O,P, blue). Curiously, 3 of 3 Foxo3-KO animals aged 2 months lacked Ctbp2 staining in their nuclei (Fig. 7G,H), unlike the wild-types and the older Foxo3-KO animal. We used both visual identification and algorithmic pairing to count paired synapses and found that the results varied between 12 and 16 synapses per inner hair cell, with no statistical difference found between ages, genotypes, or methods (p = 0.92, 3-way ANOVA).
Computational identification of synaptic pairs allowed us to further investigate their sizes and positions in the Foxo3-KO and wild-type mice. Previous studies have suggested that in 2D projections, the sizes of ribbon and receptor components have an inverse correlation (Liberman et al., 2011). We plotted the computed fluorescence volumes for the Ctbp2+ ribbon staining (Fig. 8, x-axes) against the computed fluorescence volumes for their paired Gria2+ receptor patches (Fig. 8, y-axes) for each age, turn, and genotype. For each wild-type turn and age, this inverse correlation was quite prominent (Fig. 8A,C,E,G). Importantly, when the 2 plots of 4-month-old wild-types, 16 kHz and 32 kHz, are compared, they are not different (p = 0.71, Welch 2-sample t test; cf. Fig. 8E,G), indicating that this distribution is shared between the two datasets derived from regions with normal hearing responses (Fig. 3).
Figure 8.

Synaptic component sizes differ for wild-type and Foxo3-KO IHCs. Scatter plots comparing the volumes of fluorescence staining for ribbons (Ctbp2 volume, x-axis) and receptors (Gria2 volume, y-axis) for each of the synaptic pairs identified algorithmically. The four plots on the left side display data from the 32 kHz turn, where hearing loss is observed. The four plots on the right side display data from the 16 kHz turn, where only neuropathy is observed. A, Two-month-old wild-type, 32 kHz turn (n = 3; 317 synaptic pairs). B, Two-month-old Foxo3-KO, 32 kHz turn (n = 3; 331 synaptic pairs). C, Two-month-old wild-type, 16 kHz turn (n = 3; 322 synaptic pairs). D, Two-month-old Foxo3-KO, 16 kHz turn (n = 3; 354 synaptic pairs). E, Four-month-old wild-type, 32 kHz turn (n = 4; 422 synaptic pairs). F, Four-month-old Foxo3-KO, 32 kHz turn (n = 4; 345 synaptic pairs). G, Four-month-old wild-type, 16 kHz turn (n = 4; 349 synaptic pairs). H, Four-month-old Foxo3-KO, 16 kHz turn (n = 4; 424 synaptic pairs). I, p-values for pairwise comparisons of scatter plots as indicated, using Welch's 2-sample t-test. Results not normalized for multiple comparisons (consider 5 × 10⁻³ for statistical significance approximate).
An inverse correlation was also observed for Foxo3-KO synaptic pairs in the 32 kHz turn (Fig. 8B,F) and in the older 16 kHz turn (Fig. 8H). Younger Foxo3-KO inner hair cells in the 16 kHz region lacked the larger receptor patches seen in the other samples (Fig. 8D). When wild-type and Foxo3-KO datasets were compared statistically (Welch's 2-sample t test), in the 32 kHz region, the genotypes were similar to each other at 2 months (p = 0.42; Fig. 8I). By 4 months of age, a divergence was seen (p = 2.5 × 10⁻⁵; Fig. 8I). In contrast, all of the datasets derived from the 16 kHz region, where neuropathy is observed, were substantially different from one another (Fig. 8I). These results suggest that synaptic component size regulation may be affected by loss of Foxo3. However, it is also possible that not all synapses are affected equally (Liberman, 1980).
We hypothesized that synapses in the Foxo3-KO might be abnormally positioned. In normal hearing animals, synapses are located close to the base of the inner hair cell (Safieddine et al., 2012). We wanted to compare the distances of synaptic pairs from the base of the inner hair cell along the long axis for each genotype. Figure 9A shows the rotated base of a wild-type inner hair cell, identified by Myo7a staining (blue speckles). The basal surface of the Myo7a staining was then modeled with a fifth-degree polynomial in Mathematica (Fig. 9B, surface). The distances of synaptic pairs from this computed surface, in micrometers (Fig. 9B, “distance measured”), was determined for both genotypes, at both ages, and for both cochlear turns. These were plotted as histograms (Fig. 9C–F). In the region where hearing loss is greatest, we found that most wild-type synaptic pairs were localized to the basal third of the inner hair cell at 2 months of age (Fig. 9C, gray). This basal gradient was more pronounced at 4 months (p = 7 × 10⁻⁵, Pearson's χ2 test; Fig. 9D, gray). This may reflect the changes observed in the Myo7a staining between 2- and 4-month-old wild-type mice, where the basal end of the inner hair cell appears to enlarge (Fig. 6). In contrast, Foxo3-KO synaptic pairs were localized in the middle third of the inner hair cell at 2 months of age (p = 2 × 10⁻¹⁶, Pearson's χ2 test; Fig. 9C, red). Foxo3-KO synaptic pairs did display a greater basal gradient at 4 months compared with 2 months of age (p = 3 × 10⁻⁹, Pearson's χ2 test); however, their distribution was still broader than that in the wild-type animal (p = 9 × 10⁻⁹, Pearson's χ2 test). This likely reflects a positioning of synapses along the lateral sides of the mutant inner hair cells.
These results contrast with similar data from the 16 kHz region, where only neuropathy is observed (Fig. 9E,F). At 2 months of age, the positions of wild-type and Foxo3-KO synapses more closely overlap (p = 0.76, Pearson's χ2 test; Fig. 9E). This similarity continues to the later stage, where the distributions of wild-type synapses are not different from the Foxo3-KO (p = 0.51, Pearson's χ2 test; Fig. 9F). These data suggest that, before hearing loss, synaptic localization relative to the basal surface is primarily affected in the high-frequency cochlear regions of the Foxo3-KO.
We wanted to determine whether the loss of Foxo3 affected the distribution of synapses along the pillar-modiolar axis. Inner hair cell synapses are thought to fall into general classes based on their positions and spontaneous firing rates (SRs): modiolar synapses exhibit low and medium SRs and pillar synapses exhibit high SRs. We investigated whether this spatial organization between pillar and modiolar surfaces could be detected in 2D projections of synaptic positions derived from rotated 3D reconstructions. To combine like projections, we aligned the centers of the populations (see Materials and Methods). We used a Bayesian clustering algorithm (Lo et al., 2008; Lo et al., 2009) to identify populations on these scatter plots (Liberman et al., 2011).
At 2 months of age in the wild-type 32 kHz turn, the analysis software detected 2 populations abutting each other (Fig. 10A, blue and orange). At 4 months of age, the wild-type synaptic pairs have a broader cross-sectional distribution (Fig. 10C). Two populations are clearly evident: a densely populated basal modiolar population (Fig. 10C, blue) and a smaller pillar population (Fig. 10C, orange). These populations are reminiscent of the positioning of the low- and high-SR populations described previously (Merchan-Perez and Liberman, 1996; Liberman et al., 2011). For the 2-month-old Foxo3-KO mice, synaptic localization is somewhat similar to its wild-type counterpart (cf. Fig. 10B,A). In contrast, at 4 months, mutant synapses are broadly distributed across the inner hair cells and lack organization across this axis (Fig. 10D). Similar results were seen in the 16 kHz region (Fig. 10E–H). Wild-type synapses in hair cells responding to these lower frequencies also demonstrated a detectable demarcation between the modiolar and pillar sides, whereas Foxo3-KO inner hair cells had no such organization. These data suggest that poor organization of synapses between the pillar and modiolar poles correlates with both hearing loss and neuropathy in the Foxo3-KO mice.
Figure 10.
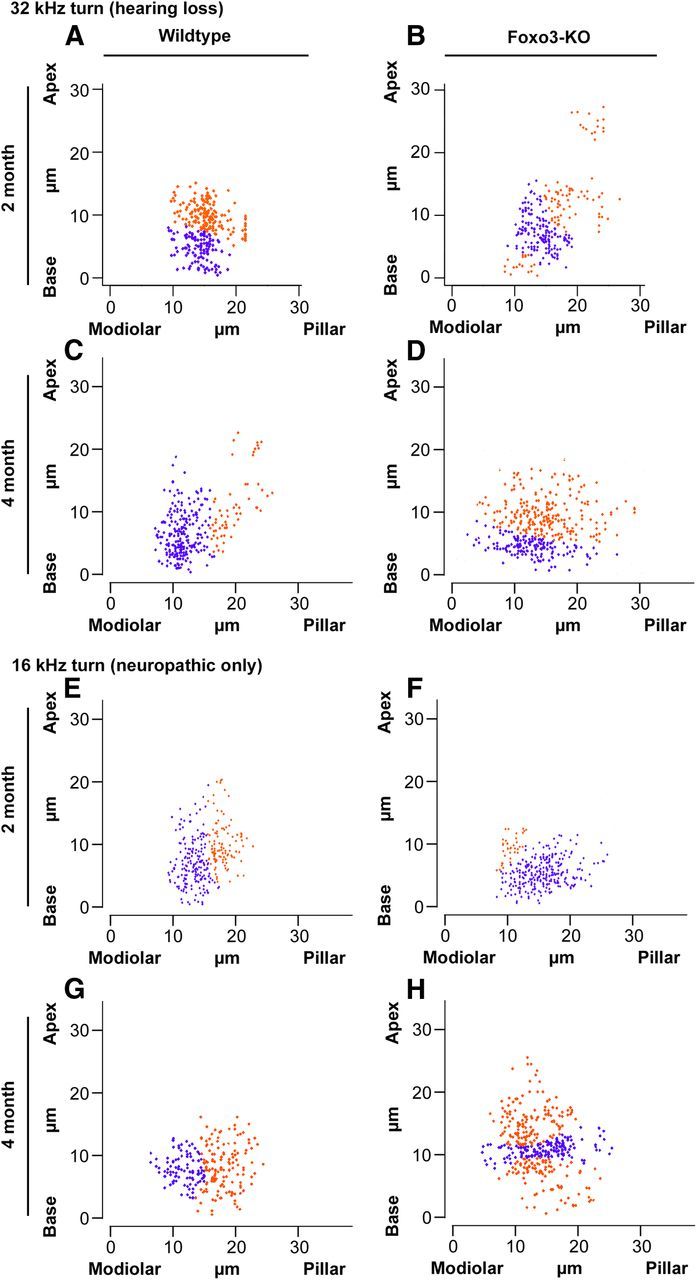
Differential distribution of synaptic components in cross-section projections of IHCs reveals putative synaptic subtype populations. Positional information for algorithmically identified synaptic pairs analyzed in Figures 6, 7, 8, and 9 was rotated in cross-section, aligned by midpoint, and projected to form 2D scatter plots. Orange and blue show populations identified with a Bayesian clustering algorithm (see text). A, B, Two-month-old wild-type (A) and Foxo3-KO (B) synaptic locations in the 32 kHz turn. C, D, Four-month-old wild-type (C) and Foxo3-KO (D) synaptic locations in the 32 kHz turn. E, F, Two-month-old wild-type (E) and Foxo3-KO (F) synaptic locations in the 16 kHz turn. G, H, Four-month-old wild-type (G) and Foxo3-KO (H) synaptic locations in the 16 kHz turn.
Discussion
Auditory neuropathy is a form of hearing loss in which the cochlea cannot correctly encode or transmit information to the brain. Here, we show that adult mice lacking the transcription factor Foxo3 develop auditory neuropathy with high-frequency threshold shifts. In other models of auditory neuropathy, the mechanisms of disease include reductions in the numbers of inner hair cells, spiral ganglion neurons, myelinating glia, or auditory synapses. However, we found that none of these mechanisms could explain hearing deficits in the Foxo3-KO mouse. Instead, hearing deficits were correlated with changes in synaptic localization and with alterations in Myo7a immunostaining. Importantly, Foxo3 protein is expressed in adult cochlear hair cells and spiral ganglion neurons, implying a cell-autonomous function. Acoustic stimulation drove the nuclear localization of Foxo3 in spiral ganglion neurons, suggesting activity dependence. We conclude that Foxo3 contributes to the maintenance of synaptic function in the adult cochlea.
We show that Foxo3 antigenicity localizes to spiral ganglion neurons and cochlear hair cells (Fig. 1). Some Foxo3 is nuclear in both cell types in young adults and in cochlear hair cells in 4-month-old adults. In other cells, nuclear Foxo3 can promote the expression of enzymes that reduce oxidative stress (Mei et al., 2009; Mojsilovic-Petrovic et al., 2009), including Sod2 and Catalase (Olmos et al., 2009) as well as Pink1 (Mei et al., 2009). Foxo3 was largely cytoplasmic in spiral ganglion neurons in 4-month-old mice, but a noninjurious noise exposure was sufficient to promote its nuclear localization. Phosphorylation, such as from insulin receptor signaling, inactivates Foxo3 by promoting cytoplasmic localization (Skurk et al., 2004). In cortical neurons, prolonged stimulation induces Foxo3 dephosphorylation and subsequent nuclear import (Davila et al., 2012). Our data are consistent with a model in which Foxo3 might act within cochlear sensory cells in an activity-dependent fashion to protect hearing. We did not independently verify the specificity of the commercial antibodies used in this study. However, we obtained similar results with antibodies from two independent manufacturers.
Why does Foxo3 localization change in spiral ganglion neurons between 2 and 4 months of age? We speculate that behavioral differences, such as declining sibling vocalizations as rodents mature, could affect the acoustic environment for group-housed animals (Knutson et al., 1998). Another possibility is that unrestricted eating activates the insulin receptor, phosphorylating Foxo3 and causing cytoplasmic sequestration (Tzivion et al., 2011).
Foxo3-KO mice reach sexual maturity with hearing similar to wild-type mice. At 4 months of age, however, they display high-frequency hearing loss without substantial loss of DP-OAE production. In humans, these deficits are considered the hallmarks of auditory neuropathy (Starr et al., 1996). The severe reduction of peak I in the ABRs of Foxo3-KO mice supports the interpretation of reduced synaptic capacity (Khimich et al., 2005). Although auditory neuropathy can result from desynchronization of synaptic signaling (Kovach et al., 1999), the preservation of latencies for all five peaks in the Foxo3-KO ABR (Fig. 3) suggests that this mechanism is not likely to be the cause of Foxo3-dependent hearing loss.
It is interesting that we observed dramatic changes in the ABR traces of wild-type FVB/n mice between 2 and 4 months of age. Two-month-old wild-type FVB/n mice have a smaller peak I amplitude compared with their own peak II (Fig. 3A), a phenomenon not reported for C57BL/6 or CBA. At 4 months, however, their ABR appears typical for mice with normal hearing (Fig. 3). This was found for eight of eight mice. ABR traces for the Foxo3-KO mouse do not show this age-dependent transformation (Fig. 3), suggesting that deficits in Foxo3-KO hearing might represent a failure in maturation (Safieddine et al., 2012). Analysis of the Foxo3 mutation on other mouse background strains, or further analysis of the FVB/n strain, will be key to understanding this phenomenon.
It is perplexing that peak II amplitude appears to increase in response to increasing stimuli in the Foxo3-KO mouse, given that peak I does not. Peak I carries auditory signal inputs from the spiral ganglion to the brain, whereas peak II conveys subsequent efferent regulation from the cochlear nucleus (Hall, 2007). If the perception of sound amplitude relies solely on coordinated responses from the neurons that innervate inner hair cells, then sound perception would become saturated when the neuronal signal is maximal. Our findings suggest that information about sound amplitude is somehow reaching the cochlear nucleus in the Foxo3-KO, despite deficits in the responsiveness of peak I's amplitude. This could be indirect evidence for efferent compensation (Qiu et al., 2000; Wang et al., 2002) possibly mediated through OHC synapses on type II afferents (Knirsch et al., 2007). Peak I must still contain this signal, however. Therefore, changes in its amplitude must be quite small to be experimentally undetected. Type II spiral ganglion neurons comprise only 5% of the ganglion and thus may not contribute largely to peak I.
We report morphological changes in Foxo3-KO inner hair cells that correlate with hearing deficits. Ultrastructure analysis suggested that innervation may be affected (Fig. 5). Unlike some reports (Liberman et al., 2011), we found that a significant minority of presynaptic ribbons are lacking postsynaptic receptors in the Foxo3-KO cochlea. However, such so-called orphan ribbons have been described in some noise-damaged systems (Furman et al., 2013). Alternatively, this phenomenon may reflect a downregulation of this specific AMPA subunit, rather than afferent loss.
Although we see the same numbers of synaptic pairs in Foxo3-KO mice as in their wild-type counterparts, their spatial distribution is altered. During early development, L-type calcium channels are evenly distributed along the inner hair cells' long axis, but become localized to the base as maturation progresses (Safieddine et al., 2012). We found that Foxo3-KO synapses in the 32 kHz turn are more displaced from the basal surface compared with wild-type, suggesting a delay in maturation (Fig. 9). Synaptic organization across the pillar-modiolar axis is thought to play an important role in auditory discrimination (Liberman, 1980). We identify these synaptic populations in the wild-type with a novel cluster analysis (Fig. 10). Importantly, this pillar-modiolar organization appears lost in all Foxo3-KO stages and cochlear turns analyzed (Fig. 10). Our data are the first genetic evidence correlating the absence of inner hair cell synaptic organization with auditory neuropathy. Finally, Myo7a has long been known to be necessary for inner hair cell function (Weil et al., 1995). We found alterations in Myo7a immunostaining, with little reactivity in the apical heads of the Foxo3-KO inner hair cells where hearing loss is observed (Fig. 6). Understanding how these phenomena contribute to hearing loss in the Foxo3-KO is an important area for future study.
We observed loss of nuclear Ctbp2 staining in the Foxo3-KO mice and speculate that it signifies oxidative stress. There is a cellular mechanism that specifically targets nuclear Ctbp2 for degradation, which would leave Ctbp2+ ribbons intact. Oxidation can activate Jnk signaling (Mendelson et al., 1996). Jnk activates the tumor suppressor ARF, a product of the Cdkn2A locus, and promotes its nuclear localization (Quelle et al., 1995; Paliwal et al., 2006; Yogev et al., 2008). There, ARF targets Ctbp2 for degradation (Paliwal et al., 2006). Nuclear ARF could not target cytoplasmic synaptic ribbons because it would be in the wrong cellular compartment. Whether ARF is expressed in the cochlea, however, is yet unknown.
We do not know how proteins regulated by Foxo3 might contribute to maintaining synaptic function. Afferent degeneration (Fig. 5) could be a consequence of increased oxidative stress in Foxo3-KO spiral ganglion neurons. Foxo3 expression protects motor neuron projections (Mojsilovic-Petrovic et al., 2009) and can reduce Wallerian degeneration after sciatic nerve crush (Calixto et al., 2012). Alternatively, in the mouse hippocampus, the related factor Foxo6 regulates the expression of synaptic proteins necessary for learning (Salih et al., 2012). It is appealing to speculate that acoustic stimulation could induce Foxo3-dependent synaptic protein turnover. Further work is necessary to characterize Foxo3's effectors in the cochlea.
Our report is the first to show that Foxo3 plays a role in sensory preservation. We note that there is a rare human Foxo3 allelic variant correlating with extreme longevity (Willcox et al., 2008; Anselmi et al., 2009; Flachsbart et al., 2009; Pawlikowska et al., 2009). This variant does not change the coding sequence of Foxo3 (Donlon et al., 2012), but rather may increase basal Foxo3 transcript levels (Banasik et al., 2011). Further work could address whether this variant correlates with improved auditory function in aging humans, similar to studies on increased antioxidant supplementation of diet in elderly dogs (Le and Keithley, 2007).
Because damaged cochlear sensory cells do not regenerate in mammals (Chardin and Romand, 1995), it is important to identify how auditory function is maintained. Loss of Foxo3 function causes hearing loss and auditory neuropathy without the destruction of cells or reduction of auditory synaptic number. Rather, it acts via a new mechanism, correlating with changes in synaptic positioning and Myo7a immunoreactivity. Identifying Foxo3's function in the mouse cochlea is a new approach to understanding auditory neuropathy, a human disorder with few known genetic causes.
Footnotes
This work was supported by a grant from the Hearing Health Foundation and by start-up funds to P.M.W. from the University of Rochester Medical Center. We thank Linda Callahan of the Confocal and Conventional Microscopy Core and Karen Bentley and Gayle Schneider of the Electron Microscopy Core for expert services; Anne Luebke for assistance with audiometric testing and analysis; M. Charles Liberman for exceptional advice on immunostaining protocols and tissue preparation; Leslie Liberman for sharing her protocol for cochlear synaptic staining; Wei-Ming Yu for invaluable assistance with Amira; and Hongwei Yao for technical assistance with presentation of Western data.
F.G. and P.M.W. are named on a patent filed by the University of Rochester (U.S. serial number pending) for manipulating Foxo3 function as a treatment for noise-induced hearing loss. The remaining authors declare no competing financial interests.
References
- Abdala C, Visser-Dumont L. Distortion product otoacoustic emissions: a tool for hearing assessment and scientific study. Volta Rev. 2001;103:281–302. [PMC free article] [PubMed] [Google Scholar]
- Anselmi CV, Malovini A, Roncarati R, Novelli V, Villa F, Condorelli G, Bellazzi R, Puca AA. Association of the FOXO3A locus with extreme longevity in a southern Italian centenarian study. Rejuvenation Res. 2009;12:95–104. doi: 10.1089/rej.2008.0827. [DOI] [PubMed] [Google Scholar]
- Avan P, Bonfils P, Gilain L, Mom T. Physiopathological significance of distortion-product otoacoustic emissions at 2f1–f2 produced by high- versus low-level stimuli. J Acoust Soc Am. 2003;113:430–441. doi: 10.1121/1.1525285. [DOI] [PubMed] [Google Scholar]
- Banasik K, Ribel-Madsen R, Gjesing AP, Wegner L, Andersson A, Poulsen P, Borglykke A, Witte DR, Pederson O, Hansen T, Vaag A. The FOXO3A rs2802292 G-allele associates with improved peripheral and hepatic insulin sensitivity and increased skeletal muscle-FOXO3A mRNA expression in twins. J Clin Endocrinol Metab. 2011;96:E119–E124. doi: 10.1210/jc.2010-0881. [DOI] [PubMed] [Google Scholar]
- Bao J, Lei D, Du Y, Ohlemiller KK, Beaudet AL, Role LW. Requirement of nicotinic acetylcholine receptor subunit beta2 in the maintenance of spiral ganglion neurons during aging. J Neurosci. 2005;25:3041–3045. doi: 10.1523/JNEUROSCI.5277-04.2005. [DOI] [PMC free article] [PubMed] [Google Scholar]
- Berlin CI, Hood LJ, Morlet T, Wilensky D, Li L, Mattingly KR, Taylor-Jeanfreau J, Keats BJ, John PS, Montgomery E, Shallop JK, Russell BA, Frisch SA. Multi-site diagnosis and management of 260 patients with auditory neuropathy/dys-synchrony (auditory neuropathy spectrum disorder) Int J Audiol. 2010;49:30–43. doi: 10.3109/14992020903160892. [DOI] [PubMed] [Google Scholar]
- Biggs WH, 3rd, Cavenee WK, Arden KC. Identification and characterization of members of the FKHR (FOX O) subclass of winged-helix transcription factors in the mouse. Mamm Genome. 2001;12:416–425. doi: 10.1007/s003350020002. [DOI] [PubMed] [Google Scholar]
- Brunet A, Bonni A, Zigmond MJ, Lin MZ, Juo P, Hu LS, Anderson MJ, Arden KC, Blenis J, Greenberg ME. Akt promotes cell survival by phosphorylating and inhibiting a Forkhead transcription factor. Cell. 1999;19:857–868. doi: 10.1016/S0092-8674(00)80595-4. [DOI] [PubMed] [Google Scholar]
- Cai B, Xia Z. p38 MAP kinase mediates arsenite-induced apoptosis through FOXO3a activation and induction of Bim transcription. Apoptosis. 2008;13:803–810. doi: 10.1007/s10495-008-0218-5. [DOI] [PMC free article] [PubMed] [Google Scholar]
- Calixto A, Jara JS, Court FA. Diapause formation and downregulation of insulin-like signaling via DAF-16/FOXO delays axonal degeneration and neuronal loss. PLoS Genet. 2012;8:e1003141. doi: 10.1371/journal.pgen.1003141. [DOI] [PMC free article] [PubMed] [Google Scholar]
- Castrillon DH, Miao L, Kollipara R, Horner JW, DePinho RA. Suppression of ovarian follicle activation in mice by the transcription factor Foxo3a. Science. 2003;301:215–218. doi: 10.1126/science.1086336. [DOI] [PubMed] [Google Scholar]
- Chardin S, Romand R. Regeneration and mammalian auditory hair cells. Science. 1995;267:707–711. doi: 10.1126/science.7839151. [DOI] [PubMed] [Google Scholar]
- Cruse RP, Conomy JP, Wilbourn AJ, Hanson MR. Hereditary hypertrophic neuropathy combining features of tic douloureux, Charcot-Marie-Tooth disease, and deafness. Cleve Clin Q. 1977;44:107–111. doi: 10.3949/ccjm.44.3.107. [DOI] [PubMed] [Google Scholar]
- Davila D, Connolly NM, Bonner H, Weisová P, Dussmann H, Concannon CG, Huber HJ, Prehn JH. Two-step activation of FOXO3 by AMPK generates a coherent feed-forward loop determining excitotoxic cell fate. Cell Death Differ. 2012;19:1677–1688. doi: 10.1038/cdd.2012.49. [DOI] [PMC free article] [PubMed] [Google Scholar]
- Donlon TA, Curb JD, He Q, Grove JS, Masaki KH, Rodriquez B, Elliott A, Willcox DC, Willcox BJ. FOXO3 gene variants and human aging: coding variants may not be key players. J Gerontol A Biol Sci Med Sci. 2012;67:1132–1139. doi: 10.1093/gerona/gls067. [DOI] [PMC free article] [PubMed] [Google Scholar]
- Dror AA, Avraham KB. Hearing impairment: a panoply of genes and functions. Neuron. 2010;68:293–308. doi: 10.1016/j.neuron.2010.10.011. [DOI] [PubMed] [Google Scholar]
- Flachsbart F, Caliebe A, Kleindorp R, Blanché H, von Eller-Eberstein H, KNikolaus S, Schreiber S, Nebel A. Association of FOXO3A variation with human longevity confirmed in German centenarians. Proc Natl Acad Sci U S A. 2009;106:2700–2705. doi: 10.1073/pnas.0809594106. [DOI] [PMC free article] [PubMed] [Google Scholar]
- Furman AC, Kujawa SG, Liberman MC. Noise-induced cochlear neuropathy is selective for fibers with low spontaneous rates. J Neurophysiol. 2013;110:577–586. doi: 10.1152/jn.00164.2013. [DOI] [PMC free article] [PubMed] [Google Scholar]
- Greer EL, Brunet A. FOXO transcription factors in ageing and cancer. Acta Physiol (Oxf) 2008;192:19–28. doi: 10.1111/j.1748-1716.2007.01780.x. [DOI] [PubMed] [Google Scholar]
- Hall JW. New handbook of auditory evoked responses. Boston: Pearson; 2007. [Google Scholar]
- Hallpike CS, Harriman DG, Wells CE. A case of afferent neuropathy and deafness. J Laryngol Otol. 1980;94:945–964. doi: 10.1017/S0022215100089696. [DOI] [PubMed] [Google Scholar]
- Hasson T, Heintzelman MB, Santos-Sacchi J, Corey DP, Mooseker MS. Expression in cochlea and retina of myosin VIIa, the gene product defective in Usher syndrome type 1B. Proc Natl Acad Sci U S A. 1995;92:9815–9819. doi: 10.1073/pnas.92.21.9815. [DOI] [PMC free article] [PubMed] [Google Scholar]
- Hwang JW, Rajendrasozhan S, Yao H, Chung S, Sundar IK, Huyck HL, Pryhuber GS, Kinnula VL, Rahman I. FOXO3 deficiency leads to increased susceptibility to cigarette smoke-induced inflammation, airspace enlargement, and chronic obstructive pulmonary disease. J Immunol. 2011;187:987–998. doi: 10.4049/jimmunol.1001861. [DOI] [PMC free article] [PubMed] [Google Scholar]
- Khimich D, Nouvian R, Pujol R, Tom Dieck S, Egner A, Gundelfinger ED, Moser T. Hair cell synaptic ribbons are essential for synchronous auditory signalling. Nature. 2005;434:889–894. doi: 10.1038/nature03418. [DOI] [PubMed] [Google Scholar]
- Kim N, Dempsey CM, Kuan CJ, Zoval JV, O'Rourke E, Ruvkun G, Madou MJ, Sze JY. Gravity force transduced by the MEC-4/MEC-10 DEG/ENaC channel modulates DAF-16/FoxO activity in Caenorhabditis elegans. Genetics. 2007;177:835–845. doi: 10.1534/genetics.107.076901. [DOI] [PMC free article] [PubMed] [Google Scholar]
- Knirsch M, Brandt N, Braig C, Kuhn S, Hirt B, Münkner S, Knipper M, Engel J. Persistence of Ca(v)1.3 Ca2+ channels in mature outer hair cells supports outer hair cell afferent signaling. J Neurosci. 2007;27:6442–6451. doi: 10.1523/JNEUROSCI.5364-06.2007. [DOI] [PMC free article] [PubMed] [Google Scholar]
- Knutson B, Burgdorf J, Panksepp J. Anticipation of play elicits high-frequency ultrasonic vocalizations in young rats. J Comp Psychol. 1998;112:65–73. doi: 10.1037/0735-7036.112.1.65. [DOI] [PubMed] [Google Scholar]
- Kovach MJ, Lin JP, Boyadjiev S, Campbell K, Mazzeo L, Herman K, Rimer LA, Frank W, Llewellyn B, Jabs EW, Gelber D, Kimonis VE. A unique point mutation in the PMP22 gene is associated with Charcot-Marie-Tooth disease and deafness. Am J Hum Genet. 1999;64:1580–1593. doi: 10.1086/302420. [DOI] [PMC free article] [PubMed] [Google Scholar]
- Kujawa SG, Liberman MC. Adding insult to injury: cochlear nerve degeneration after “temporary” noise-induced hearing loss. J Neurosci. 2009;29:14077–14085. doi: 10.1523/JNEUROSCI.2845-09.2009. [DOI] [PMC free article] [PubMed] [Google Scholar]
- Lang H, Schulte BA, Zhou D, Smythe N, Spicer SS, Schmiedt RA. Nuclear factor kappaB deficiency is associated with auditory nerve degeneration and increased noise-induced hearing loss. J Neurosci. 2006;26:3541–3550. doi: 10.1523/JNEUROSCI.2488-05.2006. [DOI] [PMC free article] [PubMed] [Google Scholar]
- Le T, Keithley EM. Effects of antioxidants on the aging inner ear. Hear Res. 2007;226:194–202. doi: 10.1016/j.heares.2006.04.003. [DOI] [PubMed] [Google Scholar]
- Liberman LD, Wang H, Liberman MC. Opposing gradients of ribbon size and AMPA receptor expression underlie sensitivity differences among cochlear-nerve/hair-cell synapses. J Neurosci. 2011;31:801–808. doi: 10.1523/JNEUROSCI.3389-10.2011. [DOI] [PMC free article] [PubMed] [Google Scholar]
- Liberman MC. Morphological differences among radial afferent fibers in the cat cochlea: an electron-microscopic study of serial sections. Hear Res. 1980;3:45–63. doi: 10.1016/0378-5955(80)90007-6. [DOI] [PubMed] [Google Scholar]
- Liberman MC. Video tutorial for cochlear dissection. 2009. http://www.masseyeandear.org/research/ent/eaton-peabody/epl-histology-resources/. Massachusetts Eye and Ear Infirmary.
- Lo K, Brinkman RR, Gottardo R. Automated gating of flow cytometry data via robust model-based clustering. Cytometry A. 2008;73:321–332. doi: 10.1002/cyto.a.20531. [DOI] [PubMed] [Google Scholar]
- Lo K, Hahne F, Brinkman RR, Gottardo R. flowClust: a Bioconductor package for automated gating of flow cytometry data. BMC Bioinform. 2009;10:145. doi: 10.1186/1471-2105-10-145. [DOI] [PMC free article] [PubMed] [Google Scholar]
- Maiese K, Chong ZZ, Shang YC, Hou J. A “FOXO” in sight: targeting Foxo proteins from conception to cancer. Med Res Rev. 2009;29:395–418. doi: 10.1002/med.20139. [DOI] [PMC free article] [PubMed] [Google Scholar]
- Maison SF, Emeson RB, Adams JC, Luebke AE, Liberman MC. Loss of alpha CGRP reduces sound-evoked activity in the cochlear nerve. J Neurophysiol. 2003;90:2941–2949. doi: 10.1152/jn.00596.2003. [DOI] [PubMed] [Google Scholar]
- Manchaiah VK, Zhao F, Danesh AA, Duprey R. The genetic basis of auditory neuropathy spectrum disorder (ANSD) Int J Pediatr Otorhinolaryngol. 2011;75:151–158. doi: 10.1016/j.ijporl.2010.11.023. [DOI] [PubMed] [Google Scholar]
- Martin GK, Stagner BB, Lonsbury-Martin BL. Assessment of cochlear function in mice: distortion-product otoacoustic emissions. In: Crawley JN, editor. Current protocols in neuroscience. New York: Wiley; 2006. pp. 8.21c.1–18. [DOI] [PubMed] [Google Scholar]
- Mei Y, Zhang Y, Yamamoto K, Xie W, Mak TW, You H. FOXO3a-dependent regulation of Pink1 (Park6) mediates survival signaling in response to cytokine deprivation. Proc Natl Acad Sci U S A. 2009;106:5153–5158. doi: 10.1073/pnas.0901104106. [DOI] [PMC free article] [PubMed] [Google Scholar]
- Mendelson KG, Contois LR, Tevosian SG, Davis RJ, Paulson KE. Independent regulation of JNK/p38 mitogen-activated protein kinases by metabolic oxidative stress in the liver. Proc Natl Acad Sci U S A. 1996;93:12908–12913. doi: 10.1073/pnas.93.23.12908. [DOI] [PMC free article] [PubMed] [Google Scholar]
- Merchan-Perez A, Liberman MC. Ultrastructural differences among afferent synapses on cochlear hair cells: correlations with spontaneous discharge rate. J Comp Neurol. 1996;371:208–221. doi: 10.1002/(SICI)1096-9861(19960722)371:2<208::AID-CNE2>3.0.CO;2-6. [DOI] [PubMed] [Google Scholar]
- Mojsilovic-Petrovic J, Nedelsky N, Boccitto M, Mano I, Georgiades SN, Zhou W, Liu Y, Neve RL, Taylor JP, Driscoll M, Clardy J, Merry D, Kalb RG. FOXO3a is broadly neuroprotective in vitro and in vivo against insults implicated in motor neuron diseases. J Neurosci. 2009;29:8236–8247. doi: 10.1523/JNEUROSCI.1805-09.2009. [DOI] [PMC free article] [PubMed] [Google Scholar]
- Olmos Y, Valle I, Borniquel S, Tierrez A, Soria E, Lamas S, Monsalve M. Mutual dependence of Foxo3a and PGC-1alpha in the induction of oxidative stress genes. J Biol Chem. 2009;284:14476–14484. doi: 10.1074/jbc.M807397200. [DOI] [PMC free article] [PubMed] [Google Scholar]
- Paliwal S, Pande S, Kovi RC, Sharpless NE, Bardeesy N, Grossman SR. Targeting of C-terminal binding protein (CtBP) by ARF results in p53-independent apoptosis. Mol Cell Biol. 2006;26:2360–2372. doi: 10.1128/MCB.26.6.2360-2372.2006. [DOI] [PMC free article] [PubMed] [Google Scholar]
- Pawlikowska L, Hu D, Huntsman S, Sung A, Chu C, Chen J, Joyner AH, Schork NJ, Hsueh WC, Reiner AP, Psaty BM, Atzmon G, Barzilai N, Cummings SR, Browner WS, Kwok PY, Ziv E, Ziv E. Association of common genetic variation in the insulin/IGF1 signaling pathway with human longevity. Aging Cell. 2009;8:460–472. doi: 10.1111/j.1474-9726.2009.00493.x. [DOI] [PMC free article] [PubMed] [Google Scholar]
- Pujol R, Lenoir M, Robertson D, Eybalin M, Johnstone BM. Kainic acid selectively alters auditory dendrites connected with cochlear inner hair cells. Hear Res. 1985;18:145–151. doi: 10.1016/0378-5955(85)90006-1. [DOI] [PubMed] [Google Scholar]
- Qiu C, Salvi R, Ding D, Burkard R. Inner hair cell loss leads to enhanced response amplitudes in auditory cortex of unanesthetized chinchillas: evidence for increased system gain. Hear Res. 2000;139:153–171. doi: 10.1016/S0378-5955(99)00171-9. [DOI] [PubMed] [Google Scholar]
- Quelle DE, Zindy F, Ashmun RA, Sherr CJ. Alternative reading frames of the INK4a tumor suppressor gene encode two unrelated proteins capable of inducing cell cycle arrest. Cell. 1995;83:993–1000. doi: 10.1016/0092-8674(95)90214-7. [DOI] [PubMed] [Google Scholar]
- Ryan A, Dallos P. Effect of absence of cochlear outer hair cells on behavioural auditory threshold. Nature. 1975;253:44–46. doi: 10.1038/253044a0. [DOI] [PubMed] [Google Scholar]
- Safieddine S, El-Amraoui A, Petit C. The auditory hair cell ribbon synapse: from assembly to function. Annu Rev Neurosci. 2012;35:509–528. doi: 10.1146/annurev-neuro-061010-113705. [DOI] [PubMed] [Google Scholar]
- Salih DA, Rashid AJ, Colas D, de la Torre-Ubieta L, Zhu RP, Morgan AA, Santo EE, Ucar D, Devarajan K, Cole CJ, Madison DV, Shamloo M, Butte AJ, Bonni A, Josselyn SA, Brunet A. FoxO6 regulates memory consolidation and synaptic function. Genes Dev. 2012;26:2780–2801. doi: 10.1101/gad.208926.112. [DOI] [PMC free article] [PubMed] [Google Scholar]
- Salvi RJ, Ding D, Wang J, Jiang HY. A review of the effects of selective inner hair cell lesions on distortion product otoacoustic emissions, cochlear function and auditory evoked potentials. Noise Health. 2000;2:9–26. [PubMed] [Google Scholar]
- Santarelli R. Information from cochlear potentials and genetic mutations helps localize the lesion site in auditory neuropathy. Genome Med. 2010;2:91–101. doi: 10.1186/gm212. [DOI] [PMC free article] [PubMed] [Google Scholar]
- Schmiedt RA, Okamura HO, Lang H, Schulte BA. Ouabain application to the round window of the gerbil cochlea: a model of auditory neuropathy and apoptosis. J Assoc Res Otolaryngol. 2002;3:223–233. doi: 10.1007/s101620020017. [DOI] [PMC free article] [PubMed] [Google Scholar]
- Schmitz F, Königstorfer A, Südhof TC. RIBEYE, a component of synaptic ribbons: a protein's journey through evolution provides insight into synaptic ribbon function. Neuron. 2000;28:857–872. doi: 10.1016/S0896-6273(00)00159-8. [DOI] [PubMed] [Google Scholar]
- Seal RP, Akil O, Yi E, Weber CM, Grant L, Yoo J, Clause A, Kandler K, Noebels JL, Glowatzki E, Lustig LR, Edwards RH. Sensorineural deafness and seizures in mice lacking vesicular glutamate transporter 3. Neuron. 2008;57:263–275. doi: 10.1016/j.neuron.2007.11.032. [DOI] [PMC free article] [PubMed] [Google Scholar]
- Sengupta A, Molkentin JD, Paik JH, DePinho RA, Yutzey KE. FoxO transcription factors promote cardiomyocyte survival upon induction of oxidative stress. J Biol Chem. 2011;286:7468–7478. doi: 10.1074/jbc.M110.179242. [DOI] [PMC free article] [PubMed] [Google Scholar]
- Skurk C, Maatz H, Kim HS, Yang J, Abid MR, Aird WC, Walsh K. The Akt-regulated forkhead transcription factor FOXO3a controls endothelial cell viability through modulation of the caspase-8 inhibitor FLIP. J Biol Chem. 2004;279:1513–1525. doi: 10.1074/jbc.M304736200. [DOI] [PubMed] [Google Scholar]
- Starr A, Picton TW, Sininger Y, Hood LJ, Berlin CI. Auditory neuropathy. Brain. 1996;119:741–753. doi: 10.1093/brain/119.3.741. [DOI] [PubMed] [Google Scholar]
- Takeno S, Harrison RV, Ibrahim D, Wake M, Mount RJ. Cochlear function after selective inner hair cell degeneration induced by carboplatin. Hear Res. 1994;75:93–102. doi: 10.1016/0378-5955(94)90060-4. [DOI] [PubMed] [Google Scholar]
- Tzivion G, Dobson M, Ramakrishnan G. FoxO transcription factors; Regulation by AKT and 14-3-3 proteins. Biochim Biophys Acta. 2011;1813:1938–1945. doi: 10.1016/j.bbamcr.2011.06.002. [DOI] [PubMed] [Google Scholar]
- Usami S, Matsubara A, Fujita S, Shinkawa H, Hayashi M. NMDA (NMDAR1) and AMPA-type (GluR2/3) receptor subunits are expressed in the inner ear. Neuroreport. 1995;6:1161–1164. doi: 10.1097/00001756-199505300-00022. [DOI] [PubMed] [Google Scholar]
- Wang J, Ding D, Salvi RJ. Functional reorganization in chinchilla inferior colliculus associated with chronic and acute cochlear damage. Hear Res. 2002;168:238–249. doi: 10.1016/S0378-5955(02)00360-X. [DOI] [PubMed] [Google Scholar]
- Wang Y, Ren C. Effects of repeated “benign” noise exposures in young CBA mice: shedding light on age-related hearing loss. J Assoc Res Otolaryngol. 2012;13:505–515. doi: 10.1007/s10162-012-0329-0. [DOI] [PMC free article] [PubMed] [Google Scholar]
- Weil D, Blanchard S, Kaplan J, Guilford P, Gibson F, Walsh J, Mburu P, Varela A, Levilliers J, Weston MD. Defective myosin VIIA gene responsible for Usher syndrome type 1B. Nature. 1995;374:60–61. doi: 10.1038/374060a0. [DOI] [PubMed] [Google Scholar]
- Willcox BJ, Donlon TA, He Q, Chen R, Grove JS, Yano K, Masaki KH, Willcox DC, Rodriguez B, Curb JD. FOXO3A genotype is strongly associated with human longevity. Proc Natl Acad Sci U S A. 2008;105:13987–13992. doi: 10.1073/pnas.0801030105. [DOI] [PMC free article] [PubMed] [Google Scholar]
- Yao H, Chung S, Hwang JW, Rajendrasozhan S, Sundar IK, Dean DA, McBurney MW, Guarente L, Gu W, Rönty M, Kinnula VL, Rahman I. SIRT1 protects against emphysema via FOXO3-mediated reduction of premature senescence in mice. J Clin Invest. 2012;122:2032–2045. doi: 10.1172/JCI60132. [DOI] [PMC free article] [PubMed] [Google Scholar]
- Yasunaga S, Grati M, Cohen-Salmon M, El-Amraoui A, Mustapha M, Salem N, El-Zir E, Loiselet J, Petit C. A mutation in OTOF, encoding otoferlin, a FER-1-like protein, causes DFNB9, a nonsyndromic form of deafness. Nat Genet. 1999;21:363–369. doi: 10.1038/7693. [DOI] [PubMed] [Google Scholar]
- Yogev O, Saadon K, Anzi S, Inoue K, Shaulian E. DNA damage-dependent translocation of B23 and p19 ARF is regulated by the Jun N-terminal kinase pathway. Cancer Res. 2008;68:1398–1406. doi: 10.1158/0008-5472.CAN-07-2865. [DOI] [PubMed] [Google Scholar]
- Zheng QY, Johnson KR, Erway LC. Assessment of hearing in 80 inbred strains of mice by ABR threshold analyses. Hear Res. 1999;130:94–107. doi: 10.1016/S0378-5955(99)00003-9. [DOI] [PMC free article] [PubMed] [Google Scholar]