Abstract
The extent of spinal interneuron (IN) contribution to dexterous hand movements is unclear. Here, we studied the response patterns and force relationships of spinal premotor INs (PreM-INs) in three awake, behaving monkeys performing a precision grip task. We recorded activity from the cervical spinal cord (C5–T1) simultaneously with electromyographic (EMG) activity from hand and arm muscles during the task. Spike-triggered averaging of EMGs showed that 25 PreM-INs had postspike effects on EMG activity. Most PreM-INs (23/25) displayed movement-related firing rate modulations: 11 had phasic followed by tonic facilitation (p+t+); 4 were pure phasic; 4 were pure tonic; and 4 were deactivated, while their target muscles consistently had p+t+ activity (65/66 muscles). PreM-IN phasic activity started earlier than target muscle activity (49 ± 81.4 ms, mean ± SD), and the peak amplitude was correlated with the peak amplitude of the rate of change of grip force (4/17, p < 0.05), suggesting that they contributed to force initiation. In contrast, PreM-IN tonic activity started at almost the same time as the target muscle activity and the mean firing rate was correlated with the mean grip force during the hold period (4/15, p < 0.05), suggesting that they contributed to force maintenance. These results indicated that the neural pathway mediated by the spinal PreM-INs makes a significant contribution to the control of precision grip in primates.
Introduction
The ability to execute a precision grip is an evolutionary advance in humans and other primates. With regard to the neural control of primate precision grip, the importance of a monosynaptic connection from the motor cortex to spinal motoneurons (corticomotoneuronal [CM] pathway) has been emphasized in both phylogenetic and physiological studies (for review, see Lemon, 2008). For example, digit dexterity across species is correlated with the extent of the direct CM projection (Heffner and Masterton, 1983), and electrophysiological studies have revealed that direct CM cells in the primary motor cortex are selectively activated during precision grip (Muir and Lemon, 1983). These results suggest that the CM pathway is particularly important in the control of fractionated finger movement.
Anatomical studies have demonstrated the existence of corticospinal projections that influence motoneurons indirectly via their connections with spinal interneurons (INs; indirect pathway), in addition to the CM pathway. For example, the majority of corticospinal projections terminate in the spinal intermediate zone (Ralston and Ralston, 1985; Bortoff and Strick, 1993); some project disynaptically to motoneurons via spinal interneurons (Rathelot and Strick, 2009). Evidence from behavioral studies in animals with CM pathway lesions (for review, see Isa et al., 2007; Alstermark et al., 2011), and selective blockade of the indirect pathway via propriospinal neurons (Kinoshita et al., 2012) indicated that the indirect pathway contributes to dexterous hand movement commands. However, it remains unclear how individual neurons mediating the indirect pathway are involved in the control of precision grip.
Using methods to record from the cervical spinal cord in awake, behaving monkeys, we demonstrated that spinal INs exert postspike effects in finger muscles during precision grip in monkeys (Takei and Seki, 2010). This result indicates that spinal premotor INs (PreM-INs) have synaptic connections with finger muscle motoneurons and may be involved in the generation of finger muscle activity during precision grip. In this study, we further explored the contribution of spinal PreM-INs to the control of precision grip by examining their patterns of activity during precision grip, and investigating the relationship between firing activity and grip force. Our results indicate that most spinal PreM-INs had significantly modulated firing rates during the dynamic phase and/or static phase of the precision grip. Phasic activity during the dynamic phase was correlated with the rate of change of grip force (dF/dt); tonic activity during the static phase was correlated with steady grip force. These results show that spinal PreM-INs are involved in both the initiation and maintenance of grip force during precision grip. Moreover, as the majority of PreM-INs exhibited both phasic and tonic activities simultaneously, we suggest that spinal PreM-INs function to integrate dynamic and static motor commands to produce final output to the spinal motoneurons. Preliminary results of this study were presented in abstract form (Takei and Seki, 2009).
Materials and Methods
Animals.
Electrophysiological recordings were obtained from three adult male macaque monkeys (monkey A: Macaca fuscata, 6.8 kg; monkey E: Macaca mulatta, 5.6 kg; and monkey U: M. fuscata, 8.5 kg). Experiments were performed in accordance with the National Institutes of Health Guidelines for the Care and Use of Laboratory Animals and were approved by the Animal Research Committee at the National Institute for Physiological Sciences, Japan.
Behavioral task and data acquisition.
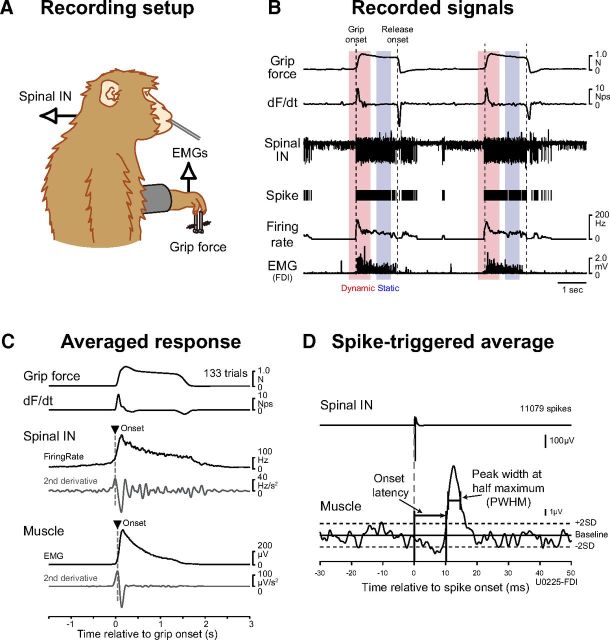
The monkeys were trained to perform a precision grip task. Details of the behavioral task, surgical operations, experimental setup, and procedures for recording single-unit and electromyographic (EMG) activity were described previously (Takei and Seki, 2010). Briefly, monkeys were required to grip spring-loaded levers with their index finger and thumb (Fig. 1A). The lever positions were displayed on a computer screen as cursors, and monkeys were required to track targets in a step-tracking task. Each trial consisted of a rest period (1.0–2.0 s), lever grip, lever hold (1.0–2.0 s), and lever release. Successful completion of a trial was rewarded with a drop of applesauce. The force required to reach the target positions was adjusted individually for index finger and thumb (monkey A: 0.4–2.0 N for index, 1.0–3.0 N for thumb; monkey E: 0.6–1.1 N for index, 0.1–0.3 N for thumb; and monkey U: 0.4–0.6 N for index, 0.4–0.6 N for thumb).
Figure 1.
Recording setup and example of recordings. A, Recording configuration. Monkeys were trained to pinch two spring-loaded levers with their index finger and thumb (precision grip task). Spinal neuron and muscle activities were recorded simultaneously. An applesauce reward was given through a feeding straw for every successful trial. B, Recordings during a precision grip task. Grip force exerted by the monkey's index finger and thumb, the rate of change the dF/dt, spinal extracellular recording (Spinal IN), unit discharge timing (Spike) and instantaneous firing rate, and EMG signals (EMG) recorded from the FDI are shown from two successive trials. Red and blue rectangles indicate dynamic and static periods where peak firing rate and mean tonic firing rate were calculated (red: −0.25 to 0.5 s after grip onset; blue: −0.75 to −0.25 s before release onset). C, Averaged response of Spinal IN and EMG activity. The firing rate and EMGs were aligned to grip onset and averaged across trials. The onset timing of PreM-IN and EMG signals was defined as the peak time of the second derivative of the averaged responses (triangles). D, Measurements of rectified EMG spike-triggered averages. Onset was identified at the time point when the peak (or trough) crossed within ±2 SDs of the baseline mean. Onset latency was measured relative to the onset of the triggered neuron action potential. Peak width at half-maximum was measured as the width of the peak (trough) halfway between its maximal (minimal) value and the baseline mean.
Unilateral laminectomy of vertebrae C5–T1 was performed while the animals were anesthetized with isoflurane (1.0–2.0% in 2:1 O2/N2O) or sevoflurane (1.5–3.0% in 2:1 O2/N2O) under aseptic conditions, and a custom-made recording chamber was implanted over the laminectomy (Perlmutter et al., 1998). During the recording, the monkey was seated in a primate chair with the head and upper back restrained. Single-unit activities from C5–T1 were recorded with a Tungsten or Elgiloy microelectrode. Action potentials were isolated from background activities on-line using a spike-sorting device based on a template-matching algorithm (MSD; Alpha Omega Engineering). The quality of isolation was monitored continuously throughout the recording. The stationarity of single-cell activity was checked by inspecting the average rate and task-related firing modulation of each cell. Cells that showed obvious trial-by-trial variance in these parameters were omitted from the study. Off-line, isolation quality was assessed by compiling an interspike interval (ISI) histogram.
EMGs from hand, forearm, and upper arm muscles were recorded simultaneously. For recording of EMGs, pairs of stainless steel wires (AS632, Cooner Wire) were implanted subcutaneously in 20 forelimb muscles of monkeys A and E, including intrinsic hand muscles [first dorsal interosseous (FDI), second DI, third DI, and fourth DI; adductor pollicis (ADP); abductor pollicis brevis (AbPB); abductor digiti minimi (AbDM)], extrinsic hand muscles [flexor digitorum superficialis (FDS), radial part of flexor digitorum profundus (FDPr), ulnar part of flexor digitorum profundus, abductor pollicis longus, extensor digitorum-2,3 (ED23), extensor digitorum-4,5, extensor digitorum communis (EDC)], wrist muscles [flexor carpi radialis, flexor carpi ulnaris (FCU), palmaris longus (PL), extensor carpi radialis longus and brevis, extensor carpi ulnaris (ECU)], and elbow muscles [brachioradialis, pronator teres, biceps brachii (biceps), and triceps brachii (triceps)]. For monkey U, EMG wires were acutely inserted percutaneously into two muscles (FDI and AbDM) on each experimental day. To test the neuron and muscle activities during the task, the data recorded over at least 10 trials for each single unit were included in the present dataset.
Identification of premotor interneurons.
The spike-triggered EMG average (STA) was computed to discriminate PreM-INs from the recorded neural population. Details of the STA method were described previously (Takei and Seki, 2010). Briefly, STAs were compiled off-line for neuron–muscle pairs with at least 2000 recorded action potentials (Fig. 1D). EMG was rectified and averaged over an interval of 80 ms beginning 30 ms before and ending 50 ms after the spike onset. The baseline STA trend was subtracted using the incremented-shifted averages method (Davidson et al., 2007), and then the STA was smoothed with a flat 5-point finite impulse response filter. Significant STA effects were identified with multiple-fragment statistical analysis (Poliakov and Schieber, 1998). The test window was set at a duration of 12 ms between 3 and 15 ms after the spinal neuron spike. Potential cross talk between simultaneously recorded EMGs was evaluated by combining a cross-correlation method (Buys et al., 1986) and the third EMG differentiation (Kilner et al., 2002), and STA effects potentially resulting from cross talk between EMG recordings were eliminated from the present dataset.
Onset latency and peak width at half-maximum (PWHM) were measured to quantify the temporal characteristics of the STAs (Fig. 1D). Onset latency was defined as the time when the averaged EMG crossed a level 2 SDs from the baseline mean (from 10 to 30 ms before the trigger). PWHM of the STA effect was determined by finding the level that was half of the peak amplitude above (or below for a trough) the baseline mean and by measuring the width of the peak (or trough) at this level.
STA effects with appropriate onset latencies and narrow PWHMs reflect relatively direct synaptic input from the trigger neuron to the motoneuron pool producing the recorded EMG (postspike effects). Other STA effects with earlier onset latencies and/or wide PWHMs might reflect additional synaptic inputs to the motoneuron pool synchronized with the trigger neuron spikes (synchrony effects; Schieber and Rivlis, 2005). The earliest possible onset latency of the postspike effects was set at 3.5 ms, which was determined based on our previous investigation (Takei and Seki, 2010). The PWHM criterion depends on the cross-correlation kernels between spinal IN activities. Unfortunately, however, few studies have assessed the correlation in awake behaving monkeys (Prut and Perlmutter, 2003), and there is no clear information regarding the kernel. Therefore, we adopted the PWHM criterion (7–9 ms) from a computer simulation of cortical neurons (Baker and Lemon, 1998). Our primary objective was to evaluate the postspike effects of spinal INs excluding synchrony effects. Therefore, we used the strictest criterion for the cortical neurons (PWHM = 7 ms) to reduce the false-positive postspike effects (but see Smith and Fetz, 2009 for further discussion concerning this criterion). Combined, if a neuron produced postspike effects with an onset latency >3.5 ms and a PWHM <7 ms on at least one muscle, the neuron was identified as a PreM-IN.
Premotor interneuron response patterns.
To characterize PreM-IN response patterns, response histograms were compiled with a bin width of 20 ms, and started 1.5 s before and ended 3 s after grip onset. Grip onset was defined as the time at which the rate of change of the total grip force exceeded 2 N/s, which was calculated as the first derivative of the sum of forces exerted by the index finger and thumb. If the firing rate was continuously above or below >2 SDs baseline activity (i.e., from 1.0 to 1.5 s before grip onset) for >200 ms, the response was significant. Spinal PreM-IN response patterns were categorized as a combination of phasic facilitation/suppression and tonic facilitation/suppression, based on the criteria used for cortical neurons (Cheney and Fetz, 1980; Wannier et al., 1991; Maier et al., 1993). In these previous studies, the sustained activity at the hold period was further categorized into “tonic,” “decrementing,” and “ramp” patterns (summarized in Fetz et al., 2002). In this study, however, we combined them as tonic, as our dataset was relatively small and further categorization may have made it too sensitive to small sampling variations.
Onset latency of significant firing responses was measured by first calculating the instantaneous firing rate, FiringRate(t), as the inverse of the interspike interval:
 |
where ti is the time of the ith spike. The instantaneous firing rate was then low-pass filtered (fourth order, Butterworth, cutoff of 20 Hz) and downsampled to 1000 Hz (Fig. 1B). This allowed us to measure the onset of firing modulation at 1 ms resolution. The instantaneous firing rate was aligned to grip onset (from 1.5 s before to 3.0 s after grip onset) and averaged across trials (Fig. 1C). Response onset was defined as the time when the second derivative of the averaged firing rate was at maximum (or at minimum for decreasing firing patterns) around grip onset, which indicated when the rate of change in the firing rate increased (or decreased) most steeply (Fig. 1C, arrowhead). The firing rate derivative at each time point was calculated as the difference between the averages of the 50 ms intervals preceding and following the time point.
EMG response patterns.
EMG response patterns and onset latency were determined by the same procedure as that used for PreM-IN activity. The recorded EMGs were high-pass filtered (fourth order, Butterworth, cutoff of 5 Hz), rectified, low-pass filtered (fourth order, cutoff of 20 Hz), and then downsampled to 1000 Hz. The response average was compiled by aligning to the grip onset (from 1.5 s before to 3.0 s after grip onset), and then the response pattern was categorized based on the criteria that were used for PreM-IN categorization. The EMG onset was defined as the time when the second derivative of the averaged EMG was at maximum surrounding the grip onset time (Fig. 1C).
Correlation between neural activity and grip force.
The parametric correlation between firing rate and grip force was assessed from trial-by-trial data. The correlation was differentially examined for the dynamic grip period (Fig. 1B, red) and the static hold period (Fig. 1B, blue). These analyses were performed on the unit that showed significant modulation of firing during each behavioral epoch.
To measure correlations during the static hold period, mean firing rate (spikes per second) and mean grip force (newtons) were calculated in the 0.5 s interval during the static hold period, beginning 0.75 s and ending 0.25 s before release onset (Fig. 1B, blue). Release onset was defined as the time when the total force derivative was below −2 N/s. The correlation between firing rate and finger force was assessed by plotting the mean firing rate against the mean force of each trial, and calculating the Pearson's correlation coefficient (r). If the linear correlation was significant according to the t test (p < 0.05), then cell force sensitivity was measured using the slope of the linear regression line in spikes per newton.
To determine the correlations during the dynamic grip period, the peak firing rate (spikes per second) and peak rate of change of dF/dt (newtons per second) were measured in a time window that included 0.25 s before to 0.5 s after grip onset in each trial (Fig. 1A, red). The correlation between peak dF/dt and peak firing rate was assessed, and the significance of the correlation was examined by the t test (p < 0.05).
For neurons that demonstrated a significant firing modulation during the static hold period, the correlation between the firing rate and the EMG activity was also assessed. Mean firing rate and mean EMG activity were calculated in the same 0.5 s static hold period (Fig. 1B, blue), and the correlation between the mean firing rate and the mean EMG amplitude was assessed by calculating the r value. These analyses were performed off-line using MATLAB (MathWorks).
Results
Among the 219 spinal neurons recorded from three monkeys (34 in monkey A, 176 in monkey E, 9 in monkey U), 25 neurons produced 66 significant postspike effects (54 facilitations and 12 suppressions) in hand and arm muscles, and were therefore identified as PreM-INs (20 excitatory and 5 inhibitory). The neurons had either postspike facilitation (PSF) or postspike suppression (PSS) on at least one muscle (2.6 muscles on average); no neuron had both PSF and PSS simultaneously. The ISI histogram showed that very few spikes (0.2% of all spikes) had an ISI <1 ms, indicating that there was almost no contamination from other unit activities. A detailed analysis of the postspike effects of these neurons was reported previously (Takei and Seki, 2010).
PreM-IN response patterns and their target muscles
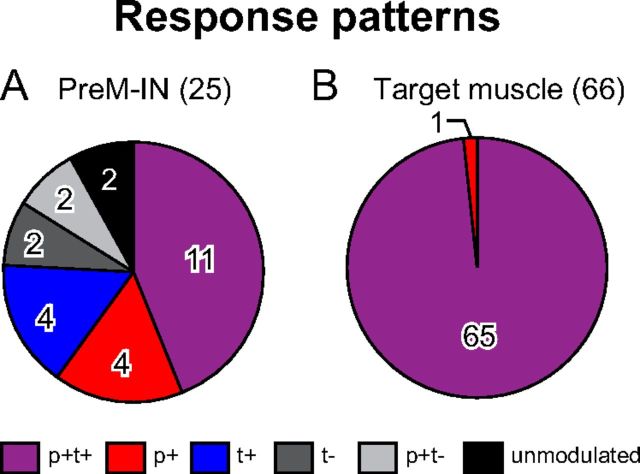
The PreM-INs had a variety of response patterns during precision grip. The most common pattern was a transient increase in firing rate at grip onset that was sustained during the hold period [phasic and tonic facilitation (p+t+); Fig. 2A]. The next most common patterns were pure tonic facilitation (t+; Fig. 2B) and pure phasic facilitation (p+; Fig. 2C). Similar to these neurons, the majority of the PreM-INs showed a significant increase in firing rate during the precision grip task (19/25 cells, 76%). A few neurons decreased their firing rates, such as that shown in Figure 2D. This neuron had clear background activity before the onset of movement and showed phasic facilitation at grip onset following sustained suppression during the hold period (p+t−). The proportions of these response patterns are summarized in Figure 3A and Table 1.
Figure 2.
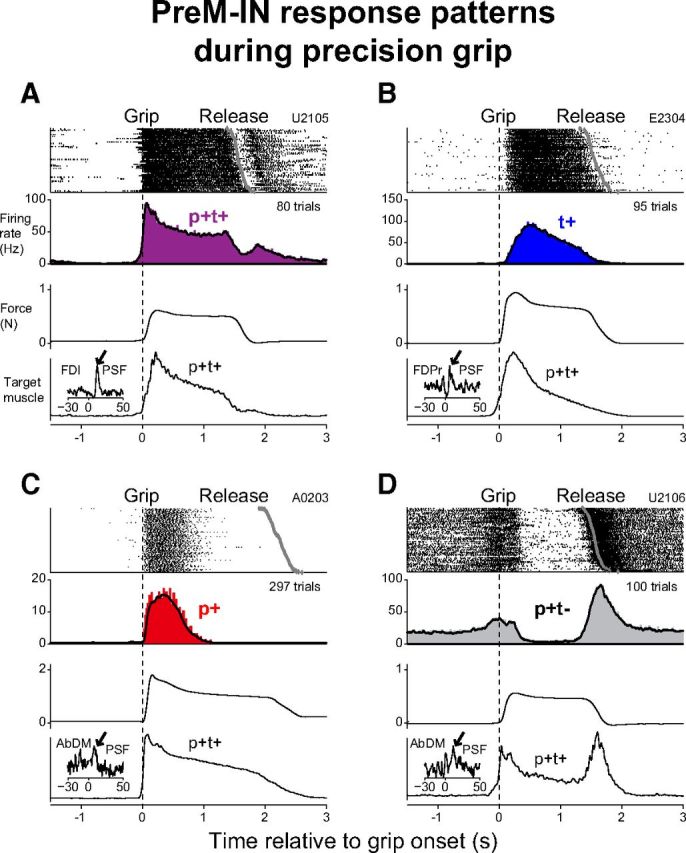
A–D, Examples of four PreM-IN response patterns. In each panel, cell discharge raster plot, histogram of cell discharge (filled rectangles) and averaged instantaneous firing rates (solid line), averaged grip force, and averaged EMG of a target muscle are shown (from top to bottom). Signals were aligned to the grip onset (dotted line). The gray diamonds in the raster plot indicate the timing of release onset. One target muscle is shown for each PreM-IN. Insets indicate the STAs of the corresponding target muscle EMG and significant PSFs are indicated by the arrows. Neurons in A and D were recorded in monkey U, those in B recorded in monkey E, and those in C recorded in monkey A.
Figure 3.
A, B, Proportions of PreM-IN response patterns (A) and their target muscles (B) during a precision grip task.
Table 1.
PreM-IN and target muscle response patterns during precision grip
| Type | PreM-IN |
Target muscle | ||
|---|---|---|---|---|
| Total | Excitatory | Inhibitory | ||
| Total | 25 (100) | 20 (100) | 5 (100) | 66 (100) |
| p+t+ | 11 (44) | 10 (50) | 1 (20) | 65 (98) |
| p+ | 4 (16) | 4 (20) | — | 1 (2) |
| t+ | 4 (16) | 2 (10) | 2 (40) | — |
| t− | 2 (8) | 2 (10) | — | — |
| p+t− | 2 (8) | 2 (10) | — | — |
| Unmodulated | 2 (8) | — | 2 (40) | — |
Numbers in parentheses indicate the percentage of the total in each column.
We then compared the PreM-IN response pattern with the EMG activity of the target muscle, in which each PreM-IN had significant postspike effects. For this purpose, target muscle activity was categorized in the same way as the PreM-INs, and the results show that almost all of the target muscles had a p+t+ activity pattern (Figs. 2, 3B; Table 1). These findings were consistent with the results of previous studies, which showed that hand and arm muscles were typically activated in a p+t+ or t+ pattern during precision grip (Maier et al., 1993; Maier and Hepp-Reymond, 1995). Comparison between PreM-IN response patterns and their target muscles indicated that the PreM-INs had a variety of response patterns (most frequently p+t+, p+, or t+), even though their target muscles were consistently activated in the p+t+ pattern. These contrasting response patterns between PreM-INs and their target muscles suggested that the phasic and tonic control of grip force were substantially separated at the spinal PreM-IN level, but not at the motoneuron level.
Onset latency of PreM-INs relative to their target muscles
To investigate the temporal relationship between the activities of spinal INs and target muscles, we measured the onset latency of the spinal PreM-IN and target muscle activities. Onset was defined as the peak time of the second derivative of response averages (Fig. 1C). Figure 4A shows the response activity PreM-IN population average of each response pattern [p+t+, p+, t+, tonic suppression (t−), or p+t−] together with the average of all target muscle activities. The population averages showed that PreM-INs with a p+ component (p+, p+t+, or p+t−) and those with a t− component tended to start earlier than the grip onset, while the PreM-INs with a t+ component started later. Target muscle activity started almost simultaneously with grip onset (7.9 ± 46.7 ms, mean ± SD). Figure 4B shows the onset latency distribution of PreM-IN activity relative to the onset of their target muscles. On average, PreM-IN activity started −43 ± 81 ms before the onset activity of the target muscle (63 neuron–muscle pairs, Table 2). This result shows that the PreM-IN activity preceded that of the target muscle. As illustrated in Figure 4A, the majority of PreM-INs with a phasic component (p+, p+t+, p+t−) started earlier than the target muscle, while the PreM-INs with pure t+ started about the same time or later than the onset of target muscle activity. One-way ANOVA did not detect significant differences among response pattern onset latencies (F(4,58) = 2.1, p = 0.09), probably due to the large variance of onset distribution. However, when PreM-INs with a p+ component (p+, p+t+, p+t−) were pooled, PreM-INs with a p+ component had a significantly earlier onset latency than the PreM-INs with a pure t+ pattern (−49±81.4 vs 14.7±59.3 ms, t test, p < 0.05; Fig. 4C). The PreM-INs with phasic facilitation components consistently preceded the target muscles (p+, p+t+, p+t−), which suggested that a p+ component contributed to the initiation of target muscle activity. On the other hand, PreM-INs with a pure t+ showed later onset, suggesting that they contribute more to the maintenance of muscle activity and grip force during the static hold period.
Figure 4.
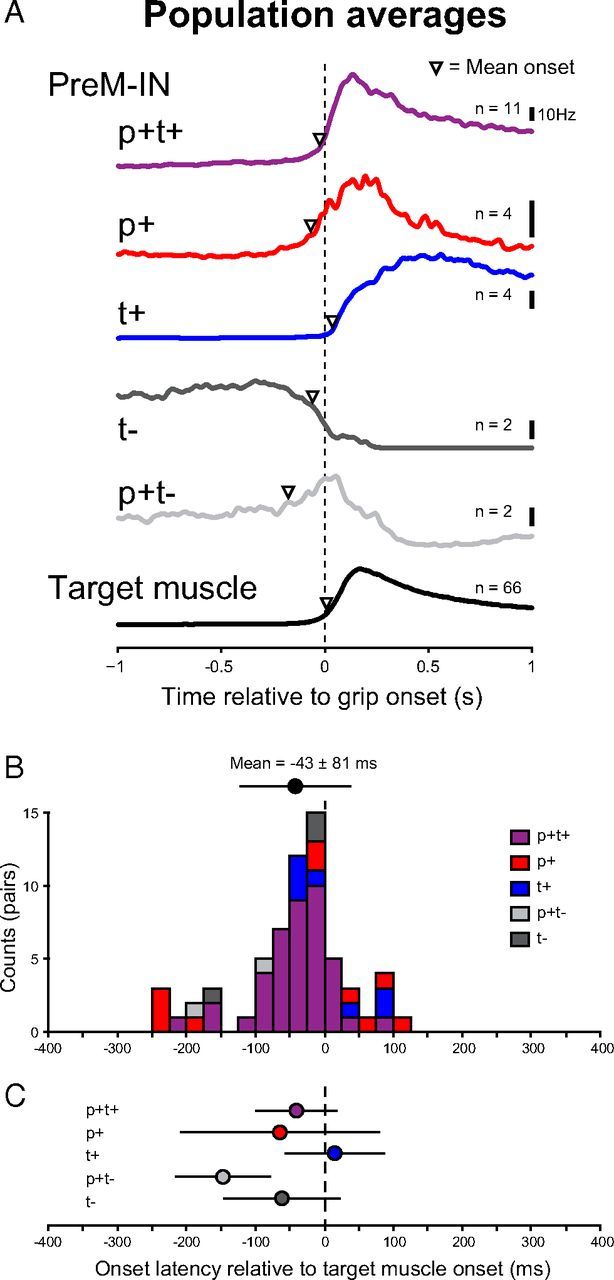
A, Population activities of PreM-INs with p+t+ (11 cells), p+ (4 cells), t+ (4 cells), t− (2 cells), or p+t− (2 cells) response patterns, together with the average of all target muscle activities (66 muscles). The activities are aligned with grip onset. Mean onset timing is indicated by the open triangle. B, Histogram of onset latencies of PreM-IN activity relative to the onset of target muscle activity. Upper circles and error bars indicate mean ± SD of onset latency of the all PreM-INs that exhibited significant modulation (n = 23). C, Mean onset latencies for PreM-INs separated by response pattern. The circles and error bars indicate mean ± SD.
Table 2.
PreM-IN onset latency relative to target muscle onset
| Type | All | Excitatory | Inhibitory |
|---|---|---|---|
| Total | −43 ± 81 (63) | −46 ± 86 (54) | −26 ± 41 (9) |
| p+t+ | −41 ± 56 (41) | −41 ± 59 (35) | −40 ± 35 (6) |
| p+ | −65 ± 145 (10) | −65 ± 145 (10) | — |
| t+ | 15 ± 59 (7) | 25 ± 73 (4) | 1 ± 45 (3) |
| t− | −62 ± 85 (3) | −62 ± 85 (3) | — |
| p+t− | −147 ± 69 (2) | −147 ± 69 (2) | — |
Mean ± SD numbers in parentheses indicate the number of neuron–muscle pairs.
In addition, the neurons with t− components had an onset that preceded that of the target muscle. Given that they all had excitatory postspike effects on target muscles (Table 1), this firing pattern may reflect the elimination of an excess facilitatory effect on target motoneurons before onset of muscle activity.
Location of PreM-INs with different response patterns
As separate PreM-IN populations could be involved in either the dynamic or static phases of precision grip, we wished to determine whether these populations were separately organized within the spinal cord (Sher et al., 2010). Therefore, we compared the spatial distributions of the PreM-INs with p+t+, p+, and t+ patterns, which were the most common response patterns. PreM-IN depth was measured relative to the location where the first cellular activity was recorded in each penetration (Takei and Seki, 2008, 2010), and the distribution along the dorsoventral axis was compared among the response patterns (Fig. 5). PreM-IN depth was significantly different among the groups (one-way ANOVA, F(2,16) = 3.9, p < 0.05). The PreM-INs with a p+ pattern were located in a more ventral position (red circles), while t+ neurons were located in the dorsal portion (blue circles); their distributions did not overlap. These observations suggested that PreM-INs involved in the dynamic and static phases of precision grip were spatially segregated within the spinal cord. Interestingly, the PreM-INs with a p+t+ pattern exhibited a wider distribution and straddled the localization of the p+ and t+ neurons (purple circles). These results indicate that dynamic and static control systems were represented in separate groups of spinal INs, and they overlapped in PreM-INs with a p+t+ pattern.
Figure 5.
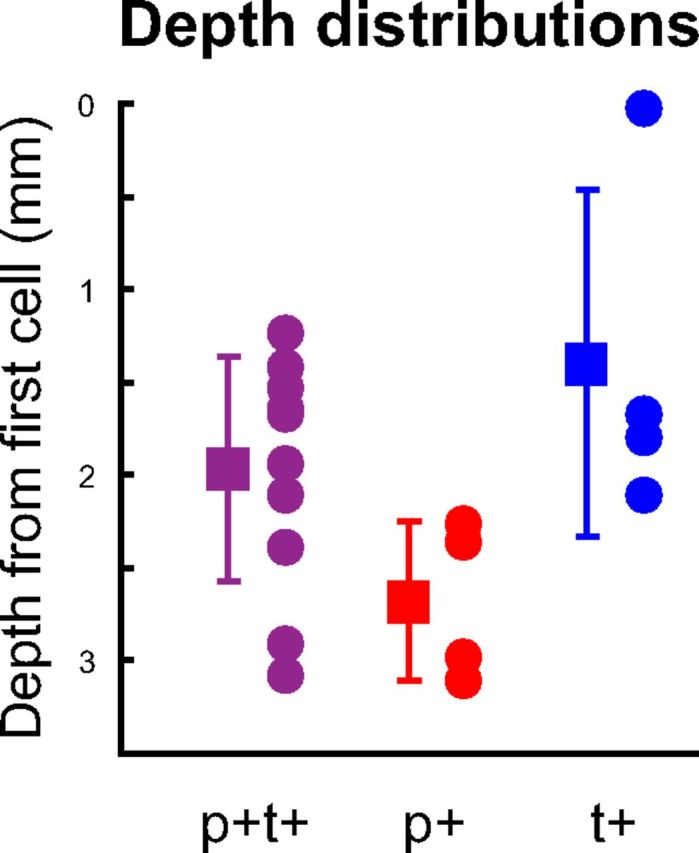
Distribution of the PreM-IN intraspinal depth relative to the first cell, shown separately for PreM-INs with p+t+ (purple), pure p+ (red), and pure t+ (blue) response patterns. Squares and error bars indicate the mean ± SD.
Correlation of PreM-IN firing with grip force and dF/dt
To investigate the contributions of PreM-IN phasic and tonic activities to the dynamic and static phases of force output further, we examined the correlations between PreM-IN firing and exerted grip force (Fig. 6) or the rate of change of dF/dt (Fig. 7). We first tested the linear correlation between the mean firing rate and mean force for the PreM-INs with t+ components (15 PreM-INs: 11 p+t+ and 4 t+ neurons). A typical example of a PreM-IN is shown in Figure 6. The grip force and PreM-IN firing during three trial examples are shown. The mean grip force and the PreM-IN mean firing rate were calculated during a 0.5 s period of the steady hold period in each trial (Fig. 6A, gray areas). Scatter plots of the mean firing rate versus the mean force demonstrated that the firing rate was significantly correlated with the grip force (r = 0.36, p < 0.001), with a rate-force slope of 183 Hz/N (Fig. 6B). Among the 15 PreM-INs with a t+ component, 4 PreM-INs (27%) showed a significant correlation with grip force (Table 3); the number of significantly correlated INs exceeded the level of chance (binomial test, p < 0.0001). The correlation between mean firing rate and mean force was also tested for PreM-INs with t− components (four PreM-INs: two p+t− and two t− neurons). In contrast to the PreM-INs with a t+ pattern, none of the PreM-INs with a t− pattern showed a significant correlation with static grip force.
Figure 6.
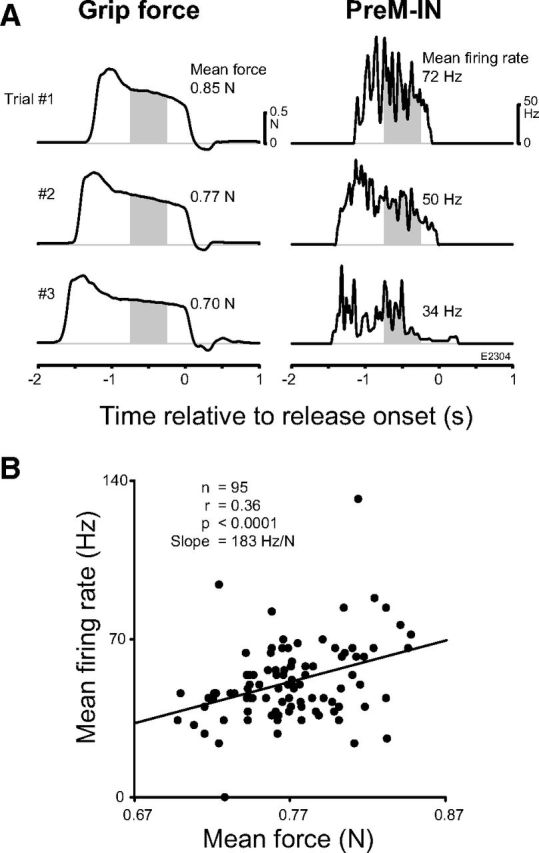
Example of the correlation between the tonic firing rate of a PreM-IN and static grip force. A, Three example trials showing the grip force (left) and instantaneous firing rate of a PreM-IN (right). The shaded areas indicate the time window where mean force and mean firing rate were calculated. B, Scatter plot of mean firing rate versus mean grip force of the IN shown in A. The solid line indicates the regression line.
Figure 7.
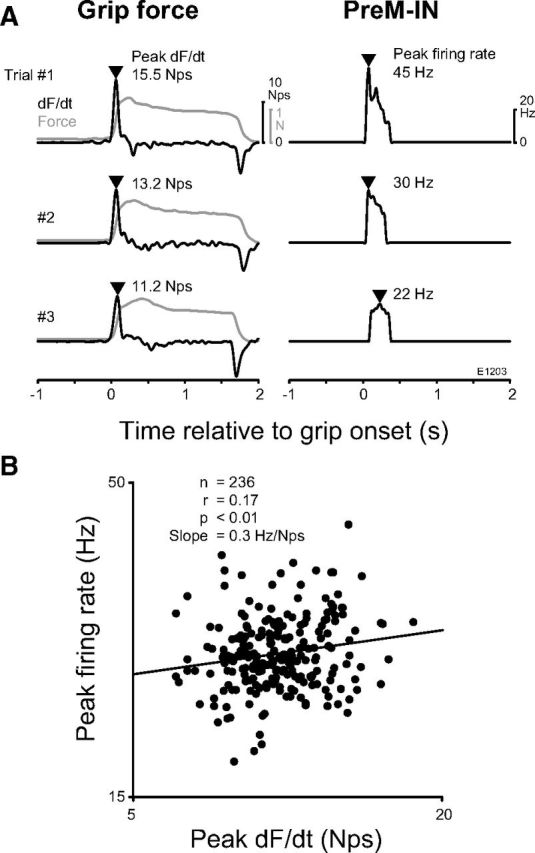
Example of the correlation between the peak firing rate and the peak dF/dt. A, Three example trials showing the dF/dt (left, solid line), the grip force (left, gray line), and instantaneous firing rate of a PreM-IN (right). The triangles indicate the peak timings of the dF/dt and the PreM-IN firing rate. B, Scatter plot of the peak firing rate versus the peak dF/dt. The solid line indicates the regression line.
Table 3.
Correlations between tonic firing rate and static force or muscle activity
| n | r | Slope (Hz/N) | |
|---|---|---|---|
| Neuron–force correlation | |||
| Total (15) | 4 | 0.35 ± 0.10 | 90 ± 68 |
| Excitatory (12) | 3 | 0.40 ± 0.04 | 88 ± 83 |
| Inhibitory (3) | 1 | 0.21 | 96 |
| Neuron–muscle correlation | |||
| Target muscle | |||
| Total (48) | 11 | 0.39 ± 0.17 | — |
| Excitatory (39) | 10 | 0.41 ± 0.17 | — |
| Inhibitory (9) | 1 | 0.21 | — |
| Non-target muscle | |||
| Total (246) | 54 | 0.23 ± 0.18 | — |
| Excitatory (192) | 42 | 0.25 ± 0.17 | — |
| Inhibitory (54) | 12 | 0.16 ± 0.19 | — |
A similar analysis was performed for PreM-INs with p+ components (17 PreM-INs: 11 p+t+, 4 p+, and 2 p+t− neurons). The peak instantaneous firing rate and peak dF/dt were measured in each trial (Fig. 7A, arrowheads), and they were plotted in a scatter plot (Fig. 7B). The scatter plot showed a significant positive correlation (r = 0.17, p < 0.01) between the peak firing and peak dF/dt. A significant correlation with peak dF/dt was found in 4 of 17 PreM-INs (24%; Table 4), and again the number of correlated INs was significantly above the level of chance (binomial test, p < 0.01).
Table 4.
Correlations between peak firing rate and peak dF/dt
| Neuron–force correlation | n | r | Slope (Hz per N/s) |
|---|---|---|---|
| Total (17) | 4 | 0.21 ± 0.06 | 2.8 ± 2.1 |
| Excitatory (16) | 4 | 0.21 ± 0.06 | 2.8 ± 2.1 |
| Inhibitory (1) | 0 | — | — |
Correlation of PreM-IN firing with target and non-target muscle activity
For the INs with t+ components, we further examined the correlation between the IN firing rate and target or non-target muscle activity during the static hold period. The single neuron shown in Figure 8A–G had postspike facilitation in the FDPr (Fig. 8B), but not in the FDS (Fig. 8E). The relationship between PreM-IN and these muscles is illustrated in Figure 8A. Figure 8, D and G, shows the correlation between the mean firing rate and the mean EMG amplitude of FDPr and FDS, respectively. A scatter plot showed that the firing rate of this IN was significantly correlated with FDPr activity on a trial-to-trial basis (Fig. 8D; r = 0.38, p < 0.001), but not with FDS (Fig. 8G; r = −0.09, p = 0.38), even though FDPr (target muscle) and FDS (non-target muscle) had similar p+t+ response patterns during precision grip (Fig. 8C,F).
Figure 8.
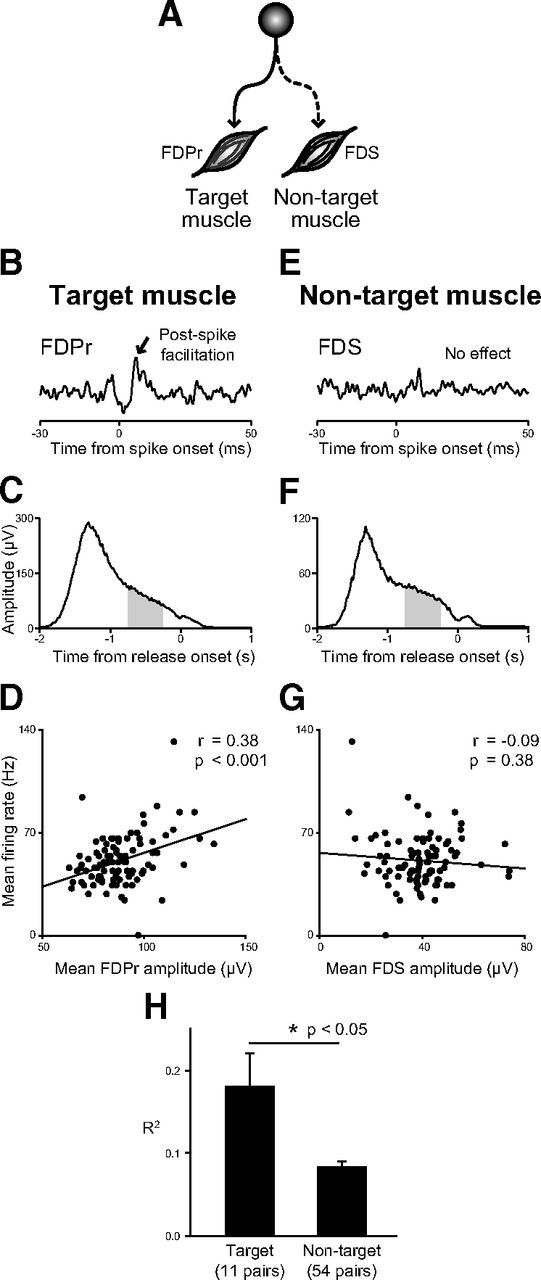
Example of the correlation between the tonic firing rate and static target muscle activity (B–D) and non-target muscle activity (E–G). A, Schematic illustrations showing the estimated connection of the PreM-IN with the FDPr and the FDS. B, E, STA of FDPr (B) and FDS (E) triggered by the same PreM-IN. The PreM-IN showed a significant PSF (arrow) in FDPr (target muscle), but not in FDS (non-target muscle). C, F, Response average of FDPr and FDS aligned with release onset, with the gray areas indicating the time window analyzed. D, G, Scatter plot of mean firing rate versus mean FDPr or FDS amplitude. The solid line indicates the regression line. The firing rate had a significant correlation with the target muscle (FDPr), but not with the non-target muscle (FDS). H, Comparison of the correlation between PreM-IN firing rate with target and non-target muscles. The r2 was averaged for the pairs with the target muscle (11 pairs) and the pairs with the non-target muscle (54 pairs), with significant correlations.
Among 48 pairs of PreM-INs and target muscles, 11 pairs (23%) showed significant correlations, while 54 of 246 pairs (22%) of PreM-INs and non-target muscles showed significant correlations. The r2 was then compared between pairs with target muscle and non-target muscle. The correlation coefficient was significantly higher for the pairs with target muscle than the pairs with non-target muscles (t test, p < 0.05; Fig. 8H). This result suggests that PreM-IN activity modulated target muscle activity by producing postspike effects. Together, these observations suggest that PreM-IN postspike effects may contribute to the generation of hand muscle activity and then the production of finger grip force during the precision grip task.
Discussion
In this study, we explored the contribution of spinal PreM-INs to precision grip control by examining their firing activity during precision grip and correlation with grip force. Previous studies on the control of precision grip focused exclusively on supraspinal motor structures, particularly CM connections, from motor cortex to spinal motoneurons (for review, see Lemon, 2008). Our previous study identified PreM-INs that had postspike effects on hand muscles during precision grip (Takei and Seki, 2010), but their contribution to the generation of muscle activity and grip force remained unclear.
Here, we showed that spinal PreM-INs located in cervical segments significantly modulated their activity during the dynamic and static phases of precision grip (phasic and tonic activities), and some of the phasic and tonic activities were correlated with the rate of change of dF/dt and static finger force, respectively. These results indicated that the neural pathway mediated by the spinal PreM-INs, together with the CM pathway, makes a significant contribution to the control of precision grip in primates.
Phasic and tonic activity during precision grip
Most PreM-INs that had postspike effects on hand or arm muscles showed significant modulation of their firing rates during a precision grip task (23/25 cells, 92%). The majority of the cells had phasic and tonic facilitation patterns (p+t+, 11/23 cells; Fig. 3A). As all of the target muscles showed similar p+t+ activity (41/41 pairs; Fig. 3B), it is likely that the activities of these PreM-INs are involved in the generation of the target muscle activity by driving target motoneurons. It should also be noted that a significant PreM-IN population displayed activity that only partly matched their target muscles, i.e., some PreM-INs showed pure phasic or tonic facilitation even though their target muscles were activated in a p+t+ pattern (Fig. 2B,C). Similar phasic and tonic neuronal activities during precision grip were observed in several supraspinal motor structures, including primary and sensory cortex (Smith et al., 1975; Hepp-Reymond et al., 1978; Wannier et al., 1991; Maier et al., 1993; Salimi et al., 1999), cerebellar cortex (Smith and Bourbonnais, 1981), the “motor” thalamus, and the globus pallidus (Anner-Baratti et al., 1986). These observations suggest that precision grip may be controlled by two distinct neural populations in the CNS, which are predominantly responsible for either force initiation or force maintenance.
Comparison between primary motor cortex (M1) neurons and spinal cord neurons may be appropriate to show the relevance of this hypothesis. For example, phasic activity of M1 neurons precedes the onset of force change and EMG activities (Smith et al., 1975; Wannier et al., 1991), and the peak firing rate is correlated with the first derivative of the exerted dF/dt (Smith et al., 1975), suggesting that the phasic activity of M1 neurons primarily contributes to the initiation of grip force. On the other hand, M1 neurons with pure tonic activity are recruited later (Smith et al., 1975; Wannier et al., 1991) and the tonic firing rate is correlated with static grip force (Smith et al., 1975; Wannier et al., 1991) as well as static muscle activity (Maier et al., 1993), suggesting that tonic activity could contribute to steady maintenance of the grip force. Spinal PreM-INs with phasic and tonic activity had similar characteristics. PreM-INs with a p+ component had an earlier onset, which mostly preceded the target muscle activity (Fig. 4), and the peak firing rate of some neurons was correlated with the peak dF/dt (Fig. 7). PreM-INs with a t+ component had a later onset (Fig. 4), and the mean firing rate in the hold phase was correlated with the mean force (Fig. 6) and mean target muscle activity (Fig. 8). These similarities between M1 and spinal neurons suggest that the separate neural populations are linked and involved in the control of dynamic and static aspects of precision grip, respectively.
Comparison of activity patterns between M1 and spinal cord during precision grip
Due to the similarities between M1 and spinal neurons, it may be expected that spinal interneurons function to simply “relay” neural activity from the motor cortex to spinal motoneurons. However, the proportion of the response patterns suggested substantial differences between the spinal and motor cortex neurons. Figure 9A presents a comparison of the response patterns of M1 neurons during a precision grip task, which were reported in previous studies [pyramidal tract neurons (PTNs), Smith et al., 1975; unidentified neurons (UIDs), Wannier et al., 1991; CM cells, Maier et al., 1993], as well as spinal PreM-IN and the target muscle activities recorded in the present study. In general, all categories of neurons had similar response patterns, including p+, t+, p+t+, and other patterns (except for p+ of CM cells). However, the proportion was different between the categories of neurons—the p+t+ proportion gradually increased when the neural population was closer to the motor output. Among the UIDs, which included all types of M1 neuron, the most common patterns were p+ (20%) and t+ patterns (19%); few neurons had a p+t+ pattern (8%), suggesting that most UIDs were separately involved in the dynamic or static control of precision grip. PTNs, which have corticospinal connections, had a higher prevalence of the p+t+ pattern (23%). The prevalence of p+t+ patterns was more prominent in CM cells, which have postspike effects on spinal motoneurons (p+t+: 55%). Similarly, our results show that spinal PreM-INs predominantly had a p+t+ pattern. Finally, almost all target muscles had p+t+ activity. As illustrated in the hypothetical schema (Fig. 9B), this gradual increase in a “muscle-like” activity pattern (i.e., more p+t+ neurons found in the neural population closer to the motor output) suggests that phasic and tonic activities could be converged and integrated to p+t+ activity along the stream of cortical motor output. This gradual p+t+ pattern increase suggests that spinal PreM-INs do not just relay the descending activity, but that they integrate dynamic and static motor commands.
Figure 9.
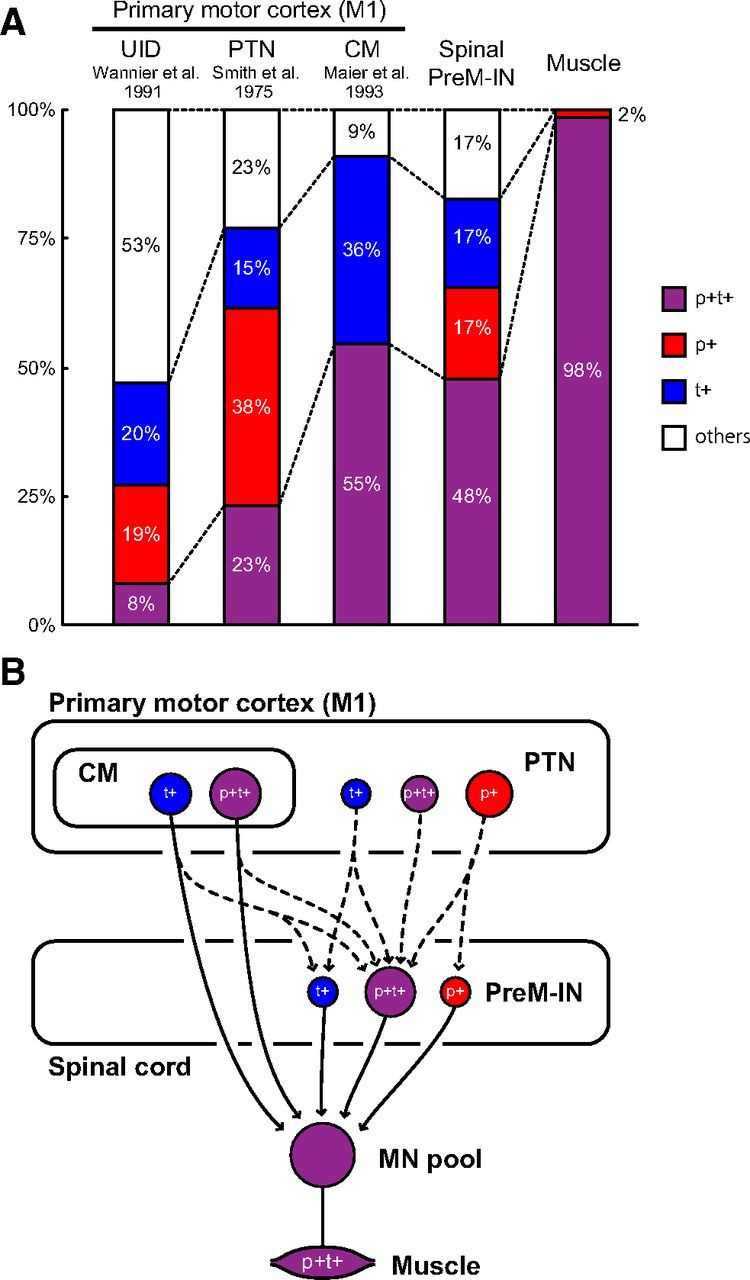
A, Summary of response patterns for different populations of neurons during precision grip task. Proportions are given for spinal PreM-INs, UID neurons in M1 (Wannier et al., 1991), and PTNs in M1 (Smith et al., 1975), and CM cells in M1 (Maier et al., 1993). Note that the t+ components of CM cells and PTNs include other sustained activities during a hold period, i.e., “ramp” and “decrementing” patterns. The proportion of spinal PreM-IN target muscle results is also shown. B, A schematic illustration for possible functional connections. The dashed lines indicate connections not tested in this study. The gradual increase in the proportion of a muscle-like activity pattern (p+t+) suggests that the phasic and tonic activities could be converged and integrated at each neural level.
The hypothesis that the phasic and tonic activities of supraspinal neurons converge in spinal PreM-INs was further supported by the intraspinal distribution of PreM-INs with p+, t+, and p+t+ patterns. We found that the intraspinal locations of PreM-INs with p+ and t+ patterns were segregated into the ventral and dorsal portions, respectively, while the p+t+ pattern neurons were distributed from the ventral to the dorsal halves and straddled the distribution of the p+ neurons and t+ neurons (Fig. 5). This topographic localization suggests that parts of the phasic and tonic activities of supraspinal neurons project to two distinct groups of spinal INs [i.e., p+ PreM-INs (ventral) and the t+ (dorsal)], and that other neurons converge onto another group of INs (i.e., p+t+ PreM-INs) and integrate dynamic and static motor commands at the spinal premotor level.
In addition, the onset latency of the spinal IN activity relative to the target muscle activity further supports the occurrence of integration of descending commands at the spinal level. The average onset latency of PreM-IN was 43 ms (Fig. 4), which was much longer than the onset latency of their postspike effects on the target muscles (7–8 ms) (Takei and Seki, 2010). This difference indicates that the synaptic effects of the PreM-INs activity do not immediately recruit target motoneuron pools, but that they require considerable further processing to activate target motoneurons. At this time, the activation of other premotor systems has already started; the average onset latencies relative to the target muscle EMG are 54 and 96 ms for CM and rubromotoneuronal (RM) cells, respectively (Cheney and Fetz, 1980; Cheney et al., 1988). This comparison indicates that the spinal PreM-INs are activated concurrently with the CM and RM neurons, suggesting that PreM-INs are involved in the process that defines the final pattern of muscle activity in concert with other premotor systems.
Comparison of PreM-IN activity between the precision grip and alternate wrist movement tasks
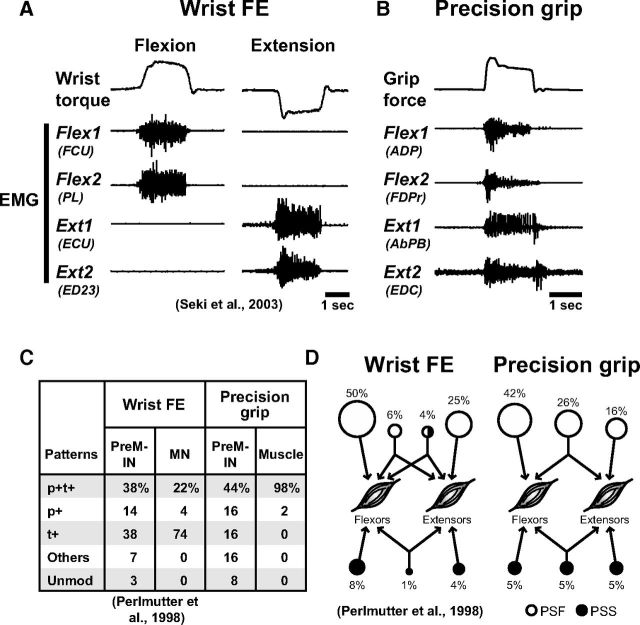
The activity of PreM-INs has been studied for wrist flexion and extension (FE) movement (wrist FE task) (Maier et al., 1998; Perlmutter et al., 1998; Fetz et al., 2002; Seki et al., 2003). Recordings of muscle activities revealed the characteristic differences in these two tasks (Fig. 10A); the alternate wrist FE movement was characterized as a clear reciprocal relationship between forearm flexors and extensors, while the grasping movement was characterized as broad coactivation of flexor and extensor muscles (Long et al., 1970; Smith, 1981; Maier and Hepp-Reymond, 1995) (Fig. 10B). Therefore, we explored the possible differences in spinal PreM-INs involved in the two tasks. First, we compared the proportion of the response patterns (Fig. 10C). In general, the pattern of PreM-IN activity was similar; p+t+, p+, and t+ were the most common. However, the relative proportions differed; t+ was more prominent for the wrist FE task (38%) and p+t+ was more prominent for the precision grip task (44%). This difference may reflect the difference in motor unit (or muscle) activity during both tasks; most motor unit activity showed the t+ pattern in the wrist FE task, while almost all of the target muscles showed p+t+ in our precision grip task. This suggested that PreM-INs showed “muscle-like” activity for each task. Next, we compared the distribution of postspike effects on flexor and extensor muscles. In the wrist FE task, the PreM-IN tended to have postspike effects on either the flexor or extensor muscles (flexors, 58%; extensors, 29%), and a smaller proportion of PreM-INs had postspike effects on both concurrently (11%). Conversely, in the precision grip, a greater proportion of the PreM-INs had postspike effects concurrently on the flexor and extensor muscles (31%), and the relative proportion differed significantly between the two tasks (χ2 test, p = 0.024). These results suggested that the basic activity pattern of PreM-INs did not differ between the wrist FE and precision grip tasks, but that the output effects of the recruited PreM-INs to wrist muscles or hand muscles differed in their nature.
Figure 10.
Comparison between a wrist FE and a precision grip task. A, B, Muscle activities in a single trial during a wrist FE task (A) and a precision grip task (B). Wrist torque and grip force (top), two flexor EMGs (Flex1 and Flex2), and two extensor EMGs (Ext1 and Ext2). The names of the muscles are shown in parentheses. Note that the digit adductor (ADP) and abductor (AbPB) are categorized as flexors and extensors, respectively, based on their action on the thumb. C, The proportions of response patterns of PreM-INs for each task, compared with motoneurons (MNs, wrist FE task) or target muscles (precision grip task). Unmod, Unmodulated. D, Distributions of postspike effects on the flexors (including flexors and adductors) and extensors (including extensors and abductors) tested in each task: PSF (open circles) and PSS (filled circles). The percentages of PreM-INs are depicted by the relative sizes of the respective circles. The data for the wrist FE task are from Seki et al. (2003) (A) and Perlmutter et al. (1998) (C, D).
Correlation between PreM-IN activity and grip force
As PreM-INs have relatively direct synaptic effects on target muscles, we expected that their firing activities would have a parametric correlation with the target muscle activity and precision grip force. Our results actually show that a considerable proportion of PreM-INs with p+ and t+ activity patterns were significantly correlated with dF/dt (4/15) and static force (4/17), respectively. As these PreM-INs had postspike effects on the hand muscles, this population may be smaller than initially expected. This smaller correlation could be ascribed to an underestimation of the correlation between grip force and neural firing activity due to our behavioral protocol. The trial-to-trial variation in grip force generated by our monkeys (0.1–0.2 N) was relatively small in comparison with an earlier study (Maier et al., 1993, their Fig. 6). Therefore, this smaller variation in grip force may cause underestimation of the correlations of PreM-IN firing and grip force. Despite the possible underestimation, the number of significant correlated neurons exceeded the level of chance (binomial test, p < 0.0001 and p < 0.01 for static and dynamic correlated neurons, respectively). Therefore, we concluded that the PreM-INs showed significant correlations with static and dynamic forces. In addition, we found that the correlations between PreM-IN firing rate and static force or peak dF/dt were exclusively positive, regardless of the fact that both excitatory and inhibitory INs were included in the PreM-INs. These observations indicated that the firing rates of excitatory and inhibitory PreM-INs were coactively recruited with increasing grip force. The finding that inhibitory PreM-INs are coactivated with the target muscles they inhibit was also observed for wrist FE movements (Perlmutter et al., 1998, their Fig. 12). The coactivation of the excitatory and inhibitory inputs to spinal motoneurons was consistent with the phenomenon known as balanced inhibition and excitation, which is assumed to regulate the response gain of the target motoneurons (Chance et al., 2002; Berg et al., 2007; Kristan, 2007).
Conclusions
In conclusion, we found that spinal PreM-INs located in the C6–T1 segments significantly modulated their activity during dynamic and static phases of precision grip (phasic and tonic activity), and the phasic and tonic activities were correlated with dF/dt and static finger force, respectively. These results clearly indicate that the neural pathway mediated by the spinal PreM-INs, together with the CM pathway, makes a significant contribution to the control of precision grip in primates.
Footnotes
This work was supported by Grants-in-Aid 18020030 and 18047027 for Scientific Research on Priority Areas (Mobilligence and System Study on Higher-Order Brain Function) from the Ministry of Education, Culture, Sports, Science and Technology of Japan (MEXT); Grants-in-Aid 21700437 and 23700482 for Young Scientists (B) from MEXT; and the Japan Science and Technology Agency Precursory Research for Embryonic Science and Technology program. We thank Nobuaki Takahashi (National Institute for Physiological Sciences) for technical assistance.
The authors declare no competing financial interests.
References
- Alstermark B, Pettersson LG, Nishimura Y, Yoshino-Saito K, Tsuboi F, Takahashi M, Isa T. Motor command for precision grip in the macaque monkey can be mediated by spinal interneurons. J Neurophysiol. 2011;106:122–126. doi: 10.1152/jn.00089.2011. [DOI] [PubMed] [Google Scholar]
- Anner-Baratti R, Allum JH, Hepp-Reymond MC. Neural correlates of isometric force in the “motor” thalamus. Exp Brain Res. 1986;63:567–580. doi: 10.1007/BF00237479. [DOI] [PubMed] [Google Scholar]
- Baker SN, Lemon RN. Computer simulation of post-spike facilitation in spike-triggered averages of rectified EMG. J Neurophysiol. 1998;80:1391–1406. doi: 10.1152/jn.1998.80.3.1391. [DOI] [PubMed] [Google Scholar]
- Berg RW, Alaburda A, Hounsgaard J. Balanced inhibition and excitation drive spike activity in spinal half-centers. Science. 2007;315:390–393. doi: 10.1126/science.1134960. [DOI] [PubMed] [Google Scholar]
- Bortoff GA, Strick PL. Corticospinal terminations in two new-world primates: further evidence that corticomotoneuronal connections provide part of the neural substrate for manual dexterity. J Neurosci. 1993;13:5105–5118. doi: 10.1523/JNEUROSCI.13-12-05105.1993. [DOI] [PMC free article] [PubMed] [Google Scholar]
- Buys EJ, Lemon RN, Mantel GW, Muir RB. Selective facilitation of different hand muscles by single corticospinal neurones in the conscious monkey. J Physiol. 1986;381:529–549. doi: 10.1113/jphysiol.1986.sp016342. [DOI] [PMC free article] [PubMed] [Google Scholar]
- Chance FS, Abbott LF, Reyes AD. Gain modulation from background synaptic input. Neuron. 2002;35:773–782. doi: 10.1016/S0896-6273(02)00820-6. [DOI] [PubMed] [Google Scholar]
- Cheney PD, Fetz EE. Functional classes of primate corticomotoneuronal cells and their relation to active force. J Neurophysiol. 1980;44:773–791. doi: 10.1152/jn.1980.44.4.773. [DOI] [PubMed] [Google Scholar]
- Cheney PD, Mewes K, Fetz EE. Encoding of motor parameters by corticomotoneuronal (CM) and rubromotoneuronal (RM) cells producing postspike facilitation of forelimb muscles in the behaving monkey. Behav Brain Res. 1988;28:181–191. doi: 10.1016/0166-4328(88)90095-2. [DOI] [PubMed] [Google Scholar]
- Davidson AG, O'Dell R, Chan V, Schieber MH. Comparing effects in spike-triggered averages of rectified EMG across different behaviors. J Neurosci Methods. 2007;163:283–294. doi: 10.1016/j.jneumeth.2007.03.010. [DOI] [PMC free article] [PubMed] [Google Scholar]
- Fetz EE, Perlmutter SI, Prut Y, Seki K, Votaw S. Roles of primate spinal interneurons in preparation and execution of voluntary hand movement. Brain Res Brain Res Rev. 2002;40:53–65. doi: 10.1016/S0165-0173(02)00188-1. [DOI] [PubMed] [Google Scholar]
- Heffner RS, Masterton RB. The role of the corticospinal tract in the evolution of human digital dexterity. Brain Behav Evol. 1983;23:165–183. doi: 10.1159/000121494. [DOI] [PubMed] [Google Scholar]
- Hepp-Reymond MC, Wyss UR, Anner R. Neuronal coding of static force in the primate motor cortex. J Physiol Paris. 1978;74:287–291. [PubMed] [Google Scholar]
- Isa T, Ohki Y, Alstermark B, Pettersson L-G, Sasaki S. Direct and indirect cortico-motoneuronal pathways and control of hand/arm movements. Physiology (Bethesda) 2007;22:145–152. doi: 10.1152/physiol.00045.2006. [DOI] [PubMed] [Google Scholar]
- Kilner JM, Baker SN, Lemon RN. A novel algorithm to remove electrical cross-talk between surface EMG recordings and its application to the measurement of short-term synchronisation in humans. J Physiol. 2002;538:919–930. doi: 10.1113/jphysiol.2001.012950. [DOI] [PMC free article] [PubMed] [Google Scholar]
- Kinoshita M, Matsui R, Kato S, Hasegawa T, Kasahara H, Isa K, Watakabe A, Yamamori T, Nishimura Y, Alstermark B, Watanabe D, Kobayashi K, Isa T. Genetic dissection of the circuit for hand dexterity in primates. Nature. 2012;487:235–238. doi: 10.1038/nature11206. [DOI] [PubMed] [Google Scholar]
- Kristan WB. Neuroscience. A push-me pull-you neural design. Science. 2007;315:339–340. doi: 10.1126/science.1138110. [DOI] [PubMed] [Google Scholar]
- Lemon RN. Descending pathways in motor control. Annu Rev Neurosci. 2008;31:195–218. doi: 10.1146/annurev.neuro.31.060407.125547. [DOI] [PubMed] [Google Scholar]
- Long C, 2nd, Conrad PW, Hall EA, Furler SL. Intrinsic-extrinsic muscle control of the hand in power grip and precision handling. An electromyographic study. J Bone Joint Surg Am. 1970;52:853–867. [PubMed] [Google Scholar]
- Maier MA, Hepp-Reymond MC. EMG activation patterns during force production in precision grip. I. Contribution of 15 finger muscles to isometric force. Exp Brain Res. 1995;103:108–122. doi: 10.1007/BF00241969. [DOI] [PubMed] [Google Scholar]
- Maier MA, Bennett KM, Hepp-Reymond MC, Lemon RN. Contribution of the monkey corticomotoneuronal system to the control of force in precision grip. J Neurophysiol. 1993;69:772–785. doi: 10.1152/jn.1993.69.3.772. [DOI] [PubMed] [Google Scholar]
- Maier MA, Perlmutter SI, Fetz EE. Response patterns and force relations of monkey spinal interneurons during active wrist movement. J Neurophysiol. 1998;80:2495–2513. doi: 10.1152/jn.1998.80.5.2495. [DOI] [PubMed] [Google Scholar]
- Muir RB, Lemon RN. Corticospinal neurons with a special role in precision grip. Brain Res. 1983;261:312–316. doi: 10.1016/0006-8993(83)90635-2. [DOI] [PubMed] [Google Scholar]
- Perlmutter SI, Maier MA, Fetz EE. Activity of spinal interneurons and their effects on forearm muscles during voluntary wrist movements in the monkey. J Neurophysiol. 1998;80:2475–2494. doi: 10.1152/jn.1998.80.5.2475. [DOI] [PubMed] [Google Scholar]
- Poliakov AV, Schieber MH. Multiple fragment statistical analysis of post-spike effects in spike-triggered averages of rectified EMG. J Neurosci Methods. 1998;79:143–150. doi: 10.1016/S0165-0270(97)00172-6. [DOI] [PubMed] [Google Scholar]
- Prut Y, Perlmutter SI. Firing properties of spinal interneurons during voluntary movement. II. Interactions between spinal neurons. J Neurosci. 2003;23:9611–9619. doi: 10.1523/JNEUROSCI.23-29-09611.2003. [DOI] [PMC free article] [PubMed] [Google Scholar]
- Ralston DD, Ralston HJ., 3rd The terminations of corticospinal tract axons in the macaque monkey. J Comp Neurol. 1985;242:325–337. doi: 10.1002/cne.902420303. [DOI] [PubMed] [Google Scholar]
- Rathelot JA, Strick PL. Subdivisions of primary motor cortex based on cortico-motoneuronal cells. Proc Natl Acad Sci U S A. 2009;106:918–923. doi: 10.1073/pnas.0808362106. [DOI] [PMC free article] [PubMed] [Google Scholar]
- Salimi I, Brochier T, Smith AM. Neuronal activity in somatosensory cortex of monkeys using a precision grip. I. Receptive fields and discharge patterns. J Neurophysiol. 1999;81:825–834. doi: 10.1152/jn.1999.81.2.825. [DOI] [PubMed] [Google Scholar]
- Schieber MH, Rivlis G. A spectrum from pure post-spike effects to synchrony effects in spike-triggered averages of electromyographic activity during skilled finger movements. J Neurophysiol. 2005;94:3325–3341. doi: 10.1152/jn.00007.2005. [DOI] [PubMed] [Google Scholar]
- Seki K, Perlmutter SI, Fetz EE. Sensory input to primate spinal cord is presynaptically inhibited during voluntary movement. Nat Neurosci. 2003;6:1309–1316. doi: 10.1038/nn1154. [DOI] [PubMed] [Google Scholar]
- Sher Y, Cohen O, Zinger N, Harel R, Rubinsky B, Prut Y. Spatiotemporal organization of neuronal activity in the cervical cord of behaving primates. Front Neurosci. 2010;4:195. doi: 10.3389/fnins.2010.00195. [DOI] [PMC free article] [PubMed] [Google Scholar]
- Smith AM. The coactivation of antagonist muscles. Can J Physiol Pharmacol. 1981;59:733–747. doi: 10.1139/y81-110. [DOI] [PubMed] [Google Scholar]
- Smith AM, Bourbonnais D. Neuronal activity in cerebellar cortex related to control of prehensile force. J Neurophysiol. 1981;45:286–303. doi: 10.1152/jn.1981.45.2.286. [DOI] [PubMed] [Google Scholar]
- Smith AM, Hepp-Reymond MC, Wyss UR. Relation of activity in precentral cortical neurons to force and rate of force change during isometric contractions of finger muscles. Exp Brain Res. 1975;23:315–332. doi: 10.1007/BF00239743. [DOI] [PubMed] [Google Scholar]
- Smith WS, Fetz EE. Synaptic linkages between corticomotoneuronal cells affecting forelimb muscles in behaving primates. J Neurophysiol. 2009;102:1040–1048. doi: 10.1152/jn.91052.2008. [DOI] [PMC free article] [PubMed] [Google Scholar]
- Takei T, Seki K. Spinomuscular coherence in monkeys performing a precision grip task. J Neurophysiol. 2008;99:2012–2020. doi: 10.1152/jn.01181.2007. [DOI] [PubMed] [Google Scholar]
- Takei T, Seki K. Post-spike effects of spinal interneurons on hand muscles in monkeys performing a precision grip. Soc Neurosci Abstr. 2009;35:463.2. [Google Scholar]
- Takei T, Seki K. Spinal interneurons facilitate coactivation of hand muscles during a precision grip task in monkeys. J Neurosci. 2010;30:17041–17050. doi: 10.1523/JNEUROSCI.4297-10.2010. [DOI] [PMC free article] [PubMed] [Google Scholar]
- Wannier TM, Maier MA, Hepp-Reymond MC. Contrasting properties of monkey somatosensory and motor cortex neurons activated during the control of force in precision grip. J Neurophysiol. 1991;65:572–589. doi: 10.1152/jn.1991.65.3.572. [DOI] [PubMed] [Google Scholar]


