

Abstract
Cell proliferation during nervous system development is poorly understood outside the mouse neocortex. We measured cell cycle dynamics in the embryonic mouse sympathetic stellate ganglion, where neuroblasts continue to proliferate following neuronal differentiation. At embryonic day (E) 9.5, when neural crest-derived cells were migrating and coalescing into the ganglion primordium, all cells were cycling, cell cycle length was only 10.6 h, and S-phase comprised over 65% of the cell cycle; these values are similar to those previously reported for embryonic stem cells. At E10.5, Sox10+ cells lengthened their cell cycle to 38 h and reduced the length of S-phase. As cells started to express the neuronal markers Tuj1 and tyrosine hydroxylase (TH) at E10.5, they exited the cell cycle. At E11.5, when >80% of cells in the ganglion were Tuj1+/TH+ neuroblasts, all cells were again cycling. Neuroblast cell cycle length did not change significantly after E11.5, and 98% of Sox10−/TH+ cells had exited the cell cycle by E18.5. The cell cycle length of Sox10+/TH− cells increased during late embryonic development, and ∼25% were still cycling at E18.5. Loss of Ret increased neuroblast cell cycle length at E16.5 and decreased the number of neuroblasts at E18.5. A mathematical model generated from our data successfully predicted the relative change in proportions of neuroblasts and non-neuroblasts in wild-type mice. Our results show that, like other neurons, sympathetic neuron differentiation is associated with exit from the cell cycle; sympathetic neurons are unusual in that they then re-enter the cell cycle before later permanently exiting.
Introduction
In the developing nervous system, the dynamics of cell proliferation have only been studied in detail in the mouse cerebral cortex (Takahashi et al., 1997; Caviness et al., 2003; Mitsuhashi and Takahashi, 2009). In the cortex, neural stem cells divide up to 11 times and generate waves of neurons and later, glial cells, that form the cortical layers (Takahashi et al., 1999). Stem cell cycle length increases with developmental age, as G1 lengthens (Takahashi et al., 1995). Neural stem cells progressively exit the cell cycle (Mitsuhashi and Takahashi, 2009), which is thought to be the trigger for differentiation (Cremisi et al., 2003).
Proliferation in other parts of the developing nervous system is likely to differ from this pattern. In sympathetic ganglia, a well studied system for understanding neuronal development (Glebova and Ginty, 2005; Howard, 2005; Kulesa et al., 2009; Rohrer, 2011), neuroblasts differentiate from neural crest (NC)-derived progenitor cells and continue to divide while expressing a variety of neuronal markers (Rothman et al., 1978; 1980; Rohrer and Thoenen, 1987; Hendershot et al., 2008; Reiff et al., 2011). In sympathetic ganglia of embryonic mice, division of existing neuroblasts rather than division of NC-derived progenitor cells drives the increase in the numbers of neurons (Callahan et al., 2008; Tsarovina et al., 2008).
Understanding the normal developmental progress and regulation of sympathetic ganglion proliferation is important because sympathetic ganglia give rise to the embryonic cancer, neuroblastoma, where the control of proliferation is lost (Maris et al., 2007; Janoueix-Lerosey et al., 2010; Jiang et al., 2011). For instance, familial forms of neuroblastoma are associated with mutations in genes that regulate sympathetic ganglion proliferation, such as Phox2b and the anaplastic lymphoma kinase receptor (Reiff et al., 2011).
A number of molecules, including Ret (Enomoto et al., 2001), glial cell line-derived neurotrophic factor (GDNF), and artemin (Nishino et al., 1999); Hand2 (Hendershot et al., 2008); frizzled-3 and β catenin (Armstrong et al., 2011); and Sox10 (Nagashimada et al., 2012) and Sox11 (Potzner et al., 2010) are thought to regulate proliferation in developing sympathetic ganglia. However, without a detailed understanding of how cell cycle dynamics, including changes in cell cycle length and cell cycle withdrawal, contribute to normal growth, it is impossible to determine precisely how these signaling pathways regulate the number of cells in sympathetic ganglia or contribute to the genesis and progress of neuroblastoma.
We measured the proportion of cells of different phenotypes in the cell cycle and the length of cell cycle and S-phase in the embryonic mouse stellate ganglion. We then demonstrated the value of the approach by examining the effect of the loss of Ret on cell cycle dynamics, and show that the previously reported reduction in sympathetic neuron number in Ret-null mutants is due, at least in part, to changes in the cell cycle length of neuroblasts. Finally, we used these data to develop a mathematical model of normal ganglionic growth that predicts differentiation rate and starting cell number and describes the observed change in proportions of each cell type over time.
Materials and Methods
Animals.
All procedures were approved by the University of Melbourne Animal Experimentation Ethics committee. Mice were time plug mated, and the morning of the detection of the plug was deemed to be embryonic day (E) 0.5. Wild-type C57BL/6 mice and RetTGM/TGM mice on a C57BL/6 background (Enomoto et al., 2001) were used. RetTGM/TGM mice have a fusion protein consisting of the N-terminal region of bovine tau, a full-length EGFP and three repeats of the human Myc tag inserted into the first exon of the Ret gene by homologous recombination. Mice heterozygous for the Ret-TGM insertion (RetTGM/+) develop and survive normally, while homozygote animals die shortly after birth due to kidney and enteric nervous system deficits (Enomoto et al., 2001). RetTGM/TGM animals were generated by mating RetTGM/+ males with RetTGM/+ females. RetTGM/TGM embryos were identified by observation of the enteric nervous system in the stomach. Wild-type mice have no GFP+ neurons in the stomach, RetTGM/+ animals have a dense plexus of GFP+ neurons throughout the stomach, while RetTGM/TGM embryos have a sparse plexus of GFP+ neurons in the proximal stomach only (Stewart et al., 2007).
Bromodeoxyuridine and ethyldeoxyuridine labeling.
S-phase labeling index and total cell cycle length were measured using techniques modified from published methods (Hayes and Nowakowski, 2000; Nowakowski et al., 2002; Tarui et al., 2005). The major changes were to use ethyldeoxyuridine (EdU) as the second S-phase marker instead of tritiated thymidine, to use Ki67 instead of cumulative bromodeoxyuridine (BrdU) labeling to identify cycling cells and to adapt all methods to allow multiple labeling immunofluorescences to identify specific cell types. To enable calculation of cell cycle parameters, pregnant dams between 9.5 and 18.5 d postfertilization (wild-type mice) or E12.5, E14.5, and E16.5 (RetTGM/TGM) were injected intraperitoneally, initially with BrdU (Roche Diagnostics) at 100 μg/g body weight and, 2 h later, EdU (Invitrogen) at 50 μg/g body weight. Thirty minutes after the injection of EdU, the dams were killed by cervical dislocation and the embryos removed. Embryos were fixed overnight in Zamboni's fixative (2% formaldehyde and 15% saturated picric acid in 0.1 m phosphate buffer, pH 7.4) and then rinsed and stored in 20% sucrose in distilled water. Embryos were then snap frozen in liquid nitrogen-cooled isopentane and sectioned on a cryostat at 14 μm thickness.
Immunohistochemistry and imaging.
Transverse sections of embryos were cut through the stellate and most rostral trunk sympathetic ganglia. Sections for analysis were selected by reference to the forelimbs and to the thymus gland so that equivalent sections from different embryos were analyzed at each age. To avoid double counting, sections were collected serially as separate one in four series and selected for analysis so that contiguous sections were not counted. Sections were processed in one of two ways. In the first, sections were processed for Sox10 or tyrosine hydroxylase (TH) or Tuj1 immunohistochemistry before being treated with 2N HCl for 30 min at room temperature and then 0.1 m sodium tetraborate. They were then processed for immunohistochemistry for BrdU and finally reacted for EdU per the manufacturer's instructions (Clik-iT EdU Alexa Fluor 488 imaging kit; Life Technologies). Note that Phox2b immunostaining did not survive the acid treatment required to reveal BrdU immunoreactivity. In the second method, sections were subjected to antigen retrieval (10 min at 95°C in 0.01 m citrate buffer, pH 6.0), which improved immunoreactivity for Ki67 but did not alter immunoreactivity to TH, Phox2b, or Sox10, before being processed for multiple label immunofluorescence to reveal, Ki67, Sox10, and either TH, Tuj1, Hu, or Phox2b. Bisbenzimide (1 μg/ml, Hoechst 33446) was used as a nuclear marker on all sections.
Primary antisera to Sox10, Phox2b, BrdU, and TH and appropriate secondary antisera were sourced and used as previously described (Callahan et al., 2008; Chubb and Anderson, 2010). Additional antibodies used were monoclonal rabbit anti-Ki67 (Thermo Scientific; 1:100); human anti-Hu (1:5000), a gift from Dr Vanda Lennon (Fairman et al., 1995); mouse anti-neuron-specific class III β tubulin (Tuj1; Covance Research Products 1:2000); donkey anti-human Alexa 594 (Jackson ImmunoResearch Laboratories, 1:500); and donkey anti-mouse Alexa 488 (Invitrogen Life Technologies, 1:100). All sections were imaged on a Zeiss Meta 510 scanning confocal microscope and analyzed using Zeiss Image Browser (v4.0.0.241; Carl Zeiss Microimaging) or ImageJ (v1.43u, National Institutes of Health) software for manual cell counting using the “Cell Counting and Marking” plug-in, which ensured that every labeled cell was counted, but only once.
Calculation of S-phase, labeling index, growth fraction, and cell cycle.
The calculation of cell cycle length requires measurement of three factors: the S-phase length, growth fraction (the proportion of cells in the cell cycle), and labeling index (the number of cells in S-phase at any instance). A full explanation of the derivation of the formulae used below and the experimental data underlying these techniques has been described previously (Hayes and Nowakowski, 2000; Nowakowski et al., 2002; Tarui et al., 2005). Confocal microscope images of transverse sections of embryos through the stellate ganglia and, at E9.5 only, the region between the neural tube and the stellate ganglion, were analyzed. For the S-phase length, all Sox10+ or Tuj1+ and Hu+ or TH+ cells in an image were counted and scored as expressing BrdU alone, both BrdU and EdU, or EdU alone. S-phase length was calculated using the formula; 2 × ((BrdU/EdU + EdU only)/BrdU only). The growth fraction was calculated from sections stained simultaneously for Ki67 (a marker of cycling cells), Sox10, and one of Hu, Tuj1, TH, or Phox2b. The growth fraction was the proportion of total Hu, Tuj1, TH, Phox2b, or Sox10 cells expressing Ki67. The labeling index was calculated as the Y intercept of a regression fitted to three values. The first two values were the number of cells labeled after 30 min (BrdU+/Edu+ cells plus BrdU−/EdU+ cells), and 2.5 h (BrdU+/EdU−, BrdU−/EdU+ and BrdU+/EdU+ cells) from the sections used to calculate the S-phase length. The third value (at 2 h) was from sections prepared from a second series of embryos from dams injected only with single doses of BrdU at E9.5, 10.5, 11.5, 12.5, 14.5, 16.5, or 18.5 and killed 2 h later. With the S-phase, labeling index, and growth fraction determined, the cell cycle length was calculated as S-phase × (Growth fraction/Labeling index).
Each parameter at each age was calculated from 3 to 9 embryos. Total cell numbers counted to calculate the growth fraction were 446 (E9.5), 794 (E10.5), 542 (E11.5), 952 (E12.5), 1688 (E14.5), 4446 (E16.5), and 7659 (E18.5). Cell counts for calculating S-phase were 591 (E10.5), 1320 (E11.5), 605 (E12.5), 2230 (E14.5), and 8174 (E16.5). No S-phase length for E18.5 (and hence no cell cycle length) could be calculated because of the low number of cycling cells.
Stereology.
Three RetTGM/TGM and three wild-type (Ret+/+) littermates were fixed by immersion in 4% formaldehyde and the thorax serially sectioned horizontally on a cryostat at 25 μm. Sections were stained with Feulgen stain and counterstained with Light Green. All nucleated cells in the stellate ganglion were counted using the optical fractionator method with Stereo Investigator software (v4; MBF Bioscience). Final section thickness was measured separately for each section counted.
Modeling.
The numbers of three cell types, NC-derived progenitor cells, neuroblasts, and glial cells, were modeled between E9.5 and E18.5. A system of differential equations accounted for the change in cell numbers in terms of rates determined from the experimental data for the growth fractions and cell cycle lengths.
NC-derived progenitor cells (p) proliferate as well as differentiate into neuroblasts (n) and glial cells (g). The neuroblast and glial cells also increase in number by proliferating themselves and it was assumed these divisions are symmetric and generate two cells capable of further division. The differential equation system describing the evolution of cell numbers in time t is given in Figure 1A.
Figure 1.

A, Equations describing the time evolution of the three cell types present in the mouse stellate ganglion. B, Values for parameters used in the model equations. See Materials and Methods for details.
The proliferation rate functions λn and λg for neuroblasts and glial cells were determined from the data (Fig. 1A, Eq. 5): the growth fraction value was divided by the cell cycle time (in days) and nonlinear functional forms were fitted to the data (Fig. 1B, see Fig. 7A; the adjusted R2 values for the fit are 0.9978 and 0.978 for λn and λg, respectively).
Figure 7.
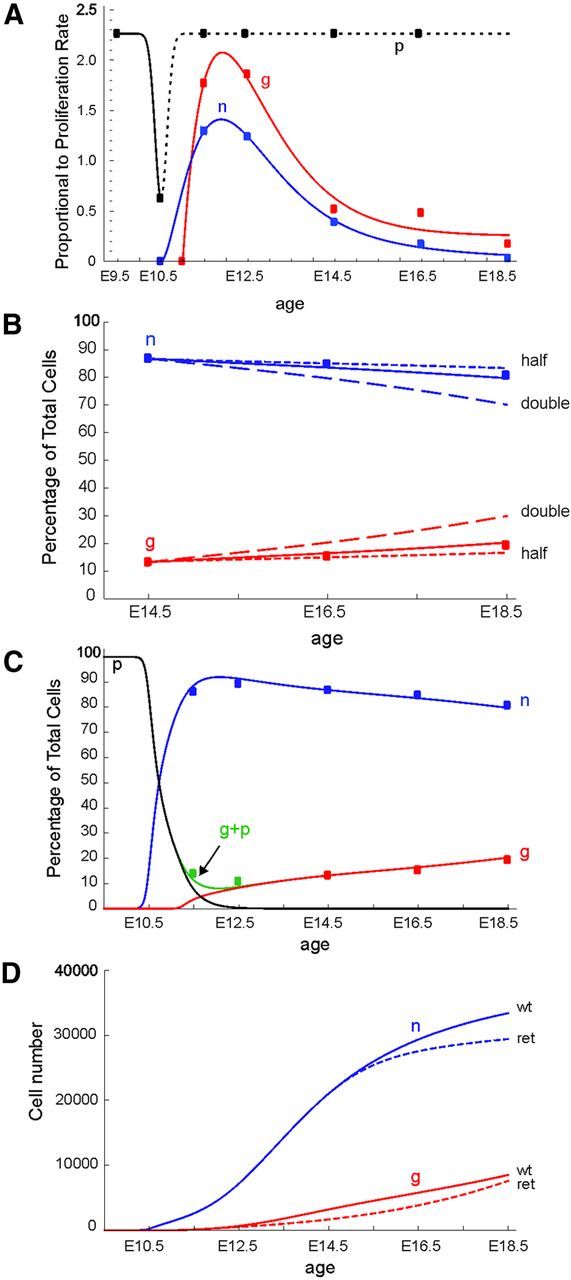
A, Curve fits to observed proliferation rates, (calculated by dividing growth fraction by cell cycle time/24 h) for Sox10−/TH+ cells (blue points) and Sox10+ cells (red points). Black points are for NC-derived progenitor cells present on E9.5 and 10.5. For NC-derived progenitor cells after E10.5, proliferation rate was assumed to return to that seen on E9.5 (dotted line). Note that for any age, the proliferation rate of Sox10+ cells is always larger than for Sox10−/TH+ cells. B, Comparison of the predictions of the model (solid lines) compared with the observed proportions of each cell type (Sox10−/TH+ cells = n, blue solid line; Sox10+ cells = g, red solid line) from E14.5 to E18.5. The model accurately predicts the observed proportions of Sox10−/TH+ cells (blue squares) and Sox10+/TH cells (red squares). Arbitrarily doubling (dashed lines) or halving (dotted lines) proliferation rates to mimic systematic errors in the data results in poorer fits. C, A complete model of the change in proportions of Sox10−/TH+ cells (n, blue line) and Sox10+ cells (g, red line) in the stellate ganglion from E9.5. The model includes differentiation of NC-derived progenitors (p, black line) into Sox10−/TH+ cells from E9.5 and Sxo10+ cells from E10.5. The model accurately predicts the observed proportions of Sox10−/TH+ cells (blue squares) and Sox10+ cells (red squares). The green line (g + p) indicates the period where significant numbers of NC- derived progenitor cells overlap with glial cells. Both cell types will contribute to measured Sox10+ cells. D, Predictions of changes in absolute cell numbers in the ganglion based on the model, starting number adjusted to match stereological counts at E18.5. The increase in number in the wild-type (wt) ganglion of Sox10−/TH+ cells (assumed to be neuroblasts, n) and Sox10+ cells (assumed to be glial cells, g) are shown in the solid lines. The dotted lines show the result when parameters from RetTGM/TGM (ret) animals are used.
It was instructive to also predict the percentage of total cells from E14.5 assuming that the NC-derived progenitor cell population comprises <1% of the ganglion population from this time onward. In this case, we set p = 0 in the system and solved a system of two differential equations for n and g (Fig. 1A, Eqs. 2, 3), where the initial data were chosen as n (14.5) = 86.8 (the measured proportion of neuroblasts).
From E9.5 to E12.5, the properties of the NC-derived progenitor cells are also needed. At early times, the experimental data are unable to distinguish adequately between NC-derived progenitors and glial cells, as both express Sox10 (Kuhlbrodt et al., 1998; Callahan et al., 2008). All Sox10+/TH− cells were assumed to be NC-derived progenitor cells, with a growth fraction of unity everywhere except at E10.5, where our data show that it decreased to 0.79, and a cell cycle length at E9.5 of 10.6 h and at E10.5 of 30.0 h.
There were no direct experimental data on the cell differentiation rates. These were estimated so that the results of the model approximate the percentage of cell data for the proportions of neurons and glia (Fig. 1B, rates βn and βg). At E9.5, only NC-derived progenitor cells were present. NC-derived progenitors could differentiate into neuroblasts and glial cells with time delays (Fig. 1B, time delays φn, φg), as the glial marker, brain fatty acid-binding protein (BFABP), is first detected at E11.5 in the mouse stellate ganglion (Callahan et al., 2008). The “differentiation switch” for neurons and glia was chosen as smooth, but rapidly increasing (using a tanh function in Eq. 6; Fig. 1A).
All modeling was done using Mathematica 8 (Wolfram Research).
Statistical analysis.
The labeling index was calculated on pooled values from all embryos at each age. Growth fractions, cell cycle length, and S-phase length are presented as means ± SEM for each embryonic age. Means were compared using either one-way ANOVA with Tukey's post hoc test (for comparing GF, TC, or TS at different ages in wild-type animals) or unpaired t test (for comparing GF, TC, and TS at E12.5, 14.5, and 16.5 between wild-type and RetTGM/TGM) using GraphPad Prism v5.04 (GraphPad Software). For the post hoc tests, α = 0.05 except where data were used in two separate tests. When wild-type E12.5, 14.5, and 16.5 were compared with the same ages from RetTGM/TGM mice by t test, an additional Bonferroni correction was applied and α was set to 0.01 to reflect the fact that same wild-type data were used in two statistical analyses.
Results
Phenotypic composition of the stellate ganglion during development in wild-type mice
We first established how the molecular signatures of cells in the stellate ganglion of wild-type mice change during embryonic development. The stellate ganglion is present in transverse sections through the trunk at the level of the forelimbs (Callahan et al., 2008; Maden et al., 2012). Identification of different cell types was based on expression of cell type-specific markers. NC-derived progenitor cells express Sox10 without Hu, Tuj1, or TH. After E11.5, the expression of Sox10 without Hu, Tuj1, or TH also marks immature glial cells, as cells coexpressing Sox10 and the satellite glial marker, BFABP, appear at this time (Woodhoo et al., 2004; Callahan et al., 2008). Neuroblasts, immature neurons that in the sympathetic ganglia can retain the ability to divide (Rothman et al., 1978; Rohrer and Thoenen, 1987), were identified by expression of neuronal markers Tuj1, Hu, or TH. Sections were counterstained with the nuclear marker, bisbenzimide, to determine total cell number in each section through the ganglion. The relative proportions of different classes of cells are summarized in Figure 2.
Figure 2.
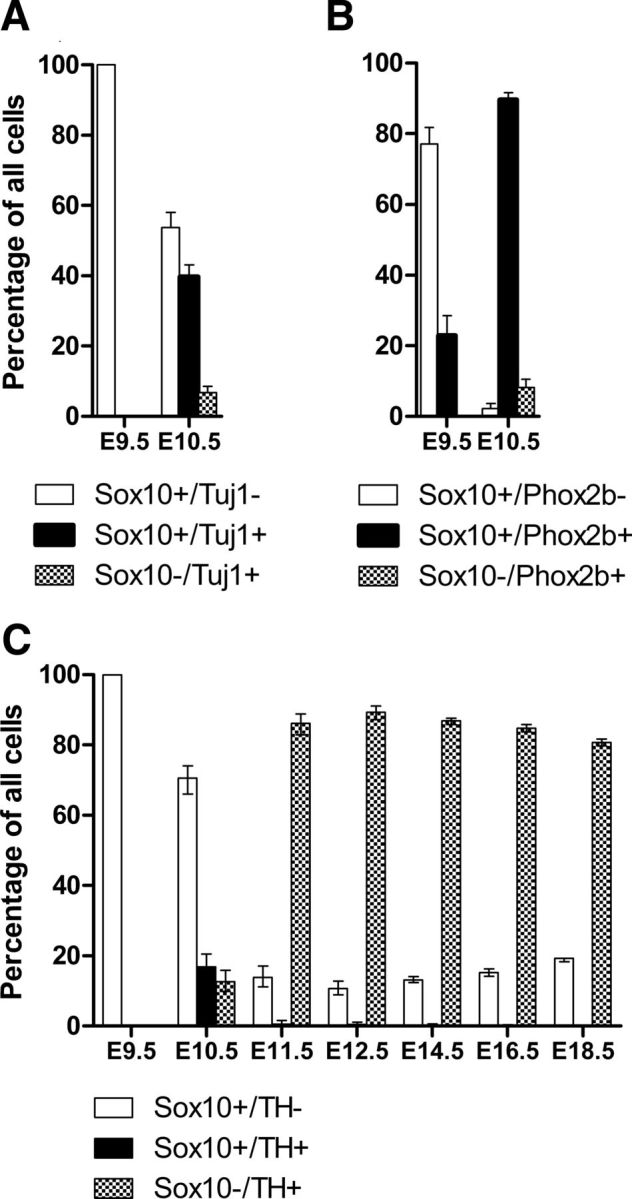
Changes in the relative proportions of different classes of cells in the developing mouse stellate ganglion. Percentages are expressed as proportions of total cells counted at each age. A, The proportions of cells expressing Sox10 and/or Tuj1 at E10.5. Note that ∼40% of cells express both Sox10 and Tuj1 at E10.5. B, The proportions of cells expressing Sox10 and/or Phox2b at E9.5 and 10.5. C, The proportions of cells expressing Sox10 and/or TH from E9.5 to E18.5.
At E9.5, Sox10+ NC-derived progenitor cells had coalesced into a column of cells adjacent to the dorsal aorta (Fig. 3A). Sox10+ cells were also present between the dorsal root ganglia and stellate ganglion. No Tuj1+, Hu+, or TH+ cells were detected at this age.
Figure 3.

Transverse sections through the forelimbs showing distribution of cell-specific markers relative to the cell cycle indicator, Ki67, in the stellate ganglion at various ages. Each row of images shows triple-label immunofluorescence for Sox10, Ki67, and either Phox2b, Tuj1, or TH, together with a merged image. A–D, Note that at E9.5 the majority of cells show only Sox10 immunostaining, with a few also showing colocalized Phox2b. All Sox10+ cells at this age are Ki67 immunoreactive. E–L, At E10.5 (E–H), nearly all cells are Sox10+/Phox2b+, but many cells lack Ki67. Many cells also express the pan-neuronal marker, Tuj1, at E10.5 (I–L); these cells mainly lack Ki67. In contrast, Sox10+/Tuj1− cells are mostly Ki67+ (arrows). M–P, By E12.5, TH and Sox10 are expressed by nonoverlapping populations of cells, which now mark glial cells and nearly all cells are now immunoreactive for Ki67. Arrows in A–F show examples of cells that are immunoreactive for Ki67, Sox10, and Phox2b.
By E10.5, cells showing immunoreactivity to various combinations of Sox10, Tuj1, Hu, and TH were present in the ganglion (Table 1, Figs. 2, 3I,J). Fifty-four percent of the cells expressed Sox10 without Tuj1 (794 cells, n = 4). The remaining 46% of the cells expressed Tuj1 (Fig. 2A) and also Hu (data not shown), with approximately half of the Tuj1+ cells also expressing TH (Fig. 2, compare A, C). Weak Sox10 expression was detectable in ∼80% of the Tuj1+/Hu+ cells (Figs. 2A, 3I,J). A direct comparison of TH and Sox10 expression at E10.5 (Table 1) showed that 71% of the cells (n = 468 total cells counted) was Sox10+/TH−, while Sox10+/TH+ cells made up 17% of the total and 13% was Sox10−/TH+.
Table 1.
Ki67 immunoreactivity in mouse stellate ganglion at E10.5
| Percentage of total | Ki67+ percentage | Number of cells | |
|---|---|---|---|
| Sox10+/Tuj1− | 53.7 | 84.7 | 426 (n = 4) |
| Sox10+/Tuj1+ | 39.7 | 5.3 | 315 (n = 4) |
| Sox10−/Tuj1+ | 6.7 | 0 | 53 (n = 4) |
| Sox10+/TH− | 70.5 | 79.4 | 330 (n = 9) |
| Sox10+/TH+ | 16.9 | 3.8 | 79 (n = 9) |
| Sox10−/TH+ | 12.6 | 1.7 | 59 (n = 9) |
| Sox10+/Phox2b− | 2.2% | 40% | 15 (n = 6) |
| Sox10+/Phox2b+ | 90% | 32% | 604 (n = 6) |
| Sox10−/Phox2b+ | 8.4% | 34.5% | 55 (n = 6) |
These results are consistent with previous reports (Rohrer, 2011) where NC-derived cells that initially express only Sox10 differentiate, first expressing pan-neuronal markers (Hu and Tuj1) and, shortly thereafter, the sympathetic neuron marker, TH. The expression of weak Sox10 immunoreactivity in some cells expressing neuronal markers presumably reflects differentiating neurons that still have residual expression of Sox10 protein.
At E11.5, TH was present in nearly all (93%, 316 cells, n = 4) of Tuj1+ cells, and TH+ cells made up 88% of the total cells in the ganglion (Fig. 2C). In contrast to E10.5, <1% of total cells was Sox10+/TH+ (Fig. 2C). Sox10+/TH− cells comprised ∼14% of the cells in the ganglion (Fig. 2C).
By E12.5, TH was present in 97% of all Tuj1 cells and so all subsequent analyses from E12.5 to E18.5 were done using TH as a marker of neuroblasts. From E12.5 to E18.5, over 80% of cells were Sox10−/TH+ (Figs. 2C, 3M,N), although their proportion decreased slightly after E12.5 (Fig. 2C). The proportion of cells expressing Sox10 increased from E12.5 to E18.5 (Fig. 2C). We have previously shown that <1% of all cells are Sox10+/TH+ at E12.5–E18.5 (Callahan et al., 2008).
We also examined the pattern of expression of Phox2b in the stellate ganglion. Phox2b is one of the first transcription factors expressed by differentiating NC-derived progenitor cells in embryonic sympathetic ganglia and is present in all mature sympathetic neurons (Pattyn et al., 1997). Phox2b plays an essential role in a transcriptional cascade that leads to expression of a noradrenergic phenotype in neuroblasts (Howard, 2005; Rohrer, 2011). Expression of Phox2b was examined in a separate series of embryos to those used above. At E9.5, Phox2b immunoreactivity was present in ∼23% of Sox10+ cells (total of 253 Sox10+ cells from six embryos) within the ganglion (Figs. 2B, 3A,B). By E10.5, 98% of the cells in the ganglion expressed Phox2b (Table 1, Fig. 2B), either Sox10+/Phox2b+ (90%, 674 cells, n = 6) or Sox10−/Phox2b+ (8%; Fig. 3E,F). Sox10+/Phox2b− cells comprised only 2.2% of the total cells in the ganglion. We have previously shown that, by E11.5 and E12.5, the proportion of Phox2b in developing sympathetic ganglia is similar to that of TH+ cells (Callahan et al., 2008).
In summary, there is a striking change in the molecular signature of cells in the stellate ganglion between E9.5, when 100% of the cells express Sox10 without any pan-neuronal marker, and E11.5, when ∼90% of the cells are expressing pan-neuronal markers plus TH.
Ki67 and the growth fraction
We next identified which cells were actively cycling using Ki67 immunohistochemistry. Ki67 marks cells in all stages of the cell cycle but is absent from cells in G0 (Scholzen and Gerdes, 2000). All Sox10+/Tuj1− cells at E9.5 were Ki67+ (Figs. 3 A,C,D, 4B). The data for Ki67 at E10.5 are summarized in Table 1. The percentage of Sox10+/Tuj1− cells that was Ki67+ at E10.5 decreased from that at E9.5 to 85% (Table 1). In strong contrast, only 5.3% of Sox10+/Tuj1+ (Fig. 3I–L) and 0% of Sox10−/Tuj1+ was Ki67+ (Table 1, Fig. 4A,B). An even lower proportion of Sox10+/TH+ cells was Ki67+ (Table 1).
Figure 4.

A–F, Proportion of cycling cells (growth fraction, A, B), overall cell cycle length (CCL; C, D), and S-phase length (E, F) for TH or Tuj1 cells lacking Sox10 (A, C, E), or Sox10 cells lacking TH or Tuj1 (B, D, F). Note that (1) at E9.5, no cells expressing Tuj1 or TH were present; (2) to identify Sox10+ cells that did not express neuronal markers, Tuj1 was used as a neuronal marker at E10.5, and TH was used as a neuronal marker at E11.5 and later ages; (3) at E10.5 only Sox10+/Tuj1− cells were present in sufficient numbers to calculate an S-phase and a CCL; and (4) at E18.5, there were too few cycling Sox10−/TH+ cells to calculate S-phase or CCLs. Values were compared with a one-way ANOVA and significant differences are indicated with asterisks, except for A, where the only values that were not significantly different from each other are indicated as n.s.
The low proportion of cycling cells seen at E10.5 relative to E9.5 was reversed at E11.5 when the proportion of Ki67+ cells increased significantly to over 90% for both Sox10+/TH− and Sox10−/TH+ cells (Fig. 4A,B). A similar percentage of both Sox10+/TH− and Sox10−/TH+ cells was also Ki67+ at E12.5 (Figs. 3M–P, 4A,B), but thereafter the proportion of Sox10−/TH+ cells that was Ki67+ dropped exponentially to 17% at E16.5 (3800 TH+ cells, n = 3) and 2.4% at E18.5 (5800 TH+ cells, n = 3). The growth fraction of Sox10+/TH− cells also decreased rapidly after E12.5, but always remained higher than that of Sox10−/TH+ cells at the same age (Fig. 4A,B).
Withdrawal of the Tuj1+ cells from the cell cycle at E10.5 was independently confirmed in two ways. First, we performed staining for phospho histone H3 (PH3), a marker of cells in M phase and hence a subset of cycling cells (Hendzel et al., 1997). At E10.5, 6% of 247 Sox10+/Tuj1− cells were immunoreactive for PH3, but only 1 of 188 Sox10+/Tuj1+ cells (n = 4) and none of 130 Sox10−/Tuj1+ cells expressed PH3. In contrast, at E11.5, 6% of Sox10+/Tuj1− cells were immunoreactive for PH3 (n = 90) and 5% of Sox10−/Tuj1+ cells (n = 479) were immunoreactive for PH3. Second, the use of the S-phase marker, BrdU, confirmed the withdrawal from the cell cycle seen using Ki67 and PH3 immunohistochemistry. None of a total of 200 Sox10+/Tuj1+ and Sox10−/Tuj1+ cells examined at E10.5 was BrdU+ 2.5 h following injection of BrdU. In contrast, at E11.5, 60% of Sox10−/TH+ cells took up BrdU (n = 458 TH+ cells).
Hendershot et al. (2008) also confirm fewer neuroblasts (Hu-immunoreactive) cycling in mouse sympathetic ganglia at E10 compared with E12, although the difference is not as large as reported here due, most likely, to differences in the ages examined (E10.0 vs E10.5) and the inclusion of cells from the entire length of the sympathetic chain, which develops with a distinct rostral to caudal temporal gradient.
These experiments demonstrate that the initial expression of neuronal markers at E10.5 coincides with a transient withdrawal from the cell cycle, but most neuroblasts then re-enter the cell cycle at E11.5. Permanent withdrawal from the cell cycle by neuroblasts could start as early as E11.5, when a small number of cells of both types lacked Ki67, and is well under way after E12.5. The vast majority (∼98%) of TH+ cells had withdrawn from the cell cycle by E18.5, while at this time, 26% of Sox10+/TH− cells remained in the cell cycle.
In contrast to the correlation between initial expression of Tuj1, Hu, or TH and withdrawal from the cell cycle, all Phox2b cells expressed Ki67 at E9.5 (Fig. 3A–D). At E10.5, when the majority of the cells were Sox10+/Phox2b+, 32% of Sox10+/Phox2b+ cells coexpressed Ki67 as did 34% of Sox10−/Phox2b+ cells (Fig. 3E–H, Table 1). 40% of Sox10+/Phox2b− cells also expressed Ki67. Thus, unlike Tuj1, Hu, and TH, the presence of Phox2b did not correlate with the loss of Ki67 immunoreactivity at E10.5.
Calculation of cell cycle lengths of stellate ganglion cells
Proliferation was measured by adapting methods from Nowakowski et al. (1989) and Hayes and Nowakowski (2002). Quadruple-labeling involving two S-phase markers (BrdU and EdU) combined with immunofluorescence for Sox10, Tuj1, or TH and nuclear staining with bisbenzimide was performed (Fig. 5A–H). The use of two S-phase markers injected with a 2 h interval allowed the calculation of both the labeling index (the proportion of cells in S-phase at any instant) and the length of S-phase. This was done for Sox10+ cells (all ages) and Tuj1+ (E10.5 only) or TH+ cells (E10.5 onward). Together, the labeling index and the S-phase length could be combined with the growth fraction to calculate the overall cell cycle length and S-phase length for all developmental ages examined. The data are summarized in Figure 4C–F.
Figure 5.

Transverse sections through the forelimbs of E12.5 mouse embryos showing BrdU and EdU following injection of BrdU and EdU 2.5 and 0.5 h before death, respectively. A–D, Incorporation of BrdU and EdU into TH+ cells. E–H, Incorporation of BrdU and EdU into Sox10+ cells. Arrows show (1) a Sox10+ cell without BrdU or EdU, (2) a Sox10+ cell with both BrdU and EdU, and (3) a Sox10+ cell showing only BrdU. Scale bar: (in A) A–H, 40 μm.
At E9.5, Sox10+ cells between the neural tube and the ganglion and within the ganglion primordium itself were highly proliferative and had an S-phase length of 7.2 h and a cell cycle length of only 10.6 h (Fig. 4D), which was the shortest cell cycle length of any cell type examined in this study.
At E10.5, the cell cycle length of Sox10+/Tuj1− cells was 38.4 ± 1.36 h, which is significantly longer than that at E9.5 (one-way ANOVA and Tukey's post hoc test, F(6,20) = 7.0, p = 0.004; Fig. 4D). As a consequence, the change in the proportion of the cell cycle occupied by S-phase between E9.5 and E10.5 was striking, and significantly decreased from 65% (±5.6%) at E9.5 to 11.1% (± 1.10%) at E10.5 (unpaired t test, t = 11.10, df = 9, p < 0.0001).
From E11.5 to E16.5, S-phase length (∼7 h) and total cell cycle length (∼20 h) of TH+ cells did not significantly change (one-way ANOVA and Tukey's post hoc test, F(3,16) = 0.89, p = 0.470; Fig. 4C,E). No S-phase or cell cycle length could be calculated at either E10.5 or E18.5 for TH+ cells as too few cells were in the cell cycle.
At E11.5, the cell cycle length of Sox10+ cells decreased to 12.9 h with S-phase now comprising 32% of the cell cycle (Fig. 4D,F). Cell cycle length of Sox10+ cells increased significantly from E11.5 to E18 0.5 (one-way ANOVA and Tukey's post hoc test, F(6,30) = 5.5, p = 0.001; Fig. 4D). S-phase length was significantly increased at E18.5, relative to all other ages (one-way ANOVA and Tukey's post hoc test, F(6,30) = 8.2, p = 0.0001, Fig. 4D,F).
As a control, we examined the effect of decreasing the period of BrdU incubation, as if the overall BrdU incubation period (2.5 h) is too long relative to the S-phase length, then a cell that incorporates BrdU in S-phase early in the period of exposure to BrdU could progress through metaphase within that period and so appear as two cells. At E12.5, the age with the shortest S-phase (for Sox10+/TH− cells), shortening the BrdU incubation to 1.5 h gave similar S-phase lengths for Sox10+ cells to the 2.5 h BrdU incubation (S-phase lengths of 3.6 h vs 2.9 h for 1.5 and 2.5 h BrdU incubations, respectively; unpaired t test, two-tailed, t = 1.41, df = 4, p = 0.23, n = 3). S-phase length in the TH+ cells was similarly unaffected (6.2 h vs 6.8 h for 1.5 and 2.5 h BrdU incubations, respectively; unpaired t test, two-tailed, t = 1.94, df = 6, p = 0.66, n = 3).
These studies demonstrate that the initial expression of Tuj1 and TH by stellate ganglion cells is preceded by an initial slowing of the cell cycle and coincides with a transient exit from the cell cycle.
We were unable to examine cell cycle length of Phox2b+ cells as the Phox2b immunostaining did not survive the acid treatment required to reveal BrdU immunoreactivity.
Ret and cell cycle length
All sympathetic ganglia are reduced in size in Ret-null mutant mice (Enomoto et al., 1998). We therefore examined the effect of loss of Ret, the signaling receptor for GDNF family ligands, on cell cycle dynamics in the stellate ganglion in E12.5, E14.5, and E16.5 Ret-null mutants (Enomoto et al., 1998).
Lack of Ret altered cell cycle dynamics of TH+ cells in the stellate ganglion in a time-dependent manner (Fig. 6A,C,E). Cell cycle length of TH+ cells was affected (significant interaction between genotype and age, two-way ANOVA, F(2,1,15) = 32.6, p < 0.0001) and post hoc analysis showed that the total cell cycle length was increased fourfold (24.5 vs 99.4 h) at E16.5 in the RetTGM/TGM mice (Fig. 6C). S-phase length of TH+ cells was similarly lengthened in RetTGM/TGM mice only at E16.5 (significant difference between genotypes, two-way ANOVA, F(2,1,15) = 6.6, p = 0.021; Fig. 6E). There were no differences between RetTGM/TGM and wild-type cell cycle or S-phase lengths at E14.5 and E12.5 and the growth fraction was not altered at any age (Fig. 6A,C,E). There was no significant difference in any parameter in Sox10+ cells in RetTGM/TGM mice (Fig. 6B,D,F).
Figure 6.

A–F, Data for growth fraction, cell cycle length, and S-phase length were measured for Sox10−/TH+ and Sox10+/TH− cells in stellate ganglia from RetTGM/TGM mice (ret) at E12.5, E14.5, and E16.5. The asterisks mark pairs of means that were significantly different using unpaired t tests (α = 0.01). WT, Wild-type.
Stereology and the optical fractionator method were used to measure the effect of loss of Ret on total cell number in the stellate ganglion at E18.5, when our data show nearly all TH+ cells have withdrawn from the cell cycle and hence proliferation has largely stopped. Both stellate ganglia were counted in each of three animals for each genotype. E18.5 Ret-null mutants had significantly less total cells in the stellate ganglion compared with wild-type (23,760 ± 1995 in mutants vs 41,906 ± 1516 in wild-type; unpaired t test, two-tailed, t = 2.13, df = 4, p < 0.01). Sox10+ cells comprised the same proportion of total ganglion cells in wild-type and mutant mice (19% vs 18% of total cells, respectively), and thus the decrease in total cell number in the ganglion must be due to decreases in both Sox10+ and TH+ cells.
Modeling
We examined whether a mathematical model based on the cell cycle parameters measured in wild-type mice could accurately predict the changes in proportions of cell types shown in Figure 2. Initially, we modeled ganglionic growth from E14.5 to E18.5. During this period, 98% of the Sox10+/TH− cells in the mouse stellate ganglion also express the glial marker, BFABP (Callahan et al., 2008), therefore, we only included two cell types in the model: Sox10+/TH− cells (glial cells, g) and Sox10−/TH+ cells (neuroblasts, n). The observed changes over time in growth fraction for the two cell types set both the initial division rate and the rate at which they withdrew from the cell cycle. As Sox10+ cells lacking BFABP expression (presumed NC-derived progenitor cells) comprise a maximum of 2% of total cells between E12.5 and E18.5 (Callahan et al., 2008), TH+ cells were assumed to arise only from the division of pre-existing TH+ cells in the model. Using the E14.5–E18.5 cell cycle length and growth fraction data, and starting the model from the observed proportions at E12.5, led to a very close fit for predicted cell proportions to observed proportions over the three succeeding time points (Fig. 7B).
The sensitivity of the model to potential systematic errors in our measured parameters was then explored. Halving the cell cycle length or doubling the growth fraction (thereby doubling the proliferation rate parameter) leads to a large mismatch between observed and modeled values (Fig. 7B, dashed lines). Doubling the cell cycle length or halving the growth fraction (thereby halving the proliferation rate) also perturbed the match, but to a lesser extent (Fig. 7B, dotted lines). While the fit of calculated to observed values could be improved very slightly by arbitrary adjustments in parameters, for instance, increasing the starting proportion of neuroblasts at E14.5 by 1%, the adjustment needed was always very small, suggesting the initial model was quite accurate.
To explore ages earlier than E14.5, a significant additional population of cells, NC-derived progenitor cells (p), had to be included in the model. Sox10+/TH− cells include both NC-derived progenitor cells and glial cells, which can be identified by the expression of BFABP. The model assumes that at E9.5, all cells were NC-derived progenitor cells, which, with time, both proliferated and differentiated. Proliferation rates were based on the cell cycle lengths measured for Sox10+ cells at E9.5 and E10.5. We modeled the differentiation of NC-derived progenitor cells (p) by including fixed probabilities that the progenitors would differentiate into neuroblasts from E10.0 and glial cells only after E11.0, as BFABP is first detected at E11.5 in the mouse stellate ganglion (Callahan et al., 2008). These probabilities were determined iteratively and adjusted to yield the observed growth rate of the ganglion. The differentiation probabilities are the only values used in the model that were not derived directly from observation and were selected on the basis that they gave rise to the observed proportions of the two main cell types at E12.5. If glial cells were committed from E10.0, the same time as assumed for neuroblasts, then the differentiation rate for glia would need to be changed to match the observed proportion of glia at E11.5. The model started from E9.5 and generated very similar changes in the relative proportions of cell types to those we observed in developing mouse stellate ganglia from E12.5 to E18.5 (Fig. 7C).
From E9.5 to E10, there is no detectable differentiation, and the NC-derived progenitor cells increase in number. The selected differentiation times for NC-derived progenitor cells and glial cells were 6 and 20 h, respectively. These values were determined by trial and error and gave the closest fit to the proportions from E14.5 onward. For neuroblasts, the differentiation time is shorter than the measured cell cycle length (10.6 h). This means that up until E11, before glial cells appear, there are some asymmetric divisions of NC-derived progenitor cells, with each division generating one progenitor and one neuroblast. The model predicts each daughter cell of a dividing NC-derived progenitor cell has a probability of 0.36 of remaining an NC-derived progenitor cell and 0.64 of turning into a neuroblast. After E11, when Sox10+/TH− NC-derived progenitor cells were also permitted to differentiate into glial cells as well as neuroblasts, the model predicts each daughter cell of a dividing NC-derived progenitor cell has a probability of 0.3 of remaining an NC-derived progenitor cell, 0.54 of turning into a neuroblast, and 0.16 into a glial cell. This results in the rapid depletion of NC-derived progenitor cells in the ganglion to very low numbers around E12.5, which matches the observation of very few Sox10+/BFABP− cells (0.3%) present at E12.5 (Callahan et al., 2008).
The number of neuroblasts and glial cells present at any time was proportional to the initial number of NC-derived progenitor cells (p0) present at E9.5. The model results determined the total number of cells (p + n + g) at E18.5 to be equal to 120.21p0. Therefore, if the total count is 41,906 cells in E18.5 wild-type ganglia (from stereology), the model predicted that the number of NC-derived progenitor cells present at E9.5 is p0 = 41,906/120.21 = 349. Given that there are only NC-derived progenitor cells present at E9.5, their number was P0e−λp/2 = 159 cells at E9.0. This number is plausible and independently suggests that the model is realistic.
Note that the model assumes that each of the populations (p, n, g) is homogenous in composition and that only these three populations contribute to the growth of the ganglion. It also does not take into account cell death. Previous studies have shown that cell death occurs at very low levels in embryonic mouse sympathetic ganglia. For example, the number of pyknotic (presumably apoptotic) or caspase 3 immunoreactive nuclei reported in mouse sympathetic ganglia vary from none at E12.5 (Enomoto et al., 2001) to a maximum of 0.9% at E16.5 and E17.5 and 1.4% at P0 (Fagan et al., 1996; Francis et al., 1999; Enomoto et al., 2001), with the rate of cell death increasing from E15.5 (Eldredge et al., 2008). If one assumes pyknotic or caspase 3-positive nuclei survive for ∼8 h, then cell death could be ∼3% from E16.5 to E18.5. The cell cycle status of the dying cells is unknown, but they are most likely immature sympathetic neurons that have withdrawn from the cell cycle, which are competing for peripheral targets. Inclusion of a cell death term with these parameters would reduce total cell numbers in the ganglion by 7% at E18.5.
When the parameters for the Ret-null mutant mice at E12.5, 14.5, and 16.5 were substituted into the model with a starting number calculated by the model of 349 cells at E9.5, the model predicted 37,030 total cells at E18.5, compared with 23,760 cells by stereological count of sections from RetTGM/TGM animals. Although Sox10+ cells comprised the same proportion of total ganglion cells in wild-type and mutant mice, the model predicted that there should be significantly fewer neuroblasts but only a slightly smaller number of glial cells in Ret-null mutants (Fig. 7D), thus resulting in an increased relative proportion of glial cells. Thus the changes to cell cycle length measured after deletion of Ret appear to account for only some of the loss of neuroblasts observed and not at all for changes in the glial cells.
Discussion
Differentiation and cell cycle withdrawal
In the CNS, neuronal differentiation is accompanied by permanent withdrawal from the cell cycle, but in developing sympathetic ganglia, proliferation continues following neuronal differentiation (Rothman et al., 1978; Rohrer and Thoenen, 1987; Hendershot et al., 2008; Reiff et al., 2011). We have shown that differentiation of sympathetic neuroblasts is accompanied by transient exit of the cell cycle and subsequent re-entry approximately 1 d later; cell cycle withdrawal and re-entry was confirmed using three independent techniques (Ki67, PH3, and BrdU uptake). Sympathetic neuroblasts are therefore similar to other neurons in that neuronal differentiation coincides with exit from the cell cycle; the unusual characteristic of sympathetic neuroblasts is that they then re-enter the cell cycle after initial neuronal differentiation. Our data are summarized in Figure 8.
Figure 8.

Diagram summarizing the postulated cell types in the developing mouse stellate ganglion from E9.5 to E12.5 and their cell cycle parameters. Cells expressing Sox10+/Phox2b+/Tuj1− appear on E9.5 and are also present on E10.5. Sox10+/Phox2b−/Tuj1− cells present on E10.5 (shown as glial progenitors) may be a mixture of glial progenitors and NC-derived progenitor cells that are yet to differentiate. These cells are present in very low numbers and no cell cycle parameters could be calculated. Note the change in cell cycle parameters from E9.5 to E11.5, with differentiating neuroblasts withdrawing from the cell cycle on E10.5 and re-entering on E11.5. All cells expressing Tuj1 also expressed Hu. CCL, cell cycle length; GF, growth factor.
The mechanism(s) that mediate the transient cell cycle arrest are unknown. The appearance of Phox2b at E9.5 is not associated with the transient cell cycle exit seen at E10.5, as 98% of all cells expressed both Phox2b and Sox10, and so most Phox2b+ cells lacking Tuj1 and TH must remain cycling. This also means that Phox2b must be present in cells that give rise to both neurons and glia in sympathetic ganglia, as suggested previously (Tsarovina et al., 2008; Nagashimada et al., 2012), similar to the situation in the enteric nervous system (Young et al., 1998; Anderson et al., 2006; Corpening et al., 2008; Lei and Howard, 2011).
Sox10 levels have been suggested to drive proliferation of NC-derived cells (Kim et al., 2003) and so the loss of Sox10 could potentially be involved in cell cycle withdrawal. However, 40% of the Tuj1+ cells at E10.5 showed colocalized Sox10 immunoreactivity and most (95%) of these cells have withdrawn from the cell cycle (Table 1). There is a noticeable decrease in the intensity of Sox10 immunoreactivity in these cells versus Sox10+/Tuj1− cells suggesting that it may be the decrease in Sox10 levels, rather than its complete absence, that regulates cell cycle exit.
An alternative explanation to our assumption that a single population of differentiating neuroblasts transiently exits the cell cycle is that there are two neuroblast populations; an initial population that permanently withdraws from the cell cycle at E10.5, and a second, dividing, neuroblast population that appears at E11.5. However, cell cycle withdrawal of most neuroblasts at E10.5 would leave too few dividing cells to populate the ganglion from E11.5. Our model only matches the observed growth of the ganglion when all cells at E10.5 are assumed to re-enter the cell cycle. In addition, if most of the cells at E10.5 withdraw from the cell cycle, they must disappear by E12.5, when only a small number of cells are seen to be out of the cell cycle, but no cell death is observed at this time (Enomoto et al., 2001).
Cell cycle dynamics of neuroblasts
At E9.5, the short cell cycle length and relatively long S-phase length of NC-derived progenitor cells forming the ganglion primordium is characteristic of embryonic stem cells and early embryonic cells (Mac Auley et al., 1993; White and Dalton, 2005). At E10.5, Sox10+/TH− cells had a lengthened cell cycle and a relatively short S-phase. The change in cell cycle parameters coincident with differentiation is characteristic of other differentiating stem or progenitor cells. The lengthening in the cell cycle is thought to allow time for signaling to initiate differentiation. While studies of some neuronal lineages have reported that the crucial change is a lengthening of G1 (Takahashi et al., 1997; Orford and Scadden, 2008; Singh and Dalton, 2009; Salomoni and Calegari, 2010), other studies have reported a lengthening of S-phase (Arai et al., 2011) or a shortening of G2 (Peco et al., 2012). It is not yet known what the crucial change is in sympathetic NC-derived progenitor cells.
Sox10+/Phox2b−/Tuj1− cells form the mouse sympathetic ganglion at E9.5 and then rapidly differentiate, first into Sox10+/Phox2b+/Tuj1− cells and then into mainly Sox10+/Phox2b+/Tuj1+ cells. By E11.5, Sox10+/Phox2b−/Tuj1− cells comprise only 2% of total cells in the mouse stellate ganglion. In contrast, in chicken sympathetic ganglia, Sox10+/Phox2b−/SCG1− cells (SCG10 is a pan-neuronal marker) make up approximately half of the total area of sympathetic ganglia over three days while differentiation of sympathetic neuroblasts occurs (Tsarovina et al., 2008, their Fig. 3b). The mouse appears to lack this reserve of progenitors.
Comparison to mouse cerebral cortex
In the cortex, the cell cycle length of progenitor cells gradually increases from 8 to 18 h (Takahashi et al., 1997), due to a steady increase in G1, but not S-phase (Mitsuhashi and Takahashi, 2009). In the stellate ganglion, the cell cycle length changes irregularly with time. From E9.5 to E10.5, cell cycle length decreases dramatically and then speeds up again at E11.5. Neuroblasts thereafter show a constant cell cycle length (∼22 h). Sympathetic glial cells show a steady increase in cell cycle length, so that, from E14.5 to E 18.5, cell cycle length increases by over 20 h, but this is accompanied by an increase in S-phase of 14 h. Like Schwann cells (Jessen and Mirsky, 2005), satellite glia (Hanani, 2010) are likely to mature progressively through development (Hanani, 2010) and changes in cell cycle length may reflect this maturation.
Whereas in the mouse cortex, neurons appear over a 6 d period (Takahashi et al., 1997), sympathetic neuroblasts first appear at E10.5, and neuroblasts have largely stopped dividing by E18.5, an 8 d period. The rate of increase of cell number is also quicker in the mouse cortex, where the 11 cell cycles available over the 6 d increase numbers 140-fold (Takahashi et al., 1997). Even including the initial proliferation of NC-derived progenitor cells in the ganglion, our model suggests that the stellate ganglion only expands 120-fold, due to its longer average cell cycle length. The proportion of cycling cells (the growth fraction) in both the cortex and stellate ganglion decreases at a similar rate and reaches 0.5 at E14.0 (Takahashi et al., 1997), although it should be noted that limited cell division of sympathetic neuroblasts appears to continue after birth in rodents (Hendry and Campbell, 1976; Shi et al., 2008). A majority of glial cells withdraw from the cell cycle by E18.5, but a significant minority remain cycling (Shi et al., 2008).
Modeling
The measured cell cycle lengths and growth fractions were integrated into a model that accurately predicts the changes in relative proportions of Sox10+ and TH+ cells in the stellate ganglion from E12.5 to E18.5. With the addition of an estimated rate at which NC-derived progenitor cells differentiate into neuroblasts and glial cells, it provides testable estimates of the rate of appearance of these cells and still maintains the fit to later time points. More accurate estimates of when, and the rate at which the first neuroblast and glial cells appear, as well as better markers of uncommitted NC-derived progenitor cells, will allow this part of the model to be refined.
Effect of loss of Ret on proliferation
E16.5 Ret-null mutants have smaller sympathetic ganglia compared with wild-type littermates and at P0 there is significantly greater apoptosis (Enomoto et al., 2001). However, while Ret is expressed by all sympathetic neuroblasts at E11.5, it is absent from the majority of noradrenergic neuroblasts by E14.5 (Enomoto et al., 2001; Callahan et al., 2008), only remaining thereafter in the small number of cholinergic neuroblasts present in the ganglion (Brodski et al., 2002; Ernsberger, 2008). Enomoto et al. (2001) suggested that the effects of the absence of Ret at E16.5 and P0 are indirect and are likely due to defects in earlier artemin signaling via GFRα3 and Ret. Artemin signaling normally guides sympathetic axons to peripheral target tissues (Honma et al., 2002), which then supply trophic support to the developing neuroblasts (Glebova and Ginty, 2005). Failure to navigate axons successfully to a target tissue will then result in loss of cells by apoptosis. However, while this accounts for some of the loss of sympathetic neurons in Ret-null mutants, it cannot account for the change in cell cycle length, which presumably only affects neurons that are yet to extend an axon to a target tissue. Our mathematical model suggests the change in cell cycle accounts for approximately half of the change in numbers seen.
Our data and model suggest that TH−/Sox10+ cells, the vast majority of which are glial cells (Callahan et al., 2008), will not be significantly affected by the loss of Ret. However, the relative proportions of neuroblasts to glial cells are unchanged in the RetTGM/TGM ganglia, that is, the final number of glial cells is also reduced. As glial cells do not express Ret (Callahan et al., 2008), the effect of Ret deletion must be either on the NC-derived progenitor cells, which express Ret at E9.5 (Pachnis et al., 1993), before the separation of neuronal and glial lineages, or be indirect, perhaps via the effect on neurons, which may regulate the generation of glial cells through Lgi4 signaling (Nishino et al., 2010).
Footnotes
This work has been supported by project grants from the National Health and Medical Research Council of Australia and the Australian Research Council. K.A.L. is an ARC Professorial Fellow.
The authors declare no competing financial interests.
References
- Anderson RB, Stewart AL, Young HM. Phenotypes of neural-crest-derived cells in vagal and sacral pathways. Cell Tissue Res. 2006;323:11–25. doi: 10.1007/s00441-005-0047-6. [DOI] [PubMed] [Google Scholar]
- Arai Y, Pulvers JN, Haffner C, Schilling B, Nüsslein I, Calegari F, Huttner WB. Neural stem and progenitor cells shorten S-phase on commitment to neuron production. Nat Commun. 2011;2:154. doi: 10.1038/ncomms1155. [DOI] [PMC free article] [PubMed] [Google Scholar]
- Armstrong A, Ryu YK, Chieco D, Kuruvilla R. Frizzled3 is required for neurogenesis and target innervation during sympathetic nervous system development. J Neurosci. 2011;31:2371–2381. doi: 10.1523/JNEUROSCI.4243-10.2011. [DOI] [PMC free article] [PubMed] [Google Scholar]
- Brodski C, Schaubmar A, Dechant G. Opposing functions of GDNF and NGF in the development of cholinergic and noradrenergic sympathetic neurons. Mol Cell Neurosci. 2002;19:528–538. doi: 10.1006/mcne.2001.1093. [DOI] [PubMed] [Google Scholar]
- Callahan T, Young HM, Anderson RB, Enomoto H, Anderson CR. Development of satellite glia in mouse sympathetic ganglia: GDNF and GFR alpha 1 are not essential. Glia. 2008;56:1428–1437. doi: 10.1002/glia.20709. [DOI] [PubMed] [Google Scholar]
- Caviness VS, Jr, Goto T, Tarui T, Takahashi T, Bhide PG, Nowakowski RS. Cell output, cell cycle duration and neuronal specification: a model of integrated mechanisms of the neocortical proliferative process. Cereb Cortex. 2003;13:592–598. doi: 10.1093/cercor/13.6.592. [DOI] [PubMed] [Google Scholar]
- Chubb DP, Anderson CR. The relationship of the birth date of rat sympathetic neurons to the target they innervate. Dev Dyn. 2010;239:897–904. doi: 10.1002/dvdy.22240. [DOI] [PubMed] [Google Scholar]
- Corpening JC, Cantrell VA, Deal KK, Southard-Smith EM. A Histone2BCerulean BAC transgene identifies differential expression of Phox2b in migrating enteric neural crest derivatives and enteric glia. Dev Dyn. 2008;237:1119–1132. doi: 10.1002/dvdy.21498. [DOI] [PMC free article] [PubMed] [Google Scholar]
- Cremisi F, Philpott A, Ohnuma S. Cell cycle and cell fate interactions in neural development. Curr Opin Neurobiol. 2003;13:26–33. doi: 10.1016/s0959-4388(03)00005-9. [DOI] [PubMed] [Google Scholar]
- Eldredge LC, Gao XM, Quach DH, Li L, Han X, Lomasney J, Tourtellotte WG. Abnormal sympathetic nervous system development and physiological dysautonomia in Egr3-deficient mice. Development. 2008;135:2949–2957. doi: 10.1242/dev.023960. [DOI] [PMC free article] [PubMed] [Google Scholar]
- Enomoto H, Araki T, Jackman A, Heuckeroth RO, Snider WD, Johnson EM, Jr, Milbrandt J. GFR alpha1-deficient mice have deficits in the enteric nervous system and kidneys. Neuron. 1998;21:317–324. doi: 10.1016/s0896-6273(00)80541-3. [DOI] [PubMed] [Google Scholar]
- Enomoto H, Crawford PA, Gorodinsky A, Heuckeroth RO, Johnson EM, Jr, Milbrandt J. RET signaling is essential for migration, axonal growth and axon guidance of developing sympathetic neurons. Development. 2001;128:3963–3974. doi: 10.1242/dev.128.20.3963. [DOI] [PubMed] [Google Scholar]
- Ernsberger U. The role of GDNF family ligand signalling in the differentiation of sympathetic and dorsal root ganglion neurons. Cell Tissue Res. 2008;333:353–371. doi: 10.1007/s00441-008-0634-4. [DOI] [PMC free article] [PubMed] [Google Scholar]
- Fagan AM, Zhang H, Landis S, Smeyne RJ, Silos-Santiago I, Barbacid M. TrkA, but not TrkC, receptors are essential for survival of sympathetic neurons in vivo. J Neurosci. 1996;16:6208–6218. doi: 10.1523/JNEUROSCI.16-19-06208.1996. [DOI] [PMC free article] [PubMed] [Google Scholar]
- Fairman CL, Clagett-Dame M, Lennon VA, Epstein ML. Appearance of neurons in the developing chick gut. Dev Dyn. 1995;204:192–201. doi: 10.1002/aja.1002040210. [DOI] [PubMed] [Google Scholar]
- Francis N, Farinas I, Brennan C, Rivas-Plata K, Backus C, Reichardt L, Landis S. NT-3, like NGF, is required for survival of sympathetic neurons, but not their precursors. Dev Biol. 1999;210:411–427. doi: 10.1006/dbio.1999.9269. [DOI] [PubMed] [Google Scholar]
- Glebova NO, Ginty DD. Growth and survival signals controlling sympathetic nervous system development. Annu Rev Neurosci. 2005;28:191–222. doi: 10.1146/annurev.neuro.28.061604.135659. [DOI] [PubMed] [Google Scholar]
- Hanani M. Satellite glial cells in sympathetic and parasympathetic ganglia: in search of function. Brain Res Rev. 2010;64:304–327. doi: 10.1016/j.brainresrev.2010.04.009. [DOI] [PubMed] [Google Scholar]
- Hayes NL, Nowakowski RS. Exploiting the dynamics of S-phase tracers in developing brain: interkinetic nuclear migration for cells entering versus leaving the S-phase. Dev Neurosci. 2000;22:44–55. doi: 10.1159/000017426. [DOI] [PubMed] [Google Scholar]
- Hayes NL, Nowakowski RS. Dynamics of cell proliferation in the adult dentate gyrus of two inbred strains of mice. Brain Res Dev Brain Res. 2002;134:77–85. doi: 10.1016/s0165-3806(01)00324-8. [DOI] [PubMed] [Google Scholar]
- Hendershot TJ, Liu H, Clouthier DE, Shepherd IT, Coppola E, Studer M, Firulli AB, Pittman DL, Howard MJ. Conditional deletion of Hand2 reveals critical functions in neurogenesis and cell type-specific gene expression for development of neural crest-derived noradrenergic sympathetic ganglion neurons. Dev Biol. 2008;319:179–191. doi: 10.1016/j.ydbio.2008.03.036. [DOI] [PMC free article] [PubMed] [Google Scholar]
- Hendry IA, Campbell J. Morphometric analysis of rat superior cervical ganglion after axotomy and nerve growth factor treatment. J Neurocytol. 1976;5:351–360. doi: 10.1007/BF01175120. [DOI] [PubMed] [Google Scholar]
- Hendzel MJ, Wei Y, Mancini MA, Van Hooser A, Ranalli T, Brinkley BR, Bazett-Jones DP, Allis CD. Mitosis-specific phosphorylation of histone H3 initiates primarily within pericentromeric heterochromatin during G2 and spreads in an ordered fashion coincident with mitotic chromosome condensation. Chromosoma. 1997;106:348–360. doi: 10.1007/s004120050256. [DOI] [PubMed] [Google Scholar]
- Honma Y, Araki T, Gianino S, Bruce A, Heuckeroth R, Johnson E, Milbrandt J. Artemin is a vascular-derived neurotropic factor for developing sympathetic neurons. Neuron. 2002;35:267–282. doi: 10.1016/s0896-6273(02)00774-2. [DOI] [PubMed] [Google Scholar]
- Howard MJ. Mechanisms and perspectives on differentiation of autonomic neurons. Dev Biol. 2005;277:271–286. doi: 10.1016/j.ydbio.2004.09.034. [DOI] [PubMed] [Google Scholar]
- Janoueix-Lerosey I, Schleiermacher G, Delattre O. Molecular pathogenesis of peripheral neuroblastic tumors. Oncogene. 2010;29:1566–1579. doi: 10.1038/onc.2009.518. [DOI] [PubMed] [Google Scholar]
- Jessen KR, Mirsky R. The origin and development of glial cells in peripheral nerves. Nat Rev Neurosci. 2005;6:671–682. doi: 10.1038/nrn1746. [DOI] [PubMed] [Google Scholar]
- Jiang M, Stanke J, Lahti JM. The connections between neural crest development and neuroblastoma. Curr Top Dev Biol. 2011;94:77–127. doi: 10.1016/B978-0-12-380916-2.00004-8. [DOI] [PMC free article] [PubMed] [Google Scholar]
- Kim J, Lo L, Dormand E, Anderson DJ. SOX10 maintains multipotency and inhibits neuronal differentiation of neural crest stem cells. Neuron. 2003;38:17–31. doi: 10.1016/s0896-6273(03)00163-6. [DOI] [PubMed] [Google Scholar]
- Kuhlbrodt K, Herbath B, Sock E, Hermans-Borgmeyer I, Wegner M. Sox10, a novel transcriptional modulator in glial cells. J Neurosci. 1998;18:237–250. doi: 10.1523/JNEUROSCI.18-01-00237.1998. [DOI] [PMC free article] [PubMed] [Google Scholar]
- Kulesa PM, Lefcort F, Kasemeier-Kulesa JC. The migration of autonomic precursor cells in the embryo. Auton Neurosci. 2009;151:3–9. doi: 10.1016/j.autneu.2009.08.013. [DOI] [PubMed] [Google Scholar]
- Lei J, Howard MJ. Targeted deletion of Hand2 in enteric neural precursor cells affects its functions in neurogenesis, neurotransmitter specification and gangliogenesis, causing functional aganglionosis. Development. 2011;138:4789–4800. doi: 10.1242/dev.060053. [DOI] [PMC free article] [PubMed] [Google Scholar]
- Mac Auley A, Werb Z, Mirkes PE. Characterization of the unusually rapid cell cycles during rat gastrulation. Development. 1993;117:873–883. doi: 10.1242/dev.117.3.873. [DOI] [PubMed] [Google Scholar]
- Maden CH, Gomes J, Schwarz Q, Davidson K, Tinker A, Ruhrberg C. NRP1 and NRP2 cooperate to regulate gangliogenesis, axon guidance and target innervation in the sympathetic nervous system. Dev Biol. 2012;369:277–285. doi: 10.1016/j.ydbio.2012.06.026. [DOI] [PMC free article] [PubMed] [Google Scholar]
- Maris JM, Hogarty MD, Bagatell R, Cohn SL. Neuroblastoma. Lancet. 2007;369:2106–2120. doi: 10.1016/S0140-6736(07)60983-0. [DOI] [PubMed] [Google Scholar]
- Mitsuhashi T, Takahashi T. Genetic regulation of proliferation/differentiation characteristics of neural progenitor cells in the developing neocortex. Brain Dev. 2009;31:553–557. doi: 10.1016/j.braindev.2009.05.002. [DOI] [PubMed] [Google Scholar]
- Nagashimada M, Ohta H, Li C, Nakao K, Uesaka T, Brunet JF, Amiel J, Trochet D, Wakayama T, Enomoto H. Autonomic neurocristopathy-associated mutations in PHOX2B dysregulate Sox10 expression. J Clin Invest. 2012;122:3145–3158. doi: 10.1172/JCI63401. [DOI] [PMC free article] [PubMed] [Google Scholar]
- Nishino J, Mochida K, Ohfuji Y, Shimazaki T, Meno C, Ohishi S, Matsuda Y, Fujii H, Saijoh Y, Hamada H. GFR alpha3, a component of the artemin receptor, is required for migration and survival of the superior cervical ganglion. Neuron. 1999;23:725–736. doi: 10.1016/s0896-6273(01)80031-3. [DOI] [PubMed] [Google Scholar]
- Nishino J, Saunders TL, Sagane K, Morrison SJ. Lgi4 promotes the proliferation and differentiation of glial lineage cells throughout the developing peripheral nervous system. J Neurosci. 2010;30:15228–15240. doi: 10.1523/JNEUROSCI.2286-10.2010. [DOI] [PMC free article] [PubMed] [Google Scholar]
- Nowakowski RS, Lewin SB, Miller MW. Bromodeoxyuridine immunohistochemical determination of the lengths of the cell cycle and the DNA-synthetic phase for an anatomically defined population. J Neurocytol. 1989;18:311–318. doi: 10.1007/BF01190834. [DOI] [PubMed] [Google Scholar]
- Nowakowski RS, Caviness VS, Jr, Takahashi T, Hayes NL. Population dynamics during cell proliferation and neuronogenesis in the developing murine neocortex. Results Probl Cell Differ. 2002;39:1–25. doi: 10.1007/978-3-540-46006-0_1. [DOI] [PubMed] [Google Scholar]
- Orford KW, Scadden DT. Deconstructing stem cell self-renewal: genetic insights into cell-cycle regulation. Nat Rev Genet. 2008;9:115–128. doi: 10.1038/nrg2269. [DOI] [PubMed] [Google Scholar]
- Pachnis V, Mankoo B, Costantini F. Expression of the c-ret proto-oncogene during mouse embryogenesis. Development. 1993;119:1005–1017. doi: 10.1242/dev.119.4.1005. [DOI] [PubMed] [Google Scholar]
- Pattyn A, Morin X, Cremer H, Goridis C, Brunet JF. Expression and interactions of the two closely related homeobox genes Phox2a and Phox2b during neurogenesis. Development. 1997;124:4065–4075. doi: 10.1242/dev.124.20.4065. [DOI] [PubMed] [Google Scholar]
- Peco E, Escude T, Agius E, Sabado V, Medevielle F, Ducommun B, Pituello F. The CDC25B phosphatase shortens the G2 phase of neural progenitors and promotes efficient neuron production. Development. 2012;139:1095–1104. doi: 10.1242/dev.068569. [DOI] [PubMed] [Google Scholar]
- Potzner MR, Tsarovina K, Binder E, Penzo-Méndez A, Lefebvre V, Rohrer H, Wegner M, Sock E. Sequential requirement of Sox4 and Sox11 during development of the sympathetic nervous system. Development. 2010;137:775–784. doi: 10.1242/dev.042101. [DOI] [PMC free article] [PubMed] [Google Scholar]
- Reiff T, Huber L, Kramer M, Delattre O, Janoueix-Lerosey I, Rohrer H. Midkine and Alk signaling in sympathetic neuron proliferation and neuroblastoma predisposition. Development. 2011;138:4699–4708. doi: 10.1242/dev.072157. [DOI] [PubMed] [Google Scholar]
- Rohrer H. Transcriptional control of differentiation and neurogenesis in autonomic ganglia. Eur J Neurosci. 2011;34:1563–1573. doi: 10.1111/j.1460-9568.2011.07860.x. [DOI] [PubMed] [Google Scholar]
- Rohrer H, Thoenen H. Relationship between differentiation and terminal mitosis: chick sensory and ciliary neurons differentiate after terminal mitosis of precursor cells, whereas sympathetic neurons continue to divide after differentiation. J Neurosci. 1987;7:3739–3748. doi: 10.1523/JNEUROSCI.07-11-03739.1987. [DOI] [PMC free article] [PubMed] [Google Scholar]
- Rothman TP, Gershon MD, Holtzer H. The relationship of cell division to the acquisition of adrenergic characteristics by developing sympathetic ganglion cell precursors. Dev Biol. 1978;65:322–341. doi: 10.1016/0012-1606(78)90030-1. [DOI] [PubMed] [Google Scholar]
- Rothman TP, Specht LA, Gershon MD, Joh TH, Teitelman G, Pickel VM, Reis DJ. Catecholamine biosynthetic enzymes are expressed in replicating cells of the peripheral but not the central nervous system. Proc Natl Acad Sci U S A. 1980;77:6221–6225. doi: 10.1073/pnas.77.10.6221. [DOI] [PMC free article] [PubMed] [Google Scholar]
- Salomoni P, Calegari F. Cell cycle control of mammalian neural stem cells: putting a speed limit on G1. Trends Cell Biol. 2010;20:233–243. doi: 10.1016/j.tcb.2010.01.006. [DOI] [PubMed] [Google Scholar]
- Scholzen T, Gerdes J. The Ki-67 protein: from the known and the unknown. J Cell Physiol. 2000;182:311–322. doi: 10.1002/(SICI)1097-4652(200003)182:3<311::AID-JCP1>3.0.CO;2-9. [DOI] [PubMed] [Google Scholar]
- Shi H, Cui H, Alam G, Gunning WT, Nestor A, Giovannucci D, Zhang M, Ding HF. Nestin expression defines both glial and neuronal progenitors in postnatal sympathetic ganglia. J Comp Neurol. 2008;508:867–878. doi: 10.1002/cne.21719. [DOI] [PMC free article] [PubMed] [Google Scholar]
- Singh AM, Dalton S. The cell cycle and Myc intersect with mechanisms that regulate pluripotency and reprogramming. Cell Stem Cell. 2009;5:141–149. doi: 10.1016/j.stem.2009.07.003. [DOI] [PMC free article] [PubMed] [Google Scholar]
- Stewart AL, Young HM, Popoff M, Anderson RB. Effects of pharmacological inhibition of small GTPases on axon extension and migration of enteric neural crest-derived cells. Dev Biol. 2007;307:92–104. doi: 10.1016/j.ydbio.2007.04.024. [DOI] [PubMed] [Google Scholar]
- Takahashi T, Nowakowski RS, Caviness VS., Jr The cell cycle of the pseudostratified ventricular epithelium of the embryonic murine cerebral wall. J Neurosci. 1995;15:6046–6057. doi: 10.1523/JNEUROSCI.15-09-06046.1995. [DOI] [PMC free article] [PubMed] [Google Scholar]
- Takahashi T, Nowakowski RS, Caviness VS., Jr The mathematics of neocortical neuronogenesis. Dev Neurosci. 1997;19:17–22. doi: 10.1159/000111179. [DOI] [PubMed] [Google Scholar]
- Takahashi T, Goto T, Miyama S, Nowakowski RS, Caviness VS., Jr Sequence of neuron origin and neocortical laminar fate: relation to cell cycle of origin in the developing murine cerebral wall. J Neurosci. 1999;19:10357–10371. doi: 10.1523/JNEUROSCI.19-23-10357.1999. [DOI] [PMC free article] [PubMed] [Google Scholar]
- Tarui T, Takahashi T, Nowakowski RS, Hayes NL, Bhide PG, Caviness VS. Overexpression of p27 Kip 1, probability of cell cycle exit, and laminar destination of neocortical neurons. Cereb Cortex. 2005;15:1343–1355. doi: 10.1093/cercor/bhi017. [DOI] [PubMed] [Google Scholar]
- Tsarovina K, Schellenberger J, Schneider C, Rohrer H. Progenitor cell maintenance and neurogenesis in sympathetic ganglia involves Notch signaling. Mol Cell Neurosci. 2008;37:20–31. doi: 10.1016/j.mcn.2007.08.010. [DOI] [PubMed] [Google Scholar]
- White J, Dalton S. Cell cycle control of embryonic stem cells. Stem Cell Rev. 2005;1:131–138. doi: 10.1385/SCR:1:2:131. [DOI] [PubMed] [Google Scholar]
- Woodhoo A, Dean CH, Droggiti A, Mirsky R, Jessen KR. The trunk neural crest and its early glial derivatives: a study of survival responses, developmental schedules and autocrine mechanisms. Mol Cell Neurosci. 2004;25:30–41. doi: 10.1016/j.mcn.2003.09.006. [DOI] [PubMed] [Google Scholar]
- Young HM, Hearn CJ, Ciampoli D, Southwell BR, Brunet JF, Newgreen DF. A single rostrocaudal colonization of the rodent intestine by enteric neuron precursors is revealed by the expression of Phox2b, Ret, and p75 and by explants grown under the kidney capsule or in organ culture. Dev Biol. 1998;202:67–84. doi: 10.1006/dbio.1998.8987. [DOI] [PubMed] [Google Scholar]