

Abstract
Somatosensation plays an important role in the motor control of vocal functions, yet its neural correlate and relation to vocal learning is not well understood. We used fMRI in 17 trained singers and 12 nonsingers to study the effects of vocal-fold anesthesia on the vocal-motor singing network as a function of singing expertise. Tasks required participants to sing musical target intervals under normal conditions and after anesthesia. At the behavioral level, anesthesia altered pitch accuracy in both groups, but singers were less affected than nonsingers, indicating an experience-dependent effect of the intervention. At the neural level, this difference was accompanied by distinct patterns of decreased activation in singers (cortical and subcortical sensory and motor areas) and nonsingers (subcortical motor areas only) respectively, suggesting that anesthesia affected the higher-level voluntary (explicit) motor and sensorimotor integration network more in experienced singers, and the lower-level (implicit) subcortical motor loops in nonsingers. The right anterior insular cortex (AIC) was identified as the principal area dissociating the effect of expertise as a function of anesthesia by three separate sources of evidence. First, it responded differently to anesthesia in singers (decreased activation) and nonsingers (increased activation). Second, functional connectivity between AIC and bilateral A1, M1, and S1 was reduced in singers but augmented in nonsingers. Third, increased BOLD activity in right AIC in singers was correlated with larger pitch deviation under anesthesia. We conclude that the right AIC and sensory-motor areas play a role in experience-dependent modulation of feedback integration for vocal motor control during singing.
Introduction
Song and speech are among the most complex human motor skills, and involve similar aspects of vocal production. Yet when we sing, sounds are produced within a more precise framework of rhythms and pitches, which, compared to speech, places higher demands on vocal motor control (Natke et al., 2003; Zatorre and Baum, 2012). One way to attain such precision is by monitoring the auditory feedback of one's own vocal production. Several studies have provided behavioral and neural evidence for a fundamental role of audio–vocal integration in pitch control by using altered auditory feedback, such as shifting vocal pitch (Jones and Munhall, 2005; Liu and Larson, 2007; Zarate and Zatorre, 2008; Parkinson et al., 2012). However, vocal production is also accompanied by somatosensory inputs resulting from vocal-fold vibrations, which eventually become associated with the auditory target. While somatosensory feedback contributes significantly to vocal motor control during articulation (Lametti et al., 2012), phonation (Wyke, 1974a,b), and pitch control (Larson et al., 2008), its underlying neural mechanisms are not yet well understood.
Human vocal production is controlled by a complex hierarchical network of cortical and brainstem centers, which integrate external feedback from both auditory and somatosensory pathways (Jürgens, 2002; Kleber et al., 2007, 2010; Zarate and Zatorre, 2008). Uniquely in humans, the laryngeal motor cortex (LMC) exerts the highest level of control over voluntary vocal production by virtue of its direct connection to phonatory motor neurons in the brainstem (Simonyan and Horwitz, 2011). Functionally, singing and speaking activate a largely overlapping cortical network; yet singing requires additional contributions from right-hemisphere systems to vocal control in the context of music (Ozdemir et al., 2006; Gunji et al., 2007; Kleber et al., 2010). These studies also consistently report involvement of auditory and somatosensory cortex as well as anterior insular cortex (AIC), with the right AIC being particularly implicated in song production (Ackermann and Riecker, 2010), due to the integration of auditory, somatosensory, and motor information for vocal control (Guenther, 2006). Interestingly, however, the somatosensory–vocal feedback loop becomes increasingly important with the development of singing skills, as has been demonstrated by both behavioral (Mürbe et al., 2004; Jones and Keough, 2008) and neuroimaging studies (Kleber et al., 2010). Because speech motor control is automatic in adults (Smith and Zelaznik, 2004), singing provides a model to investigate experience-dependent effects on somatosensory–motor integration for voluntary vocal production.
In the present study, we used fMRI to evaluate the role of somatosensory feedback on the functional singing network by anesthetizing the vocal-fold mucosa of singers and nonsingers. We tested the prediction that the ability of trained singers to sing accurately, compared with that of nonsingers, would be less affected by anesthesia, and that this difference would be based on compensation in auditory cortical networks, since auditory–motor interactions are more developed in trained musicians (Zatorre et al., 2007). We also tested the possibility that trained singers would be able to suppress altered somatosensory feedback via inhibition of relevant pathways, and rely exclusively on internal models of vocal production (Hickok, 2012).
Materials and Methods
Subjects
A total of 29 right-handed subjects without reported history of neurological or psychiatric disease participated in this study. Participants were subdivided in two groups based on vocal expertise: 17 classically trained singers (mean age, 33 years; 5 male) and 12 nonsingers without any previous vocal training or singing experience (mean age, 26 years; 6 male). We did not take people who sang occasionally (e.g., in choirs, informal rock bands, etc.). Other (nonvocal) musical training involved predominantly piano playing (11 singers: 10 years training on average; range, 2–26 years; 8 nonsingers: 6.7 years training on average; range, 2–13 years). Singers consisted of seven professional classical singers, four vocal students aspiring to become professional classical singers, and six participants with either a degree in vocal studies or intensive classical singing training. Trained singers took their first formal singing lesson on average at the age of 16.5 years (range, 8–22) and received formal singing training for an average of 12.6 years (range, 5–32) weekly singing practice. Three trained singers were excluded from final analyses because of incomplete application of anesthesia (1 female, 1 male) and movement artifacts in one participant (1 female). Movement artifacts were due to singing during the acquisition.
All subjects gave written informed consent before participation. The study was conducted under a protocol approved by the research ethics board of the Montreal Neurological Institute and Hospital.
Perceptual screening
To ensure that each participant's basic pitch perceptions skills were intact, frequency-discrimination thresholds were measured using a two-interval, two-alternative forced-choice procedure before scanning. This was done to rule out the possibility that differences in perceptual abilities could account for any performance differences in production. On each trial, two pure tones of 250 ms duration each were successively presented, separated by a 600 ms silent gap. The onset and offset of each tone was ramped >10 ms. One of the tones, the standard, had a frequency of 500 Hz. The other tone, the target, had a frequency of 500 Hz plus a frequency difference (Δf). The order of presentation of the two tones was random, with equal probability for the higher-frequency tone to fall in the first or second observation interval. The listener's task was to indicate in which interval that tone had occurred. The frequency difference between the two tones, Δf, was adaptively varied using a two-down one-up rule, which tracked 70.7% correct thresholds on the psychometric function (Levitt, 1971). At the beginning of each block of trials, Δf was set at a large value (7%), so that the listeners had no difficulty perceiving the difference between the two tones. It was decreased by a certain factor after two consecutive correct responses, and increased by the same factor after each incorrect response. The factor was equal to 2 initially; it was reduced to 1.25 following the second reversal in the direction of the change in Δf (from decreasing to increasing, or vice versa). The procedure terminated after the 15th reversal in the direction of the change in the size of Δf, and the threshold was defined as the geometric mean computed over the last eight reversals. The procedure was repeated three times for each subject, and the median of these three measurements was taken as each subject's threshold. Threshold values were expressed as percentages of the standard frequency. Participants were only selected for scanning when the median perception accuracy was below 2% frequency difference.
Singing task and target sound delivery
The tasks required participants, while lying in a supine position in the MRI scanner and prompted by target tones presented to them via headphones, to sing back ascending and descending musical intervals. A total of 36 intervals (17 ascending, 15 descending, and 4 same-tone) were presented via MR-compatible headphones (S14 Insert Earphones, Sensimetrics) using Max/MSP software to control the experiment (Cycling '74). The first tone always started at the fundamental frequency of 311.13 Hz for females (D#4 in musical notation) and 155.565 Hz for males (D#3 in musical notation). The second tone differed from the first by a value between 0 and ±9 semitones, where a semitone refers to the smallest unit in a conventional Western 12-tone equal temperament scale (corresponding to a frequency ratio of 1.0595). Target tones were complex waves, as previously used by Hutchins and Peretz (2011), made to approximate the timbre of a human voice on the syllable /a/. On each trial, the respective musical interval was presented as two tones (900 ms tone duration each, separated by a 200 ms gap) followed by a 3 s time period, during which participants were prompted to sing back the two tones, and to stop singing after the time period was over. Pitch reproduction was recorded via optical microphone [Optimic 2150, Optoacoustics (http://www.optoacoustics.com)] and stored in wave format for offline automated audio analysis. Recordings stopped after the respective singing periods. All but one participant sang consistently within the required period (see Subjects).
fMRI experimental design
The fMRI paradigm conformed to a 2 × 2 factorial design with condition (anesthesia vs normal singing) and expertise (trained singers vs nonsingers) as within-subject and between-subject factors respectively. We used a sparse temporal sampling fMRI design, adapted from the one we used previously (Kleber et al., 2010) to avoid interference of vocal performance with scanner noise and to restrict the impact of singing-related head movement on volume acquisition (Fig. 1). Whole-head scans (90 volumes per condition) were acquired on a 3 tesla whole-body MRI scanner (Magnetom Trio 3T, Siemens) with a 32-channel head coil using echo planar imaging [EPI; time echo (TE), 30 ms; flip-angle, 90°; time repetition (TR), 10 s; time acquisition (TA), 2.2 s; delay in TR, 7.8 s; 40 transversal slices (interleaved acquisition) of 3.4 mm thickness and 1 mm gaps; matrix, 64 × 64]. Thus, the TR of 10 s contained 7.8 s of silence, in which the sound stimuli were presented and the singing was performed. Sound presentation was randomly jittered by ±500 ms to ensure that we covered the peak amplitude of the hemodynamic response for each task. Visual cues were projected onto a screen to synchronize singing onset. Three EPI (“dummy”) scans were initially acquired and discarded to allow for T1-saturation effects. T1-weighted images (MPRAGE; 176 sagittal slices with 1 mm effective thickness) were also acquired for anatomical reference. Head movement during scanning was minimized by a rubber foam head restraint.
Figure 1.

Sparse-sampling design. A, Timeline of events within a trial of overt singing. After audio presentation of two-tone intervals (2 s), participants matched the target tones with their singing voice (3 s). B, Timeline of events within an active baseline trial, in which participants only listened to the same two-tone intervals without subsequent overt reproduction. All trials were presented in blocks of six consecutive trials of the same trial type (sing, listen-only), pseudorandomized throughout the session, and interspersed with three silent (i.e., no stimulation) baseline blocks across the run. Trial onsets were randomly jittered over 1 s. A total of 36 singing trials, 36 listening-only trials, and 18 silent baseline trials were measured per condition (normal singing and anesthesia).
Each scanning session involved 90 whole-head acquisitions: 36 interval-singing trials, 36 interval-listening-only trials, and 18 silent baseline trials. To increase statistical power, we always concatenated six trials of the same type (pseudoblock design). These 1 min blocks (TR of 10 s times 6 trials per block) were alternated and equally distributed throughout the session. That is, each singing block was followed by a listening-only block in which the preceding intervals were presented a second time without subsequent singing. This enabled us to control for effects due to the stimulation. Scans were performed under two conditions. In the first scan, participants sang with normal somatosensory feedback from their larynx. In the second scan, participants sang with reduced somatosensory feedback after a local anesthetic had been applied to their vocal folds (see below). Scan duration was 15 min per condition.
Vocal-fold anesthesia
An experienced ear, nose, and throat physician performed the vocal-fold anesthetization. After the first scan was completed, participants exited the scanner and were seated in a comfortable chair. Application of 5 ml of xylocaine 4% topical solution (lidocaine, Astra Zeneca Pharmaceuticals) onto the vocal-fold surface was performed under visual control using a Pentax model FNL 10RP3 transnasal laryngoscope covered with a sterile endosheath equipped with a side channel. Each participant's nasopharynx was first prepared with a decongestion spray containing 1% lidocaine to reduce discomfort during endoscopy procedures. The physician then inserted the flexible fiber optic scope through the nose. When the tip of the scope was positioned directly over the vocal folds under direct visualization, participants vocalized the vowel /i/ to bring the vocal folds together, and the anesthetic was sprayed onto the vocal-fold surface with a syringe attached to the endosheath side channel. To better evaluate the effect of the anesthetic, we performed the application in three steps. Initially, one-third of the anesthetic was applied to the vocal folds, which caused a gagging reflex and coughing. After ∼15–30 s, the second dose was applied, and we observed a reduced gag response. After an additional time interval (15–30 s) we applied the remaining dose to the vocal folds. By this time, there was almost no gag reflex and our participants reported reduced sensation. Reduced coughing and gag reflex are signs of effective anesthetics (Minogue et al., 2004). Furthermore, studies have shown that lidocaine reduces upper-airway reflex sensitivity significantly when sprayed on the vocal folds under visual control and that the effects of 4 ml of solution persisted for 30 min (Raphael et al., 1996). In general, pharmacokinetics of sprayed lidocaine suggest an onset of 2–5 min and durations varying between 15 and 60 min, depending on the individual's metabolism rate (Ruetsch et al., 2001; see also http://dailymed.nlm.nih.gov/dailymed/drugInfo.cfm?id=61925). Although the onset and duration of lidocaine should provide enough time for the experiment, we did not test the remaining effectiveness after the 15 min of fMRI testing. In evaluating our results, it is therefore important to consider that the effectiveness of the anesthetic may have diminished between the early and later stages of the fMRI testing. That is, if the effect of the anesthesia remained as potent as at the beginning, the differences we found between conditions in our study might have been more pronounced. However, this also implies that the potential variance in anesthesia duration increases the significance of our results.
Immediately after successful application, participants went back into the scanner for a second scan. Because of residual effects of anesthesia, normal singing conditions preceded anesthesia throughout the study. To exclude the possibility of confounding effects related to the order of conditions, we compared normal singing from this experiment with normal singing data obtained from a related experiment, in which the same paradigm was used with the same participants. Those data were acquired on a different day and counterbalanced with respect to the anesthesia session. A standard general linear model analysis comparing the two normal singing conditions was performed using the same statistical thresholds as the ones used in the present study (see fMRI data analysis). No significant differences were found between the two normal singing conditions acquired on different days. Hence, it is highly unlikely that order effects would confound the data from the principal study presented here.
Audio data analysis
All audio recordings were automatically analyzed using a custom-made script within the CUEX performance analysis system (Friberg et al., 2005) run under Matlab. Due to ambient scanner background noise (i.e., helium pump) and because of sex differences in vocal range, the analysis was customized regarding pitch range and analysis methods. Female and male participants were analyzed separately and the corresponding frequency parameters were adapted correspondingly. To filter out the low-frequency noise components, a high-pass filter (Butterworth, order 4 or 8) was set to the lowest frequency expected to be sung. The remaining noise floor was estimated and onset and offset times of the two tones were determined from the crossing points of the sound-level envelope (Friberg et al., 2005). Pitch level was estimated using the YIN algorithm (de Cheveigné and Kawahara, 2002) with the frequency range limits restricted to the range used in the experiment. This was C#3–D5 for females and F2–B3 for males. For final pitch analysis, two fixed time-constants were used. The analysis started 50 ms after the detected onset time, thus omitting these first 50 ms, which typically exhibited large pitch variations. The initial pitch section was constituted by the following 200 ms, which corresponded approximately to the typical initial pitch adjustment period (Grell et al., 2009). The slope was estimated using a linear least-square polynomial fit. The median of the remaining part of each note starting at 250 ms from the onset constituted the final pitch, which was used for statistical analyses in this experiment. Statistical analyses were performed using IBM SPSS Statistics Version 20 (IBM Canada). To address the effect of anesthesia on pitch performance, we analyzed two measures of pitch reproduction accuracy in cents (100 cents equals 1 semitone). One was deviation from target pitch. The other was deviation from target interval ratios, which represents the accuracy of pitch-relationship coding. Each participant performed 36 trials per session and each session contained 19 different intervals ranging from 0 to ±9 semitones.
Deviation from target pitch was first calculated for each tone of the musical interval individually and then averaged across both tones to create one measure of total pitch deviation per trial. To determine the accuracy of interval reproduction, the distance between target and sung frequency ratios was first converted into cent values. By subtracting target interval distance from sung interval distance, we determined interval reproduction accuracy. The resulting data were converted into absolute values to provide one single averaged measure of deviation from target intervals.
An additional change score was calculated to assess differences in pitch accuracy during anesthesia relative to normal singing. All values representing deviations from target pitch were first transformed into positive values by adding a constant (1000). Then the difference between anesthesia and normal singing was calculated for the first and second tone of each interval respectively by subtracting pitch deviance during normal singing from anesthesia (anesthesia minus normal). Because of evidence that some people tend to deviate flat on higher notes but sharp on lower notes (Hutchins and Peretz, 2011), the resulting change scores were transformed into absolute values and accumulated between first and second tone to represent one total change score independent from pitch direction. This value was used for regression analyses (see Statistical analyses).
Before statistical analyses were carried out, each subject's pitch deviance scores were converted into standard scores and excluded from statistical analyses when values were >±2.5 SD units to eliminate outliers or artifacts caused by the pitch-extraction algorithm. A two-way mixed-model ANOVA was used to determine significant differences in singing accuracy between conditions (repeated-measures factor) and group (between-subjects factor), as well as their interaction. All valid trials sung by each participant were entered as separate variables into the analysis to test for differences between identical intervals. A total of 339 intervals for singers and 338 for nonsingers was used. Simple contrasts were defined to compare means between conditions. Additional dependent t tests were performed to determine changes in performance accuracy between conditions for each group separately.
fMRI data analysis
Preprocessing.
Data were analyzed with SPM8 (www.fil.ion.ucl.ac.uk/spm/software/spm8/) running under Matlab 7.9 (MathWorks). Movement correction of fMRI scans was performed using the Realign and Unwarp option, which is more sensitive when movements are correlated with the task (e.g., jaw opening). All volumes from each session were realigned to the first scan of each session respectively as a reference and resliced with fourth-degree B-spline interpolation. Individual T1 images and second-session EPI images were separately coregistered to the mean EPI of the corresponding first session. Gray matter and white matter were segmented from coregistered T1 images using the unified segmentation model (Ashburner and Friston, 2005). This saves a parameterization of deformation fields, which involves the conversion of nonlinear warps combined with an affine transform. The deformation fields were used to normalize functional images to standard Montreal Neurological Institute (MNI) stereotactic space. The resulting images with a voxel size of 3 × 3 × 3 mm were subsequently smoothed with an 8 mm full-width at half-maximum isotropic Gaussian kernel.
Statistical analysis.
Individual statistical maps (fixed effect) were calculated for each subject. Singing and listening-only tasks were modeled explicitly; silence scans were modeled as implicit baseline. The interscan interval of 10 s was divided into 80 time-bins (microtime resolution, onset t1 = 1). The blood-oxygen-level dependence (BOLD) response for each event was high-pass filtered (360 s) and modeled using a single-bin finite impulse response (FIR) basis function spanning the response time of 10 s. First-level contrast images of each subject (singing minus listening-only) were then used for second-level group statistics calculated as random effects analysis. Expertise (singers or nonsingers) and condition (normal or anesthesia singing) were entered into a 2 × 2 full factorial ANOVA design. Nonsphericity correction was applied to account for the possibility of unequal variances between groups while within-group variance was assumed to be equal.
We measured the effect of anesthesia-induced differences in BOLD response during overt reproduction of musical intervals and interactions with expertise-level in classical singing. Main effects of overt singing (minus listening-only) including all participants were calculated for the whole brain after performing a full-factorial ANOVA using familywise error (FWE) correction with a p value of p = 0.05.
Region-of-interest analysis.
For all subsequent analyses, a priori defined regions of interest (ROIs) representing the singing network were selected based on previously published results (Kleber et al., 2007). A single anatomical mask was formed from anatomical ROIs to avoid α-error inflation due to multiple testing. For regions already cytoarchitectonically mapped, we used the Anatomy Toolbox (Eickhoff et al., 2005). The following regions were included: primary sensorimotor (areas 1–4) and premotor cortex (area 6), primary auditory cortex, Broca's area (areas 44 and 45), inferior parietal cortex, cerebellum, and the thalamus. We used the atlas of Tzourio-Mazoyer (Automated Anatomical Labeling, Tzourio-Mazoyer et al., 2002) for all other regions selected: superior temporal gyrus, limbic areas (insula, anterior cingulate cortex), and the basal ganglia (putamen, pallidum, caudate nucleus).
Post hoc contrasts (Student's t tests) were applied to assess within-group effects, for the comparison of normal singing versus singing with anesthesia, and between-group differences, for the comparison of trained singers versus nonsingers. F tests were performed to assess the interaction between singing expertise and singing condition. Statistical inference was based on the resulting t and F statistics in the mask using a p value of 0.001 uncorrected for multiple comparisons and an extent threshold of 10 voxels. Although this threshold is relatively liberal, limiting the search space to areas defined both anatomically and functionally as part of the singing network should guard well against false positives. T and F values of significant activations of the highest activated voxels were given for MNI coordinates and were assigned to anatomical regions. Where applicable, probabilities for anatomical localization of activation maxima were calculated (Eickhoff et al., 2005).
Functional connectivity.
A functional connectivity analysis was performed using the CONN-fMRI toolbox for SPM (http://www.nitrc.org/projects/conn). CONN computes the temporal correlation between the BOLD signals from given voxels to all other voxels in the brain. A general linear model was fitted to analyze BOLD activity of each subject to account for neural activity related to singing, and convolved with an FIR function. Data were bandpass filtered (0.008–0.09 Hz), and nuisance covariates included fluctuations in BOLD signal from CSF and white matter and their derivatives, following the implemented CompCor strategy (Behzadi et al., 2007). Activity within a 5 mm spherical ROI in the right AIC (x = 48; y = 0; z = −3) was defined based on results from a second-level post hoc F test (group times condition interaction; see Results), which was regressed on the activity within the singing network (on a voxel-by-voxel basis) to determine where activity significantly covaried with the activity in that ROI (Friston et al., 1994; Worsley et al., 2005). Correlations between the right AIC seed and cortical areas within the singing network were first analyzed in both groups separately, and for anesthesia and normal singing respectively. We then compared whether the connectivity with right AIC changed between conditions using post hoc t tests as implemented in CONN. Based on a priori defined hypotheses, we restricted the search volume to primary somatosensory, motor, and auditory cortex. A single ROI was defined in two steps. First, we identified functionally defined relevant areas based on activation clusters during normal singing in all participants. Subsequently, we included only those areas functionally relevant to the ROI that also lay within the boundaries of our target regions as defined in the Anatomy Toolbox (Eickhoff et al., 2005). Statistical significance thresholds were set at p < 0.001 uncorrected for multiple comparisons.
Inflated rendered brains were created using the cortex_20484.surf template in SPM8. Activation maps for brain slices were superimposed on the ch2better template using the MRIcron software (http://www.sph.sc.edu/comd/rorden/mricron/).
Regression analysis.
All the prior analyses addressed differences in functional activation regardless of pitch accuracy. To examine activation patterns as a function of behavior on an individual basis, a regression analysis was performed based on actual pitch performance. A change score (as described above) was calculated to represent the difference in pitch accuracy comparing subjects tested with and without anesthesia. This individual score was then used to test for correlations between brain activity and singing accuracy (i.e., deviation from target pitch) after anesthesia. We applied again the singing-network ROI mask with an uncorrected threshold of p < 0.001 and a five-voxel extent threshold.
Results
Behavioral results
Pitch perception accuracy
All participants showed good-to-average pitch perception accuracy, ruling out any perceptual deficit that could affect the singing performance, since all of the pitch intervals that had to be reproduced were much larger than the pitch discrimination thresholds. The average frequency-perception difference defined as the geometric mean was 0.51% (minimum, 0.12%; maximum, 0.87%) in trained singers and 0.70% (minimum, 0.22%; maximum, 1.49%) in nonsingers. Group differences were not statistically significant.
Pitch reproduction accuracy
All subjects were able to complete the singing task in the scanner without difficulty. Reported effects are all significant at p < 0.05. A mixed-model ANOVA including condition (anesthesia or normal) and group (singers and nonsingers) revealed a significant main effect of condition, indicating that anesthesia affected pitch accuracy in both singers and nonsingers F(1,728) = 65.34. There was also a main effect of group F(1,728) = 106.63, indicating that pitch accuracy was better in singers in both conditions, as expected, as shown in the bar graph in Figure 2. Most important, we found a significant interaction effect between condition and group, F(1,728) = 23.51, indicating that the effect of anesthesia on pitch accuracy differed between singers and nonsingers.
Figure 2.

Mean deviation from target pitch across the two tones of the interval measured in cents. Orange color (left) indicates normal singing. Green indicates anesthesia. Singers sang more accurately than nonsingers in both conditions. Anesthesia affected pitch accuracy in both groups (solid brackets). This difference was significantly smaller in singers (dashed bracket).
After calculating the mean difference in pitch accuracy between the anesthesia and normal singing condition, an additional t test for independent samples was performed. There was a significant group difference (trained singers: mean, 7.9 cent; SD, 30.7; nonsingers: mean, 31.4 cent, SD = 90; t(728) = −4.8, p < 0.001), indicating that pitch levels were significantly less increased in trained singers after anesthesia than in nonsingers.
Interval reproduction accuracy
A mixed-model ANOVA revealed a significant effect of group F(1,728) = 58.78, indicating that singers were better than nonsingers in both conditions at coding an interval accurately. There was no significant main effect of condition, indicating that anesthesia did not alter the accuracy of singing a tone relative to the one sung before.
fMRI results
Singing network
We investigated first the main effect of singing across all participants for both conditions separately. This analysis was accomplished by taking the first-level contrast of singing versus listening to the intervals into a second-level full-factorial model. During singing under normal feedback conditions, we found activation in regions that constitute the “singing network” as defined in previous studies (Kleber et al., 2007, 2010; Zarate and Zatorre, 2008), thus validating the basic design (Fig. 3A). These areas encompassed ventral primary sensorimotor cortex bilaterally (M1 coordinates: −42, −15, 36; t = 11.58; and 45, −9, 36; t = 9.81; S1 coordinates: −42, −15, 33; t = 10.77; and 48, −9, 30; t = 8.35), secondary somatosensory cortices (S2 coordinates: 63, 3, 3; t = 5.27; and −57, −6, 15; t = 8.48), premotor and supplementary motor cortex (coordinates SMA: −3, −3, 60; t = 9.46; ventral BA6: 51, −6, 39; t = 8.27; and −54, −6, 39; t = 7.17), left BA44 (coordinates: −57, 3, 15; t = 6.59), primary auditory cortex (coordinates: 45, −18, 3; t = 6.77; and −39, −33, 15; t = 7.04), anterior insular cortex (coordinates: −36, 6, 12; t = 5.59; and 48, 6, 3; t = 5.90), basal ganglia (pallidum: 27, −3, −6; t = 8.89; and −24, −6, −3; t = 4.93; putamen; 21, 9, 3; t = 7.67; and −24, 0, 9; t = 4.93), middle cingulate cortex (coordinates: −9, 3, 45; t = 6.08), and the thalamus (coordinates: 12, −15, 3; t = 5.38). Activation in anterior cingulate cortex and the cerebellum (Larsell's lobule VI) was present but did not reach significance after correction for multiple comparisons (FWE, p = 0.05).
Figure 3.
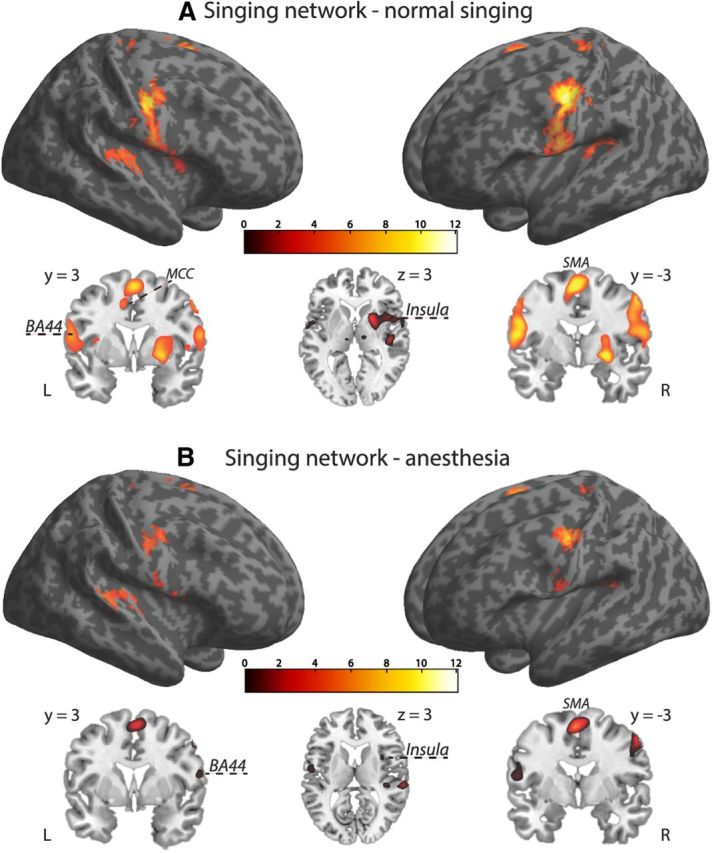
Brain activation of overt singing including all participants. A, Normal singing. B, Singing with anesthetized vocal-fold mucosa. During singing under normal feedback conditions, we found activation in regions that constitute the “singing network.” The same basic network was also revealed during singing with anesthetized vocal-fold mucosa, but at reduced activation strength. Activation maps were superimposed using the cortex_20484.surf template in SPM8, thresholded at p = 0.07 (FWE corrected) for visual display (extent threshold, 10 voxels) and the MRIcron software. Axial and coronal brain slices through the rendered volumes (shown below the corresponding images) illustrate frontomedial (BA44), premotor (SMA), subcortical (globus pallidus, putamen), and limbic sensorimotor areas [anterior insula and middle cingulate cortex (MCC)] during normal and anesthesia singing respectively.
Effects of anesthesia on singing
The same basic singing network was also revealed during singing with anesthetized vocal-fold mucosa, but at reduced activation strength (Fig. 3B). This involved ventral primary sensorimotor cortex bilaterally (M1 coordinates: −42, −15, 36; t = 8.42; and 45, −9, 36; t = 7.20; S1 coordinates: 60, 0, 15; t = 5.53; and −54, −3, 24; t = 5.25), secondary somatosensory cortices (S2 coordinates: −54, −6, 15; t = 5.78; and 66, −24, 18; t = 5.53), premotor and supplementary motor cortex (coordinates SMA: −3, −3, 60; t = 8.54; ventral BA6: 54, −3, 48; t = 7.46; and −51, −9, 48; t = 6.45), left BA44 (coordinates: −51, 9, 3; t = 6.12), primary auditory cortex (coordinates: 63, −27, 9; t = 6.70; and −39, −36, 15; t = 5.59), anterior insular cortex (coordinates: 48, 6, 3; t = 5.88), and the basal ganglia (pallidum: 24, −6, −6; t = 4.32; putamen: 27, −6, −6; t = 4.37). A direct contrast between singing with anesthesia and singing with normal feedback was performed to identify brain regions responding to reduced somatosensation from the larynx. Figure 4 shows the distribution of activations during singing with anesthesia relative to normal singing in trained singers and nonsingers, respectively. We found a distinct pattern of significantly decreased activation in both groups (Table 1). In the group of trained singers (Fig. 4A), anesthesia resulted in decreased BOLD activation within cortical sensorimotor and subcortical portions of the singing network. Decreased activations in singers were located in bilateral primary motor cortex (coordinates: −42, −12, 33; t = −4.05; and 48, −9, 39; t = −3.86) and left somatosensory cortex (coordinates: −45, 12, 30; t = −3.52). Previous studies identified a larynx motor area for phonation (rather than articulation) that is typically located in ventral sensorimotor cortex between the MNI z coordinates of 40 and 30 (Brown et al., 2009; Grabski et al., 2012). Furthermore, right insular cortex (coordinates: 48, −3, −3; t = −3.64) and the cerebellum (coordinates: −33, −45, −39; t = −5.02; and 15, −39, −51; t = −3.95) were less active during anesthesia in trained singers. Decreased activations in nonsingers (Fig. 4B) comprised the pallidum (coordinates: −15, 3, −3; t = −4.00), the thalamus (coordinates: −15, −18, 9; t = −3.94; and 15, −6, −6; t = −3.74), and visual areas (coordinates: 15, −75, 9; t = −3.82; and 12, −66, 33; t = −3.66). Increased activation (p = 0.001 uncorrected) was only found in nonsingers within right anterior insular cortex (coordinates: 48, 3, −3; t = 3.39).
Figure 4.
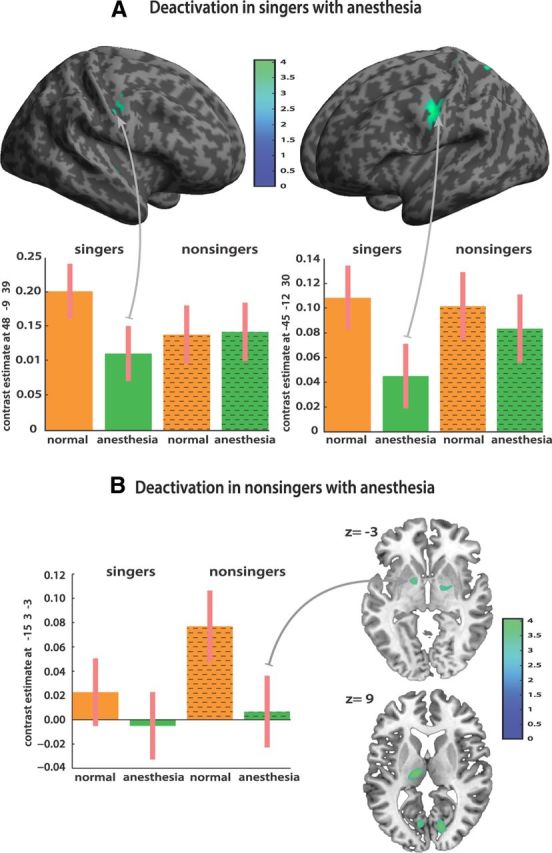
Direct contrast between singing with anesthesia and singing with normal feedback. A distinct pattern of significantly decreased activations emerged in the two groups. A, In the group of trained singers, anesthesia resulted in decreased BOLD activation within cortical sensorimotor and subcortical portions of the singing network, located in bilateral primary motor and left somatosensory cortex, right insula, thalamus, putamen, and the cerebellum in trained singers. B, Decreased activations in nonsingers comprised only subcortical motor areas (pallidum and the thalamus). All maps were thresholded for visual display at t = −3.1 voxel level and extent threshold of 10 voxels.
Table 1.
Effects of anesthesia on singing compared to normal singing
| Region | Hemisphere | Trained singers |
Nonsingers |
||
|---|---|---|---|---|---|
| x, y, z (mm) | Peak t | x, y, z (mm) | Peak t | ||
| Motor | |||||
| Area 4p | Left | −42, −12, 33 | −4.05 | ||
| Area 4a | Right | 48, −9, 39 | −3.86 | ||
| Somatosensory | |||||
| Area 3a | Left | −45, 12, 30 | −3.52 | ||
| Insula lobe | Right | 48, −3, −3 | −3.64 | 48, 3, −3 | 3.39, n.s. |
| Cerebellar | |||||
| Lobule VI | Left | −33, −45, −39 | −5.02 | ||
| Lobule VIIIb | Right | 15, −39, −51 | −3.95 | ||
| Subcortical | |||||
| Pallidum | Left | −15, 3, −3 | −4.00 | ||
| Putamen | Right | 27, 0, −3 | −4.02 | ||
| Thalamus | Left | −3, −15, 6 | −3.91 | −15, −18, 9 | −3.94 |
| Thalamus | Right | 15, −6, −6 | −3.74 | ||
MNI coordinates and local maxima of BOLD increases within the singing network (p < 0.001 uncorrected). For anatomic labeling we used Automated Anatomical Labeling (Tzourio-Mazoyer et al., 2002) or, where already cytoarchitectonically mapped, the Anatomy Toolbox (Eickhoff et al., 2005). n.s., Not significant.
To test directly the differential effect of anesthesia on the two groups, we ran a linear contrast (post hoc F test) within the singing network, testing the interaction between presence or absence of anesthesia across the two subject groups. There was a significant interaction effect in right anterior insular cortex (coordinates: 48, 0, −3; F = 22.08). For trained singers, anesthesia relative to normal singing resulted in decreased activation of right anterior insular while the opposite effect was observed in nonsingers (Fig. 5).
Figure 5.

Results from a linear contrast (post hoc F test) within the singing network testing the interaction between presence or absence of anesthesia across the two subject groups. The right anterior insular cortex was the principal area showing a significant dissociation across groups and conditions. For trained singers, anesthesia resulted in decreased activation of right anterior insular relative to normal singing while the opposite effect was observed in nonsingers. Bar graphs show contrast estimates and 90% confidence intervals.
Functional connectivity
Based on previous results, we also assessed patterns of functional connectivity between right anterior insula and the functional singing network. There were positive correlations in both groups during normal singing and anesthesia respectively, thus confirming an expected basic connectivity pattern within the singing network (Fig. 6A,B). This pattern involved bilateral auditory cortex, insular cortex, primary and secondary somatosensory cortex, primary motor and premotor cortex (supplementary motor area, BA6), Broca's homolog, the thalamus, and basal ganglia. In a second step, we applied t test statistics as implemented in the CONN toolbox for SPM to detect changes in connectivity between right AIC and an a priory defined ROI cluster (primary somatosensory, motor, and auditory cortex; see Materials and Methods) as a function of condition. While no voxel survived the statistical threshold of these tests (p < 0.001 uncorrected), lowering the threshold based on our hypotheses revealed a functionally meaningful pattern of decreases and increases in connectivity in both groups (Fig. 6, Table 2). In trained singers, connectivity decreased after anesthesia between right anterior insular, primary sensory (A1, S1), and motor cortex (M1), while no increased connectivity was found. In contrast, nonsingers showed increased connectivity between the same areas after anesthesia.
Figure 6.

Patterns of functional connectivity between the 5 mm spherical ROI (green pins) in the right anterior insular cortex and the singing network of singers (left side) and nonsingers (right side). A, Normal singing. B, Singing with anesthetized vocal-fold mucosa. Both conditions showed the expected connectivity pattern within the singing network. C, T test statistics were performed to detect changes in connectivity between right AIC and an a priory defined ROI (green outline; primary somatosensory, motor, and auditory cortex) as a function of condition. A reversed connectivity pattern emerged in both groups at lower threshold. In singers, connectivity decreased after anesthesia while it increased in nonsingers, suggesting a role of the AIC as a hub for gating sensorimotor integration in singing based on experience. Activation maps were superimposed using the cortex_20484.surf template in SPM8.
Table 2.
Changes in functional connectivity with right AIC between conditions
| Region | Trained singers |
Nonsingers |
||||||
|---|---|---|---|---|---|---|---|---|
| Hemisphere | x, y, z (mm) | Peak t | p | Hemisphere | x, y, z (mm) | Peak t | p | |
| Motor | ||||||||
| Area 4p | Left | −45, −12, 42 | −2.68 | 0.009 | Right | 45, −15, 36 | 2.31 | 0.020 |
| Area 4a | Right | 39, −12, 39 | −2.16 | 0.025 | ||||
| Somatosensory | ||||||||
| Area 3a | Right | 57, 0, 21 | −3.23 | 0.003 | Left | −36, −21, 33 | 2.43 | 0.017 |
| Right | 42, −12, 33 | 1.97 | 0.037 | |||||
| Area 3b | Right | 63, 0, 21 | −3.35 | 0.003 | Right | 60, 0, 21 | 2.20 | 0.025 |
| Left | −51, −6, 36 | −1.87 | 0.041 | Right | 66, 0, 18 | 2.15 | 0.027 | |
| Auditory | Right | 42, −24, 3 | −2.43 | 0.015 | Right | 42, −27, 12 | 2.13 | 0.028 |
| Left | −33, −33, 15 | 2.12 | 0.028 | |||||
MNI coordinates and local maxima of changes in functional connectivity with right AIC (x = 48, y = 0, z = −3) between conditions. Areas were assigned using the Anatomy Toolbox (Eickhoff et al., 2005).
Regression analysis with behavioral accuracy measures
A regression analysis was performed in both groups to test for correlations between BOLD response and changes in pitch accuracy after anesthesia relative to normal singing (Fig. 7). In trained singers, deviation from target pitch was positively correlated with activation in the right anterior insula (coordinates: 30, 24, −21; t = 5.5) bordering with the pars orbitalis of the inferior frontal gyrus. However, we cannot exclude the probability that this ventral area might be closer to the orbitofrontal cortex. A more dorsal activation focus within right anterior insula was also found but just missed significance within the singing network ROI (coordinates: 23, 24, −6; t = 3.46; p = 0.003 uncorrected). These results indicate that higher pitch accuracy coincided with decreased activity in right anterior insula of trained singers during the anesthesia condition relative to normal singing. No significant correlations within the singing network were found in nonsingers.
Figure 7.

Regression analysis with behavioral accuracy measures, testing for correlations between BOLD activity and singing accuracy after anesthesia within the singing network (p < 0.001 uncorrected; extent threshold, 5 voxels). Values of the x-axis represent pitch deviation in cents (unsigned), accumulated over each target tone pair. The y-axis depicts mean corrected parameter estimates. In trained singers, deviation from target pitch was positively correlated with activation in the right anterior insula. The left graph displays a significant correlation in a more ventral part of right AIC. The right graph shows a positive correlation in a more dorsal part of right AIC. No significant correlations within the singing network were found in nonsingers. Data were superimposed on the ch2better template using the MRIcron software with a lowered significance level of t = 2.5 for visual display and an extent threshold of six voxels.
Discussion
Summary of findings
We used fMRI to study the effects of altering somatosensory feedback via vocal-fold anesthesia on the vocal-motor singing network as a function of singing expertise. Pitch accuracy was less affected by anesthesia in singers than nonsingers; this difference was accompanied by distinct patterns of decreased activation after anesthesia in singers (cortical and subcortical sensory and motor areas) and nonsingers (subcortical motor areas only) respectively. Three separate sources of evidence suggest that the right AIC plays a key role in experience-dependent modulation of feedback integration during singing. First (Fig. 5), it responded differently to anesthesia in singers (decreased activation) and nonsingers (increased activation). Second, functional connectivity between AIC and bilateral A1, M1, and S1 was reduced in singers but augmented in nonsingers (Fig. 6C). Third, BOLD activity in right AIC in singers was positively correlated with larger pitch deviation under anesthesia (Fig. 7).
Role of auditory and somatosensory feedback
When we sing, we listen to our voice and make comparisons between intended and actually produced sounds. This obvious role of auditory feedback in vocal production has led to several behavioral (Burnett et al., 1998; Jones and Munhall, 2000; Larson et al., 2001, 2007, 2008; Amir et al., 2003) and neuroimaging (Zarate and Zatorre, 2008; Parkinson et al., 2012) investigations of the auditory-motor basis of singing and speaking. Although audition is important in monitoring voice production, somatosensory afferents also provide crucial information about vocal tract configurations (Tremblay et al., 2003). Clinical observations of adults with hearing loss suggest an essential role for somatosensory feedback in vocal behaviors (Perkell et al., 2007; Nasir and Ostry, 2008), as do studies of compensatory responses to mechanical perturbations of the jaw during speech articulation in healthy subjects (Shaiman and Gracco, 2002; Tremblay et al., 2003; Nasir and Ostry, 2006; Golfinopoulos et al., 2011; Lametti et al., 2012).
With respect to singing, however, additional mechanisms are required to account for the tighter pitch regulation in music compared with speech (Natke et al., 2003; Zatorre and Baum, 2012). Trained singers in our experiment showed superior overall pitch-matching ability compared with nonsingers, as expected (Hutchins and Peretz, 2011). One reason for this difference might be that somatosensory feedback becomes increasingly important with singing experience (Mürbe et al., 2004; Jones and Keough, 2008), which could also explain why singers can sing in tune despite high levels of competing accompanying background sounds (Sundberg, 1987). Lametti and colleagues (2012) argue that increased experience with a particular sensory modality could shape the sensitivity for that signal. Consistent with these observations, a recent neuroimaging experiment linked singing expertise to increased activation in bilateral ventral somatosensory cortices (Kleber et al., 2010), indicating an experience-dependent change in somatosensory-motor control over rapid vocal-fold oscillation (Titze and Hunter, 2004), which is subserved by somatosensory myotactic reflex mechanisms based on laryngeal mechanoreceptors (Wyke, 1974a, b; Gozaine and Clark, 2005; Ludlow, 2005).
Effect of anesthesia
Altered pitch-reproduction accuracy and elevated pitch levels were found in both groups after anesthesia (Fig. 2), thus confirming the behavioral effect of our intervention. Previous behavioral studies using similar anesthetization found larger responses to pitch-shifted feedback in nonsingers (Larson et al., 2008) as well as increased pitch deviation in trained singers (Sundberg et al., 1995). The counterintuitive observation that pitch accuracy was enhanced in nonsingers after anesthesia could be explained by compensatory changes in air pressure causing increased pitch levels (Baer, 1979; Titze, 1980) in combination with a largely negative pitch deviation during normal singing. Notably, behavioral effects of anesthesia were smaller in trained singers, indicating an experience-dependent difference in neural voice control. Overt singing revealed robust activation in the singing network across groups and conditions, as described in previous studies (Ozdemir et al., 2006; Kleber et al., 2007, 2010; Zarate and Zatorre, 2008), and thus validate our basic fMRI paradigm. A drop in functional activation of this network was seen after anesthesia (Fig. 3B), but each group revealed distinct patterns of decreased activation: in singers, bilateral ventral somatosensory and motor cortex, right anterior insula, the putamen, and the cerebellum were most affected, while in nonsingers, the decreases were limited to the pallidum and thalamus. Sensorimotor decreased activation in trained singers was localized within an area previously described as the laryngeal motor cortex (Brown et al., 2009; Simonyan and Horwitz, 2011; Grabski et al., 2012), which plays a major role in voluntary voice control and vocal learning. The LMC is functionally connected with all main cortical and subcortical motor areas required for vocal production and in humans is directly connected to motor neurons of the brainstem (Simonyan and Horwitz, 2011). Activation of LMC and ventral primary somatosensory cortex has been consistently found during overt and covert voice production and singing (Riecker et al., 2000; Ozdemir et al., 2006; Gunji et al., 2007; Kleber et al., 2007; Loucks et al., 2007) but was also linked to enhanced somatosensory voice control in trained singers (Kleber et al., 2010). These patterns of decreased activation correspond to behavioral effects after anesthesia reported above, supporting an experience-dependent effect of somatosensory perturbation. We propose that in trained singers anesthesia affected the explicit learning-dependent sensorimotor integration network, whereas in nonsingers the implicit subcortical motor loops were altered (Alexander and Crutcher, 1990; Halsband and Lange, 2006). Further decreased activations in singers involved the cerebellum (Jueptner et al., 1997) and the putamen, which is in line with our interpretation. The putamen is part of the motor–somatosensory corticostriatal loop and receives strong projections from the LMC (Seger, 2006). Putaminal lesions have been linked to dysarthria and dysphonia in humans but not in nonhuman primates, supporting a putative role of the putamen in learned voice production (Jürgens, 2002; Seghier and Price, 2010; Simonyan and Horwitz, 2011).
Role of insula
The right AIC was the principal area showing a distinct dissociation across groups and conditions (Fig. 5). The insula is regarded as a limbic sensory area and has been associated with interoceptive awareness and subjective feelings based on sensory integration (Craig, 2003, 2009). The right insula is particularly involved in self-awareness of actions (Karnath and Baier, 2010) and contributes to the coordination of vocal tract behaviors during overt singing (Riecker et al., 2000; Zarate and Zatorre, 2008). Both clinical (Dronkers, 1996; Afif et al., 2010) and neuroimaging studies (Bohland and Guenther, 2006; Remedios et al., 2009) support a role of the anterior insula in vocal behaviors and respiratory–vocal activity (Ackermann and Riecker, 2010). The insula is also involved in somatosensory pathways (Khalsa et al., 2009; Pugnaghi et al., 2011). Motor efferents interact with afferent signals from the larynx and the respiratory system carrying both somatosensory (spinal trigeminal nucleus) and visceral sensory (solitary tract nucleus) stimulus information, and project via the posterior ventromedial thalamus to somatosensory and insular cortices respectively (Jürgens, 2002; Ackermann and Riecker, 2004, 2010). The solitary tract nucleus also relays afferent signals to the parabrachial nucleus in the medulla, from where they project back onto medullary respiratory rhythm centers and laryngeal motor neurons of the nucleus ambiguus and nucleus retroambiguus (Smotherman, 2007). Thus, it is likely that anesthesia also affected visceral information required for respiratory–laryngeal coordination by altering subglottal air-pressure perception, in addition to affecting somatosensory signals from mechanoreceptors in the vocal-fold mucosa required for regulating laryngeal muscle tension. Results from neuroimaging studies support this argument by demonstrating a common sensorimotor system for the central motor control of both voluntary exhalation and phonation, which encompasses the AIC and the ventral somatosensory and motor cortex (Loucks et al., 2007; Simonyan et al., 2009). The dissociation between groups, which we observed in right AIC, suggests that this region might be essential in moderating the extent to which anesthesia affected pitch accuracy. As a function of experience, the AIC could either gate out somatosensory feedback or turn up the “gain.” Singers, whose pitch accuracy was less affected by anesthesia, might ignore somatosensory feedback and compensate with auditory feedback or, alternatively, rely on internal representations of acquired motor commands, whereas nonsingers might rely more on real-time sensory feedback (Jones and Keough, 2008). This latter idea is supported by other studies showing that trained singers are better than nonsingers at ignoring perturbed auditory feedback (Jones and Keough, 2008; Zarate and Zatorre, 2008).
Connectivity between right AIC and sensorimotor and auditory areas in the present and previous studies (Zarate and Zatorre, 2008; Zarate et al., 2010) confirms a role of the AIC as a hub for gating sensorimotor integration in singing. During anesthesia, this connectivity pattern changed, however (Fig. 6): we observed decreased connectivity in singers but increased connectivity in nonsingers, thus supporting the interpretation that singers suppress feedback, whereas nonsingers increasingly engage both the somatosensory and auditory feedback network. Further support for a disengagement from sensory feedback in singers comes from the regression results (Fig. 7), which showed that singers' ability to maintain pitch accuracy under anesthesia was related to decreased activity in right AIC. The two different regions in the connectivity and interaction results could be related to the mapping of differential functions within the insula, which have been described as a continuum of awareness between the posterior insula (primary intercoceptive representation) and the more cognitive integration of different functional systems in the anterior dorsal insula (Kurth et al., 2010).
Based on these results, we argue that vocal-skill training enables singers to temporarily suppress sensory feedback and rely largely on internal models of motor control instead.
Conclusions and implications for motor control models
In current models of speech motor control (Tian and Poeppel, 2010; Hickok et al., 2011; Houde and Nagarajan, 2011; Guenther and Vladusich, 2012), external sensory feedback is first used via primary auditory and somatosensory cortex to establish a relationship between motor commands and sensory consequences. Once the circuit is learned, a forward model, associated with premotor cortical regions (e.g., Broca's area), makes predictions about the current state of the effectors (e.g., vocal folds) and the sensory consequences of vocal tract movements via efference copies of motor commands. Feedback is then mainly used to update the forward model in case of prediction errors or perturbations. In conclusion, we suggest that expertise leads to an enhanced forward model that can lead to correct production in the absence of sensory feedback. In addition, we propose that the right AIC, a structure not typically part of these models, might play an important role in gating feedback and feedforward mechanisms based on the level of previously acquired expertise in vocal tasks because of its central role in integrating multiple sources of sensory input.
Footnotes
This work was supported by funding from the Canadian Institutes of Health Research, the Canada Fund for Innovation, and the Center of Excellence in Commercialization and Research to R.J.Z., and the Deutsche Forschungsgemeinschaft to B.K. (KL 2341/1-1). We thank the staff members of the McConnell Brain Imaging Centre of the Montreal Neurological Institute and the residents of the Department of Otolaryngology of the Royal Victoria Hospital for their technical assistance in carrying out the study. We also thank Dr. Sean Hutchins for fruitful discussions regarding vocal pitch analysis and Dr. Ralf Veit for his support with the analysis of fMRI data.
The authors declare no competing financial interests.
References
- Ackermann H, Riecker A. The contribution of the insula to motor aspects of speech production: a review and a hypothesis. Brain Lang. 2004;89:320–328. doi: 10.1016/S0093-934X(03)00347-X. [DOI] [PubMed] [Google Scholar]
- Ackermann H, Riecker A. The contribution(s) of the insula to speech production: a review of the clinical and functional imaging literature. Brain Struct Funct. 2010;214:419–433. doi: 10.1007/s00429-010-0257-x. [DOI] [PubMed] [Google Scholar]
- Afif A, Minotti L, Kahane P, Hoffmann D. Anatomofunctional organization of the insular cortex: a study using intracerebral electrical stimulation in epileptic patients. Epilepsia. 2010;51:2305–2315. doi: 10.1111/j.1528-1167.2010.02755.x. [DOI] [PubMed] [Google Scholar]
- Alexander GE, Crutcher MD. Functional architecture of basal ganglia circuits: neural substrates of parallel processing. Trends Neurosci. 1990;13:266–271. doi: 10.1016/0166-2236(90)90107-l. [DOI] [PubMed] [Google Scholar]
- Amir O, Amir N, Kishon-Rabin L. The effect of superior auditory skills on vocal accuracy. J Acoust Soc Am. 2003;113:1102–1108. doi: 10.1121/1.1536632. [DOI] [PubMed] [Google Scholar]
- Ashburner J, Friston KJ. Unified segmentation. Neuroimage. 2005;26:839–851. doi: 10.1016/j.neuroimage.2005.02.018. [DOI] [PubMed] [Google Scholar]
- Baer T. Reflex activation of laryngeal muscles by sudden induced subglottal pressure changes. J Acoust Soc Am. 1979;65:1271–1275. doi: 10.1121/1.382795. [DOI] [PubMed] [Google Scholar]
- Behzadi Y, Restom K, Liau J, Liu TT. A component based noise correction method (CompCor) for BOLD and perfusion based fMRI. Neuroimage. 2007;37:90–101. doi: 10.1016/j.neuroimage.2007.04.042. [DOI] [PMC free article] [PubMed] [Google Scholar]
- Bohland JW, Guenther FH. An fMRI investigation of syllable sequence production. Neuroimage. 2006;32:821–841. doi: 10.1016/j.neuroimage.2006.04.173. [DOI] [PubMed] [Google Scholar]
- Brown S, Laird AR, Pfordresher PQ, Thelen SM, Turkeltaub P, Liotti M. The somatotopy of speech: phonation and articulation in the human motor cortex. Brain Cogn. 2009;70:31–41. doi: 10.1016/j.bandc.2008.12.006. [DOI] [PMC free article] [PubMed] [Google Scholar]
- Burnett TA, Freedland MB, Larson CR, Hain TC. Voice F0 responses to manipulations in pitch feedback. J Acoust Soc Am. 1998;103:3153–3161. doi: 10.1121/1.423073. [DOI] [PubMed] [Google Scholar]
- Craig AD. Interoception: the sense of the physiological condition of the body. Current Opin Neurobiol. 2003;13:500–505. doi: 10.1016/s0959-4388(03)00090-4. [DOI] [PubMed] [Google Scholar]
- Craig AD. How do you feel–now? The anterior insula and human awareness. Nat Rev Neurosci. 2009;10:59–70. doi: 10.1038/nrn2555. [DOI] [PubMed] [Google Scholar]
- de Cheveigné A, Kawahara H. YIN, a fundamental frequency estimator for speech and music. J Acoust Soc Am. 2002;111:1917–1930. doi: 10.1121/1.1458024. [DOI] [PubMed] [Google Scholar]
- Dronkers NF. A new brain region for coordinating speech articulation. Nature. 1996;384:159–161. doi: 10.1038/384159a0. [DOI] [PubMed] [Google Scholar]
- Eickhoff SB, Stephan KE, Mohlberg H, Grefkes C, Fink GR, Amunts K, Zilles K. A new SPM toolbox for combining probabilistic cytoarchitectonic maps and functional imaging data. Neuroimage. 2005;25:1325–1335. doi: 10.1016/j.neuroimage.2004.12.034. [DOI] [PubMed] [Google Scholar]
- Friberg A, Schoonderwaldt E, Juslin PN. CUEX: an algorithm for extracting expressive tone variables from audio recordings. Acoustica United with Acta Acoustica. 2005;93:411–420. [Google Scholar]
- Friston KJ, Tononi G, Reeke GN, Jr, Sporns O, Edelman GM. Value-dependent selection in the brain: simulation in a synthetic neural model. Neuroscience. 1994;59:229–243. doi: 10.1016/0306-4522(94)90592-4. [DOI] [PubMed] [Google Scholar]
- Golfinopoulos E, Tourville JA, Bohland JW, Ghosh SS, Nieto-Castanon A, Guenther FH. fMRI investigation of unexpected somatosensory feedback perturbation during speech. Neuroimage. 2011;55:1324–1338. doi: 10.1016/j.neuroimage.2010.12.065. [DOI] [PMC free article] [PubMed] [Google Scholar]
- Gozaine TC, Clark KF. Function of the laryngeal mechanoreceptors during vocalization. Laryngoscope. 2005;115:81–88. doi: 10.1097/01.mlg.0000150699.38753.74. [DOI] [PubMed] [Google Scholar]
- Grabski K, Lamalle L, Vilain C, Schwartz JL, Vallée N, Tropres I, Baciu M, Le Bas JF, Sato M. Functional MRI assessment of orofacial articulators: neural correlates of lip, jaw, larynx, and tongue movements. Human Brain Mapp. 2012;33:2306–2321. doi: 10.1002/hbm.21363. [DOI] [PMC free article] [PubMed] [Google Scholar]
- Grell A, Sundberg J, Ternström S, Ptok M, Altenmüller E. Rapid pitch correction in choir singers. J Acoust Soc Am. 2009;126:407–413. doi: 10.1121/1.3147508. [DOI] [PubMed] [Google Scholar]
- Guenther FH. Cortical interactions underlying the production of speech sounds. J Commun Disord. 2006;39:350–365. doi: 10.1016/j.jcomdis.2006.06.013. [DOI] [PubMed] [Google Scholar]
- Guenther FH, Vladusich T. A neural theory of speech acquisition and production. J Neurolinguistics. 2012;25:408–422. doi: 10.1016/j.jneuroling.2009.08.006. [DOI] [PMC free article] [PubMed] [Google Scholar]
- Gunji A, Ishii R, Chau W, Kakigi R, Pantev C. Rhythmic brain activities related to singing in humans. Neuroimage. 2007;34:426–434. doi: 10.1016/j.neuroimage.2006.07.018. [DOI] [PubMed] [Google Scholar]
- Halsband U, Lange RK. Motor learning in man: a review of functional and clinical studies. J Physiol Paris. 2006;99:414–424. doi: 10.1016/j.jphysparis.2006.03.007. [DOI] [PubMed] [Google Scholar]
- Hickok G. Computational neuroanatomy of speech production. Nat Rev Neurosci. 2012;13:135–145. doi: 10.1038/nrn3158. [DOI] [PMC free article] [PubMed] [Google Scholar]
- Hickok G, Houde J, Rong F. Sensorimotor integration in speech processing: computational basis and neural organization. Neuron. 2011;69:407–422. doi: 10.1016/j.neuron.2011.01.019. [DOI] [PMC free article] [PubMed] [Google Scholar]
- Houde JF, Nagarajan SS. Speech production as state feedback control. Front Hum Neurosci. 2011;5:82. doi: 10.3389/fnhum.2011.00082. [DOI] [PMC free article] [PubMed] [Google Scholar]
- Hutchins S, Peretz I. Perception and action in singing. Prog Brain Res. 2011;191:103–118. doi: 10.1016/B978-0-444-53752-2.00010-2. [DOI] [PubMed] [Google Scholar]
- Jones JA, Keough D. Auditory-motor mapping for pitch control in singers and nonsingers. Exp Brain Res. 2008;190:279–287. doi: 10.1007/s00221-008-1473-y. [DOI] [PMC free article] [PubMed] [Google Scholar]
- Jones JA, Munhall KG. Perceptual calibration of F0 production: evidence from feedback perturbation. J Acoust Soc Am. 2000;108:1246–1251. doi: 10.1121/1.1288414. [DOI] [PubMed] [Google Scholar]
- Jones JA, Munhall KG. Remapping auditory-motor representations in voice production. Curr Biol. 2005;15:1768–1772. doi: 10.1016/j.cub.2005.08.063. [DOI] [PubMed] [Google Scholar]
- Jueptner M, Ottinger S, Fellows SJ, Adamschewski J, Flerich L, Müller SP, Diener HC, Thilmann AF, Weiller C. The relevance of sensory input for the cerebellar control of movements. Neuroimage. 1997;5:41–48. doi: 10.1006/nimg.1996.0249. [DOI] [PubMed] [Google Scholar]
- Jürgens U. Neural pathways underlying vocal control. Neurosci Biobehav Rev. 2002;26:235–258. doi: 10.1016/s0149-7634(01)00068-9. [DOI] [PubMed] [Google Scholar]
- Karnath HO, Baier B. Right insula for our sense of limb ownership and self-awareness of actions. Brain Struct Funct. 2010;214:411–417. doi: 10.1007/s00429-010-0250-4. [DOI] [PubMed] [Google Scholar]
- Khalsa SS, Rudrauf D, Feinstein JS, Tranel D. The pathways of interoceptive awareness. Nat Neurosci. 2009;12:1494–1496. doi: 10.1038/nn.2411. [DOI] [PMC free article] [PubMed] [Google Scholar]
- Kleber B, Birbaumer N, Veit R, Trevorrow T, Lotze M. Overt and imagined singing of an Italian aria. Neuroimage. 2007;36:889–900. doi: 10.1016/j.neuroimage.2007.02.053. [DOI] [PubMed] [Google Scholar]
- Kleber B, Veit R, Birbaumer N, Gruzelier J, Lotze M. The brain of opera singers: experience-dependent changes in functional activation. Cereb Cortex. 2010;20:1144–1152. doi: 10.1093/cercor/bhp177. [DOI] [PubMed] [Google Scholar]
- Kurth F, Zilles K, Fox PT, Laird AR, Eickhoff SB. A link between the systems: functional differentiation and integration within the human insula revealed by meta-analysis. Brain Struct Funct. 2010;214:519–534. doi: 10.1007/s00429-010-0255-z. [DOI] [PMC free article] [PubMed] [Google Scholar]
- Lametti DR, Nasir SM, Ostry DJ. Sensory preference in speech production revealed by simultaneous alteration of auditory and somatosensory feedback. J Neurosci. 2012;32:9351–9358. doi: 10.1523/JNEUROSCI.0404-12.2012. [DOI] [PMC free article] [PubMed] [Google Scholar]
- Larson CR, Burnett TA, Bauer JJ, Kiran S, Hain TC. Comparison of voice F0 responses to pitch-shift onset and offset conditions. J Acoust Soc Am. 2001;110:2845–2848. doi: 10.1121/1.1417527. [DOI] [PMC free article] [PubMed] [Google Scholar]
- Larson CR, Sun J, Hain TC. Effects of simultaneous perturbations of voice pitch and loudness feedback on voice F0 and amplitude control. J Acoust Soc Am. 2007;121:2862–2872. doi: 10.1121/1.2715657. [DOI] [PubMed] [Google Scholar]
- Larson CR, Altman KW, Liu H, Hain TC. Interactions between auditory and somatosensory feedback for voice F0 control. Exp Brain Res. 2008;187:613–621. doi: 10.1007/s00221-008-1330-z. [DOI] [PMC free article] [PubMed] [Google Scholar]
- Levitt H. Transformed up-down methods in psychoacoustics. J Acoust Soc Am. 1971;49(Suppl 2):467. + [PubMed] [Google Scholar]
- Liu H, Larson CR. Effects of perturbation magnitude and voice F0 level on the pitch-shift reflex. J Acoust Soc Am. 2007;122:3671–3677. doi: 10.1121/1.2800254. [DOI] [PubMed] [Google Scholar]
- Loucks TM, Poletto CJ, Simonyan K, Reynolds CL, Ludlow CL. Human brain activation during phonation and exhalation: common volitional control for two upper airway functions. Neuroimage. 2007;36:131–143. doi: 10.1016/j.neuroimage.2007.01.049. [DOI] [PMC free article] [PubMed] [Google Scholar]
- Ludlow CL. Central nervous system control of the laryngeal muscles in humans. Respir Physiol Neurobiol. 2005;147:205–222. doi: 10.1016/j.resp.2005.04.015. [DOI] [PMC free article] [PubMed] [Google Scholar]
- Minogue SC, Ralph J, Lampa MJ. Laryngotracheal topicalization with lidocaine before intubation decreases the incidence of coughing on emergence from general anesthesia. Anesth Analg. 2004;99:1253–1257. doi: 10.1213/01.ANE.0000132779.27085.52. table of contents. [DOI] [PubMed] [Google Scholar]
- Mürbe D, Pabst F, Hofmann G, Sundberg J. Effects of a professional solo singer education on auditory and kinesthetic feedback–a longitudinal study of singers' pitch control. J Voice. 2004;18:236–241. doi: 10.1016/j.jvoice.2003.05.001. [DOI] [PubMed] [Google Scholar]
- Nasir SM, Ostry DJ. Somatosensory precision in speech production. Curr Biol. 2006;16:1918–1923. doi: 10.1016/j.cub.2006.07.069. [DOI] [PubMed] [Google Scholar]
- Nasir SM, Ostry DJ. Speech motor learning in profoundly deaf adults. Nat Neurosci. 2008;11:1217–1222. doi: 10.1038/nn.2193. [DOI] [PMC free article] [PubMed] [Google Scholar]
- Natke U, Donath TM, Kalveram KT. Control of voice fundamental frequency in speaking versus singing. J Acoust Soc Am. 2003;113:1587–1593. doi: 10.1121/1.1543928. [DOI] [PubMed] [Google Scholar]
- Ozdemir E, Norton A, Schlaug G. Shared and distinct neural correlates of singing and speaking. Neuroimage. 2006;33:628–635. doi: 10.1016/j.neuroimage.2006.07.013. [DOI] [PubMed] [Google Scholar]
- Parkinson AL, Flagmeier SG, Manes JL, Larson CR, Rogers B, Robin DA. Understanding the neural mechanisms involved in sensory control of voice production. Neuroimage. 2012;61:314–322. doi: 10.1016/j.neuroimage.2012.02.068. [DOI] [PMC free article] [PubMed] [Google Scholar]
- Perkell JS, Lane H, Denny M, Matthies ML, Tiede M, Zandipour M, Vick J, Burton E. Time course of speech changes in response to unanticipated short-term changes in hearing state. J Acoust Soc Am. 2007;121:2296–2311. doi: 10.1121/1.2642349. [DOI] [PubMed] [Google Scholar]
- Pugnaghi M, Meletti S, Castana L, Francione S, Nobili L, Mai R, Tassi L. Features of somatosensory manifestations induced by intracranial electrical stimulations of the human insula. Clinical Neurophysiol. 2011;122:2049–2058. doi: 10.1016/j.clinph.2011.03.013. [DOI] [PubMed] [Google Scholar]
- Raphael JH, Stanley GD, Langton JA. Effects of topical benzocaine and lignocaine on upper airway reflex sensitivity. Anaesthesia. 1996;51:114–118. doi: 10.1111/j.1365-2044.1996.tb07695.x. [DOI] [PubMed] [Google Scholar]
- Remedios R, Logothetis NK, Kayser C. An auditory region in the primate insular cortex responding preferentially to vocal communication sounds. J Neurosci. 2009;29:1034–1045. doi: 10.1523/JNEUROSCI.4089-08.2009. [DOI] [PMC free article] [PubMed] [Google Scholar]
- Riecker A, Ackermann H, Wildgruber D, Dogil G, Grodd W. Opposite hemispheric lateralization effects during speaking and singing at motor cortex, insula and cerebellum. Neuroreport. 2000;11:1997–2000. doi: 10.1097/00001756-200006260-00038. [DOI] [PubMed] [Google Scholar]
- Ruetsch YA, Böni T, Borgeat A. From cocaine to ropivacaine: the history of local anesthetic drugs. Curr Top Med Chem. 2001;1:175–182. doi: 10.2174/1568026013395335. [DOI] [PubMed] [Google Scholar]
- Seger CA. The basal ganglia in human learning. Neuroscientist. 2006;12:285–290. doi: 10.1177/1073858405285632. [DOI] [PubMed] [Google Scholar]
- Seghier ML, Price CJ. Reading aloud boosts connectivity through the putamen. Cereb Cortex. 2010;20:570–582. doi: 10.1093/cercor/bhp123. [DOI] [PMC free article] [PubMed] [Google Scholar]
- Shaiman S, Gracco VL. Task-specific sensorimotor interactions in speech production. Exp Brain Res. 2002;146:411–418. doi: 10.1007/s00221-002-1195-5. [DOI] [PubMed] [Google Scholar]
- Simonyan K, Horwitz B. Laryngeal motor cortex and control of speech in humans. Neuroscientist. 2011;17:197–208. doi: 10.1177/1073858410386727. [DOI] [PMC free article] [PubMed] [Google Scholar]
- Simonyan K, Ostuni J, Ludlow CL, Horwitz B. Functional but not structural networks of the human laryngeal motor cortex show left hemispheric lateralization during syllable but not breathing production. J Neurosci. 2009;29:14912–14923. doi: 10.1523/JNEUROSCI.4897-09.2009. [DOI] [PMC free article] [PubMed] [Google Scholar]
- Smith A, Zelaznik HN. Development of functional synergies for speech motor coordination in childhood and adolescence. Dev Psychobiol. 2004;45:22–33. doi: 10.1002/dev.20009. [DOI] [PubMed] [Google Scholar]
- Smotherman MS. Sensory feedback control of mammalian vocalizations. Behav Brain Res. 2007;182:315–326. doi: 10.1016/j.bbr.2007.03.008. [DOI] [PMC free article] [PubMed] [Google Scholar]
- Sundberg J. The science of the singing voice. DeKalb, IL: Northern Illinois UP; 1987. [Google Scholar]
- Sundberg J, Iwarsson J, Billström AH. Significance of mechanoreceptors in the subglottal mucosa for subglottal pressure control in singers. J Voice. 1995;9:20–26. doi: 10.1016/s0892-1997(05)80219-x. [DOI] [PubMed] [Google Scholar]
- Tian X, Poeppel D. Mental imagery of speech and movement implicates the dynamics of internal forward models. Front Psychol. 2010;1:166. doi: 10.3389/fpsyg.2010.00166. [DOI] [PMC free article] [PubMed] [Google Scholar]
- Titze IR. Comments on the myoelastic–aerodynamic theory of phonation. J Speech Hear Res. 1980;23:495–510. doi: 10.1044/jshr.2303.495. [DOI] [PubMed] [Google Scholar]
- Titze IR, Hunter EJ. Normal vibration frequencies of the vocal ligament. J Acoust Soc Am. 2004;115:2264–2269. doi: 10.1121/1.1698832. [DOI] [PMC free article] [PubMed] [Google Scholar]
- Tremblay S, Shiller DM, Ostry DJ. Somatosensory basis of speech production. Nature. 2003;423:866–869. doi: 10.1038/nature01710. [DOI] [PubMed] [Google Scholar]
- Tzourio-Mazoyer N, Landeau B, Papathanassiou D, Crivello F, Etard O, Delcroix N, Mazoyer B, Joliot M. Automated anatomical labeling of activations in SPM using a macroscopic anatomical parcellation of the MNI MRI single-subject brain. Neuroimage. 2002;15:273–289. doi: 10.1006/nimg.2001.0978. [DOI] [PubMed] [Google Scholar]
- Worsley KJ, Chen JI, Lerch J, Evans AC. Comparing functional connectivity via thresholding correlations and singular value decomposition. Philos Trans R Soc Lond B. 2005;360:913–920. doi: 10.1098/rstb.2005.1637. [DOI] [PMC free article] [PubMed] [Google Scholar]
- Wyke BD. Laryngeal myotatic reflexes and phonation. Folia Phoniatrica. 1974a;26:249–264. doi: 10.1159/000263784. [DOI] [PubMed] [Google Scholar]
- Wyke BD. Laryngeal neuromuscular control systems in singing. A review of current concepts. Folia Phoniatrica. 1974b;26:295–306. doi: 10.1159/000263791. [DOI] [PubMed] [Google Scholar]
- Zarate JM, Zatorre RJ. Experience-dependent neural substrates involved in vocal pitch regulation during singing. Neuroimage. 2008;40:1871–1887. doi: 10.1016/j.neuroimage.2008.01.026. [DOI] [PubMed] [Google Scholar]
- Zarate JM, Wood S, Zatorre RJ. Neural networks involved in voluntary and involuntary vocal pitch regulation in experienced singers. Neuropsychologia. 2010;48:607–618. doi: 10.1016/j.neuropsychologia.2009.10.025. [DOI] [PubMed] [Google Scholar]
- Zatorre RJ, Baum SR. Musical melody and speech intonation: singing a different tune. PLoS Biol. 2012;10:e1001372. doi: 10.1371/journal.pbio.1001372. [DOI] [PMC free article] [PubMed] [Google Scholar]
- Zatorre RJ, Chen JL, Penhune VB. When the brain plays music: auditory-motor interactions in music perception and production. Nat Rev Neurosci. 2007;8:547–558. doi: 10.1038/nrn2152. [DOI] [PubMed] [Google Scholar]