

Abstract
How is the cognitive performance of the human brain related to its topological and spatial organization as a complex network embedded in anatomical space? To address this question, we used nicotine replacement and duration of attentionally demanding task performance (time-on-task), as experimental factors expected, respectively, to enhance and impair cognitive function. We measured resting-state fMRI data, performance and brain activation on a go/no-go task demanding sustained attention, and subjective fatigue in n = 18 healthy, briefly abstinent, cigarette smokers scanned repeatedly in a placebo-controlled, crossover design. We tested the main effects of drug (placebo vs Nicorette gum) and time-on-task on behavioral performance and brain functional network metrics measured in binary graphs of 477 regional nodes (efficiency, measure of integrative topology; clustering, a measure of segregated topology; and the Euclidean physical distance between connected nodes, a proxy marker of wiring cost). Nicotine enhanced attentional task performance behaviorally and increased efficiency, decreased clustering, and increased connection distance of brain networks. Greater behavioral benefits of nicotine were correlated with stronger drug effects on integrative and distributed network configuration and with greater frequency of cigarette smoking. Greater time-on-task had opposite effects: it impaired attentional accuracy, decreased efficiency, increased clustering, and decreased connection distance of networks. These results are consistent with hypothetical predictions that superior cognitive performance should be supported by more efficient, integrated (high capacity) brain network topology at greater connection distance (high cost). They also demonstrate that brain network analysis can provide novel and theoretically principled pharmacodynamic biomarkers of pro-cognitive drug effects in humans.
Introduction
There is increasing interest in understanding the brain as a complex system, which can be represented using graph theory as a network of neuronal or regional nodes connected by edges (Bullmore and Bassett, 2011; Sporns, 2011). Brain graphs highlight the topological pattern of (axonal or synaptic) connections between (regional or neuronal) nodes. It has been found that human brain functional networks, in common with many other complex systems (Stam, 2004; Skudlarski et al., 2008; Deuker et al., 2009; Fornito et al., 2011; Gallos et al., 2012), have nonrandom topological features, including the small-world property of high efficiency (or short path length between pairs of nodes) combined with high clustering (a measure of cliquish connections between topologically neighboring nodes) (Onnela et al., 2004; Bassett et al., 2010). However, it is not yet clear how the topological properties of human brain networks can be related to their information processing functions.
Previous studies have shown that individual differences in the global efficiency of normal human brain networks are associated with individual differences in the IQ or working memory task performance (Hampson et al., 2006; Li et al., 2009; van den Heuvel et al., 2009). These results are compatible with some contemporary network theories of information processing in the brain [like the “brainweb” (Varela et al., 2001) or “workspace” theories (Dehaene et al., 1998; Baars, 2002)] that predict that fast and automatic processing may be computed in spatially localized and topologically segregated brain regions, but slower, more consciously effortful or attentionally demanding task performance is dependent on a more topologically integrated and spatially distributed network architecture. By this account, superior cognitive performance should be associated with greater efficiency of information transfer (shorter characteristic path length) and less topological clustering, subtended by greater mean anatomical distance between connected nodes.
We tested these hypothetical predictions directly using a novel experiment designed to measure brain functional networks under experimentally controlled conditions of two factors—nicotine and fatigue-inducing sustained task performance—that were expected, respectively, to enhance and impair cognitive function in healthy cigarette smokers. Nicotine abstinence in dependent cigarette smokers is associated with a state of relative cognitive impairment, which can be restored by nicotine replacement (Newhouse et al., 2004); nicotine-induced improvements on behavioral performance have also been described in the absence of nicotine withdrawal (Pritchard et al., 1992; Warburton and Arnall, 1994). We therefore expected that nicotine administration would be associated with improved task performance as well as greater efficiency and connection distance of brain functional networks in briefly abstinent cigarette smokers. Conversely, fatigue is well known to be associated with impaired cognitive performance (Smit et al., 2004; Holtzer et al., 2011). We therefore predicted that, as the duration of task performance was increased and participants became subjectively more fatigued, functional networks would adopt a less globally efficient, more locally clustered, configuration with shorter distances between functionally connected nodes.
Materials and Methods
Participants.
Eighteen healthy right-handed cigarette smokers were recruited (mean ± SEM, age, 27.56 ± 1.84 years; range, 19–44 years; 11 men and 7 females). Subjects smoked on average 16.3 ± 2.02 cigarettes/d (mean ± SEM; range, 6–35 cigarettes/d). The Fagerström scale scores (range, 0–10; Fagerström, 1978; Heatherton et al., 1991) indicated mild-to-moderate degrees of nicotine dependence (mean ± SEM, 3.47 ± 0.55; range, 0–8.5). Subjects with >4 mm translation or 4° of head rotation in any plane during fMRI scanning were excluded from additional analysis (n = 1).
Ethical approval was obtained from the ethics committee of the German Psychological Association. All procedures were performed with written informed consent of all subjects and in accordance with the principles of the Declaration of Helsinki.
Nicotine administration.
Participants were studied in a double-blind, randomized, placebo-controlled, crossover design: once after nicotine and once after placebo. Nicotine was delivered in the form of a 4 mg nicotine polacrilex gum (Nicorette; McNeil AB), a nicotine dose that has strong effects on attentional performance in cigarette smokers (Parrott and Craig, 1992). A form-, taste-, and size-matched gum served as placebo (McNeil AB). To control for effects of chew rate, subjects were asked to chew the gum at a rate of one chew per 1.5 s (controlled by a metronome; Nemeth-Coslett et al., 1988). The gum was chewed for 30 min, which is approximately the time of maximum plasma concentration of nicotine reported previously after gum administration (Benowitz et al., 1988). Scanning started immediately after chewing had finished and lasted for 43 min. It has been reported that plasma concentrations of nicotine remain stable over this time period after administration of a single dose by gum chewing (Benowitz et al., 1988; Hukkanen et al., 2005).
Design and fMRI paradigm.
The two sessions were separated by at least 2 weeks. All subjects were instructed to refrain from smoking 2 h before the experiment, and indeed they reported that they smoked their last cigarette on average >2 h before the beginning of the experiment (mean ± SEM, 144.72 ± 11.43 min). The self-reported duration of nicotine abstinence before testing did not significantly differ between drug conditions (mean ± SEM, placebo, 155.83 ± 20.04; nicotine, 133.61 ± 9.39; t(17) = 1.03, p = 0.31). Furthermore, to corroborate self-reported assessments of recent smoking behavior, the carbon monoxide concentration in exhaled air was measured (CO-Check; NeoMed). The carbon monoxide level is correlated with the blood level of carboxyhemoglobin and is a marker of tobacco smoke absorption and smoking behavior (Wald et al., 1981; Cunnington and Hormbrey, 2002). The breath test of carbon monoxide level for each subject revealed no significant differences in smoking behavior before the two test conditions (t(17) = 0.56, p = 0.58; mean [CO] before placebo, 24.11 ± 2.77 ppm; mean [CO] before nicotine, 23.22 ± 2.76 ppm).
Each scanning session was divided into different time periods in which either resting-state oscillations or task-related activations were measured using fMRI (Fig. 1A,B). There were three resting-state blocks comprising 256, 256, and 512 scans; each block of 256 scans corresponded to 6.4 min. The third resting-state block was subsequently divided into two halves, resulting in four resting-state periods with 256 scans each. There were two task blocks, each comprising 339 scans acquired during presentation of task instructions and 238 trials over the course of 8.5 min. Thus, the scanning experiment lasted 43 min in total.
Figure 1.

Experimental task and nicotine effects on behavior. A, Paradigm. Subjects were assessed in two fMRI sessions, once after placebo and once after nicotine in a double-blind crossover design. Each fMRI session consisted of four resting-state and two task periods. B, Task. During task periods, subjects performed a continuous performance test; during rest periods, subjects kept their eyes open and looked at a centrally presented stimulus (%%%). C, Behavioral effects of nicotine. Left, Nicotine significantly reduced reaction times to go trials (error bars indicate mean ± SEM); right, scatter plot of the effect of nicotine on errors in no-go trials [no-go errors (nicotine) − no-go errors (placebo); y-axis] versus no-go errors at baseline, after placebo (x-axis). Participants who performed the task least well at baseline demonstrated the greatest performance-enhancing effects of nicotine (gray areas within the regression plot represent the 95% confidence interval for the fitted regression line).
During task blocks, participants performed a version of the reversed continuous performance test (Conners, 1995). Sets of three letters were serially presented at a central location (Fig. 1B). Participants were instructed to press a button when the central letter was a prespecified go stimulus (“C,” “G,” “D,” “W,” “K,” or “Y”) and not to press the button when the central letter was one of two no-go stimuli (“X” or “O”; balanced over subjects). Each central letter was flanked by a pair of identical letters (“X” or “O”). Between letter presentations, fixation crosses were presented (“+++”). Behavioral performance was measured by the latency of correct response to the go trials and by the accuracy of response to the no-go trials. No-go commission errors entailed incorrectly making a motor response to one of the designated no-go stimuli.
During the resting-state periods, participants were instructed to lie quietly with their eyes open (Raichle et al., 2001, p 680) and to attend to a centrally presented stimulus (“%%%”).
Before and after each scanning session, participants completed questionnaire measures of subjective fatigue, including the German Multidimensional Mood State Questionnaire (Steyer et al., 1997) and the Stanford Sleepiness Scale (Hoddes et al., 1996).
fMRI data acquisition.
A Siemens MAGNETOM Sonata MRI system (1.5 T) was used to obtain T2*-weighted echo-planar images with BOLD contrast. A total of 1729 volumes of 17 4-mm-thick axial slices were acquired sequentially with between-slice gap of 1.6 mm, repetition time of 1.5 s, echo time of 50 ms, matrix size of 64 × 64, and voxel size of 3.125 × 3.125 × 4 mm3.
Preprocessing and time series analysis.
The brain scans were corrected for head motion by spatially realigning them to the first brain volume, and the time series of each voxel was corrected for slice timing offsets using SPM5 (http://www.fil.ion.ucl.ac.uk/spm/). The functional images were spatially normalized to standard stereotaxic MNI space (Montreal Neurological Institute; http://www.mni.mcgill.ca/). Based on an anatomically parcellated and labeled T1 volume provided by the AAL toolbox (Tzourio-Mazoyer et al., 2002), a brain template with 477 cortical and subcortical brain regions was generated by randomly subdividing each parcel of the AAL template into smaller subparcels. To avoid possible biasing effects of parcel sizes on functional connectivity (Salvador et al., 2008; Fornito et al., 2010), we ensured that the range in size of the 477 nodes generated by subparcellating the AAL template was substantially smaller (0.10–6.81 cm3; sixfold smaller) than the range in size of the 90 nodes of the template (1.76–40.83 cm3, regions of cerebellum were excluded).
This template was used to extract the mean fMRI time series for each region for each participant during each resting-state period (Zalesky et al., 2010).
To account for signal changes attributable to head movements, each regional mean time series was regressed on the estimated time series of six head movement parameters (translations and rotations in all three planes).
To assess the possible impact of small, transient head movements on functional connectivity measures, we measured framewise displacements of the preprocessed time series and removed all frames of data that might have been affected by head motion [total framewise displacement >0.5 mm or when the root mean square of voxelwise percentage signal change is >0.5%] following previously published methods for “scrubbing” (Power et al., 2012). We calculated the relationship between ΔR (“scrubbed” correlation matrix minus “unscrubbed” correlation matrix) and the Euclidean distance between pairs of brain nodes. We first computed this at the single-subject level and subsequently averaged ΔR values across subjects for the group-level analysis, as described by Power et al. (2012).
Using the maximal overlap discrete wavelet transform (Percival and Walden, 2006), each regional time series was bandpass filtered into five wavelet scales corresponding to different frequency intervals. The wavelet correlation was estimated between each pair of regional time series at each wavelet scale. This resulted in a set of five wavelet scale-specific association matrices for each subject and resting-state period. The global strength of functional connectivity was estimated simply as the mean of each association matrix. In a first step, the global connectivity strengths were compared between different drug conditions, resting-state periods and frequency ranges in an overall ANOVA. In a second step, effects of nicotine and placebo were compared in each frequency scale with paired t tests.
Graph analyses.
Binary graphs of arbitrary connection density were constructed by thresholding each association matrix to create an adjacency matrix. A thresholding algorithm based on the minimum spanning tree (MST) was used to ensure that all regional nodes were connected by at least one edge to the rest of the network even at the sparsest connection density (Alexander-Bloch et al., 2010).
Networks were constructed at 15 different connection densities, in the range 1.7–50%, with smaller sampling intervals at the sparser or less densely connected end of the range. The connection density defines the number of edges in a graph and is expressed as the number of edges in the graph as a percentage of the maximum possible number of edges: (N × N − N)/2 = 113,526. Three key topological metrics were estimated for each graph at each connection density: (1) the global efficiency; (2) the nodal efficiency; and (3) the local efficiency (Latora and Marchiori, 2001).
Global efficiency (Eglobal) is a measure of the capacity of the network for parallel information transfer and is estimated by the inverse of the harmonic mean of the minimum path lengths (the smallest number of intervening edges) between each pair of nodes Li,j, and N is the number of nodes within the graph G:
 |
Thus, networks that have a highly integrated organization, characterized by short minimum path length between any pair of regional nodes, will have high global efficiency. The nodal efficiency is likewise inversely related to the path length of connections between a particular node and the rest of the network:
 |
Local efficiency is closely related to the clustering coefficient (Watts and Strogatz, 1998) and reflects the capacity of the network for information transfer between the nearest neighbors of a particular node i:
 |
where NGi is the number of nodes in the nearest neighborhood subgraph Gi (nodes with a direct connection to node i). This can be averaged over all nodes to estimate the local efficiency of the graph as a whole. Thus, networks that have a cliquish organization, characterized by many connections between the nearest neighbors of any given node, will have high local efficiency or clustering. To avoid terminological confusion with global and nodal efficiency, we will refer to this metric here as a measure of clustering.
Physical distance of functional connections.
The physical distance between connected nodes was estimated simply as the Euclidean distance between the centroids of each region in a standard stereotactic space. Like the metrics of network topology, mean physical connection distance was estimated for each graph at each connection density in the range 1.7–50%. For each network at 50% connection density, we also estimated the distribution of connection distance by counting the number of edges in each of several bins ranging from shortest distance (0–10 mm) to longest distance (160–170 mm).
Statistical analyses of behavioral and topology measures.
Repeated-measures ANOVA models were used to estimate the main effect of drug (placebo vs nicotine), the main effect of time-on-task, and the drug × time interaction for each behavioral variable and each resting-state network metric. For the analysis of resting-state network metrics, each metric was averaged over the connection density range (1.7–50%) defined a priori. Because our graph-building algorithm was based on the MST, we used a multiple of the number of edges of the MST (476 = N − 1) for the first sampling point [4 times the number of edges of the MST = (476 × 4)/((4772 − 477)/2) = 1.7% connection density]. In agreement with previous studies on functional brain topology (Lynall et al., 2010), we stopped at 50% connection density because connections at higher costs are likely to be nonbiological and influenced by noise. Furthermore, a cost range up to 50% covers the cost levels in which previous analyses found drug effects on functional brain network topology (Achard and Bullmore, 2007). We averaged graph metrics across the entire cost range to avoid multiple comparisons at individual sampling points and to reduce the dependency of any significant differences in network topology on the arbitrary choice of a single connection density. This approach has been used in previous graph analyses (Bassett et al., 2008; Lynall et al., 2010), and its theoretical background was discussed in detail by Ginestet et al. (2011). For the behavioral data, time-on-task was modeled as a categorical factor with two levels, corresponding to the two task blocks during which behavior was recorded. For the network data, time-on-task was modeled as a categorical factor with four levels, corresponding to the four resting-state periods during which fMRI data were recorded. In all regression modeling of the effects of time-on-task, this factor was coded in minutes, corresponding to the midpoint in time of each of the task or resting-state blocks.
We estimated Pearson's correlations to explore the relationships between the effects of nicotine on network metrics and its effects on behavior and to explore the relationships between nicotine consumption and the behavioral and network effects of nicotine replacement. For statistical inference on behavioral and global network metrics, we used p < 0.05 as the threshold for significance. To control type 1 error in the context of the multiple comparisons entailed by analysis of nodal efficiency and clustering at each of 477 regional nodes, we used p < 0.002 (1 of 477) as the threshold for significance, so that less than one false positive test is expected for each whole-brain analysis of nodal network properties. Effects on nodal level were investigated in networks with 10% connection density (i.e., the connection density associated with the strongest network effects of nicotine and time-on-task; see Fig. 2).
Figure 2.

Effects of nicotine and time-on-task on brain network topology. A, Nicotine effects on global efficiency. Nicotine increased global efficiency mostly in sparse networks with low connection density. The plot shows the effect of nicotine (global efficiency nicotine − global efficiency placebo) as a function of connection density averaged over the four resting-state periods. B, Nicotine effects on clustering as a function of connection density. Nicotine decreased clustering especially at sparse densities. C, Global efficiency and clustering are plotted for placebo and nicotine (averaged over the 4 resting-state periods and the entire range of connection densities). D, E, Time-on-task effects on global efficiency (D) and clustering (E) are plotted for each resting-state period over the range of connection densities: greater time-on-task is associated with decreased efficiency and increased clustering of networks in later resting-state periods compared with the first period of resting-state data. F, Global efficiency linearly decreased and mean clustering linearly increased over time on average over all connection densities.
Overlap between task-related activations and changes in network topology.
In an additional analysis, we investigated how nodal changes in resting-state network topology might be related to brain regional activation by task-related processing. Therefore, fMRI data acquired during the two different task periods within the placebo condition were corrected for head movements and slice timing offsets and were spatially smoothed with a three-dimensional Gaussian filter (8 mm full-width at half-maximum). Task activations for go and no-go trials were modeled for each subject separately using a general linear model. For each subject, the contrast between correct no-go and go trials was estimated. In a group-level analysis, these contrasts were tested for significance by a one-sample t test with one-sided p < 0.001 uncorrected and also at a more conservative p value to control the familywise error rate at 5%. This thresholded brain activation map (with p < 0.001 uncorrected) was used as inclusive binary mask that was combined with the parcellated regions that demonstrated significant drug effects on nodal topology. If there were >20 continuous task-activated voxels that anatomically overlapped with the volume of a node that also showed drug effects on resting-state topology and if these overlapping voxels covered >20% of the volume of a node, we identified this heuristically as a region of overlap between task-related activation and drug effects on resting-state network topology. As shown in Figure 3, there were several such regions identified in which nicotine-related effects on network topology occurred in regions that were also normally activated by task performance. The same approach was used to find regions of overlap between task-related activations and time-on-task effects on resting-state topology.
Figure 3.
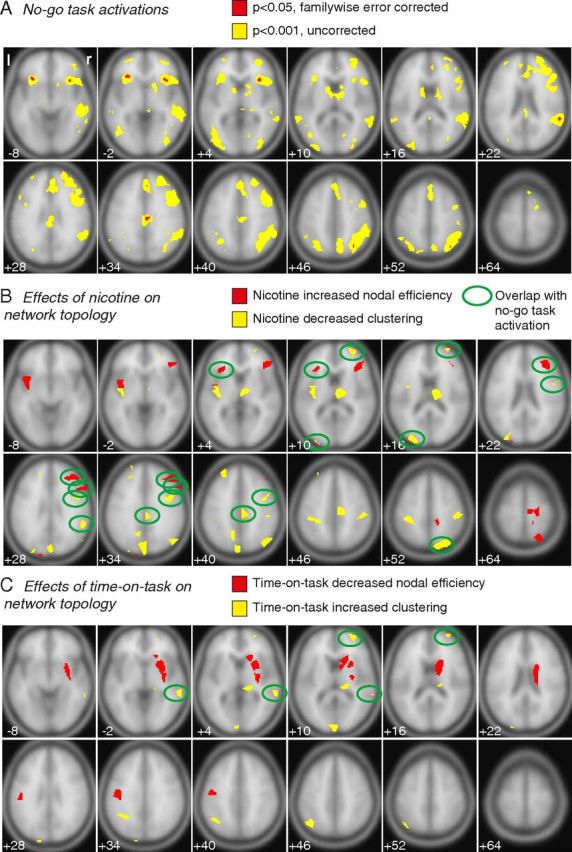
Nicotine and time-on-task effects changed nodal topology of brain regions. A, No-go task activations. Brain regions in which BOLD activation signal significantly increased during no-go trials compared with go trials within the placebo condition (averaged over both task periods). Significance threshold: red, familywise error corrected p < 0.05; yellow, uncorrected p < 0.001. B, C, For each brain node, we tested whether nicotine and time-on-task significantly increased or decreased nodal efficiency or clustering in resting-state networks. B, Nicotine increased nodal efficiency (red voxels) and decreased clustering (yellow voxels). C, Time-on-task decreased nodal efficiency (red voxels) and increased clustering (yellow voxels; significance threshold, p < 0.002, two-sided). Brain nodes in which changes in network topology overlap with significant changes in task activation (threshold, p < 0.001, uncorrected) are marked by ovals.
Results
Go/no-go task performance: behavioral data
Participants generally performed the task well (Table 1). Nicotine treatment significantly reduced latency of correct response to go trials [go reaction time (RT)], whereas greater duration of time-on-task tended to increase no-go errors (Fig. 1C; Table 4, Behavioral data). There was no significant correlation between no-go error rates and go RT (r(16) = −0.18, p = 0.46) nor between no-go error rates and RTs for incorrect no-go trials (r(16) = −0.32, p = 0.20).
Table 1.
Sample means ± SEMs for behavioral data
| Go trials |
No-go trials |
|||
|---|---|---|---|---|
| TP 1 | TP 2 | TP 1 | TP 2 | |
| Behavioral data | ||||
| RT (ms) | ||||
| Placebo | 410 ± 9 | 407 ± 7 | 395 ± 36 | 397 ± 33 |
| Nicotine | 395 ± 9 | 393 ± 10 | 359 ± 14 | 362 ± 13 |
| Error (%) | ||||
| Placebo | 1.14 ± 0.58 | 1.20 ± 0.78 | 12 ± 2.05 | 15 ± 1.95 |
| Nicotine | 0.46 ± 0.15 | 0.44 ± 0.14 | 11 ± 2.23 | 13 ± 2.28 |
TP, Task period.
Table 4.
ANOVA results for the effects of drug, time-on-task, and drug × time on behavioral data, questionnaires, functional connectivity data, and functional network topology and distance metrics
| Drug |
Time-on-task |
Drug × time |
|||||||
|---|---|---|---|---|---|---|---|---|---|
| F | dfs | Pr(>F) | F | dfs | Pr(>F) | F | dfs | Pr(>F) | |
| Behavioral data | |||||||||
| RTs of go trials | 7.08 | 1,17 | 0.02** | 0.58 | 1,17 | 0.46 | 0.05 | 1,17 | 0.82 |
| Errors of no-go trials | 0.44 | 1,17 | 0.52 | 3.42 | 1,17 | 0.08* | 0.11 | 1,17 | 0.75 |
| Questionnaire data | |||||||||
| SSS | 3.15 | 1,17 | 0.09* | 67.62 | 1,17 | <0.0001** | 0.14 | 1,17 | 0.72 |
| Awake–tired scale (MDBF) | 2.59 | 1,17 | 0.13 | 36.45 | 1,17 | <0.0001** | 0.08 | 1,17 | 0.78 |
| Functional connectivitya | |||||||||
| Global correlations | 7.34 | 1,17 | 0.01** | 1.04 | 3,51 | 0.38 | 1.20 | 3,51 | 0.32 |
| Functional network topology and distance | |||||||||
| Global efficiency | 3.94 | 1,17 | 0.06* | 5.17 | 3,51 | 0.003** | 0.85 | 3,51 | 0.47 |
| Clustering | 8.85 | 1,17 | 0.009** | 3.62 | 3,51 | 0.02** | 0.80 | 3,51 | 0.50 |
| Distance | 1.41 | 1,17 | 0.25 | 5.65 | 3,51 | 0.002** | 0.18 | 3,51 | 0.91 |
MDBF, German Multidimensional Mood State Questionnaire; SSS, Stanford Sleepiness Scale; Pr(>F), p values associated with the reported F-statistics.
*p < 0.10;
**p < 0.05 (two-sided).
a Wavelet scale 2; 0.08–0.17 Hz.
Self-reported sleepiness: questionnaire data
Participants maintained wakefulness throughout testing procedures. Time-on-task significantly increased subjective sleepiness measured by both questionnaires; nicotine tended to reduce sleepiness measured by the Stanford Sleepiness Scale (Tables 2, 4, Questionnaire data).
Table 2.
Sample means ± SEMs for questionnaires before and after each scanning session
| SSSa |
Awake–tired scale (MDBF)b |
|||
|---|---|---|---|---|
| Before | After | Before | After | |
| Placebo | 2.11 ± 0.20 | 3.94 ± 0.26 | 15.50 ± 0.76 | 11.06 ± 0.65 |
| Nicotine | 1.72 ± 0.18 | 3.72 ± 0.30 | 16.00 ± 0.55 | 11.94 ± 0.96 |
MDBF, German Multidimensional Mood State Questionnaire; SSS, Stanford Sleepiness Scale.
a Higher values: higher sleepiness.
b Higher values: higher awakeness.
Functional connectivity: resting-state fMRI data
In the resting-state data, an overall ANOVA testing for effects on functional connectivity of drug, frequency bands, and time-on-task revealed a significant drug effect (F(1,17) = 7.86, p = 0.01), a significant frequency band effect (F(4,68) = 55.51, p < 0.001), and a significant drug × frequency bank interaction (F(4,68) = 2.72, p = 0.04). Post hoc analyses showed that connectivity was reduced by nicotine compared with placebo in each of the five wavelet scales or frequency intervals covering the range from 0.0208 to 0.3333 Hz. Drug effects were most significant and showed the highest t value at wavelet scale 2 (0.08–0.17 Hz); therefore, we focused additional analysis on networks representing correlated oscillations in this frequency range. Within this frequency range, there was no main effect of time-on-task or drug × time interaction on strength of connectivity (Table 4, Functional connectivity).
Drug effects at all wavelet scales are summarized for completeness here: scale 1, t(17) = 2.210, p = 0.041; scale 2, t(17) = 2.709, p = 0.015; scale 3, t(17) = 2.213, p = 0.041; scale 4, t(17) = 2.116, p = 0.049; and scale 5, t(17) = 2.630, p = 0.018.
Functional networks: topological metrics of brain graphs
Nicotine tended to increase global efficiency and significantly decreased mean clustering (Fig. 2A–C; Tables 3, 4); whereas the effect of time-on-task was to significantly decrease global efficiency and to increase clustering (Fig. 2D,E). Clustering monotonically increased [t(68) = 2.46, p = 0.02, Markov chain Monte Carlo (MCMC) estimated level of significance, p = 0.04; Baayen et al., 2008] and global efficiency monotonically decreased as a function of increasing time-on-task (t(68) = −3.26, p = 0.002, MCMC, p = 0.008; Fig. 2F).
Table 3.
Sample means ± SEMs for functional connectivity, network topology, and distance metrics
| RS 1 | RS 2 | RS 3 | RS 4 | |
|---|---|---|---|---|
| Functional connectivitya | ||||
| Placebo | 0.1257 ± 0.0141 | 0.1262 ± 0.0151 | 0.1365 ± 0.0163 | 0.1566 ± 0.0202 |
| Nicotine | 0.1128 ± 0.0121 | 0.1155 ± 0.0213 | 0.1203 ± 0.0172 | 0.1153 ± 0.0159 |
| Functional network topology and distance | ||||
| Global efficiency | ||||
| Placebo | 0.5512 ± 0.0006 | 0.5495 ± 0.0009 | 0.5487 ± 0.0010 | 0.5482 ± 0.0012 |
| Nicotine | 0.5515 ± 0.0007 | 0.5504 ± 0.0012 | 0.5507 ± 0.0007 | 0.5500 ± 0.0009 |
| Clustering | ||||
| Placebo | 0.5636 ± 0.0078 | 0.5724 ± 0.0087 | 0.5799 ± 0.0089 | 0.5875 ± 0.0117 |
| Nicotine | 0.5554 ± 0.0080 | 0.5583 ± 0.0124 | 0.5634 ± 0.0091 | 0.5646 ± 0.0102 |
| Distance | ||||
| Placebo | 68.07 ± 0.51 | 67.30 ± 0.74 | 66.47 ± 0.78 | 66.29 ± 0.6 |
| Nicotine | 68.72 ± 0.42 | 67.66 ± 0.99 | 67.49 ± 0.56 | 67.12 ± 0.86 |
RS, Resting-state period.
a Wavelet scale 2; 0.08–0.17 Hz.
We further investigated the effects of nicotine on topological metrics at the regional nodes (Fig. 3B,C). In all nodes in which nicotine or time-on-task significantly affected network topology, both factors showed consistent effects: nicotine reduced clustering and increased nodal efficiency, whereas time-on-task increased clustering and decreased nodal efficiency. In most of the nodes, only one metric was significantly influenced (clustering or nodal efficiency). Thus, drug-related changes in nodal efficiency were located in different anatomical regions compared with drug-related changes in nodal clustering. However, as shown in Figure 2, drug effects on efficiency and clustering were correlated at a global level. This suggests that the effect of nicotine to shift the network globally to a more integrative configuration was mediated by complementary increases in nodal efficiency in some regions and by decreases in nodal clustering in other regions.
Only in the right caudate nucleus did time-on-task both increase clustering and decrease nodal efficiency (see slice Z = 16; Fig. 3C). Furthermore, there was only one node in which both experimental factors, nicotine and time-on-task, had a significant influence on network topology. Within the right middle frontal gyrus, nicotine decreased and time-on-task increased clustering (see slice Z = 10; Fig. 3B,C).
In a second analysis, we further investigated whether the effects nicotine and time-on-task at the level of regional nodes overlapped with brain regions that were also activated in no-go trials (compared with go trials). Nicotine reduced clustering at a number of mainly posterior cortical nodes that overlapped with task activations during no-go trials within the right middle frontal gyrus, left middle occipital gyrus, right precentral sulcus, right superior temporal gyrus, right posterior cingulate gyrus, and right angular gyrus (Fig. 3B). In contrast, nicotine increased nodal efficiency in anterior nodes, including the right and left inferior frontal gyrus and the right middle frontal gyrus (Fig. 3B). Time-on-task increased clustering within the middle temporal gyrus and middle frontal gyrus (Fig. 3C).
Nicotine and time-related changes in network topology correlate with their behavioral effects
Participants who had most improved task performance (or reduced frequency of no-go errors) after nicotine also tended to show greater nicotine-related increases in network global efficiency (r(16) = −0.61, p = 0.007) and greater nicotine-related decreases in network clustering (r(16) = 0.66, p = 0.003) (Fig. 4A,B). Effects of nicotine on nodal efficiency and clustering were also correlated with its effects on no-go errors: for example, clustering of connections to right posterior cingulate cortex was most decreased in subjects who had greatest behavioral benefit from nicotine (r(16) = 0.63, p = 0.005), and efficiency of connections to right motor cortex was most increased in subjects for whom nicotine had most performance-enhancing effects (r(16) = −0.58, p = 0.01). Additional significant correlations between the effects of nicotine on nodal clustering and its effects on no-go errors were found in the right middle frontal gyrus (r(16) = 0.51, p = 0.03), right superior temporal gyrus (r(16) = 0.50, p = 0.03), right precentral sulcus (r(16) = 0.48, p = 0.05), and left long insular gyri (r(16) = 0.58, p = 0.01). The effects of nicotine on efficiency also correlated significantly with effects on no-go errors within the right paracentral lobule (r(16) = −0.51, p = 0.03).
Figure 4.

Global changes in network topology were correlated with behavioral effects. A–C, Effects on network topology were correlated with effects on behavior. A, The effect of nicotine on global efficiency correlated with the effects of nicotine on no-go errors: subjects with larger increases of global efficiency after nicotine showed greater nicotine-induced decrease of no-go errors. B, The effect of nicotine on clustering. Subjects with larger decreases of mean clustering after nicotine showed greater nicotine-induced decreases of no-go errors. C, The linear increase in mean clustering over resting-state periods correlated with an increase in no-go errors in both task blocks. To estimate time-related changes, we regressed clustering for each subject on time-on-task; gray areas within the regression plots represent the 95% confidence intervals for the fitted regression lines.
Nicotine-related changes in task performance were also correlated with baseline (pre-dose) performance levels (r(16) = −0.59, p = 0.009; Fig. 1C) and network efficiency (r(16) = 0.52, p = 0.03). In other words, participants who had poorest performance on the task and least efficient brain networks in the baseline condition tended to demonstrate greatest improvements in performance after nicotine replacement.
Network topological changes were less consistently correlated with the behavioral effects of time-on-task. There was no significant correlation with global efficiency (r(16) = −0.29, p = 0.25). However, subjects who performed more poorly as a function of increasing time-on-task also showed greater increases of network clustering (r(16) = 0.56, p = 0.02; Fig. 4C).
Functional networks: physical distance of functional connections
We estimated the physical distance between functionally connected nodes as the Euclidean distance between the centroids of each regional node in a standard stereotactic space. Considering first these connection distances averaged over all edges and all connection densities in the range of 1.7–50% (Fig. 5A), we found no significant effect of drug or drug × time interaction but a significant main effect of time (Tables 3, 4, Functional network topology and distance). Then focusing on the histogram of connection distances for the networks at 50% connection density (networks with only 50% of all possible connections), we found that greater time-on-task significantly decreased the number of long-distance connections and increased the number of short-distance connections. In contrast, nicotine significantly increased the number of long-distance connections and decreased the number of short-distance connections (Fig. 5B,C).
Figure 5.

Effects of nicotine and time-on-task on connection distance. A, Mean connection distance (in millimeters) for each resting-state network averaged over the range of connection densities (1.7–50%) in placebo and nicotine treatment groups. B, Effects of time on the histogram of connection distances; gray bars show distances with a significant decrease or increase in number of connected edges (permutation test, p < 0.05). C, Effects of nicotine on the histogram of network connection distances. D, E, Nicotine-induced changes in connection distance correlated significantly with its effects on global efficiency (r(16) = 0.77, p = 0.0002) and clustering (r(16) = −0.65, p = 0.004). F, Nicotine-induced changes in connection distance correlated significantly with its effects on behavioral errors (r(16) = −0.70, p = 0.001).
Furthermore, we found that nicotine-induced changes in the average connection distance were correlated with the effects of the drug on network topology and behavioral performance (Fig. 5D–F). Participants who demonstrated increased distance of functional connections after nicotine replacement also tended to have increased global efficiency (r(16) = 0.77, p = 0.0002), reduced clustering (r(16) = −0.65, p = 0.004), and reduced no-go error rate (improved performance, r(16) = −0.70, p = 0.001).
Effects of nicotine consumption on behavior and brain function
There were individual differences in cigarette smoking that were associated with variability in behavioral and brain functional response to nicotine replacement. There was a significant correlation between the effects of nicotine on no-go errors and the number of cigarettes smoked per day (r(16) = −0.55, p = 0.02; Fig. 6A). Thus, subjects who smoked more cigarettes showed greater performance-enhancing effects of nicotine in reducing the number of errors commissioned during the sustained attention task. More frequent smokers also demonstrated greater effects of nicotine replacement on (decreased) network clustering (r(16) = −0.57, p = 0.01; Fig. 6B).
Figure 6.

Frequency of cigarette smoking was correlated with effects of nicotine replacement on behavioral performance and network topology. A, Effects of nicotine on no-go errors (no-go errors nicotine − no-go errors placebo) were significantly correlated with the number of cigarettes smoked per day. Higher-frequency smokers had greater reductions of no-go errors after nicotine replacement. B, Effects of nicotine on clustering (clustering nicotine − clustering placebo): higher-frequency smokers had greater nicotine-related reductions of network clustering.
Possible impact of head movements on estimates of functional connectivity
To check for possible effects of head movements, we calculated the number of frames that would need to be removed from each dataset by scrubbing according to the criteria of Power et al. (2012). We found that only 74 of 144 (51%) datasets would need more than one frame scrubbed, with 39 of 72 in the nicotine condition and 35 of 72 in the placebo condition. We used the percentage of frames that would need to be scrubbed as a metric to compare the motion in our datasets between conditions and between resting-state scans. We note that there is no significant difference in head movement between drug conditions or between resting-state scans. Next, we assessed whether scrubbing changed the relationship between the functional connectivity and the physical distances of pairwise nodes. In this analysis, we only used datasets with the most head motion (i.e., we excluded all datasets in which no frames had been scrubbed to avoid bias). We observe that scrubbing did not change the relationship between functional connectivity and physical distances when the unscrubbed correlation matrix is subtracted from the scrubbed correlation matrix (ΔR). Thus, scrubbing time points (using the thresholds described by Power et al., 2012) provide no additional benefit to our data.
Discussion
The principal objective of this study was to investigate how changes in the complex network organization of the human brain could be related to changes in cognitive function. To interrogate this question experimentally, we measured attentional task performance and fMRI network properties under controlled conditions (nicotine replacement and time-on-task) known to have opposing effects on cognitive proficiency. We found empirically opposite but theoretically convergent effects on network organization of these two experimental factors. Nicotine, which enhanced cognitive performance, was associated with greater topological efficiency and longer connection distance of brain networks, whereas time-on-task, which caused fatigue and impaired task performance, was associated with less efficient, more clustered network topology and shorter connection distance.
Workspace theory and economical configuration of brain networks
These results are compatible with theoretical predictions that conscious perception or cognition will emerge from more integrated brain networks. For example, the workspace theory that was first formulated by Baars in the late 1980s (Baars, 1988; Baars, 2005; Shanahan and Baars, 2005), and has since been developed as global neuronal workspace theory by Dehaene and others (Dehaene and Naccache, 2001; Bartolomei and Naccache, 2011; Dehaene and Changeux, 2011), predicts that attentionally demanding or effortful cognitive processes will be represented physiologically by the integrated activity of a large ensemble of workspace neurons, anatomically distributed throughout the brain (Dehaene and Naccache, 2001; Baars, 2005). The transient emergence of a global workspace is expected to “break” the more modular or locally clustered network architecture prevailing under relatively undemanding cognitive conditions (Varela et al., 2001; Valencia et al., 2009).
These theoretical predictions have been supported previously by various results. In a magnetoencephalography (MEG) study investigating the effects of a working memory task at various levels of difficulty (Kitzbichler et al., 2011), the more difficult versions of the task were associated with increased global efficiency and increased connection distance, as well as reduced clustering and reduced modularity, of MEG networks. There have been previous reports of greater network efficiency related to superior IQ and working memory task performance in young adults (Bassett et al., 2009; Li et al., 2009; van den Heuvel et al., 2009). There is also evidence for age-related decreases of network efficiency, with reduced connection distance, in healthy elderly volunteers, which might be related to age-related decline in executive functions (Achard and Bullmore, 2007; Meunier et al., 2009; Wang et al., 2010).
Moreover, it is notable that both the experimental factors in this study had correlated effects on both network topology (e.g., efficiency) and network anatomy or geometry (e.g., connection distance). The coordinated effects of time-on-task on clustering and connection distance reflect the fact that brain regions more closely located in anatomical space, with shorter connection distance between them, tend to be topologically clustered in the same module (Laughlin and Sejnowski, 2003; Kaiser et al., 2010; Meunier et al., 2010). The coordinated changes in efficiency and connection distance attributable to nicotine reflect the fact that topological shortcuts that will increase global and nodal efficiency tend to be mediated by long-distance connections between connector hubs in different modules (Alexander-Bloch et al., 2013). In general, these performance-related changes in network topology and geometry are consistent with the idea that brain networks negotiate an economical tradeoff between cost and value: longer-distance connections entail greater network cost but enable a topologically efficient workspace that adds value in terms of superior cognitive task performance (Bullmore and Sporns, 2012; van den Heuvel et al., 2012).
Effects of nicotine and frequency of cigarette smoking on network organization
In addition to these theoretically predicted effects of nicotine on task performance and global network topology, we also found effects of nicotine at a more localized nodal level of network analysis, often in brain nodes that overlapped with BOLD activations during inhibitory control. For example, nicotine reduced clustering within the left middle occipital gyrus, right precentral sulcus, and right posterior cingulate gyrus, brain regions that have been consistently downregulated by nicotine across different task conditions (Hahn et al., 2007, 2009). In contrast, nicotine enhanced efficiency of information transfer in the right middle frontal gyrus, a region that has been related previously to sustained attention (Kim et al., 2006; Lim et al., 2010) and nicotinic stimulation (Thiel et al., 2005; Hahn et al., 2009). These results are consistent with the assumption that nicotine drives global workspace configuration by increasing the efficiency of long-range information transfer to and from frontal cortex and decreasing (or breaking) locally clustered, short-range connections between more posterior regions of the whole-brain network (Raffone and Srinivasan, 2009).
It was notable that the participants who demonstrated the most marked pro-cognitive and network integrative effects of nicotine tended to be the more frequent cigarette smokers. This association suggests that high-frequency cigarette smokers are particularly likely to derive neurocognitive benefits from nicotine (Newhouse et al., 2004), which could be behaviorally rewarding and therefore help to explain the highly reinforced value of cigarette smoking for some individuals (Dinn et al., 2004; Yakir et al., 2007). Because these data are correlational, it is not possible to assert whether the greater effects of nicotine on behavior and brain networks observed in the high-frequency cigarette smokers are a predisposing risk for greater dependence or an effect of repeated previous nicotine exposure.
Network metrics as pharmacodynamic biomarkers
Many drugs are known to have cognitive effects by modulating synaptic connections between neurons. It seems intuitive that measures of functional connectivity and functional brain networks, estimated at the macro-scale of human neuroimaging, might be useful systems-level biomarkers of pharmacodynamic effects in the translational and early clinical development of new drugs intended to enhance or maintain cognitive function in disorders such as schizophrenia (Jacobsen et al., 2004; D'Souza and Markou, 2012) or Alzheimer's disease (Engeland et al., 2002). However, it is perhaps surprising how few studies have previously measured effects of centrally active drugs on network organization in neuroimaging data (Millan et al., 2012). Schwarz et al. (2009) measured effects of nicotine on fMRI network topology in rats, demonstrating the potential utility of the approach for preclinical studies. Achard and Bullmore (2007) demonstrated effects of sulpiride (a dopamine D2 receptor antagonist) on efficiency of human fMRI networks (Srinivas et al., 2007; Lee et al., 2011).
Effects of nicotine in human subjects have been quite extensively studied in terms of task-related activation (Thiel et al., 2005; Giessing et al., 2006, 2007; Hahn et al., 2007; Sutherland et al., 2011; Warbrick et al., 2011) and less frequently in terms of functional connectivity (Hong et al., 2009; Cole et al., 2010; Kobiella et al., 2011). In a recent study investigating effects of nicotine on resting-state topology (Wylie et al., 2012), there was a trend for nicotine to increase global efficiency (as shown also in our data) and to increase clustering (whereas we found that nicotine decreased clustering). However, Wylie et al. (2012) did not simultaneously measure behavioral effects of nicotine in their sample of nonsmokers, so it remains unclear how these network changes are related to cognitive effects of the drug.
We propose that our demonstration of correlated effects of nicotine on both attentional performance and integrative network topology is proof-of-principle that fMRI network metrics can provide theoretically principled markers of pro-cognitive drug effects on human brain function, which could be useful for future development of drugs intended to treat cognitive impairment.
Methodological issues
We used an innovative rest–task–rest design that enabled us to relate experimentally controlled effects on resting-state networks directly to effects of the same factors on performance of an attentionally demanding task. Previous studies using similar rest–task–rest paradigms have shown that performance of cognitive tasks can have prolonged effects (lasting several minutes) on the endogenous oscillations of subsequently recorded resting-state fMRI data (Barnes et al., 2009; Lim et al., 2010).
There is evidence that minor (<0.1 mm) and transient head movements during scanning can influence measures of network topology and connection distance (Power et al., 2012; Van Dijk et al., 2012). To address this potential confound, we used previously published methods (Power et al., 2012) to evaluate the potential impact of movement on functional connectivity between time series. We found that there were only a few transient framewise displacements after standard realignment and regression procedures for movement correction, and scrubbing the time series to eliminate potentially movement-biased images showed that our results were not unduly influenced by head movement.
One important issue in psychopharmacological fMRI is whether drug effects on BOLD signal reflect changes in neuronal activity mediated by drug receptors on neurons or changes in blood flow or neurovascular coupling mediated by drug receptors on blood vessels. There are several previous results arguing against a global change in neurovascular coupling in response to nicotine (Ghatan et al., 1998; Jacobsen et al., 2002). Furthermore, the correlations reported here between the effect of nicotine on behavior and its effects on network metrics provide strong evidence that the pharmacological fMRI signals were mediated by the effects of the drug on neuronal activity rather hemodynamics.
Footnotes
This study was supported by Deutsche Forschungsgemeinschaft Grant GI 682/2-1 (C.G.). The Behavioural and Clinical Neuroscience Institute is supported by the Medical Research Council and the Wellcome Trust. A.F.A.-B. was supported by the National Institutes of Health Cambridge Graduate Partnership Program. A.X.P. was supported by the Wellcome Trust/GlaxoSmithKline Translational Medicine and Therapeutics program and the MB/PhD program in the School of Clinical Medicine, University of Cambridge. We thank Drs. Andrew Zalesky, Alex Fornito, and David Meunier for their helpful advice and McNeil (Helsingborg, Sweden) for providing the placebo.
E.T.B. is employed 50% by GlaxoSmithKline and 50% by the University of Cambridge, and is a stockholder of GlaxoSmithKline.
References
- Achard S, Bullmore E. Efficiency and cost of economical brain functional networks. PLoS Comput Biol. 2007;3:e17. doi: 10.1371/journal.pcbi.0030017. [DOI] [PMC free article] [PubMed] [Google Scholar]
- Alexander-Bloch AF, Gogtay N, Meunier D, Birn R, Clasen L, Lalonde F, Lenroot R, Giedd J, Bullmore ET. Disrupted modularity and local connectivity of brain functional networks in childhood-onset schizophrenia. Front Syst Neurosci. 2010;4:147. doi: 10.3389/fnsys.2010.00147. [DOI] [PMC free article] [PubMed] [Google Scholar]
- Alexander-Bloch AF, Vértes PE, Stidd R, Lalonde F, Clasen L, Rapoport J, Giedd J, Bullmore ET, Gogtay N. The anatomical distance of functional connections predicts brain network topology in health and schizophrenia. Cereb Cortex. 2013;23:127–138. doi: 10.1093/cercor/bhr388. [DOI] [PMC free article] [PubMed] [Google Scholar]
- Baars BJ. A cognitive theory of consciousness. New York: Cambridge UP; 1988. [Google Scholar]
- Baars BJ. The conscious access hypothesis: origins and recent evidence. Trends Cogn Sci. 2002;6:47–52. doi: 10.1016/s1364-6613(00)01819-2. [DOI] [PubMed] [Google Scholar]
- Baars BJ. Global workspace theory of consciousness: toward a cognitive neuroscience of human experience. Prog Brain Res. 2005;150:45–53. doi: 10.1016/S0079-6123(05)50004-9. [DOI] [PubMed] [Google Scholar]
- Baayen RH, Davidson DJ, Bates DM. Mixed-effects modeling with crossed random effects for subjects and items. J Mem Lang. 2008;59:390–412. [Google Scholar]
- Barnes A, Bullmore ET, Suckling J. Endogenous human brain dynamics recover slowly following cognitive effort. PLoS One. 2009;4:e6626. doi: 10.1371/journal.pone.0006626. [DOI] [PMC free article] [PubMed] [Google Scholar]
- Bartolomei F, Naccache L. The global workspace (GW) theory of consciousness and epilepsy. Behav Neurol. 2011;24:67–74. doi: 10.3233/BEN-2011-0313. [DOI] [PMC free article] [PubMed] [Google Scholar]
- Bassett DS, Bullmore E, Verchinski BA, Mattay VS, Weinberger DR, Meyer-Lindenberg A. Hierarchical organization of human cortical networks in health and schizophrenia. J Neurosci. 2008;28:9239–9248. doi: 10.1523/JNEUROSCI.1929-08.2008. [DOI] [PMC free article] [PubMed] [Google Scholar]
- Bassett DS, Bullmore ET, Meyer-Lindenberg A, Apud JA, Weinberger DR, Coppola R. Cognitive fitness of cost-efficient brain functional networks. Proc Natl Acad Sci U S A. 2009;106:11747–11752. doi: 10.1073/pnas.0903641106. [DOI] [PMC free article] [PubMed] [Google Scholar]
- Bassett DS, Greenfield DL, Meyer-Lindenberg A, Weinberger DR, Moore SW, Bullmore ET. Efficient physical embedding of topologically complex information processing networks in brains and computer circuits. PLoS Comput Biol. 2010;6:e1000748. doi: 10.1371/journal.pcbi.1000748. [DOI] [PMC free article] [PubMed] [Google Scholar]
- Benowitz NL, Porchet H, Sheiner L, Jacob P., 3rd Nicotine absorption and cardiovascular effects with smokeless tobacco use: comparison with cigarettes and nicotine gum. Clin Pharmacol Ther. 1988;44:23–28. doi: 10.1038/clpt.1988.107. [DOI] [PubMed] [Google Scholar]
- Bullmore E, Sporns O. The economy of brain network organization. Nat Rev Neurosci. 2012;13:336–349. doi: 10.1038/nrn3214. [DOI] [PubMed] [Google Scholar]
- Bullmore ET, Bassett DS. Brain graphs: graphical models of the human brain connectome. Annu Rev Clin Psychol. 2011;7:113–140. doi: 10.1146/annurev-clinpsy-040510-143934. [DOI] [PubMed] [Google Scholar]
- Cole DM, Beckmann CF, Long CJ, Matthews PM, Durcan MJ, Beaver JD. Nicotine replacement in abstinent smokers improves cognitive withdrawal symptoms with modulation of resting brain network dynamics. Neuroimage. 2010;52:590–599. doi: 10.1016/j.neuroimage.2010.04.251. [DOI] [PubMed] [Google Scholar]
- Conners CK. The continuous performance test. Toronto: Multi-Health Systems; 1995. [Google Scholar]
- Cunnington AJ, Hormbrey P. Breath analysis to detect recent exposure to carbon monoxide. Postgrad Med J. 2002;78:233–237. doi: 10.1136/pmj.78.918.233. [DOI] [PMC free article] [PubMed] [Google Scholar]
- Dehaene S, Changeux JP. Experimental and theoretical approaches to conscious processing. Neuron. 2011;70:200–227. doi: 10.1016/j.neuron.2011.03.018. [DOI] [PubMed] [Google Scholar]
- Dehaene S, Naccache L. Towards a cognitive neuroscience of consciousness: basic evidence and a workspace framework. Cognition. 2001;79:1–37. doi: 10.1016/s0010-0277(00)00123-2. [DOI] [PubMed] [Google Scholar]
- Dehaene S, Kerszberg M, Changeux JP. A neuronal model of a global workspace in effortful cognitive tasks. Proc Natl Acad Sci U S A. 1998;95:14529–14534. doi: 10.1073/pnas.95.24.14529. [DOI] [PMC free article] [PubMed] [Google Scholar]
- Deuker L, Bullmore ET, Smith M, Christensen S, Nathan PJ, Rockstroh B, Bassett DS. Reproducibility of graph metrics of human brain functional networks. Neuroimage. 2009;47:1460–1468. doi: 10.1016/j.neuroimage.2009.05.035. [DOI] [PubMed] [Google Scholar]
- Dinn WM, Aycicegi A, Harris CL. Cigarette smoking in a student sample: neurocognitive and clinical correlates. Addict Behav. 2004;29:107–126. doi: 10.1016/j.addbeh.2003.07.001. [DOI] [PubMed] [Google Scholar]
- D'Souza MS, Markou A. Schizophrenia and tobacco smoking comorbidity: nAChR agonists in the treatment of schizophrenia-associated cognitive deficits. Neuropharmacology. 2012;62:1564–1573. doi: 10.1016/j.neuropharm.2011.01.044. [DOI] [PMC free article] [PubMed] [Google Scholar]
- Engeland C, Mahoney C, Mohr E, Ilivitsky V, Knott V. Nicotine and sensory memory in Alzheimer's disease: an event-related potential study. Brain Cogn. 2002;49:232–234. [PubMed] [Google Scholar]
- Fagerström KO. Measuring degree of physical dependence to tobacco smoking with reference to individualization of treatment. Addict Behav. 1978;3:235–241. doi: 10.1016/0306-4603(78)90024-2. [DOI] [PubMed] [Google Scholar]
- Fornito A, Zalesky A, Bullmore ET. Network scaling effects in graph analytic studies of human resting-state FMRI data. Front Syst Neurosci. 2010;4:22. doi: 10.3389/fnsys.2010.00022. [DOI] [PMC free article] [PubMed] [Google Scholar]
- Fornito A, Zalesky A, Bassett DS, Meunier D, Ellison-Wright I, Yücel M, Wood SJ, Shaw K, O'Connor J, Nertney D, Mowry BJ, Pantelis C, Bullmore ET. Genetic influences on cost-efficient organization of human cortical functional networks. J Neurosci. 2011;31:3261–3270. doi: 10.1523/JNEUROSCI.4858-10.2011. [DOI] [PMC free article] [PubMed] [Google Scholar]
- Gallos LK, Makse HA, Sigman M. A small world of weak ties provides optimal global integration of self-similar modules in functional brain networks. Proc Natl Acad Sci U S A. 2012;109:2825–2830. doi: 10.1073/pnas.1106612109. [DOI] [PMC free article] [PubMed] [Google Scholar]
- Ghatan PH, Ingvar M, Eriksson L, Stone-Elander S, Serrander M, Ekberg K, Wahren J. Cerebral effects of nicotine during cognition in smokers and non-smokers. Psychopharmacology (Berl) 1998;136:179–189. doi: 10.1007/s002130050554. [DOI] [PubMed] [Google Scholar]
- Giessing C, Thiel CM, Rösler F, Fink GR. The modulatory effects of nicotine on parietal cortex activity in a cued target detection task depend on cue reliability. Neuroscience. 2006;137:853–864. doi: 10.1016/j.neuroscience.2005.10.005. [DOI] [PubMed] [Google Scholar]
- Giessing C, Fink GR, Rösler F, Thiel CM. fMRI data predict individual differences of behavioral effects of nicotine: a partial least square analysis. J Cogn Neurosci. 2007;19:658–670. doi: 10.1162/jocn.2007.19.4.658. [DOI] [PubMed] [Google Scholar]
- Ginestet CE, Nichols TE, Bullmore ET, Simmons A. Brain network analysis: separating cost from topology using cost-integration. PLoS One. 2011;6:e21570. doi: 10.1371/journal.pone.0021570. [DOI] [PMC free article] [PubMed] [Google Scholar]
- Hahn B, Ross TJ, Yang Y, Kim I, Huestis MA, Stein EA. Nicotine enhances visuospatial attention by deactivating areas of the resting brain default network. J Neurosci. 2007;27:3477–3489. doi: 10.1523/JNEUROSCI.5129-06.2007. [DOI] [PMC free article] [PubMed] [Google Scholar]
- Hahn B, Ross TJ, Wolkenberg FA, Shakleya DM, Huestis MA, Stein EA. Performance effects of nicotine during selective attention, divided attention, and simple stimulus detection: an fMRI study. Cereb Cortex. 2009;19:1990–2000. doi: 10.1093/cercor/bhn226. [DOI] [PMC free article] [PubMed] [Google Scholar]
- Hampson M, Driesen NR, Skudlarski P, Gore JC, Constable RT. Brain connectivity related to working memory performance. J Neurosci. 2006;26:13338–13343. doi: 10.1523/JNEUROSCI.3408-06.2006. [DOI] [PMC free article] [PubMed] [Google Scholar]
- Heatherton TF, Kozlowski LT, Frecker RC, Fagerström KO. The Fagerström test for nicotine dependence: a revision of the Fagerström tolerance questionnaire. Br J Addict. 1991;86:1119–1127. doi: 10.1111/j.1360-0443.1991.tb01879.x. [DOI] [PubMed] [Google Scholar]
- Hoddes E, Zarcone V, Smythe H, Philipps R, Dement WC. Internationale Skalen für Psychiatrie. Ed 4. Weinheim: Beltz; 1996. SSS Stanford Schläfrigkeitsskala; pp. 137–139. [Google Scholar]
- Holtzer R, Shuman M, Mahoney JR, Lipton R, Verghese J. Cognitive fatigue defined in the context of attention networks. Neuropsychol Dev Cogn B Aging Neuropsychol Cogn. 2011;18:108–128. doi: 10.1080/13825585.2010.517826. [DOI] [PMC free article] [PubMed] [Google Scholar]
- Hong LE, Gu H, Yang Y, Ross TJ, Salmeron BJ, Buchholz B, Thaker GK, Stein EA. Association of nicotine addiction and nicotine's actions with separate cingulate cortex functional circuits. Arch Gen Psychiatry. 2009;66:431–441. doi: 10.1001/archgenpsychiatry.2009.2. [DOI] [PMC free article] [PubMed] [Google Scholar]
- Hukkanen J, Jacob P, 3rd, Benowitz NL. Metabolism and disposition kinetics of nicotine. Pharmacol Rev. 2005;57:79–115. doi: 10.1124/pr.57.1.3. [DOI] [PubMed] [Google Scholar]
- Jacobsen LK, Gore JC, Skudlarski P, Lacadie CM, Jatlow P, Krystal JH. Impact of intravenous nicotine on BOLD signal response to photic stimulation. Magn Reson Imaging. 2002;20:141–145. doi: 10.1016/s0730-725x(02)00494-0. [DOI] [PubMed] [Google Scholar]
- Jacobsen LK, D'Souza DC, Mencl WE, Pugh KR, Skudlarski P, Krystal JH. Nicotine effects on brain function and functional connectivity in schizophrenia. Biol Psychiatry. 2004;55:850–858. doi: 10.1016/j.biopsych.2003.12.023. [DOI] [PubMed] [Google Scholar]
- Kaiser M, Hilgetag CC, Kotter R. Hierarchy and dynamics of neural networks. Front Neuroinform. 2010;4.pii:112. doi: 10.3389/fninf.2010.00112. [DOI] [PMC free article] [PubMed] [Google Scholar]
- Kim J, Whyte J, Wang J, Rao H, Tang KZ, Detre JA. Continuous ASL perfusion fMRI investigation of higher cognition: quantification of tonic CBF changes during sustained attention and working memory tasks. Neuroimage. 2006;31:376–385. doi: 10.1016/j.neuroimage.2005.11.035. [DOI] [PMC free article] [PubMed] [Google Scholar]
- Kitzbichler MG, Henson RN, Smith ML, Nathan PJ, Bullmore ET. Cognitive effort drives workspace configuration of human brain functional networks. J Neurosci. 2011;31:8259–8270. doi: 10.1523/JNEUROSCI.0440-11.2011. [DOI] [PMC free article] [PubMed] [Google Scholar]
- Kobiella A, Ulshöfer DE, Vollmert C, Vollstädt-Klein S, Bühler M, Esslinger C, Smolka MN. Nicotine increases neural response to unpleasant stimuli and anxiety in non-smokers. Addict Biol. 2011;16:285–295. doi: 10.1111/j.1369-1600.2010.00237.x. [DOI] [PubMed] [Google Scholar]
- Latora V, Marchiori M. Efficient behavior of small-world networks. Phys Rev Lett. 2001;87:198701. doi: 10.1103/PhysRevLett.87.198701. [DOI] [PubMed] [Google Scholar]
- Laughlin SB, Sejnowski TJ. Communication in neuronal networks. Science. 2003;301:1870–1874. doi: 10.1126/science.1089662. [DOI] [PMC free article] [PubMed] [Google Scholar]
- Lee U, Müller M, Noh GJ, Choi B, Mashour GA. Dissociable network properties of anesthetic state transitions. Anesthesiology. 2011;114:872–881. doi: 10.1097/ALN.0b013e31821102c9. [DOI] [PubMed] [Google Scholar]
- Li Y, Liu Y, Li J, Qin W, Li K, Yu C, Jiang T. Brain anatomical network and intelligence. PLoS Comput Biol. 2009;5:e1000395. doi: 10.1371/journal.pcbi.1000395. [DOI] [PMC free article] [PubMed] [Google Scholar]
- Lim J, Wu WC, Wang J, Detre JA, Dinges DF, Rao H. Imaging brain fatigue from sustained mental workload: an ASL perfusion study of the time-on-task effect. Neuroimage. 2010;49:3426–3435. doi: 10.1016/j.neuroimage.2009.11.020. [DOI] [PMC free article] [PubMed] [Google Scholar]
- Lynall ME, Bassett DS, Kerwin R, McKenna PJ, Kitzbichler M, Muller U, Bullmore E. Functional connectivity and brain networks in schizophrenia. J Neurosci. 2010;30:9477–9487. doi: 10.1523/JNEUROSCI.0333-10.2010. [DOI] [PMC free article] [PubMed] [Google Scholar]
- Meunier D, Achard S, Morcom A, Bullmore E. Age-related changes in modular organization of human brain functional networks. Neuroimage. 2009;44:715–723. doi: 10.1016/j.neuroimage.2008.09.062. [DOI] [PubMed] [Google Scholar]
- Meunier D, Lambiotte R, Bullmore ET. Modular and hierarchically modular organization of brain networks. Front Neurosci. 2010;4:200. doi: 10.3389/fnins.2010.00200. [DOI] [PMC free article] [PubMed] [Google Scholar]
- Millan MJ, Agid Y, Brüne M, Bullmore ET, Carter CS, Clayton NS, Connor R, Davis S, Deakin B, DeRubeis RJ, Dubois B, Geyer MA, Goodwin GM, Gorwood P, Jay TM, Joëls M, Mansuy IM, Meyer-Lindenberg A, Murphy D, Rolls E, Saletu B, Spedding M, Sweeney J, Whittington M, Young LJ. Cognitive dysfunction in psychiatric disorders: characteristics, causes and the quest for improved therapy. Nat Rev Drug Discov. 2012;11:141–168. doi: 10.1038/nrd3628. [DOI] [PubMed] [Google Scholar]
- Nemeth-Coslett R, Benowitz NL, Robinson N, Henningfield JE. Nicotine gum: chew rate, subjective effects and plasma nicotine. Pharmacol Biochem Behav. 1988;29:747–751. doi: 10.1016/0091-3057(88)90197-9. [DOI] [PubMed] [Google Scholar]
- Newhouse PA, Potter A, Singh A. Effects of nicotinic stimulation on cognitive performance. Curr Opin Pharmacol. 2004;4:36–46. doi: 10.1016/j.coph.2003.11.001. [DOI] [PubMed] [Google Scholar]
- Onnela JP, Kaski K, Kertesz J. Clustering and information in correlation based financial networks. Eur Phys. 2004;38:353–362. [Google Scholar]
- Parrott AC, Craig D. Cigarette smoking and nicotine gum (0, 2 and 4 mg): effects upon four visual attention tasks. Neuropsychobiology. 1992;25:34–43. doi: 10.1159/000118807. [DOI] [PubMed] [Google Scholar]
- Percival DB, Walden AT. Wavelet methods for time series analysis. Cambridge, UK: Cambridge UP; 2006. [Google Scholar]
- Power JD, Barnes KA, Snyder AZ, Schlaggar BL, Petersen SE. Spurious but systematic correlations in functional connectivity MRI networks arise from subject motion. Neuroimage. 2012;59:2142–2154. doi: 10.1016/j.neuroimage.2011.10.018. [DOI] [PMC free article] [PubMed] [Google Scholar]
- Pritchard WS, Robinson JH, Guy TD. Enhancement of continuous performance task reaction time by smoking in non-deprived smokers. Psychopharmacology (Berl) 1992;108:437–442. doi: 10.1007/BF02247417. [DOI] [PubMed] [Google Scholar]
- Raffone A, Srinivasan N. An adaptive workspace hypothesis about the neural correlates of consciousness: insights from neuroscience and meditation studies. Prog Brain Res. 2009;176:161–180. doi: 10.1016/S0079-6123(09)17620-3. [DOI] [PubMed] [Google Scholar]
- Raichle ME, MacLeod AM, Snyder AZ, Powers WJ, Gusnard DA, Shulman GL. A default mode of brain function. Proc Natl Acad Sci U S A. 2001;98:676–682. doi: 10.1073/pnas.98.2.676. [DOI] [PMC free article] [PubMed] [Google Scholar]
- Salvador R, Martínez A, Pomarol-Clotet E, Gomar J, Vila F, Sarr ó S, Capdevila A, Bullmore E. A simple view of the brain through a frequency-specific functional connectivity measure. Neuroimage. 2008;39:279–289. doi: 10.1016/j.neuroimage.2007.08.018. [DOI] [PubMed] [Google Scholar]
- Schwarz AJ, Gozzi A, Bifone A. Community structure in networks of functional connectivity: resolving functional organization in the rat brain with pharmacological MRI. Neuroimage. 2009;47:302–311. doi: 10.1016/j.neuroimage.2009.03.064. [DOI] [PubMed] [Google Scholar]
- Shanahan M, Baars B. Applying global workspace theory to the frame problem. Cognition. 2005;98:157–176. doi: 10.1016/j.cognition.2004.11.007. [DOI] [PubMed] [Google Scholar]
- Skudlarski P, Jagannathan K, Calhoun VD, Hampson M, Skudlarska BA, Pearlson G. Measuring brain connectivity: diffusion tensor imaging validates resting state temporal correlations. Neuroimage. 2008;43:554–561. doi: 10.1016/j.neuroimage.2008.07.063. [DOI] [PMC free article] [PubMed] [Google Scholar]
- Smit AS, Eling PA, Coenen AM. Mental effort causes vigilance decrease due to resource depletion. Acta Psychol (Amst) 2004;115:35–42. doi: 10.1016/j.actpsy.2003.11.001. [DOI] [PubMed] [Google Scholar]
- Sporns O. Networks of the brain. Cambridge, MA: Massachusetts Institute of Technology; 2011. [Google Scholar]
- Srinivas KV, Jain R, Saurav S, Sikdar SK. Small-world network topology of hippocampal neuronal network is lost, in an in vitro glutamate injury model of epilepsy. Eur J Neurosci. 2007;25:3276–3286. doi: 10.1111/j.1460-9568.2007.05559.x. [DOI] [PubMed] [Google Scholar]
- Stam CJ. Functional connectivity patterns of human magnetoencephalographic recordings: a “small-world” network? Neurosci Lett. 2004;355:25–28. doi: 10.1016/j.neulet.2003.10.063. [DOI] [PubMed] [Google Scholar]
- Steyer R, Schwenkmezger P, Notz P, Eid M. Der Mehrdimensionale Befindlichkeitsfragebogen (MDBF) Göttingen, Germany: Hogrefe; 1997. [Google Scholar]
- Sutherland MT, Ross TJ, Shakleya DM, Huestis MA, Stein EA. Chronic smoking, but not acute nicotine administration, modulates neural correlates of working memory. Psychopharmacology (Berl) 2011;213:29–42. doi: 10.1007/s00213-010-2013-6. [DOI] [PMC free article] [PubMed] [Google Scholar]
- Thiel CM, Zilles K, Fink GR. Nicotine modulates reorienting of visuospatial attention and neural activity in human parietal cortex. Neuropsychopharmacology. 2005;30:810–820. doi: 10.1038/sj.npp.1300633. [DOI] [PubMed] [Google Scholar]
- Tzourio-Mazoyer N, Landeau B, Papathanassiou D, Crivello F, Etard O, Delcroix N, Mazoyer B, Joliot M. Automated anatomical labeling of activations in SPM using a macroscopic anatomical parcellation of the MNI MRI single-subject brain. Neuroimage. 2002;15:273–289. doi: 10.1006/nimg.2001.0978. [DOI] [PubMed] [Google Scholar]
- Valencia M, Pastor MA, Fernández-Seara MA, Artieda J, Martinerie J, Chavez M. Complex modular structure of large-scale brain networks. Chaos. 2009;19 doi: 10.1063/1.3129783. 023119. [DOI] [PubMed] [Google Scholar]
- van den Heuvel MP, Stam CJ, Kahn RS, Hulshoff Pol HE. Efficiency of functional brain networks and intellectual performance. J Neurosci. 2009;29:7619–7624. doi: 10.1523/JNEUROSCI.1443-09.2009. [DOI] [PMC free article] [PubMed] [Google Scholar]
- van den Heuvel MP, Kahn RS, Goñi J, Sporns O. High-cost, high-capacity backbone for global brain communication. Proc Natl Acad Sci U S A. 2012;109:11372–11377. doi: 10.1073/pnas.1203593109. [DOI] [PMC free article] [PubMed] [Google Scholar]
- Van Dijk KR, Sabuncu MR, Buckner RL. The influence of head motion on intrinsic functional connectivity MRI. Neuroimage. 2012;59:431–438. doi: 10.1016/j.neuroimage.2011.07.044. [DOI] [PMC free article] [PubMed] [Google Scholar]
- Varela F, Lachaux JP, Rodriguez E, Martinerie J. The brainweb: phase synchronization and large-scale integration. Nat Rev Neurosci. 2001;2:229–239. doi: 10.1038/35067550. [DOI] [PubMed] [Google Scholar]
- Wald NJ, Idle M, Boreham J, Bailey A. Carbon monoxide in breath in relation to smoking and carboxyhaemoglobin levels. Thorax. 1981;36:366–369. doi: 10.1136/thx.36.5.366. [DOI] [PMC free article] [PubMed] [Google Scholar]
- Wang L, Li Y, Metzak P, He Y, Woodward TS. Age-related changes in topological patterns of large-scale brain functional networks during memory encoding and recognition. Neuroimage. 2010;50:862–872. doi: 10.1016/j.neuroimage.2010.01.044. [DOI] [PubMed] [Google Scholar]
- Warbrick T, Mobascher A, Brinkmeyer J, Musso F, Stoecker T, Shah NJ, Vossel S, Winterer G. Direction and magnitude of nicotine effects on the fMRI BOLD response are related to nicotine effects on behavioral performance. Psychopharmacology (Berl) 2011;215:333–344. doi: 10.1007/s00213-010-2145-8. [DOI] [PMC free article] [PubMed] [Google Scholar]
- Warburton DM, Arnall C. Improvements in performance without nicotine withdrawal. Psychopharmacology (Berl) 1994;115:539–542. doi: 10.1007/BF02245578. [DOI] [PubMed] [Google Scholar]
- Watts DJ, Strogatz SH. Collective dynamics of ‘small-world’ networks. Nature. 1998;393:440–442. doi: 10.1038/30918. [DOI] [PubMed] [Google Scholar]
- Wylie KP, Rojas DC, Tanabe J, Martin LF, Tregellas JR. Nicotine increases brain functional network efficiency. Neuroimage. 2012;63:73–80. doi: 10.1016/j.neuroimage.2012.06.079. [DOI] [PMC free article] [PubMed] [Google Scholar]
- Yakir A, Rigbi A, Kanyas K, Pollak Y, Kahana G, Karni O, Eitan R, Kertzman S, Lerer B. Why do young women smoke? III. Attention and impulsivity as neurocognitive predisposing factors. Eur Neuropsychopharmacol. 2007;17:339–351. doi: 10.1016/j.euroneuro.2006.09.004. [DOI] [PubMed] [Google Scholar]
- Zalesky A, Fornito A, Harding IH, Cocchi L, Yücel M, Pantelis C, Bullmore ET. Whole-brain anatomical networks: does the choice of nodes matter? Neuroimage. 2010;50:970–983. doi: 10.1016/j.neuroimage.2009.12.027. [DOI] [PubMed] [Google Scholar]