

Abstract
The dorsal raphe nucleus (DRN) is implicated in mood regulation, control of impulsive behavior, and in processing aversive and reward-related signals. DRN neurons show phasic responses to sensory stimuli, but whether association with reward modulates these responses is unknown. We recorded DRN neurons from rats in a contextual conditioned approach paradigm in which an auditory cue was either followed or not followed by reward, depending on a global context signal. Conditioned approach (licking) occurred after cues in the reward context, but was suppressed in the no-reward context. Many DRN neurons showed short-latency phasic activations in response to the cues. There was striking contextual bias, with more and stronger excitations in the no-reward context than in the reward context. Therefore, DRN activity scaled inversely with cue salience and with the probability of subsequent conditioned approach. Tonic changes were similarly discriminatory, with increases being dominant after cues in the no-reward context, when licking was suppressed, and tonic decreases in rate dominant after reward-predictive cues during expression of conditioned licking. Phasic and tonic DRN responses thus provide signals of consistent valence but over different timescales. The tonic changes in activity are consistent with previous data and hypotheses relating DRN activity to response suppression and impulse control. Phasic responses could contribute to this via online modulation of attention allocation through projections to sensory-processing regions.
Introduction
The dorsal raphe nucleus (DRN) is a neurochemically diverse structure that is implicated in a wide range of functions. It is a major locus of serotonin (5-hydroxytryptamine [5-HT]) neurons, which project widely in the forebrain, exerting complex modulatory effects on target neurons through a large variety of receptors (Hensler, 2006; Alex and Pehek, 2007; Cools et al., 2008). There are also inhibitory GABA interneurons and small numbers of glutamatergic and dopaminergic neurons (Michelsen et al., 2007). The use of drugs acting at 5-HT transporters in the treatment of depression has focused attention on the possible role of DRN in the regulation of mood (Lowry et al., 2008). In addition, considerable data indicate an important involvement in stress, punishment, and aversion (Cools et al., 2008), and there is also a longstanding line of research and theory regarding DRN function in impulse control (Soubrie, 1986; Evenden, 1999; Cardinal, 2006). Recent research has also suggested involvement in reward-mediated behavior (Kranz et al., 2010).
A role related to signaling reward expectation is supported by several recent studies of the activity of single DRN neurons during behavior. These studies focused on sustained changes in the activity of these neurons in tasks with delayed rewards. Neurons in the lateral wings of the DRN were tonically modulated differentially while monkeys waited for outcomes in saccade tasks (Nakamura et al., 2008; Bromberg-Martin et al., 2010). Similarly, in rats, DRN neurons were found to fire tonically while animals waited for rewards or expected task-related cues, suggesting that the activity was involved in facilitating waiting when this was required by the task (Miyazaki et al., 2011a).
In addition to tonic modulations of firing rate, phasic responses to salient sensory cues are also of potential importance in understanding the contribution of DRN neurons to behavior control (Cools et al., 2008). Several theories of 5-HT action suggest a role for phasic signaling that may play an opposing, or at least contrasting, role in the phasic reward-related cue signaling of dopamine (DA) neurons in the ventral tegmental area (VTA) and substantia nigra pars compacta (SNc) (Daw et al., 2002; Dayan and Huys, 2009), which may be particularly prominent in situations involving direct Pavlovian association (Dayan and Huys, 2009). Early studies in free-moving cats noted nonhabituating responses to unconditioned auditory and visual stimuli (clicks and flashes) (Heym et al., 1982), mild somatosensory stimuli (Fornal et al., 1996), and seeing or smelling food (Jacobs and Fornal, 1991). More recent studies in rats and monkeys reported DRN neurons with time-locked responses to various task signals (Ranade and Mainen, 2009; Bromberg-Martin et al., 2010). However, data are lacking about whether association with reward modulates phasic responses of DRN neurons to sensory cues. In the present study, we investigated this using a contextual association task in which the same cue either predicted reward or was not associated with reward depending on the status of a global context signal.
Materials and Methods
Animals and tasks.
The University of Otago Animal Ethics Committee approved this study. Male Wistar rats weighing 300–500 g were housed in a temperature- and humidity-controlled room maintained on a 12 h light/dark cycle. After acclimation to handling, rats were placed on a fluid-restriction regimen by limiting access to water to that obtained during recording sessions plus 10 min per day ad libitum access, with 2 d free of restriction per week, and were monitored with weekly weighing. Thirsty rats were trained to obtain fluid from a recessed spout in the wall of the recording chamber. Small volumes (∼0.05 ml) of water sweetened with saccharin (0.005 m solution) were delivered to the spout by briefly releasing a solenoid valve (Med Associates). The moment of fluid delivery was indicated to the rat by a click generated by the solenoid. The tongue breaking an infrared beam that crossed the spout opening detected licking. Initially, the solenoid was manually activated whenever rats spontaneously explored the spout, which usually resulted in extended attention to the spout after only a few minutes in the first session.
Rats were then trained in the two different context conditions that were used when recording neuron activity (Fig. 1A). In both conditions, a 0.5 s duration, 4.5 kHz cue tone was delivered at pseudorandom intervals from a speaker (SonAlert; Med Associates) mounted above the fluid spout. Depending on the context, which was indicated to the animal by the state of the room light (on or off), the tone was either predictive or nonpredictive of subsequent solenoid activation (fluid reward) in a block design. In one group of rats, the room light on was on during no-reward (C→X) blocks and off during reward blocks (C→R); in the other group, the context-reward relationship was reversed. In C→X blocks, cue tones were delivered at pseudorandom intertrial intervals of 5–20 s. The solenoid was never activated in this context. In C→R blocks, cue tones were followed by solenoid activation 0.5 s after tone offset (trace conditioning). Each condition block lasted 30 min (∼80 trials). The room light status for each upcoming block was set for 5 min before beginning task trials to ensure that the context was established for the first trial. The order of the two conditions was alternated from day to day, so recorded cells that were not detected every day were effectively randomly allocated to one or other order. Animals were trained in the contextual conditions for 4 d before undergoing surgery for implantation of recording electrodes. Conditioning of the animals to the context-dependent meaning of the cue was evidenced by development of conditioned approach and anticipatory licking at the spout after onset of the cue in the C→R condition and failure to respond to the cues in the C→X condition (Fig. 1B).
Figure 1.

DRN recording methods. A, Schematic of conditioned approach task, in this case for a rat trained with C→X in house-light-on context (white ovals) and C→R in house light-off context (gray ovals). Vertical ticks represent trials within each context block, with one from each block expanded to show trial details. Black bar represents the cue, arrow marks solenoid activation on C→R trials, arrowheads symbolize licking. Broken timelines indicate random intervals (variable reaction time and/or randomized intertrial interval). B, PSTH and raster show mean and individual trial licking recorded during a C→R session. The cue period is indicated by gray shading, reward at 1 s. Raster lines ordered by time of first lick after fluid release. Data for the C→X block are not shown because only 1 lick was emitted. C, Atlas section shows target region, histological section shows position of electrode tips in DRN (red square, enlarged in inset) and cannula track damage (arrows) in one rat. D, Waveforms show averages from two spikes recorded from one electrode separated by cluster analysis of waveform shape. Color density plot shows cluster analysis of waveform principal components identifying two clusters representing the two waveforms. E, Histogram shows firing rate for the larger spike cell in D before and after administration of 8-OHDPAT (arrow).
Surgery and electrodes.
Electrode implantation was performed under general anesthesia (75 mg/kg ketamine plus 0.5 mg/kg Domitor), with additional local anesthetic along the scalp incision line (0.5 ml of 20 mg/ml Lopaine) and systemic antibiotic cover (0.1 ml of Strepcin, 10,000 IU of Procaine Penicillin G, 250 mg/ml dihydrostreptomycin). A small hole was drilled in the skull over the DRN 7.5 mm posterior to bregma in the midline (Paxinos and Watson, 1997) (Fig. 1C). A 23 gauge stainless steel guide cannula was lowered through the dura and sagittal vein so that the tip was positioned above the DRN, and then fixed in place with dental acrylic. Bleeding from the vein was usually minimal and self-limiting; if necessary, gentle pressure with sterile gauze was applied. A 30 gauge stainless steel cannula containing a bundle of 8 Formvar-insulated nichrome microwire recording electrodes (0.001 inch diameter; A-M Systems) was then lowered through the guide cannula so that the electrode tips were close to the dorsal margin of the DRN ∼5.5 mm below the surface of the skull. The microelectrode cannula was mounted on an on-head microdrive, permitting subsequent advance of the electrodes. The electrode wires were connected to male Amphenol pins mounted in a McIntyre socket (Ginder Scientific). The electrode assembly was fixed to the skull using six stainless steel screws and dental acrylic. A protective box was placed over the electrode and microdrive assembly and fixed in place with additional dental acrylic. Antisedan (2.5 mg/kg, s.c., to terminate anesthesia) and postoperative analgesic (0.1 ml/kg Carprofen, s.c.) were administered at the end of the procedure. All animals were allowed 1 week to recover from surgery before any recordings.
Recording procedures.
Each day subsequent to recovery from surgery, the electrode channels were checked for discriminable spikes. The electrode leads were connected to the recording apparatus via a flexible cable that incorporated impedance-matching unity gain amplifiers suspended from a low-noise electrical swivel (Crist Instrument). Signals from the electrodes were amplified (2–10,000 times), filtered (500 Hz to 10 kHz bandpass), and monitored on oscilloscopes. Any channels with cellular activity were digitized (20 kHz) and recorded on computer using Discovery software (DataWave Technologies). Spikes from different neurons were discriminated from each other and from noise using cluster analysis based on measured waveform parameters (Fig. 1D). If a cell was present, recordings were performed under the two context different conditions. If there were no cells present, the electrodes were advanced ∼90 μm and the channels checked again. If this failed to generate recordable cells, rats were allowed to perform the task conditions to maintain training and to provide their daily water ration and returned to the home cage to be retested the next day.
Data analysis.
Neural responses to the cue and other task events were examined by constructing averaged peristimulus time histograms (PSTHs) and trial-by-trial dot raster displays centered on the time of cue onset using Spike 2 software (CED). To detect short latency phasic excitatory responses, PSTHs with a 1 ms bin width were used. Excitatory responses (PSTH peaks) were identified when 3 consecutive 1 ms bins crossed a threshold set at ±2 SDs above the mean precue firing rate calculated from the 0.5 s before cue onset. Response onset latencies were measured to the left edge of the first bin of the peak. Peak offset was set as the first of three consecutive bins below threshold. Peak amplitude was measured as the mean value of the bins within the peak (|Xp) minus the mean of the baseline (0.5 s before cue onset, |XB) and normalized to baseline firing rate as a modulation index M, where:
 |
Average spike waveforms were calculated from 5 min of recording and the waveform duration index was measured as the time between the largest peak (positive or negative) and the next peak (negative or positive), referred to as the P–P spike duration. Baseline firing rate for the purpose of cell type categorization was calculated for each cell as the average rate in the period prior to drug administration (5 min), when the room light was on and no task was being performed so that rats were the most quiescent and were exposed to minimal stimuli. Other measures of firing pattern were made on at-rest data from the context-setting periods within the task sessions. Cell-firing pattern was analyzed using interspike interval histograms (ISI; 1 ms bin for intervals of up to 1 s) to calculate the coefficient of variation of the interspike interval (CV) as , where σISI = SD and |XISI = mean interspike interval. A CV <1 indicates firing more regular than Poisson and >1 indicates less regular. Autocorrelation histograms were used to check for very regular (rhythmic) firing patterns, which produce multiple peaks at regular intervals of declining amplitude with increasing lag. Burst-firing activity was quantified using the Kaneoke and Vitek (1996) algorithm. Cross-correlation analysis was performed from simultaneously recorded neurons to reveal if coordinated activity presented among DRN neuron pairs.
For all statistical contrasts, data were tested for normal distribution (D'Agostino and Pearson omnibus normality test) and parametric (ANOVA, t tests) or nonparametric tests (Kruskal–Wallis, Mann–Whitney tests) used as appropriate. Means are reported ±SD in the text and error bars in the figures show SEM.
Drug administration.
To assist with classification of possible subgroups of cells, we examined the effect on firing rate of systemically administered 5-HT1A autoreceptor agonist 8-hydroxy-2-(di-N-propylamino) tetralin (8-OHDPAT), which inhibits 5-HT neurons (Sprouse and Aghajanian, 1987; Fornal et al., 1994), at a dose of 0.25 mg/kg, i.p. (Fig. 1E). Some cells suspected as being possibly dopaminergic were tested with the DA autoreceptor agonist apomorphine (0.75 mg/kg, i.p.), which inhibits presumed DA neurons (Bunney et al., 1973; Aghajanian and Bunney, 1977; Grace and Bunney, 1980; Aebischer and Schultz, 1984; Hyland et al., 2002). The baseline firing activity of identified neurons was recorded for 5 min before drug application, and then recorded for another 25 min. Mean firing rates in the period 10–15 min after drug administration were expressed as a percentage of the mean firing rate in the predrug period. Drugs were considered to have had an effect if there was a more than a ±20% change in firing rate.
Histology.
The recording locations were confirmed by postmortem histology. After completion of the experiments, rats were killed by anesthetic overdose (100 mg/kg pentobarbitone). Brains were immersion fixed in 10% formalin solution for 1 week and then embedded in paraffin, coronally sectioned serially (7 μm) on a microtome, stained with cresyl violet (0.5%), and cannula tracks identified under a microscope.
Results
As illustrated by the example in Figure 1C, all but one of the cannula tracks traversed the DRN through the midline with anterior–posterior coordinates ranging from −7.3 to −7.8 mm caudal of bregma (Paxinos and Watson, 1997). These tracks thus recorded in regions spanning the boundary between the rostral and middle zones of the DRN, as defined by Abrams et al. (2004), from the rostral, dorsal, and ventral subfields of the DRN (Hale and Lowry, 2011). In the remaining animal the cannula passed just lateral of the midline, sampling lateral wing neurons.
We divided spike waveform shapes into three types: biphasic, initially negative (∼37% of recordings); triphasic, initially positive (∼48%); and biphasic, initially positive (∼16%). Initial positive components formed a continuum from nil to barely perceptible to dominant; furthermore, variation in waveform shape is not only contributed to by the intrinsic properties of the neurons, but is also strongly influenced by the distance and spatial positioning of electrodes relative to cell body, dendrites, and axon initial segment (Schweimer and Ungless, 2010). Nevertheless, analysis of waveform P–P duration revealed a significant difference across the types (F(2,101) = 23.75, p < 0.001, ANOVA), with triphasic waveforms of significantly shorter duration than both types of biphasic waveform (p < 0.001, Tukey's multiple-comparison test). However, although longer waveform durations have often been associated with cells having a lower firing rate, in this dataset, there was no significant difference in the firing rate of neurons across the waveform types (p = 0.99, Kruskal–Wallis test).
DRN neurons more activated by non-reward-associated cues than by reward-associated cues
From >160 DRN neurons recorded from 9 rats, we identified 127 with a phasic excitatory response to the cue tone in 1 or both contexts (111 from 6 rats trained with reward delivered in the dark and 16 from 3 rats trained in the opposite context). Phasic excitations were defined as peaks consisting of at least 3 consecutive PSTH bins >2 SDs from the baseline mean (see Materials and Methods), which began and either ended or were clearly fading within 100 ms of cue onset. Very few cells were found with only a phasic inhibition and these were not further analyzed. Excitatory response onset latencies were short and not different between contexts, averaging 11.8 ± 10.2 ms in C→X and 14.1 ± 11.5 ms in C→R (p = 0.65, Mann–Whitney U test).
We found that these short-latency DRN responses to cues were strongly modulated by whether the cue was associated with reward or not. As illustrated by the PSTH analyses shown for four typical cells in Figure 2, DRN responses showed a strong bias for cues delivered in the context that was never associated with reward compared with when it did predict reward. This was true for both cells with very low (Fig. 2A,B) and higher (Fig. 2C,D) firing rates and cells recorded in rats in which the cue was paired with reward in the light (Fig. 2A) or in the dark (Fig. 2B).
Figure 2.

PSTH and dot rasters illustrating typical phasic excitatory DRN responses to cue onset. A, Responses of a neuron recorded in a rat trained with house-light off (dark) in no-reward blocks (C→X) and house-light on (yellow shading) in reward blocks (C→R). Each line in dot rasters shows one trial, histogram shows average firing rate over whole block. Gray ghost on C→R PSTH shows outline of bins from the corresponding C→X PSTH. Bin width is at 1 ms, cue onset at time 0. B, Cell recorded in a rat trained in the opposite context-reward relationship (C→X in light). C, High-firing-rate cell showing complete selectivity for C→X. D, High-firing-rate cell with early and late response components. In C→R, the earlier component is slightly smaller but the later component is absent.
This bias for the non-reward-related cue was confirmed at the population level by the analyses shown in Figure 3) Figure 3A shows the grand mean PSTH for each context, including all cells that had a detectable excitatory peak in at least one context. Consistent with the single examples, this revealed a clearly larger overall average excitatory response to the cue in the C→X context compared with C→R. There was also a small increase in the baseline firing rate in C→R blocks compared with C→X blocks, reflecting a significant shift in the population of recorded cells as a whole (17.6 ± 19.9 and 13.7 ± 16.6 spikes/s respectively, p < 0.0001, Wilcoxon signed-rank test). This was the case whether C→R occurred in the dark (18.8 ± 14.5 and 14.5 ± 17.3 spikes/s, respectively, p < 0.0001) or the light (11.6 + 11.8 and 9.8 ± 12.5 spikes/s, respectively, p = 0.026, Wilcoxon signed-rank test). For quantitative comparisons of response amplitude between C→R and C→X, we therefore baseline normalized the data for each cell (see description of modulation index in Materials and Methods).
Figure 3.
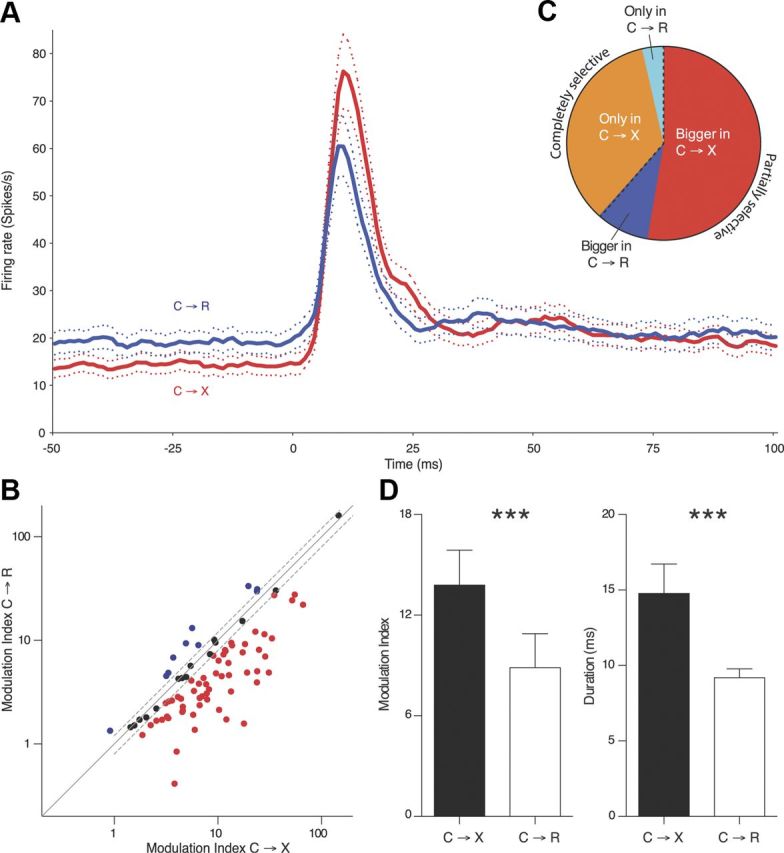
DRN neurons are preferentially activated by a nonreward cue. A, Grand mean population PSTH shows the average (± SEM) responses to cue onset (time 0) in C→X (red) and C→R (blue) contexts (5-bin running average, 1 ms original bin width) calculated from the individual PSTH of all cells showing excitation in at least one context. B, Scatterplot (log–log scales) compares modulation index in each context for all cells with excitation in both contexts. Dashed lines show ±20% variation from line of equality (solid), dividing cells into those in which response modulation index was >20% larger in C→X than C→R (red) or vice versa (blue). C, Pie chart illustrating the proportions of cells showing either an excitation in only the C→X (orange) or C→R (cyan) context (completely selective) or responses in both contexts, but bigger modulation index in C→X (red) or C→R (blue) (partially selective). D, Quantification (mean + SEM) of responses in cells showing excitation in both contexts. Left, Modulation index. Right, Modulation duration. ***p < 0.001.
Quantification of the differences in responsiveness across the two contexts is shown in Figure 3B–D. We first compared responses between contexts in all cells (n = 84) that had a response in both contexts. The scatterplot of Figure 3B shows the modulation index in C→R against the amplitude in C→X for these cells. We set an arbitrary threshold of a ±20% difference to classify individual cells as having a bigger response in one or other context (i.e., defined as “partially selective” for cues depending on the reward context). As illustrated in the pie chart of Figure 3C, there were many more such partially selective cells with a greater modulation index in C→X (n = 59) than had the larger value in C→R (n = 10). Quantitative measures of the responses of all cells with dual responses (i.e., all cells in Fig. 3B regardless of the percentage difference between the contexts) are compared in Figure 3D. This confirmed that the mean modulation index in C→X was significantly larger than in C→R (p < 0.001, Wilcoxon signed-rank test). Furthermore, as shown in Figure 3E, the peaks in C→X trials were also on average significantly longer in duration than in C→R (p < 0.001, Wilcoxon signed-rank test).
Neurons in which a response was detected in one context but with no peak crossing the 2 SD threshold in the other context (Fig. 2C) represent the most extreme form of between-context variation in response amplitude and are referred to as “completely selective” cells. The direction of selectivity for context in these cells again favored the C→X condition. There was a striking overrepresentation of cells with responses only in C→X (Fig. 3C), with 39/127 (31%) of cells showing detectable excitations only in C→X, but only 4 (3%) cells having the reverse selectivity for C→R. A contingency analysis of the data shown in Figure 3C (i.e., including the partially selective more than ±20% difference in amplitude between the two contexts) and completely selective neurons (response above the 2 SD threshold in only 1 context) confirmed a significant preference for the C→X context (p = 0.009, Fisher's exact test).
To determine whether the differences between the two contexts in partial and completely selective cells were due to association with reward or to the presence or absence of the light context signal during the block, we performed separate analyses for cells recorded in the two different reward-context pairings (reward in the dark or reward in the light). This confirmed that the association with reward was the important factor, with both groups having larger modulation index values in C→X in partially selective cells and more cells being completely selective for C→X. In partially selective cells recorded with C→R in the dark, the C→X and C→R modulation indices were 14.6 ± 20.1 and 9.5 ± 19.5, respectively (p < 0.0001, Wilcoxon signed-rank test), whereas for cells recorded with C→R in the light, the values were 6.9 ± 4.8 and 3.4 ± 1.8, respectively (p = 0.027, Wilcoxon signed-rank test). Similarly, for cells recorded with C→R in the dark, there were 28% of responsive cells (31/111) that responded only in C→X and only 4% (4/111) that were completely selective for C→R, whereas for cells recorded with C→R in the light, 44% of responsive cells (7/16) responded only in C→X, with none showing selectivity for C→R.
The above analyses focused on the earliest latency response. In many DRN neurons, there were also identifiable subsequent, but still relatively short, latency components. Several different patterns of multicomponent phasic responses were seen, including secondary inhibitions (Fig. 2C) and excitations (Fig. 2D), but secondary excitations were more common and dominated in the population average PSTH (Fig. 3A). These components were not quantified, but were also often strongly modulated by context. For example, in the cell in Figure 2D, a second excitatory peak seen in C→X failed to appear in C→R, whereas in the example shown in Figure 9, A and B, it was replaced by an inhibition.
Figure 9.
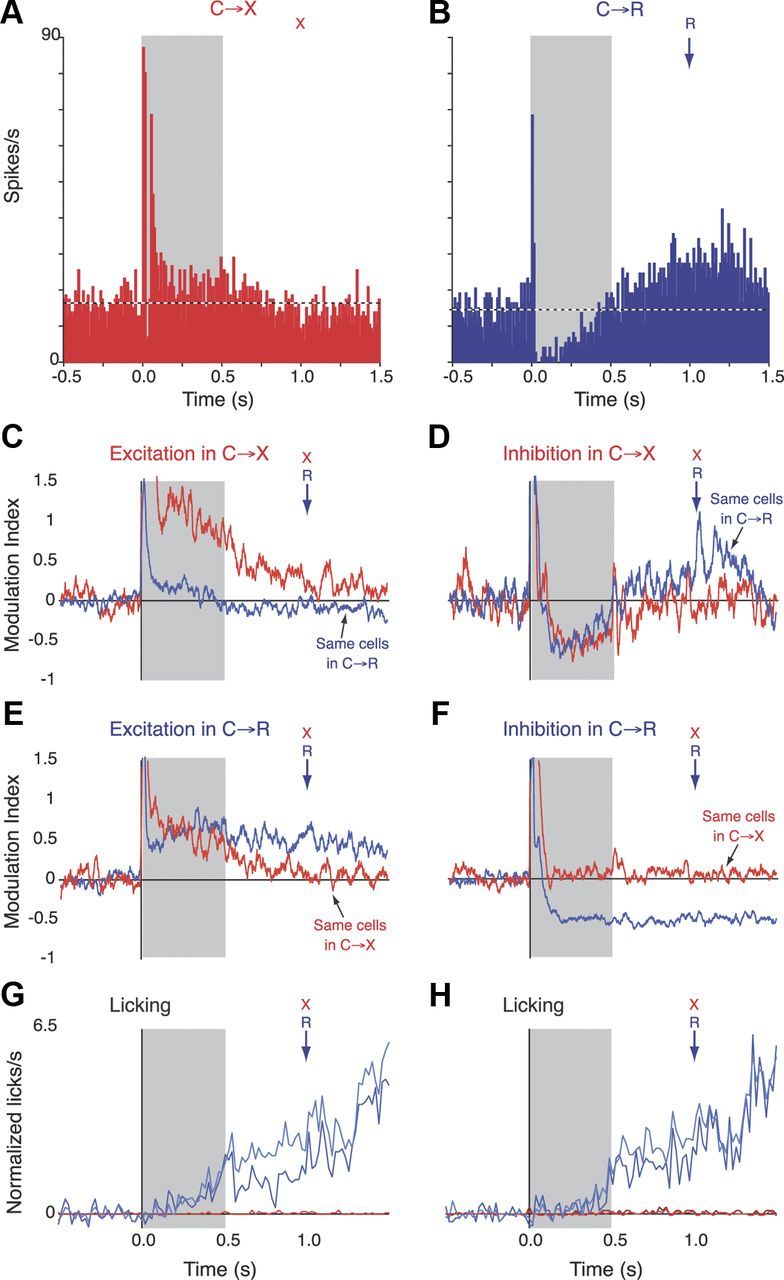
Tonic changes in firing rate. A, Single neuron example. Histogram shows firing rate of a neuron in C→X blocks. Gray shading indicates duration of cue. “X” indicates that no solenoid activation occurs at this time in this context. B, Histogram for the same cell as in A from the C→R context. Solenoid activation (“R,” arrow) occurred 0.5 s after cue offset. C, Red line shows population average normalized modulation index (initial bin width, 1 ms smoothed with 25 bin running average) calculated from all cells with tonic elevation in the C→X context. Vertical axis has been scaled to the tonic component, severely truncating the phasic response. Blue line shows the average calculated for the same cells in the C→R context. D, As for C, but for cells with tonic inhibition in C→X. E, As for C, but for cells with excitation in C→R context. F, As for E, but for inhibitions. G, Population average baseline-normalized lick rates averaged across all recording blocks from which neural data were obtained. Dark blue and red lines show lick data from C→R and C→X blocks in graph C, respectively, and light blue and red lines show data from blocks in E. Note that red lines from C→X blocks are barely visible because they run along baseline. H, Lick data associated with neural data in D and F (conventions as in G).
In striking contrast to the prevalence of responses to the cue tone, across all recorded cells, only one neuron (data not shown) exhibited a significant phasic excitatory response to the low-pitched click sound generated by solenoid activation for fluid delivery. We also scanned C→X PSTHs for modulations around the time that reward occurred in C→R blocks to determine whether there might be a “disappointment” signal at this time, but none (either excitation or inhibition) was evident.
Putative dopaminergic DRN neurons show preference for reward cues
As noted above, of the entire dataset, only 4 neurons showed a phasic short-latency response component that was completely selective for C→R context. These rare neurons caught our attention because this pattern of selectivity matched well with responses we have previously reported for midbrain DA neurons tested with the same cue tone (Pan et al., 2005, 2008) and the DRN is known to contain a population of DA neurons (Michelsen et al., 2007).
In VTA/SNc, putative DA neurons have been identified on the basis of slow (< ∼10 Hz) firing rate and an inhibitory response to the D2 receptor agonist apomorphine. Three of the 4 “atypical” C→R-preferring cells had relatively low baseline rates (6, 8, and 9 spikes/s), with the remaining cell firing somewhat faster at 17 spikes/s. Because maintaining stable recordings over multiple drug injections and sessions of behavioral task performance is difficult, cells were not routinely tested with apomorphine in the present experiment. However, we did test the 3 slowest firing cells and all were inhibited by apomorphine. The cue and apomorphine responses of two of these cells are shown in Figure 4. Both showed robust, phasic responses to the cue in the C→R context (Fig. 4A,B). In contrast, in C→X, the phasic peak was absent. In the cell shown in Figure 4A, only a late component of the C→R response remained, whereas in the cell shown in Figure 4B, the excitatory response to the cue seen in C→R was replaced by an inhibition in C→X. This is of interest because the development of inhibitory responses to nonrewarded cues within reward tasks has been observed frequently among VTA/SNc DA neurons (Mirenowicz and Schultz, 1996; Waelti et al., 2001; Tobler et al., 2003; Pan et al., 2008). As shown in Figure 4, D and E, both of the cells showed a strong inhibitory response to systemic apomorphine, similar to what we found previously for presumed DA cells in ventral midbrain (Hyland et al., 2002; Pan et al., 2005). A further feature of the responses in these cells was their latency (30, 35, and 48 ms). An analysis of the distribution of response latencies in C→R blocks using the ROUT method (Motulsky and Brown, 2006) with a conservative setting of Q = 0.1% confirmed that the three putative DA cells all fell in a small outlier group of 13 cells with latencies >28 ms. Of the remaining 10 cells in this group, 9 had similarly low firing rates, but none showed complete selectivity for the C→R context. Therefore, whereas latency alone was not a reliable predictor of C→R selectivity, response latencies of such neurons were longer than typical for other DRN neurons.
Figure 4.

Putative DA neurons show opposite selectivity for cues than most other DRN neurons. A, Presumed DA neuron. Top and bottom histograms (bin width, 5 ms) and rasters show responses of the same cell to cue onset (time “0”) in reward (C→R) and nonreward (C→X) contexts, respectively. Lines in top raster are ordered by reaction time, in bottom raster in order of occurrence, bottom to top. Gray ghosts on lower C→X histograms show outline of bins from the upper C→R histogram. This cell showed an early phasic response component in C→R that was lost in C→X, but retained a later component. B, Another presumed DA cell in which the cue response was replaced by an inhibition. C, Presumed non-DA neuron recorded simultaneously with the cell shown in B. Note shorter time scale and narrower bin width (2.5 ms) required to capture earlier onset latency in this cell compared with the putative DA neurons. Gray ghost on upper C→R histogram shows outline of bins from the lower C→X histogram. D–F, Response to apomorphine (APO) of cells shown in A–C, respectively. Animal handling for drug administration occurred during the blank period in the histogram. Calibration: inset (average waveforms), 1 ms in all cases.
Five other cells were recorded simultaneously with the “atypical” neurons and underwent the same pharmacological testing, but were not preselected on the basis of any particular response pattern. Three of them had phasic responses to the cue in the task. Both the latency (average 10 ms) and the pattern of responses in these cells were similar to the general DRN population. The example shown in Figure 4C was recorded simultaneously with the putative DA cell shown in Figure 4B, but from a different electrode. In contrast to the putative DA cell, the early part of the cue response in this neuron was completely selective for C→X, whereas a later component remained in C→R. Of the remaining two cells with task responses, one showed partial selectivity for C→X (>20% difference in amplitude), and in the third, the response amplitudes were similar in both contexts. None of these cells was inhibited by the apomorphine that suppressed firing of the simultaneously recorded putative DA cells. Instead, four of them, including the cell illustrated in Figure 4, C and F, were excited and the remaining cell was not significantly affected. Therefore, within this sample of simultaneously recorded cells, an inhibitory response to apomorphine segregated completely with a preference for C→R over C→X in cue responses. We performed cross-correlation analysis on these simultaneously recorded cells, but there was no correlated activity between the putative DA and non-DA cells, which were all recorded on different electrodes.
Lick-related activity
Some neurons showed activity that appeared to be related to licking behavior. This was revealed by calculating PSTHs centered on the time of the first lick after reward delivery. Because licking sequences are rhythmic, in such PSTHs, any activity related to individual lick events is revealed as synchronized modulations in neuronal firing.
This analysis found 12 cells that displayed phasic rhythmic modulation temporally related to individual licks, such as that shown in Figure 5A. In a further six cells, there was only a broad, nonrhythmic modulation in firing over the entire licking period. Another four neurons showed a phasic single peak around the time of first lick, but no simple relation to individual licks per se. The cell shown in Figure 5B is a particularly interesting example of this class of response. In this experiment, the rat exhibited anticipatory licking on approximately half the trials, so in those trials, a lick sequence was already in train when the solenoid was activated. In these trials, the cell activity increased at the time of onset of the licking sequence, remained elevated until the first lick occurred after the solenoid, and then declined, even though licking carried on. In contrast, in trials in which the animal was not already licking when the solenoid was activated, the neural activity occurred only around the time of the first lick. Because the first lick represents the moment when the animal actually receives the reward, one intriguing possibility is that this activity might represent encoding of expectation of reward linked to the animal's own actions, rather than one triggered by the external cue.
Figure 5.

Lick-related activity. A, Lick-synchronized neuron. Top raster and PSTH raster show activity of the neuron centered on time of first lick after solenoid activation (green dashed line). Raster lines show spikes on each trial, with trials ordered by reaction time (i.e., time from activation of solenoid to first subsequent lick). Large black dots mark time of solenoid activation and gray dots the time of cue offset. Bottom raster and PSTH show licking data from the same block. Vertical dashed lines are aligned to the center of the peaks in the lick PSTH. B, Neuron with complex relation licking. Top raster and PSTH show neural activity. Red and black raster lines indicate trials in which conditioned anticipatory licking did or did not occur, respectively, assessed from the lick data shown below. Separate red and black PSTHs were calculated from the respective trials. Skyline plots show the two PSTH overlaid at the same vertical scale. Inset, PSTHs each have optimized vertical scales. Arrow on lick raster indicates transition between trials with and without anticipatory licking.
Electrophysiological and pharmacological characteristics of DRN neurons
Recordings in reduced preparations (brain slices or under anesthesia) have led to a classical description of 5-HT neurons as standing apart from neighboring nonserotonergic DRN cells by virtue of having broad action potentials, relatively slow and regular firing rates, and an inhibitory response to 8-OHDPAT (Vandermaelen and Aghajanian, 1983). Although it is now increasingly recognized that there is overlap in these parameters (Beck et al., 2004; Hensler, 2006; Kocsis et al., 2006; Schweimer and Ungless, 2010; Calizo et al., 2011), to enable comparison of our data with previous reports, we subdivided cells into groups on the basis of firing rate and response to 8-OHDPAT. We treated waveform width as a secondary measure that was calculated post hoc for the separated groups and then investigated whether cue response properties segregated with these measures.
A total of 128 well isolated neurons were pharmacologically assessed with 8-OHDPAT and recorded through both behavioral contexts. The scatterplot in Figure 6A shows the correlation between the baseline firing rate and the effect of 8-OHDPAT for all of these neurons. We categorized cells as showing an excitatory or inhibitory response to 8-OHDPAT using the relatively conservative criterion of a ±20% change in rate. We divided cells into low- or high-firing baseline rate using a 20 Hz cutoff. This relatively high rate was chosen because recent studies have positively identified 5-HT cells with rates up to 17 spikes/s, even in anesthetized animals (Kocsis et al., 2006), and there was a gap in the firing rate distribution at 20–30 spikes/s. From the quadrants defined by these criteria (Fig. 6A), we defined 3 groups for further analysis (the fourth quadrant, representing cells with >20 Hz baseline and excited by 8-OHDPAT, had too few cells, n = 7, 6%, for meaningful intergroup comparisons). Group 1 cells (n = 51, 40%), were characterized by a low baseline firing rate and inhibition by 8-OHDPAT. Group 2 cells (n = 21, 16%) had a high firing rate and were also inhibited by 8-OHDPAT (Fig. 1E). Group 3 (n = 21, 16%) cells had baseline firing rates <20 spikes/s, like Group 1, but were excited by 8-OHDPAT. The mean pre- and post-8-OHDPAT firing rates for these groups are summarized in Figure 6B. Because the groups were originally defined by selection according to these two parameters, no statistical comparisons of firing rates are presented.
Figure 6.

Electrophysiological and pharmacological characteristics of DRN cells. A, Scatterplot (log–log axes) of post-8-OHDPAT rate as a percentage of the predrug rate against the predrug rate (100% indicating no change). Red and blue points indicate cells with >20% reduction in rate after 8-OHDPAT from a baseline rate of less or >20 Hz, respectively. Green points show cells excited >20% by 8-OHDPAT with a baseline rate <20 Hz. Gray points are cells with <20% change after 8-OHDPAT and black points are fast-firing, excited cells. B, Histogram showing mean + SEM firing rates before (hashed bars) and after (black bars) 8-OHDPAT for Groups 1–3. C, Waveform shape. Bar chart shows proportions of cells in each group exhibiting the different types of waveform. D, Histogram showing the mean + SEM peak-to-peak (P–P) durations of cells in each group pooled across the waveform shape. *p < 0.05 compared with Group 1. E, CV of interspike intervals for all cells in each group. *p < 0.05. F, percentage spikes in bursts. *p < 0.05.
The electrophysiological properties of these subgroups are summarized in Figure 6C–F. There was no significant difference in the distributions of waveform shape overall (Fig. 6C; p = 0.7, χ2 test). However, when all waveform shapes were pooled together, waveform durations did differ across the groups (Fig. 6D; F(2,90) = 4.97, p < 0.009) with Group 1 cell waveform durations (0.23 ± 0.06 ms) longer than Groups 2 and 3 (0.19 ± 0.01 and 0.18 ± 0.07 ms, respectively, p < 0.05, Tukey's multiple-comparison test). Group 1 therefore represents low-firing-rate, 8-OHDPAT-inhibited, and broader-waveform cells, matching classical descriptions of presumed 5-HT neurons.
We analyzed firing pattern by calculating CV, quantifying parameters of burst firing, and inspecting autocorrelation functions to detect extremely regular (clock-like) firing. There was a significant effect of group for CV (Fig. 6E; p = 0.047, Kruskal–Wallis test). Post hoc analysis showed that Group 3 cells had a significantly higher CV (more irregular firing) than Group 2 (means, 1.3 ± 0.4 and 1.0 ± 0.4, respectively; medians, 1.3 and 0.9, respectively; p < 0.05, Dunn's multiple-comparison test), with Group 1 being intermediate between them (mean, 1.1 ± 0.4; median, 1.0). Consistent with the CV, quantitative analysis of bursting (Fig. 6F) revealed that Group 3 cells were high bursting (on average, ∼30% of spikes in bursts), with Group 2 having very low (∼7%), and Group 1 intermediate (∼20%) proportions of spikes in bursts (significant effect of group, p = 0.006, Kruskal–Wallis test, p < 0.01 Dunn's post hoc test for Group 2 vs Group 3).
Autocorrelations indicated that rhythmic activity was extremely rare in slow-firing, 8-OHDPAT-inhibited Group 1 cells, being seen only in one case (2%). This was surprising, given previous reports of such activity in similar cells from reduced or anesthetized preparations (Nakahama et al., 1981; Sakai and Crochet, 2001; Allers and Sharp, 2003; Schweimer and Ungless, 2010). However, in one case, while recording a nonrhythmic Group 1 cell, we administered ketamine anesthesia to the rat, which led to development of rhythmic firing with a period of ∼5 s (data not shown). Such long time period oscillation has been observed previously in DRN of anesthetized animals (Allers and Sharp, 2003). In contrast, as illustrated by the cell in Figure 7A, clock-like rhythmic firing was seen in 38% (8/21) of fast-firing Group 2 neurons, with autocorrelations displaying relatively extended reduced activity periods of 8–12 ms (mean, 10.25 ms) after each reference spike, consistent with single-spike mode activity. Rhythmic activity was also seen in some Group 3 cells (4/21, 19%). Two of these had an “early peak” in the autocorrelogram (very short reduced activity period of ∼4 ms; Fig. 7B) that was consistent with rhythmic bursting activity (Wilson and Groves, 1981), which was never seen in Group 2.
Figure 7.

Auto- and cross-correlation features. A, Autocorrelation from a Group 2 neuron. Extended reduced activity period after reference spike time (0) indicates rhythmic single spike mode firing (bin width, 1 ms). SIB, Spikes in bursts. B, Autocorrelation from a Group 3 neuron. Early peak after the reference spike time indicates rhythmic burst firing in this cell. C, Top histogram shows cross-correlation of two Group 1 cells. Calibration: inset (waveforms), 1 ms. Histograms below show autocorrelation functions for each cell (bin width, 5 ms in all histograms).
We performed cross-correlation analysis for all pairs of simultaneously recorded cells. However, clear correlations were rare, with only five clear peaks observed from 149 pairs. All were broad peaks that spanned the origin, suggestive of a tendency to fire over similar time frames (Fig. 7C).
To determine whether the different subgroups responded differently to the cue signal, we calculated separate population average PSTHs for each group, including nonresponsive and the rare inhibited cells. Because Group 2 had higher baseline rates by definition, and a modulation of a certain size is proportionally less of a change in high-firing- than in low-firing-rate cells, we normalized for rate by dividing the modulation value for each PSTH bin by the mean baseline firing rate, yielding a unit-less modulation index (see Materials and Methods). These graphs, shown in Figure 8, thus represent the net phasic cue response output of each DRN subgroup. This analysis revealed that all three subgroups expressed a net excitatory output and, furthermore, that this was stronger in C→X trials than C→R in each case. Quantitative analysis of modulation index for cells that responded in both contexts confirmed that, overall, amplitudes in C→X were larger than in C→R across all groups (significant effect of context, F(1,51) = 11.9, p = 0.0012, no effect of group and no group × context interaction, 2-way repeated measures mixed model ANOVA). Similarly, all groups showed higher proportions of cells with excitatory response only in C→X than only in C→R context: Group 1, 37% (16/43) only in C→X, 2% (1/43) only in C→R; Group 2, 18% (3/17) only in C→X, none in C→R; and Group 3, 32% (6/19) only in C→X, none in C→R.
Figure 8.
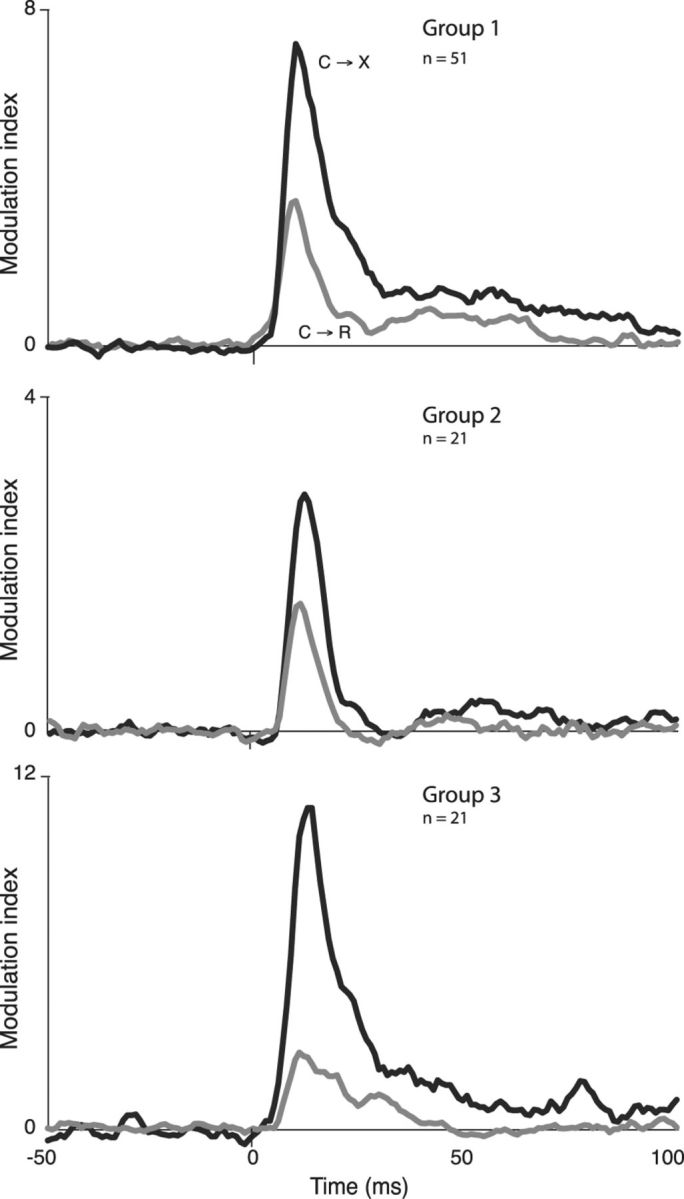
Population average normalized modulation indices for different groups (separated on basis of firing rate and response to 8-OHDPAT) calculated from PSTHs in all cells, including excited, inhibited, and nonresponsive cells. Black and gray lines show responses in C→X and C→R blocks, respectively. Group 1, Baseline firing rate <20 Hz, inhibited >20% by 8-OHDPAT. Group 2, baseline firing rate >20 Hz, inhibited >20% by 8-OHDPAT. Group 3, Baseline firing rate <20 Hz, excited > 20% by 8-OHDPAT.
Tonic activity during the waiting period
Tonic changes in firing rate related to waiting for rewards are known to be important features of DRN activity in operant tasks (Nakamura et al., 2008; Miyazaki et al., 2011a). We therefore investigated whether tonic changes also occur in our nonoperant associative learning task. Cells were classified as having a tonic response if they showed excitation or inhibition relative to precue baseline in either the last 250 ms of the cue or the period 250–500 ms after cue offset (i.e., the last 250 ms before reward delivery in C→R blocks). Cells in which tonic activity in C→R blocks occurred only late in the cue–reward interval and persisted after solenoid activation were excluded from this analysis, but were analyzed separately for possible lick-related activity (see above).
A typical example cell showing tonic components in its response profile is shown in Figure 9, A and B. In C→X trials (Fig. 9A), this neuron showed a short latency multicomponent phasic response to cue onset, followed by a much smaller amplitude tonic excitation that lasted throughout the cue tone and faded gradually after cue offset. Analysis of the cell's activity in C→R trials (Fig. 9B) revealed that the second excitatory component of the phasic response and the tonic excitation were replaced by a profound inhibition during the tone, followed by excitation that persisted into the consumption period. As exemplified by this cell, most tonic responses occurred in cells that also had phasic components but were less common and generally smaller in amplitude. In contrast to the dominance of excitations among phasic responses, inhibitory tonic modulations were common, particularly in C→R blocks. Quantitative analysis of the distribution (pooled over all groups) confirmed that inhibitions were overrepresented in the C→R condition (27/47, 57% of tonic responses) and relatively uncommon in C→X (10/30, 33%; p = 0.039, χ2 test).
To capture the features of tonic excitatory and inhibitory responses at the population level, we calculated population average PSTH from groups of cells categorized as showing tonic responses in one or the other context. The results for analysis of Group 1 cells are shown in Figure 9C–F. Population averages were also calculated for Groups 2 and 3 (data not shown) and both had a similar pattern to that seen in Group 1, but were noisier because of the small numbers of cells.
Figure 9C shows the population average responses from Group 1 cells (n = 20) that had an excitatory tonic response in C→X trials, which is reflected the grand average for this context (red trace). This was almost completely lacking in the grand average PSTH for C→R trials calculated for the same cells, indicating a strong selectivity of these cells for the C→X context. That is, if a cell showed a tonic excitation in C→X, it was unlikely to show it in C→R. In striking contrast, cells that showed tonic inhibition in C→X (n = 10; Fig. 9D) showed a very similar grand average inhibition in C→R.
The selection of cells that had tonic responses in the C→R context revealed an interesting crossover in selectivity. As shown in Figure 9E, the grand average PSTH for cells with tonic excitation in C→R (n = 20) was similar for both contexts. Therefore, if a cell showed a tonic excitation during the cue in C→R, it was likely to show a similar response in C→X, although there may have been a tendency for this activity to be sustained to a greater extent in C→R while the animals waited for reward. Conversely, inspection of the grand averages for cells that showed inhibition in C→R (Fig. 9F) reveals that these responses were highly context specific: cells with inhibitions in C→R showed different patterns of activity in C→X such that the grand average for that condition showed no net deviation from baseline.
The population average conditioned licking responses for the sessions included in the grand averages for the neural data are shown in Figure 9G for cells with excitations in C→X (red traces) or C→R (blue traces) and in Figure 9H for cells with inhibitions in the respective contexts. These show that conditioned approach behavior (anticipatory licking) built steadily during the waiting period in C→R trials, but not in C→X trials. Therefore, although both tonic excitations and inhibitions occur over this time period in both contexts, differential tonic excitations occur when licking is not generated in response to the cue, whereas differential inhibitions occur when conditioned licking is expressed.
To further explore the apparent inverse relationship between the probability of spiking in these cells and the expression of anticipatory licking revealed at the level of whole trial blocks, we performed the additional within-block analyses shown in Figure 10. In C→R trials, rats made anticipatory conditioned lick responses during the waiting period on a subset of trials. We therefore examined whether the cell activity varied according to the presence or absence of licking on each trial within C→R blocks. Rats performed too few licks on C→X trials for the converse analysis. Figure 10A shows the spike dot raster from an example cell overlaid with the licking raster. In this cell, spiking activity ceased shortly before the onset of conditioned licking in each trial in which conditioned licking occurred, leading to an overall suppression of activity averaged across those trials. Conversely, in trials in which no licking occurred, spike activity was tonically elevated over the same period. This inverse relation to licking is further illustrated for this cell in Figure 10B, which shows that spike activity was strongly inhibited over the period of both conditioned prereward and postreward consummatory licking. Figure 10C shows the grand mean PSTH for C→R blocks separately for trials in which licking did or did not occur in the waiting period for cells from Figure 9 that appeared to show differential activity in the two contexts. On average, cells that showed tonic excitation during C→X showed little change in C→R (Fig. 9C). However, analysis of just those trials in which licking did not occur in C→R revealed a trend toward excitation over that period in these cells (Fig. 10C, top). Conversely, cells in Figure 9F showed overall tonic inhibition during C→R and no net change in C→X, when licks were rare. However, analysis of separate trials within C→R blocks (Fig. 10C, bottom) showed that the overall inhibition was due entirely to trials with anticipatory licking and was not present in those trials with no licking.
Figure 10.
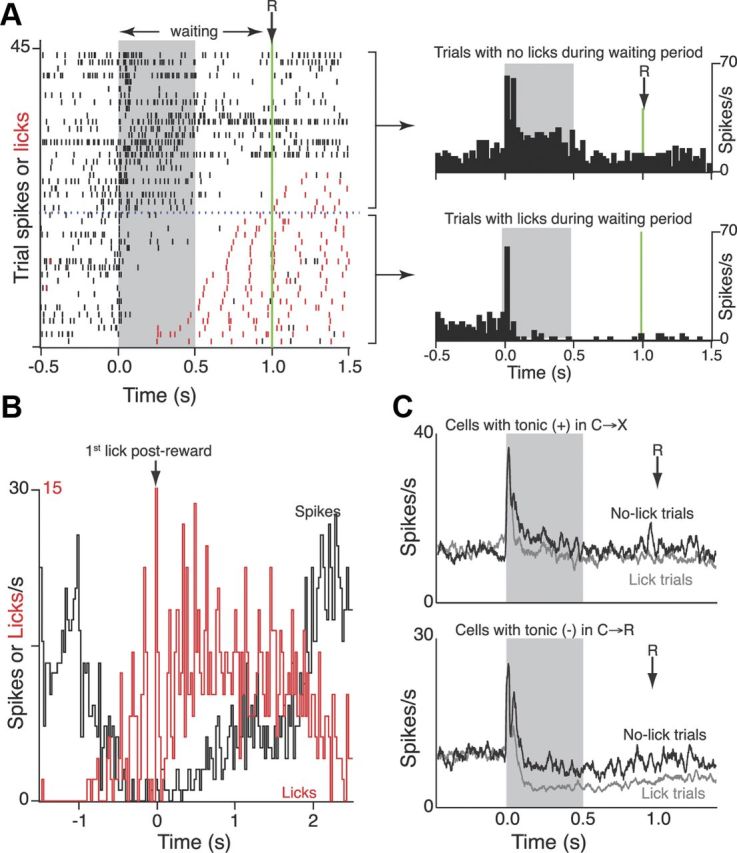
Within-block analysis of cells showing selective tonic modulation during the waiting period. A, Example cell. Dot raster shows all trials recorded from the C→R block. Black ticks show individual spikes on each trial, red ticks show lick events on the same trials. Trials ordered according to time of first lick after cue onset (time 0). Green line shows time of solenoid activation. Horizontal dashed blue line demarcates trials with licks (below) from trials with no licks during the waiting period (above). PSTH (25 ms bin) show average firing rate for the cell calculated from the respective subsets of trials. B, Skyline plots showing PSTH over all trials centered on the first lick after solenoid activation (time 0) for spike activity (black) and licking (red) from the same file as in A. Note that this alignment includes reward events that are beyond the x-axis range shown in A. C, Grand mean PSTH (25 ms running average, 1 ms original bin width) showing averages for C→R blocks calculated from trials with no licks (black) or licking (gray) during the waiting period, Top, Cells that overall (Fig. 9C) had a tonic excitation in C→X trials. Bottom, Cells (Fig. 9F) that overall had inhibition in C→R trials.
Discussion
We found that DRN neurons responded to auditory cues with phasic, short latency excitations that generally occurred either only, or more strongly, in response to the cue when it was not associated with reward. To our knowledge, phasic responses of DRN to reward and nonreward cues have not been directly compared previously. However, earlier work has established that DRN neurons respond robustly to unconditioned sensory stimuli (Heym et al., 1982; Rasmussen et al., 1986; Montagne-Clavel et al., 1995; Fornal et al., 1996; Waterhouse et al., 2004). Further, a recent study found no responses to conditioned reward-predictive tones, whereas responses that occurred to a loud noise at the time of reward delivery related more to its intensity than to its reward predictive nature (Ranade and Mainen, 2009).
The latency of phasic DRN responses is similar to that of amygdala neurons (Quirk et al., 1995) and short enough to modulate other brain circuits to regulate attention and behavioral choice (Ranade and Mainen, 2009). Prediction of “lack of reward” could relate to the involvement of DRN 5-HT systems in aversive learning (Deakin and Graeff, 1991; Cools et al., 2008; Dayan and Huys, 2009). More generally, coding salience is important to guiding behavior. 5-HT from DRN suppresses activity in sensory-processing regions, which in turn regulate movement control circuits (Rogawski and Aghajanian, 1980; Waterhouse et al., 1986, 1990). By reducing the processing of low-salience events, DRN could direct attention away from them to prevent wasteful responding.
In addition, DRN is a major source of monosynaptic input to midbrain DA neurons (Watabe-Uchida et al., 2012). DRN inputs are known to inhibit midbrain DA neuron activity (Gervais and Rouillard, 2000) both directly (Hervé et al., 1987; Nedergaard et al., 1988; Guiard et al., 2008; Dremencov et al., 2009) and indirectly (Bubar and Cunningham, 2007). Projections from DRN neurons may thus provide feedforward inhibition after low-salience signals that could contribute to the well known selectivity of DA cells for salient cues (Schultz and Dickinson, 2000; Pan et al., 2005). Such an inhibitory gating role is broadly consistent with theories that propose functionally opposing roles for 5-HT and dopaminergic systems (Daw et al., 2002; Cools et al., 2008; Dayan and Huys, 2009).
DA neurons respond poorly to predicted rewards (Schultz et al., 1997; Schultz and Dickinson, 2000; Pan et al., 2005), which may reflect a loss of excitatory input or a specific inhibition. We found DRN neurons to be largely unresponsive to the predicted sound of solenoid activation for reward delivery, which is consistent with a preference of DRN for nonreward stimuli and with previous reports (Nakamura et al., 2008; Miyazaki et al., 2011a), indicating that DRN is not responsible for generating a gating signal at this time. Therefore, DRN may be specialized for coding the inverse of the reward-predictive value of sensory signals rather than their predictability. This hypothesis predicts that blockade of DRN inputs would promote increased responsiveness of DA cells to nonreward cues without influencing the effect of predictability.
Given that most 5-HT neurons are in DRN, a question of interest is whether it is possible to distinguish these neurons in our recordings. On statistical grounds, it is likely that a significant proportion were serotonergic, because these make up at least one-third (Descarries et al., 1982) and possibly up to two-thirds (Monti, 2010) of DRN neurons in the rat. Consistent with this, 40% of tested neurons met traditional electrophysiological and pharmacological criteria for 5-HT neurons (Vandermaelen and Aghajanian, 1983; Kocsis et al., 2006). When analyzed separately, these neurons showed the same selectivity for nonreward cues seen overall. Although these criteria do not exclude non-5HT neurons (Allers and Sharp, 2003; Kirby et al., 2003; Beck et al., 2004; Marinelli et al., 2004; Schweimer and Ungless, 2010; Calizo et al., 2011), these results suggest that 5-HT projections carry a selective, non-reward-preferring signal.
Interestingly, however, this selectivity was found in cells with all combinations of characteristics, similar to previous reports (Nakamura et al., 2008; Ranade and Mainen, 2009; Bromberg-Martin et al., 2010). The overlap in properties with slow-firing Group 3 cells, which were excited by 8-OHDPAT, may reflect inclusion of 5-HT neurons. A proportion of 5-HT neurons are insensitive to direct application of 5-HT1A agonists, whereas some local GABAergic interneurons are inhibited (Calizo et al., 2011). Such 5-HT neurons could show net excitation through suppression of their GABAergic afferents. Consistent with observations of burst firing in subgroups of identified 5-HT neurons (Hajós et al., 1995, 2007), some neurons in this group showed burst firing, including rhythmic bursting, as was described previously for DRN in awake animals (Kocsis and Vertes, 1992).
Selectivity for nonreward also extended to fast-firing neurons, which are common in free-moving rat DRN (Kocsis and Vertes, 1992; Miyazaki et al., 2011a) and are considered most likely to be GABAergic (Allers and Sharp, 2003). Some of these cells were inhibited by 8-OHDPAT, consistent with the presence of 5HT1A-agonist-sensitive GABA neurons in some subregions (Calizo et al., 2011). Variation in the density of these neurons across DRN may account for the lack of such inhibitions in some studies (Miyazaki et al., 2011a). That presumed GABA and 5-HT neurons showed similar responses may appear to be paradoxical, but could be functionally important. Modeling studies indicate feedforward inhibition provided by coactivation of projection and local GABAergic interneurons can buffer the effect of noisy synaptic inputs, smoothing their integration to allow for continuously variable output (Ferrante et al., 2009).
In contrast, a small number of putative DA neurons stood out, preferring, like VTA/SNc DA neurons, reward-predicting stimuli (Ljungberg et al., 1992; Pan et al., 2005). Although definitive identification is difficult (Margolis et al., 2008) and will benefit from optogenetic approaches (Witten et al., 2011), cells preferring reward were rare, which is consistent with the low number of DA neurons in DRN (Stratford and Wirtshafter, 1990). Further, response latencies were longer than typical for DRN cells, but were similar to other DA populations (Pan et al., 2005). Although confirmation with a larger sample is required, these data suggest that at least some DRN DA neurons may be functionally similar to the VTA populations with which they are physically continuous and which share projections to nucleus accumbens and medial prefrontal cortex (Stratford and Wirtshafter, 1990).
Previous studies have revealed prominent tonic DRN modulation in operant tasks in which animals must wait for rewards (Doya, 2002; Winstanley et al., 2006; Nakamura et al., 2008; Ranade and Mainen, 2009; Bromberg-Martin et al., 2010; Miyazaki et al., 2011a,b). In rats, the maintenance of elevated DRN activity (Miyazaki et al., 2011a) and 5-HT levels in target regions (Miyazaki et al., 2011b) is correlated with successful withholding of responses, whereas blocking DRN activity promotes early responding (Miyazaki et al., 2012). Such DRN responses have thus been interpreted as reflecting the animals “preparedness to wait” for future rewards (Miyazaki et al., 2011a). Consistent with such waiting-related activity, we found a small but significant increase in the baseline firing rate in the intertrial interval in the reward context while animals waited for the cue.
However, more complex relationships were observed during the waiting period between the cue and the reward delivery. The prevalence and amplitude of tonic responses during this period was rather low in the present study, perhaps because there was no requirement to withhold responses to obtain reward. Nevertheless, the animals did show differential expression of licking behavior in the two contexts. Although some cells were uniformly excited or inhibited during and after the cue in either context, subsets of neurons showed differential activity. Differential excitations occurred after nonreward cues, when rats did not emit licking responses, whereas differential tonic reductions in firing were most prominent in the reward context, when rats did emit licks. Further, analysis within blocks showed that the association held for single trials in which licking did or did not occur. Therefore, in this classically conditioned task, the sign of these differential postcue tonic changes was dissociated from reward expectation and instead had an inverse relationship to the probability of licking behavior being expressed. These tonic changes contrast markedly with activity in another group of DRN cells that showed phasic peaks time locked to individual licks. This diversity reflects the complexity of DRN, with not only multiple neurochemical phenotypes, but also regional differences in input/output connections and functional correlates (Abrams et al., 2004; Hale and Lowry, 2011). Activity in DRN correlated with licking or other rhythmic movements has been described previously (Jacobs and Azmitia, 1992; Fornal et al., 1996) and caudal DRN has been postulated to have a role in regulating activity in central pattern generators (Schmidt and Jordan, 2000; Hattox et al., 2003).
In summary, phasic signals in DRN code stimuli of low salience, whereas tonic activations and inhibitions are associated with suppression or release of licking behavior, respectively. Together, these responses may contribute convergent functions over both short (milliseconds) and long (seconds) timescales that would be consistent with longstanding hypotheses linking activation of DRN 5-HT projection systems with impulse control (Soubrie, 1986; Evenden, 1999; Cardinal, 2006; Dayan and Huys, 2008).
Footnotes
This work was supported by the New Zealand Neurological Foundation. We thank Tor Kirkesola, Hanne Stensland, and Weixing Pan for assistance with preliminary experiments.
References
- Abrams JK, Johnson PL, Hollis JH, Lowry CA. Anatomic and functional topography of the dorsal raphe nucleus. Ann N Y Acad Sci. 2004;1018:46–57. doi: 10.1196/annals.1296.005. [DOI] [PubMed] [Google Scholar]
- Aebischer P, Schultz W. The activity of pars compacta neurons of the monkey substantia nigra is depressed by apomorphine. Neurosci Lett. 1984;50:25–29. doi: 10.1016/0304-3940(84)90456-7. [DOI] [PubMed] [Google Scholar]
- Aghajanian GK, Bunney BS. Dopamine “autoreceptors”: pharmacological characterization by microiontophoretic single cell recording studies. Naunyn-Schmiedeberg's Arch Pharmacol. 1977;297:1–7. doi: 10.1007/BF00508803. [DOI] [PubMed] [Google Scholar]
- Alex KD, Pehek EA. Pharmacologic mechanisms of serotonergic regulation of dopamine neurotransmission. Pharmacol Ther. 2007;113:296–320. doi: 10.1016/j.pharmthera.2006.08.004. [DOI] [PMC free article] [PubMed] [Google Scholar]
- Allers KA, Sharp T. Neurochemical and anatomical identification of fast- and slow-firing neurones in the rat dorsal raphe nucleus using juxtacellular labelling methods in vivo. Neuroscience. 2003;122:193–204. doi: 10.1016/s0306-4522(03)00518-9. [DOI] [PubMed] [Google Scholar]
- Beck SG, Pan YZ, Akanwa AC, Kirby LG. Median and dorsal raphe neurons are not electrophysiologically identical. J Neurophysiol. 2004;91:994–1005. doi: 10.1152/jn.00744.2003. [DOI] [PMC free article] [PubMed] [Google Scholar]
- Bromberg-Martin ES, Hikosaka O, Nakamura K. Coding of task reward value in the dorsal raphe nucleus. J Neurosci. 2010;30:6262–6272. doi: 10.1523/JNEUROSCI.0015-10.2010. [DOI] [PMC free article] [PubMed] [Google Scholar]
- Bubar MJ, Cunningham KA. Distribution of serotonin 5-HT2C receptors in the ventral tegmental area. Neuroscience. 2007;146:286–297. doi: 10.1016/j.neuroscience.2006.12.07. [DOI] [PMC free article] [PubMed] [Google Scholar]
- Bunney BS, Walters JR, Roth RH, Aghajanian GK. Dopaminergic neurons: effect of antipsychotic drugs and amphetamine on single cell activity. J Pharmacol Exp Ther. 1973;185:560–571. [PubMed] [Google Scholar]
- Calizo LH, Akanwa A, Ma X, Pan YZ, Lemos JC, Craige C, Heemstra LA, Beck SG. Raphe serotonin neurons are not homogenous: electrophysiological, morphological and neurochemical evidence. Neuropharmacology. 2011;61:524–543. doi: 10.1016/j.neuropharm.2011.04.008. [DOI] [PMC free article] [PubMed] [Google Scholar]
- Cardinal RN. Neural systems implicated in delayed and probabilistic reinforcement. Neural Netw. 2006;19:1277–1301. doi: 10.1016/j.neunet.2006.03.004. [DOI] [PubMed] [Google Scholar]
- Cools R, Roberts AC, Robbins TW. Serotoninergic regulation of emotional and behavioural control processes. Trends Cogn Sci. 2008;12:31–40. doi: 10.1016/j.tics.2007.10.011. [DOI] [PubMed] [Google Scholar]
- Daw ND, Kakade S, Dayan P. Opponent interactions between serotonin and dopamine. Neural Netw. 2002;15:603–616. doi: 10.1016/s0893-6080(02)00052-7. [DOI] [PubMed] [Google Scholar]
- Dayan P, Huys QJ. Serotonin in affective control. Annu Rev Neurosci. 2009;32:95–126. doi: 10.1146/annurev.neuro.051508.135607. [DOI] [PubMed] [Google Scholar]
- Dayan P, Huys QJ. Serotonin, inhibition, and negative mood. PLoS Comput Biol. 2008;4:e4. doi: 10.1371/journal.pcbi.0040004. [DOI] [PMC free article] [PubMed] [Google Scholar]
- Deakin JF, Graeff FG. 5-HT and mechanisms of defence. J Psychopharmacol. 1991;5:305–315. doi: 10.1177/026988119100500414. [DOI] [PubMed] [Google Scholar]
- Descarries L, Watkins KC, Garcia S, Beaudet A. The serotonin neurons in nucleus raphe dorsalis of adult rat: a light and electron microscope radioautographic study. J Comp Neurol. 1982;207:239–254. doi: 10.1002/cne.902070305. [DOI] [PubMed] [Google Scholar]
- Doya K. Metalearning and neuromodulation. Neural Netw. 2002;15:495–506. doi: 10.1016/s0893-6080(02)00044-8. [DOI] [PubMed] [Google Scholar]
- Dremencov E, El Mansari M, Blier P. Effects of sustained serotonin reuptake inhibition on the firing of dopamine neurons in the rat ventral tegmental area. J Psychiatry Neurosci. 2009;34:223–229. [PMC free article] [PubMed] [Google Scholar]
- Evenden JL. Varieties of impulsivity. Psychopharmacology. 1999;146:348–361. doi: 10.1007/pl00005481. [DOI] [PubMed] [Google Scholar]
- Ferrante M, Migliore M, Ascoli GA. Feed-forward inhibition as a buffer of the neuronal input-output relation. Proc Natl Acad Sci U S A. 2009;106:18004–18009. doi: 10.1073/pnas.0904784106. [DOI] [PMC free article] [PubMed] [Google Scholar]
- Fornal CA, Litto WJ, Metzler CW, Marrosu F, Tada K, Jacobs BL. Single-unit responses of serotonergic dorsal raphe neurons to 5-HT1A agonist and antagonist drug administration in behaving cats. J Pharmacol Exp Ther. 1994;270:1345–1358. [PubMed] [Google Scholar]
- Fornal CA, Metzler CW, Marrosu F, Ribiero-do-Valle LE, Jacobs BL. A subgroup of dorsal raphe serotonergic neurons in the cat is strongly activated during oral-buccal movements. Brain Res. 1996;716:123–133. doi: 10.1016/0006-8993(96)00006-6. [DOI] [PubMed] [Google Scholar]
- Gervais J, Rouillard C. Dorsal raphe stimulation differentially modulates dopaminergic neurons in the ventral tegmental area and substantia nigra. Synapse. 2000;35:281–291. doi: 10.1002/(SICI)1098-2396(20000315)35:4<281::AID-SYN6>3.0.CO;2-A. [DOI] [PubMed] [Google Scholar]
- Grace AA, Bunney BS. Nigral dopamine neurons: intracellular recording and identification with l-dopa injection and histofluorescence. Science. 1980;210:654–656. doi: 10.1126/science.7433992. [DOI] [PubMed] [Google Scholar]
- Guiard BP, El Mansari M, Merali Z, Blier P. Functional interactions between dopamine, serotonin and norepinephrine neurons: an in-vivo electrophysiological study in rats with monoaminergic lesions. Int J Neuropsychopharmacol. 2008;11:625–639. doi: 10.1017/S1461145707008383. [DOI] [PubMed] [Google Scholar]
- Hajós M, Gartside SE, Villa AE, Sharp T. Evidence for a repetitive (burst) firing pattern in a sub-population of 5-hydroxytryptamine neurons in the dorsal and median raphe nuclei of the rat. Neuroscience. 1995;69:189–197. doi: 10.1016/0306-4522(95)00227-a. [DOI] [PubMed] [Google Scholar]
- Hajós M, Allers KA, Jennings K, Sharp T, Charette G, Sík A, Kocsis B. Neurochemical identification of stereotypic burst-firing neurons in the rat dorsal raphe nucleus using juxtacellular labelling methods. Eur J Neurosci. 2007;25:119–126. doi: 10.1111/j.1460-9568.2006.05276.x. [DOI] [PubMed] [Google Scholar]
- Hale MW, Lowry CA. Functional topography of midbrain and pontine serotonergic systems: implications for synaptic regulation of serotonergic circuits. Psychopharmacology. 2011;213:243–264. doi: 10.1007/s00213-010-2089-z. [DOI] [PubMed] [Google Scholar]
- Hattox A, Li Y, Keller A. Serotonin regulates rhythmic whisking. Neuron. 2003;39:343–352. doi: 10.1016/s0896-6273(03)00391-x. [DOI] [PubMed] [Google Scholar]
- Hensler JG. Serotonergic modulation of the limbic system. Neurosci Biobehav Rev. 2006;30:203–214. doi: 10.1016/j.neubiorev.2005.06.007. [DOI] [PubMed] [Google Scholar]
- Hervé D, Pickel VM, Joh TH, Beaudet A. Serotonin axon terminals in the ventral tegmental area of the rat: fine structure and synaptic input to dopaminergic neurons. Brain Res. 1987;435:71–83. doi: 10.1016/0006-8993(87)91588-5. [DOI] [PubMed] [Google Scholar]
- Heym J, Trulson ME, Jacobs BL. Raphe unit activity in freely moving cats: effects of phasic auditory and visual stimuli. Brain Res. 1982;232:29–39. doi: 10.1016/0006-8993(82)90608-4. [DOI] [PubMed] [Google Scholar]
- Hyland BI, Reynolds JN, Hay J, Perk CG, Miller R. Firing modes of midbrain dopamine cells in the freely moving rat. Neuroscience. 2002;114:475–492. doi: 10.1016/s0306-4522(02)00267-1. [DOI] [PubMed] [Google Scholar]
- Jacobs BL, Azmitia EC. Structure and function of the brain serotonin system. Physiol Rev. 1992;72:165–229. doi: 10.1152/physrev.1992.72.1.165. [DOI] [PubMed] [Google Scholar]
- Jacobs BL, Fornal CA. Activity of brain serotonergic neurons in the behaving animal. Pharmacol Rev. 1991;43:563–578. [PubMed] [Google Scholar]
- Kaneoke Y, Vitek JL. Burst and oscillation as disparate neuronal properties. J Neurosci Methods. 1996;68:211–223. doi: 10.1016/0165-0270(96)00081-7. [DOI] [PubMed] [Google Scholar]
- Kirby LG, Pernar L, Valentino RJ, Beck SG. Distinguishing characteristics of serotonin and non-serotonin-containing cells in the dorsal raphe nucleus: electrophysiological and immunohistochemical studies. Neuroscience. 2003;116:669–683. doi: 10.1016/s0306-4522(02)00584-5. [DOI] [PMC free article] [PubMed] [Google Scholar]
- Kocsis B, Vertes RP. Dorsal raphe neurons: synchronous discharge with the theta rhythm of the hippocampus in the freely behaving rat. J Neurophysiol. 1992;68:1463–1467. doi: 10.1152/jn.1992.68.4.1463. [DOI] [PubMed] [Google Scholar]
- Kocsis B, Varga V, Dahan L, Sik A. Serotonergic neuron diversity: identification of raphe neurons with discharges time-locked to the hippocampal theta rhythm. Proc Natl Acad Sci U S A. 2006;103:1059–1064. doi: 10.1073/pnas.0508360103. [DOI] [PMC free article] [PubMed] [Google Scholar]
- Kranz GS, Kasper S, Lanzenberger R. Reward and the serotonergic system. Neuroscience. 2010;166:1023–1035. doi: 10.1016/j.neuroscience.2010.01.036. [DOI] [PubMed] [Google Scholar]
- Ljungberg T, Apicella P, Schultz W. Responses of monkey dopamine neurons during learning of behavioral reactions. J Neurophysiol. 1992;67:145–163. doi: 10.1152/jn.1992.67.1.145. [DOI] [PubMed] [Google Scholar]
- Lowry CA, Hale MW, Evans AK, Heerkens J, Staub DR, Gasser PJ, Shekhar A. Serotonergic systems, anxiety, and affective disorder: focus on the dorsomedial part of the dorsal raphe nucleus. Ann N Y Acad Sci. 2008;1148:86–94. doi: 10.1196/annals.1410.004. [DOI] [PubMed] [Google Scholar]
- Margolis EB, Mitchell JM, Ishikawa J, Hjelmstad GO, Fields HL. Midbrain dopamine neurons: projection target determines action potential duration and dopamine D2 receptor inhibition. J Neurosci. 2008;28:8908–8913. doi: 10.1523/JNEUROSCI.1526-08.2008. [DOI] [PMC free article] [PubMed] [Google Scholar]
- Marinelli S, Schnell SA, Hack SP, Christie MJ, Wessendorf MW, Vaughan CW. Serotonergic and nonserotonergic dorsal raphe neurons are pharmacologically and electrophysiologically heterogeneous. J Neurophysiol. 2004;92:3532–3537. doi: 10.1152/jn.00437.2004. [DOI] [PubMed] [Google Scholar]
- Michelsen KA, Schmitz C, Steinbusch HW. The dorsal raphe nucleus-from silver stainings to a role in depression. Brain Res Rev. 2007;55:329–342. doi: 10.1016/j.brainresrev.2007.01.002. [DOI] [PubMed] [Google Scholar]
- Mirenowicz J, Schultz W. Preferential activation of midbrain dopamine neurons by appetitive rather than aversive stimuli. Nature. 1996;379:449–451. doi: 10.1038/379449a0. [DOI] [PubMed] [Google Scholar]
- Miyazaki K, Miyazaki KW, Doya K. Activation of dorsal raphe serotonin neurons underlies waiting for delayed rewards. J Neurosci. 2011a;31:469–479. doi: 10.1523/JNEUROSCI.3714-10.2011. [DOI] [PMC free article] [PubMed] [Google Scholar]
- Miyazaki KW, Miyazaki K, Doya K. Activation of the central serotonergic system in response to delayed but not omitted rewards. Eur J Neurosci. 2011b;33:153–160. doi: 10.1111/j.1460-9568.2010.07480.x. [DOI] [PMC free article] [PubMed] [Google Scholar]
- Miyazaki KW, Miyazaki K, Doya K. Activation of dorsal raphe serotonin neurons is necessary for waiting for delayed rewards. J Neurosci. 2012;32:10451–10457. doi: 10.1523/JNEUROSCI.0915-12.2012. [DOI] [PMC free article] [PubMed] [Google Scholar]
- Montagne-Clavel J, Oliveras JL, Martin G. Single-unit recordings at dorsal raphe nucleus in the awake-anesthetized rat: spontaneous activity and responses to cutaneous innocuous and noxious stimulations. Pain. 1995;60:303–310. doi: 10.1016/0304-3959(94)00129-3. [DOI] [PubMed] [Google Scholar]
- Monti JM. The structure of the dorsal raphe nucleus and its relevance to the regulation of sleep and wakefulness. Sleep Med Rev. 2010;14:307–317. doi: 10.1016/j.smrv.2009.11.004. [DOI] [PubMed] [Google Scholar]
- Motulsky HJ, Brown RE. Detecting outliers when fitting data with nonlinear regression—a new method based on robust nonlinear regression and the false discovery rate. BMC Bioinformatics. 2006;7:123. doi: 10.1186/1471-2105-7-123. [DOI] [PMC free article] [PubMed] [Google Scholar]
- Nakahama H, Shima K, Yamamoto M, Aya K. Regularity of the spontaneous discharge of neurons in the nucleus raphe dorsalis of the cat. Neurosci Lett. 1981;23:161–165. doi: 10.1016/0304-3940(81)90034-3. [DOI] [PubMed] [Google Scholar]
- Nakamura K, Matsumoto M, Hikosaka O. Reward-dependent modulation of neuronal activity in the primate dorsal raphe nucleus. J Neurosci. 2008;28:5331–5343. doi: 10.1523/JNEUROSCI.0021-08.2008. [DOI] [PMC free article] [PubMed] [Google Scholar]
- Nedergaard S, Bolam JP, Greenfield SA. Facilitation of a dendritic calcium conductance by 5-hydroxytryptamine in the substantia nigra. Nature. 1988;333:174–177. doi: 10.1038/333174a0. [DOI] [PubMed] [Google Scholar]
- Pan WX, Schmidt R, Wickens JR, Hyland BI. Dopamine cells respond to predicted events during classical conditioning: evidence for eligibility traces in the reward-learning network. J Neurosci. 2005;25:6235–6242. doi: 10.1523/JNEUROSCI.1478-05.2005. [DOI] [PMC free article] [PubMed] [Google Scholar]
- Pan WX, Schmidt R, Wickens JR, Hyland BI. Tripartite mechanism of extinction suggested by dopamine neuron activity and temporal difference model. J Neurosci. 2008;28:9619–9631. doi: 10.1523/JNEUROSCI.0255-08.2008. [DOI] [PMC free article] [PubMed] [Google Scholar]
- Paxinos G, Watson C. The rat brain in stereotaxic coordinates. Ed 3. London: Academic; 1997. [DOI] [PubMed] [Google Scholar]
- Quirk GJ, Repa C, LeDoux JE. Fear conditioning enhances short-latency auditory responses of lateral amygdala neurons: parallel recordings in the freely behaving rat. Neuron. 1995;15:1029–1039. doi: 10.1016/0896-6273(95)90092-6. [DOI] [PubMed] [Google Scholar]
- Ranade SP, Mainen ZF. Transient firing of dorsal raphe neurons encodes diverse and specific sensory, motor, and reward events. J Neurophysiol. 2009;102:3026–3037. doi: 10.1152/jn.00507.2009. [DOI] [PubMed] [Google Scholar]
- Rasmussen K, Strecker RE, Jacobs BL. Single unit response of noradrenergic, serotonergic and dopaminergic neurons in freely moving cats to simple sensory stimuli. Brain Res. 1986;369:336–340. doi: 10.1016/0006-8993(86)90546-9. [DOI] [PubMed] [Google Scholar]
- Rogawski MA, Aghajanian GK. Norepinephrine and serotonin: opposite effects on the activity of lateral geniculate neurons evoked by optic pathway stimulation. Exp Neurol. 1980;69:678–694. doi: 10.1016/0014-4886(80)90060-6. [DOI] [PubMed] [Google Scholar]
- Sakai K, Crochet S. Differentiation of presumed serotonergic dorsal raphe neurons in relation to behavior and wake-sleep states. Neuroscience. 2001;104:1141–1155. doi: 10.1016/s0306-4522(01)00103-8. [DOI] [PubMed] [Google Scholar]
- Schmidt BJ, Jordan LM. The role of serotonin in reflex modulation and locomotor rhythm production in the mammalian spinal cord. Brain Res Bull. 2000;53:689–710. doi: 10.1016/s0361-9230(00)00402-0. [DOI] [PubMed] [Google Scholar]
- Schultz W, Dickinson A. Neuronal coding of prediction errors. Annu Rev Neurosci. 2000;23:473–500. doi: 10.1146/annurev.neuro.23.1.473. [DOI] [PubMed] [Google Scholar]
- Schultz W, Dayan P, Montague PR. A neural substrate of prediction and reward. Science. 1997;275:1593–1599. doi: 10.1126/science.275.5306.1593. [DOI] [PubMed] [Google Scholar]
- Schweimer JV, Ungless MA. Phasic responses in dorsal raphe serotonin neurons to noxious stimuli. Neuroscience. 2010;171:1209–1215. doi: 10.1016/j.neuroscience.2010.09.058. [DOI] [PubMed] [Google Scholar]
- Soubrie P. Reconciling the role of central serotonin neurons in human and animal behavior. Behav Brain Sci. 1986;9:319–335. [Google Scholar]
- Sprouse JS, Aghajanian GK. Electrophysiological responses of serotoninergic dorsal raphe neurons to 5-HT1A and 5-HT1B agonists. Synapse. 1987;1:3–9. doi: 10.1002/syn.890010103. [DOI] [PubMed] [Google Scholar]
- Stratford TR, Wirtshafter D. Ascending dopaminergic projections from the dorsal raphe nucleus in the rat. Brain Res. 1990;511:173–176. doi: 10.1016/0006-8993(90)90239-8. [DOI] [PubMed] [Google Scholar]
- Tobler PN, Dickinson A, Schultz W. Coding of predicted reward omission by dopamine neurons in a conditioned inhibition paradigm. J Neurosci. 2003;23:10402–10410. doi: 10.1523/JNEUROSCI.23-32-10402.2003. [DOI] [PMC free article] [PubMed] [Google Scholar]
- Vandermaelen CP, Aghajanian GK. Electrophysiological and pharmacological characterization of serotonergic dorsal raphe neurons recorded extracellularly and intracellularly in rat brain slices. Brain Res. 1983;289:109–119. doi: 10.1016/0006-8993(83)90011-2. [DOI] [PubMed] [Google Scholar]
- Waelti P, Dickinson A, Schultz W. Dopamine responses comply with basic assumptions of formal learning theory. Nature. 2001;412:43–48. doi: 10.1038/35083500. [DOI] [PubMed] [Google Scholar]
- Watabe-Uchida M, Zhu L, Ogawa SK, Vamanrao A, Uchida N. Whole-brain mapping of direct inputs to midbrain dopamine neurons. Neuron. 2012;74:858–873. doi: 10.1016/j.neuron.2012.03.017. [DOI] [PubMed] [Google Scholar]
- Waterhouse BD, Moises HC, Woodward DJ. Interaction of serotonin with somatosensory cortical neuronal responses to afferent synaptic inputs and putative neurotransmitters. Brain Res Bull. 1986;17:507–518. doi: 10.1016/0361-9230(86)90218-2. [DOI] [PubMed] [Google Scholar]
- Waterhouse BD, Azizi SA, Burne RA, Woodward DJ. Modulation of rat cortical area 17 neuronal responses to moving visual stimuli during norepinephrine and serotonin microiontophoresis. Brain Res. 1990;514:276–292. doi: 10.1016/0006-8993(90)91422-d. [DOI] [PubMed] [Google Scholar]
- Waterhouse BD, Devilbiss D, Seiple S, Markowitz R. Sensorimotor-related discharge of simultaneously recorded, single neurons in the dorsal raphe nucleus of the awake, unrestrained rat. Brain Res. 2004;1000:183–191. doi: 10.1016/j.brainres.2003.11.030. [DOI] [PubMed] [Google Scholar]
- Wilson CJ, Groves PM. Spontaneous firing patterns of identified spiny neurons in the rat neostriatum. Brain Res. 1981;220:67–80. doi: 10.1016/0006-8993(81)90211-0. [DOI] [PubMed] [Google Scholar]
- Winstanley CA, Theobald DE, Dalley JW, Cardinal RN, Robbins TW. Double dissociation between serotonergic and dopaminergic modulation of medial prefrontal and orbitofrontal cortex during a test of impulsive choice. Cereb Cortex. 2006;16:106–114. doi: 10.1093/cercor/bhi088. [DOI] [PubMed] [Google Scholar]
- Witten IB, Steinberg EE, Lee SY, Davidson TJ, Zalocusky KA, Brodsky M, Yizhar O, Cho SL, Gong S, Ramakrishnan C, Stuber GD, Tye KM, Janak PH, Deisseroth K. Recombinase-driver rat lines: tools, techniques, and optogenetic application to dopamine-mediated reinforcement. Neuron. 2011;72:721–733. doi: 10.1016/j.neuron.2011.10.028. [DOI] [PMC free article] [PubMed] [Google Scholar]