Abstract
Associative stimulation causes enduring changes in the nervous system based on the Hebbian concept of spike-timing-dependent plasticity. The present study aimed to characterize the immediate and long-term electrophysiological effects of associative stimulation at the level of spinal cord and to test how trans-spinal direct current stimulation (tsDC) modulates associative plasticity. The effect of combined associative stimulation and tsDC on locomotor recovery was tested in a unilateral model of spinal cord injury (SCI). Two associative protocols were tested: (1) spino-sciatic associative (SSA) protocol, in which the first stimulus originated from the sciatic nerve and the second from the spinal cord; and (2) cortico-sciatic associative (CSA) protocol, in which the first stimulus originated from the sciatic nerve and the second from the motor cortex. In addition, those two protocols were repeated in combination with cathodal tsDC application. SSA and CSA stimulation produced immediate enhancement of spinal and cortical outputs, respectively, depending on the duration of the interstimulus interval. Repetitive SSA or CSA stimulation produced long-term potentiation of spinal and cortical outputs, respectively. Applying tsDC during SSA or CSA stimulation markedly enhanced their immediate and long-term effects. In behaving mice with unilateral SCI, four consecutive 20 min sessions of CSA + tsDC markedly reduced error rate in a horizontal ladder-walking test. Thus, this form of artificially enhanced associative connection can be translated into a form of motor relearning that does not depend on practice or experience.
Introduction
Pairing stimulation of presynaptic and postsynaptic cells induces associative plasticity via synaptic mechanisms (Levy and Steward, 1983). Associative stimulation can modify synaptic efficacy in a bidirectional manner depending on the timing of the presynaptic input relative to the postsynaptic input (Li et al., 2004): enhancement occurs when the presynaptic input precedes the postsynaptic input, whereas depression occurs when the order of inputs is reversed. This form of plasticity is called spike-timing-dependent plasticity (Song et al., 2000) and has been studied intensively by monitoring single-cell in vitro preparations (for review, see Dan and Poo, 2004) and in vivo models (Jacob et al., 2007; An et al., 2012). Paired associative stimulation (PAS) is a technique that synchronizes brain stimulation with peripheral nerve input, which has been shown to induce enduring plasticity in humans (Stefan et al., 2000). Although spike-timing-dependent plasticity and PAS-induced plasticity differ procedurally, both are based on the Hebbian principle of associative plasticity (Hebb, 1949), and similar mechanisms probably mediate their induction. In addition to PAS, other stimulation protocols can induce enduring changes in neuronal excitability, such as direct current (DC) stimulation, which polarizes the neuronal tissue. There are two known applications of DC: transcranial DC stimulation (Priori et al., 1998; Nitsche and Paulus, 2000; Fregni et al., 2005) and trans-spinal DC stimulation (tsDC) (Cogiamanian et al., 2008; Aguilar et al., 2011; Ahmed, 2011; Cogiamanian et al., 2011; Ahmed and Wieraszko, 2012; Lamy et al., 2012). Simultaneous cathodal transcranial DC stimulation and PAS have been shown to enhance motor cortex excitability in humans (Nitsche et al., 2007). However, the effect of simultaneous cathodal tsDC and PAS is not known.
The spinal cord has remarkable potential for neuroplasticity to be induced by many interventions (Rossignol et al., 2007), especially activity-dependent interventions that improve function after spinal cord injury (SCI) (Carmel et al., 2010; Ahmed and Wieraszko, 2012; van den Brand et al., 2012). PAS induces neuroplastic changes at the level of the spinal cord (Meunier et al., 2007; Taylor and Martin, 2009), suggesting that changes in spinal cord excitability mediate PAS-induced plasticity. However, the effect of pairing spinal and peripheral nerve (e.g., sciatic) stimulation on spinal excitability is unknown. In the current study, I hypothesized that pairing sciatic nerve stimulation with either spinal (spino-sciatic) or cortical (cortico-sciatic) stimulation in a mouse model would enhance spinal or cortical outputs, respectively. I reported previously that cathodal tsDC enhances spinal excitability (Ahmed, 2011; Ahmed and Wieraszko, 2012). Therefore, I hypothesized that tsDC would further enhance PAS-induced plasticity. I also hypothesized that combined cathodal tsDC and cortico-PAS would improve skilled locomotor recovery after unilateral SCI.
The results indicated the following: (1) associative stimulation at particular interstimulus intervals (ISIs) enhances evoked potentials; (2) associative plasticity can be induced at the spinal cord; (3) cathodal tsDC modulates associative plasticity; and (4) combined cortical and peripheral associative stimulation, accompanied by cathodal tsDC, improves skilled locomotor recovery after unilateral SCI.
Materials and Methods
Animals
Adult male CD-1 mice (n = 116; weight, 35–40 g) were used for this study. Experiments were performed in accordance with the National Institutes of Health Guidelines for the Care and Use of Laboratory Animals. Protocols were approved by the Institutional Animal Care and Use Committee of the College of Staten Island. Animals were housed under a 12 h light/dark cycle with access to food and water ad libitum.
Acute electrophysiological experiments
Surgical procedures
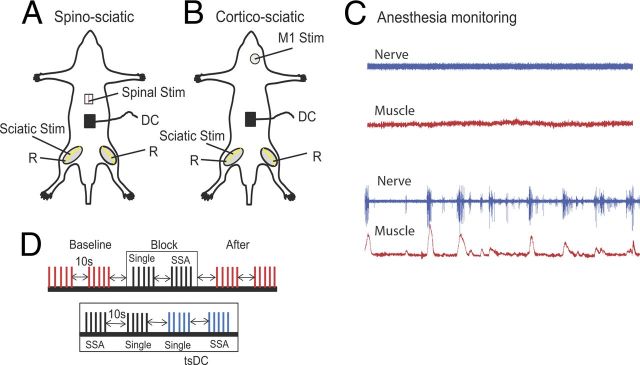
The surgical procedure was performed as described previously (Ahmed, 2011). Figure 1, A and B, illustrates experimental arrangements. Briefly, animals were anesthetized using ketamine/xylazine (90/10 mg/kg, i.p.). Throughout experiments, anesthesia was monitored online by observing muscle and nerve activity and was kept at a steady level as shown in Figure 1C (top). The aim was to maintain a moderate level of anesthesia throughout all experiments. To accomplish this, stimulation protocols were started 30 min after the first injection of anesthetic. In most experiments, a second injection was not needed; however, if needed, a small dose (5% of the first injection) was given subcutaneously to produce gradual changes in the level of anesthesia. Subcutaneous anesthetic boosters did not significantly affect the evoked potentials in these studies.
Figure 1.
Schematic diagram of the acute experimental setup illustrating two stimulation arrangements. A, SSA stimulation setup, in which spinal cord level L1 was stimulated at the dorsal column (bipolar needle electrode). B, CSA stimulation setup, in which the M1 area of the crural muscles was stimulated. In both arrangements, the sciatic nerve was stimulated on one side, usually the left. Evoked potentials were recorded from both sciatic nerves (R, recording). DC was applied over the lumbar spine. C, Level of anesthesia was monitored by observing the spontaneous activity of nerve (blue) and muscle (red). The top shows the desired level at which all recording and stimulation is performed; the bottom shows a level when anesthesia was starting to wear off. D, Schematic illustration showing part of the ISI stimulation protocol. The protocol consisted of baseline (trains of 5 shocks at 0.5 Hz, repeated every 10 s), a block of SSA-only (train of 5 single shocks at 0.5 Hz, 10 s break, train of 5 SSA at 0.5 Hz), and posttest stimulation identical to baseline. Bottom shows a block of SSA + tsDC, which consisted of a train of five single shocks with no tsDC, a train of five single shocks during tsDC, SSA with no tsDC, and SSA during tsDC. This paradigm was repeated to test all ISIs and to test CSA.
Animals were placed in a mouse stereotaxic apparatus, which was placed in a custom-made clamping spinal column system. The bone at the base of the tail was fixed to the base of the system with surgical pins to immobilize the head, vertebral column, and base of the tail. Incisions were made in the skin covering the head, vertebral column (from midthoracic to sacral region), and both hindlimbs, and the skin was moved to the side and held with clips. In experiments testing spino-sciatic associative (SSA) protocol, a laminectomy was performed at vertebral column level T9–T10 to expose spinal level T13 to L1 (Fig. 1A). In experiments testing cortico-sciatic associative (CSA) protocol, no laminectomy was made. A craniotomy was made over the right primary motor cortex (M1) without breaching the dura (Fig. 1B). To monitor muscle activity during anesthesia, muscle isometric tension was recorded from the triceps muscles (TS). TS were carefully separated from the surrounding tissue. The tendon of each of TS was threaded with a hook-shaped 0-3 surgical silk, which was then connected to force transducers. Tissue surrounding the distal part of the sciatic nerve was removed. Both the sciatic nerve and TS muscle were soaked in warm mineral oil.
Electrodes
A stainless steel electrode (thickness, 50 μm; width, 5 mm; length, 7 mm) was used to deliver tsDC stimulation. This active electrode was placed over the vertebral column covering the area between vertebral level T13 and L4, corresponding to spinal level L3–L6, which contains motoneurons within sciatic nerve axons that innervate the crural muscle groups (Köbbert and Thanos, 2000; Watson et al., 2009). The reference electrode was an alligator clip attached to a flap of abdominal skin. Concentric bipolar stimulating electrodes (tip, 250 μm) were used to stimulate the sciatic nerve at its main trunk as it exits from the pelvis and the spinal cord at the junction between spinal level T13 and L1. The bipolar electrode was situated on the dorsal median sulcus of the spinal cord, a position that evokes bilateral responses with a mean latency of 6.96 ± 0.19 ms. The cortex was stimulated with a monopolar electrode (tip, 150 μm), and an active electrode was situated on M1 (1 mm posterior to bregma and 1 mm lateral to midline). In previous experiments, stimulation at these coordinates had the lowest threshold to evoke a response of crural muscles. The reference electrode was an alligator clip attached to a flap of scalp skin on the frontal aspect of the skull. Extracellular recordings were made from the TS branch of the sciatic nerve with pure iridium microelectrodes (shaft diameter, 180 μm; tip, 1–2 μm; resistance, 5.0 MΩ; World Precision Instruments).
Stimulation
A Grass S88X stimulator (Grass Technologies) in DC mode was used to generate tsDC, which was delivered through a stimulus-isolated unit (Grass Technologies). The present experiments used cathodal tsDC with an intensity of −0.8 mA. Based on the area of the tsDC electrode, the current density at the electrode surface was 2.29 A/m2.
Sciatic nerve stimulation was performed using a Digitimer DS7AH constant-current stimulator (Digitimer). Spinal and cortical stimulation was performed using a PowerLab stimulator (ADInstruments). The stimulators were controlled by LabChart software (ADInstruments), which was used to adjust stimulus intensity and ISI.
Stimulation protocols
SSA protocol (experiment 1).
Experimental protocols started ∼5 min after surgery. The SSA stimulation protocol was performed by pairing two stimuli, delivered to the sciatic nerve and spinal cord. The spinal cord stimulus was delayed relative to sciatic nerve stimulus by 0, 2, 4, 6, 8, 10, 12, 16, 24, 48, 84, 120, or 200 ms. At the beginning of each experiment, the spinal stimulus strength that produced maximal muscle contraction was determined; spinal stimulation was then kept at ∼50% of maximal response during the SSA protocol. Sciatic nerve stimulus was also adjusted to give 50% of maximal muscle and nerve responses. This was kept throughout the SSA protocols. Before the SSA protocol, baseline single-pulse-induced compound action potentials (CAP) were sampled. Three trains of five single shocks at fixed stimulus strength were delivered to the spinal cord at 0.5 Hz, repeated every 10 s. Responses to this stimulation were averaged and used as a baseline for additional analysis.
SSA testing was divided into blocks containing a train of five single shocks and a train of five SSA shocks (Fig. 1D), each at 0.5 Hz, performed in a pseudorandom order every 10 s. The SSA protocol consisted of 13 blocks (one for each ISI). At the end of the protocol, single-pulse testing similar to baseline testing was performed. Exploratory experiments showed that this protocol design did not cause response facilitation or depression.
Next, in a different group of animals (n = 6), tsDC (−0.8 mA) was applied during a similar SSA protocol (SSA + tsDC). The only difference was that blocks included four trains of five shocks at 0.5 Hz: (1) single shocks without tsDC; (2) single shocks with tsDC; (3) SSA without tsDC; and (4) SSA with tsDC (Fig. 1D). Trains were presented in a pseudorandom order every 10 s. Here single shocks were delivered to the spinal cord. Data from SSA-only in these six animals and the previous 10 described above were combined for analysis.
Protocols inducing long-term enhancement of spinally evoked potentials (experiment 2).
To evaluate persistent aftereffects of SSA and SSA + tsDC, pretest recordings to establish a baseline consisted of trains of five single shocks delivered at 0.5 Hz, repeated every 30 s for 3 min. CSA (n = 7) and SSA (n = 10) were performed by pairing a spinal stimulus with a sciatic stimulus with an ISI of 12 ms. Given the duration of cortical-evoked (cCAP) (∼20 ms), sciatic-nerve-evoked (nCAP) (∼15 ms), and spinal-evoked (sCAP) (∼9 ms) potentials, a 12 ms ISI was selected as having the best potential to maximize synchronization, allowing comparison of the induction of long-lasting effects by CSA and SSA. A total of 90 associative stimuli were applied at 1 Hz. In SSA + tsDC (n = 5) protocol, tsDC was turned on (ramped up, 10 s) at the same time SSA began and turned off (ramped down, 10 s) when SSA ended. This was followed by 80 min of posttest recording, which demonstrated that stimuli pattern and intensity were identical during posttest and baseline.
CSA protocol (experiment 3).
The CSA stimulation protocol was performed by pairing two stimuli, delivered to M1 and the sciatic nerve. The same stimulation design that was used during the SSA protocol was also used to test CSA (n = 8) and CSA + tsDC (n = 6) but in a different group of animals.
Protocols inducing long-term enhancement of cCAP (experiment 4).
To evaluate persisted aftereffects of CSA, a similar procedure as the one used to induce long-term enhancement of sCAP was used (see above). CSA (n = 7) was performed by pairing a cortical stimulus with a sciatic stimulus with an ISI of 12 ms.
Control experiments for repetitive protocol.
Basic stimulation protocols were tested using the experimental setup described above. Repetitive single-pulse stimulation alone was tested by applying 90 pulses at 1 Hz to M1 (n = 3), spinal cord (n = 3), or nerve (n = 4). The effect of short exposure to tsDC only (−0.8 mA, 1.3 min) was tested on sCAP (n = 3) and cCAP (n = 4). The effect of combining tsDC with repetitive cortical (n = 5) and spinal (n = 5) single-pulse stimulation was tested by applying single-pulse stimulation (90 pulses, 1 Hz) during tsDC (−0.8 mA).
Testing the specificity of tsDC (experiment 5).
Using a similar setup as described above, a different group of animals (n = 5) had the DC electrode placed at two locations: over the abdominal muscles 1.5 cm lateral to the lumbar spine ipsilateral to the stimulated nerve and over the spinal column. Five single cortical stimuli were delivered without DC, during tsDC, and during abdominal DC (Abd-DC). In addition, the CSA protocol at 12, 24, and 48 ms ISI was delivered without DC, during tsDC, and during Abd-DC.
Measuring latencies of spinal potentials (experiment 6).
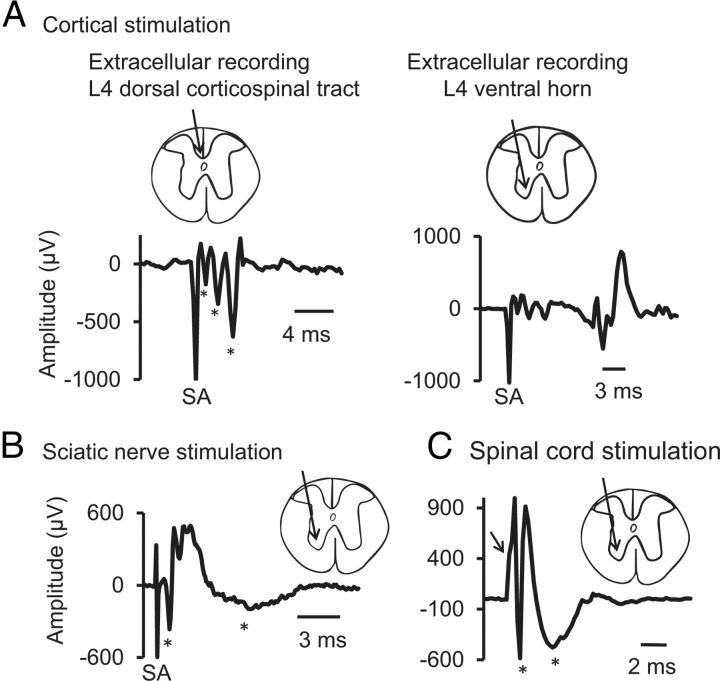
To measure the latency of spinal potentials, one metal microelectrode (shaft diameter, 180 μm; tip, 1–2 μm; World Precision Instruments) was inserted into the ventral horn at the L4 level, and another electrode was inserted into the dorsal column of L4 (see Fig. 11). Stimulating electrodes were situated as described above: the cortical stimulating electrode was on the motor cortex area (1 mm posterior to bregma, 1 mm lateral to midline), the spinal stimulating electrode was on the dorsal column at L1, and the sciatic nerve stimulating electrode was situated on the sciatic nerve as it exits the pelvis.
Figure 11.
Extracellular responses recorded from L4 level. Insets show the recording sites. A, M1 stimulation. At L4 spinal level, extracellular responses were recorded from dorsal corticospinal tract (dCST, left) and from ventral horn (right). Three volleys were recorded from dCST (see asterisks) with latencies of 1.25, 2.25, and 3.00 ms. Responses recorded from the ventral horn showed dCST volleys with a delayed response (11 ms). B, Sciatic nerve stimulation. At the L4 spinal level, extracellular recording showed two main responses (marked with asterisks), a fast first response with 0.8 ms latency and a delayed second response with 2.6 ms latency. C, Spinal cord stimulation. The spinal cord was stimulated at the level of L1, and recording was obtained from the L4 ventral horn, which showed an onset latency of 1 ms. Arrow marks the deflection caused by stimulus artifact. Asterisks mark the two spinal responses.
Latency was measured as the time from the onset of stimulus artifact to the onset of the first deflection of the potential. Potential duration was measured as the period starting from the onset of the stimulus artifact to the end of the potential, at which the trace returns to baseline.
Nature of spinal responses and effect of glutamate blockers on SSA-induced changes (experiment 7).
To differentiate between synaptic and fiber potentials recorded from the spinal cord, one of two glutamate antagonists was injected at the recording site: kynurenic acid (glutamatergic antagonist, 2.5 mm) (Ganong et al., 1983; Elmslie and Yoshikami, 1985; Schneider and Perl, 1988) or 6-cyano-7-nitroquinoxaline-2,3-dione (CNQX; AMPA/kainate receptor antagonist, 200 μm) (Hunanyan et al., 2012). The effect of each inhibitor was tested in different group of animals (n = 3 per group). For each of the inhibitors, two intraspinal injections (5 μl/each) over 5 min were made at L4 using a Hamilton syringe (33 gauge needle). Recording from the spinal cord was performed as described above in the experiment to measure latencies. The effect of SSA (ISIs of 0, 4, 8, 12, and 16 ms) on spinal responses was tested after the injection of kynurenic acid. Recordings during this experiment were conducted at spinal cord level L4, because kynurenic acid blocked neurotransmission below this level.
Acute experiments: data analyses
Results from baseline, tests, and posttest were calculated as the average of five responses evoked at 0.5 Hz. Comparing averages of single-pulse-induced CAP at baseline, during, and after the ISI testing procedure showed no significant difference. Therefore, a composite average of single-pulse-induced CAP during baseline was used to test changes during the perspective intervention protocol. To standardize changes across animals, all sCAP and cCAP were expressed as a percentage change of their respective baseline single-pulse-induced CAP. For conditions of SSA + tsDC and CSA + tsDC, the sCAP and cCAP were expressed in two ways: as a percentage of their single-pulse-induced CAP without tsDC and during tsDC. Similarly, posttest recordings after the repetitive intervention protocol were expressed as a percentage of their respective baseline recordings. Statistical analyses were performed using SigmaPlot (SPSS). The differences between groups over time were assessed using repeated-measures ANOVA with a Holm–Sidak method post hoc correction for testing differences between results at different time points.
Chronic stimulation experiments (experiment 8)
Overview
One week before surgery, mice were trained to walk over a horizontal ladder until a baseline error rate was established (see below). Hemisection injury at spinal cord level T13-L1 was performed on the left side. Three days later, the stimulation delivery system was implanted (Fig. 1A), and mice were randomly assigned to either the control or stimulated group. After implantation, behavioral evaluations were performed at days 6, 12, 15, 17, 24, and 31. The combined stimulation protocol was applied for 4 consecutive days (20 min/session) starting at day 13 after hemisection injury.
Hemi-transection SCI
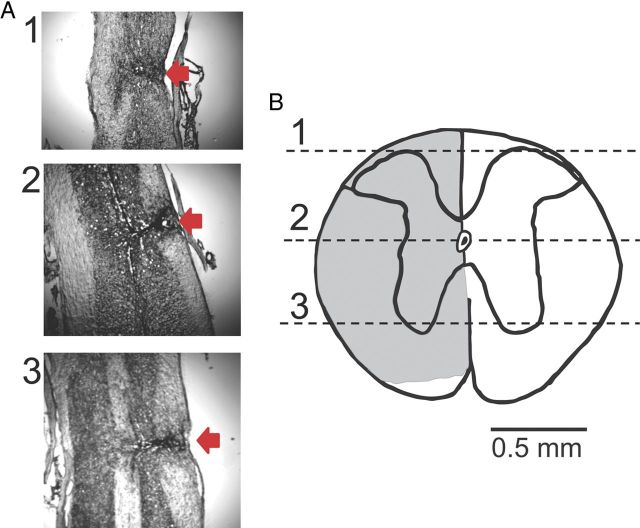
Animals were anesthetized under ketamine/xylazine (100/10 mg/kg, i.p.), and a laminectomy was performed to expose the junction of the T13 and L1 spinal cord segments. A one-side transverse cut was made with an angled microsurgical probe (Fine Science Tools) to produce hemi-transection (Fig. 2). The wound was sutured closed, and animals were allowed to recover over a heating pad at 37°C.
Figure 2.
Lesion verification. A, Nissl staining of a longitudinal section of the dorsal aspect of the spinal cord at the level of the spinal canal and at ventral aspects. Red arrows indicate the injury site. B, A transverse section of the spinal cord constructed from the longitudinal slices. Numbers correspond to the photographs shown in A. Note that the lower part of the spinal cord on the injury side, which mainly contains spinothalamic tracts, was not damaged by the injury. This injury was similar in all animals.
Electrode implantation and stimulation
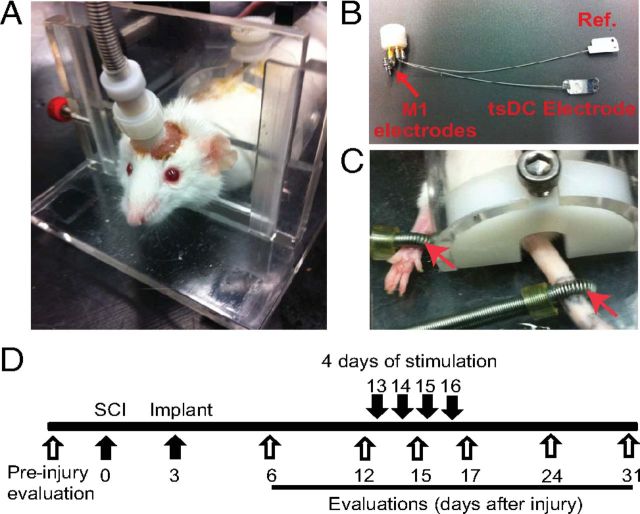
Mice were anesthetized and placed in a stereotactic frame. Two incisions were made, one at the skull and another on the thoracolumbar skin. The skin between the cranium and lower trunk was separated with forceps to pass the spinal electrodes underneath the skin from cranium to midspine. To improve bonding between dental acrylic and bone, the cranium surface was cleaned with 30% H2O2. Cranial electrodes were situated over the hindpaw representation within the left and right motor cortices from 0.5 to −1.5 mm from bregma and 0.5 to 1.5 mm from the midline (Franklin and Paxinos, 2007; Tennant et al., 2010). Cranial electrodes were self-tapping stainless steel screws (shaft diameter, 0.85 mm; length, 4 mm) (Fine Science Tools). Those screws were attached to female miniature pin connectors (A-M Systems) by 22 gauge wires (Fig. 3A). The two electrodes were 2.5 mm apart. Relative to bregma, the anodal electrode was 0.5 mm posterior and 1 mm lateral, and the cathodal electrode was 3 mm posterior and 0.5 mm lateral. Screws were implanted on the right side of the cranium, which covers the motor cortex contralateral to the hemisection injury of the spinal cord. Screws were attached only to the skull bone and did not breach the dura, as confirmed by lack of fluid leaking from the insertion site and by postmortem inspection. This electrode montage was chosen because it resembles montages used to stimulate the motor cortex in humans (Burke et al., 1993; Di Lazzaro et al., 2001; Brocke et al., 2005). A third screw was fastened into the frontal bone to stabilize the implant, but it was not attached to the pedestal. Dental acrylic was used to secure the electrodes and the pedestal to the skull (Fig. 1C). A stainless steel spinal electrode (thickness, 50 μm; width, 5 mm; length, 10 mm) was placed on the spinal column covering the injured area and attached to muscle tissue by suture thread through two holes made in the electrode. The reference electrode (identical to the spinal electrode) was placed on the side of the abdomen subcutaneously and sutured to the skin. Stranded stainless steel wires (0.25 mm; resistance, 12.5 Ω; insulation material, nylon) were used to attach the female pin connector to the spinal and reference electrodes at the pedestal.
Figure 3.
Chronic experiment setup and protocol. All mice were subjected to left unilateral SCI (hemisection). A, The mouse was placed in a restraining box, and the pedestal was attached to a cable that is connected to stimulators. B, Spinal electrodes were connected to the pedestal by multiple stranded wires (nylon insulated). The tsDC electrode was placed over the spinal column, and the reference electrode (Ref.) was placed subcutaneously on the lateral side of the abdomen. One side of these electrodes was painted with electrically insulating material. Cortical (M1) electrodes were made of two self-tapping bone screws (shaft diameter, 0.85 mm; length, 4 mm; 2.5 mm apart) that were inserted into the skull bone covering the right hindlimb cortical areas. Relative to bregma, the anodal electrode was placed −0.5 mm posterior and 1 mm lateral (on the right side), and the cathodal electrode was approximately −3 mm posterior and 0.5 mm lateral. Screws were not allowed to penetrate through the skull bone. The pedestal and screws were attached to the skull using dental cement. C, Peripheral stimulations were applied using ring electrodes (red arrows) that were fastened around the paw (positive) and base of the tail (reference). D, Experimental time line. Behavioral evaluations were done before SCI. The spinal cord was hemisectioned on day 0, and the stimulation system was implanted on day 3. After implantation, behavioral evaluations were performed on days 6, 12, 15, 17, 24, and 31. Stimulation was applied on days 13, 14, 15, and 16.
Beginning 12 d after implantation, injury + stimulation mice (n = 10) underwent stimulation (20 min/d for 4 consecutive days). Stimulation occurred in a mouse restraining box (Fig. 3A,C) via a connector cable attached to the pedestal mounted on the mouse skull. Steady current was delivered using a DC stimulator (tsDC was ramped up to be steady at −0.8 mA). Cortical stimulation was performed using PowerLab stimulation (ADInstruments), and intensity was adjusted to elicit visible movement of the hindlimbs (typically 200–300 μA; duration, 200 μs). Peripheral stimulation was accomplished using ring electrodes (Fig. 3). Electrodes were brushed with electrode conductive paste, and the anode was fastened to the right (affected) hindpaw and the cathode to the tail (Fig. 3C). The stimulus to the paw was adjusted to elicit visible limb movement (1 Hz). In a treatment session, all three stimulations (cortical, peripheral, and tsDC) were synchronized using a customized stimulation protocol in LabChart software (ADInstruments). Cortical and peripheral stimuli were delivered at 1 Hz and 12 ms ISI. Thus, the cortical stimulus was delayed by 12 ms relative to peripheral stimuli. Before the cortico-peripheral stimulation started, the tsDC stimulation was ramped up to maximum of −0.8 mA. All stimulations were continued for 20 min. After stimulation, animals were returned to their cages. The injury-only group (n = 7) received the same experimental manipulations except that no stimulation was delivered. The tsDC group (n = 5) received tsDC (−0.8 mA) without peripheral or cortical stimulation. The cortico-peripheral group (n = 4) received cortical and peripheral stimulation but no tsDC.
Behavioral testing
One week before SCI, animals were acclimated to the test environment and procedures for 30 min/d for 6 d. Animals were behaviorally tested 1 d before injury (baseline) and then at days 6, 12, 15, 17, 24, and 31 after SCI. When testing and stimulation were performed on the same day (day 15), testing proceeded stimulation.
Horizontal ladder-walking test
The horizontal ladder-walking test has been shown to be sensitive to placing impairments of hindlimbs caused by lesions in the corticospinal system (Metz and Whishaw, 2002; Carmel et al., 2010). I used a horizontal ladder that was made from Plexiglas sidings (1 m long, 5 cm wide) with variable rung spacing (adjusted from 1 to 3 cm; 3 mm rung diameter). The procedure was modified from Metz and Whishaw (2002). At the start, a platform was placed at one end of the ladder. To encourage the mice to cross, a bright lamp was placed close to the starting site, and a dark box was placed at the other end of the ladder. A different template of irregular rung spacing was used in every test session to prevent learning, but the same template was used across groups to standardize the difficulty of the test. Mice were required to cross the whole length of the ladder four times. The time of each run was recorded using a stopwatch. Runs were also video recorded and analyzed in slow motion. An error was defined as any miss or slip off the rung. Errors were counted for each hindlimb and were calculated as a percentage of the total number of steps during that trial.
Lesion verification
Vertebral columns containing SCI sites were removed and stored overnight in paraformaldehyde (4%). Spinal cords were then carefully dissected out, and a 1-cm-long segment containing the injury site was glued to the base of a Cryomold. Longitudinal sections (30-μm-thick) were cut with a cryostat, placed sequentially on the glass slides, and stained using Crystal violet. The extent of damage was evaluated using a light microscope (Fig. 2).
Results
Associative stimulation
The latency of sCAP recorded from the sciatic nerves has a median of 7 ms (range, 6.00–7.75 ms), and the latency of cCAP recorded from the sciatic nerves has a median of 26.75 ms (range, 22.25–29.50 ms). Thus, sCAP and cCAP with shorter than minimal latency were rejected from the analysis to control for current spread and ensure that the same site of generation, at either the spinal cord or cortex, was used.
SSA stimulation facilitates ipsilateral spinal output (to the stimulated nerve) (experiment 1)
Effect of ISI
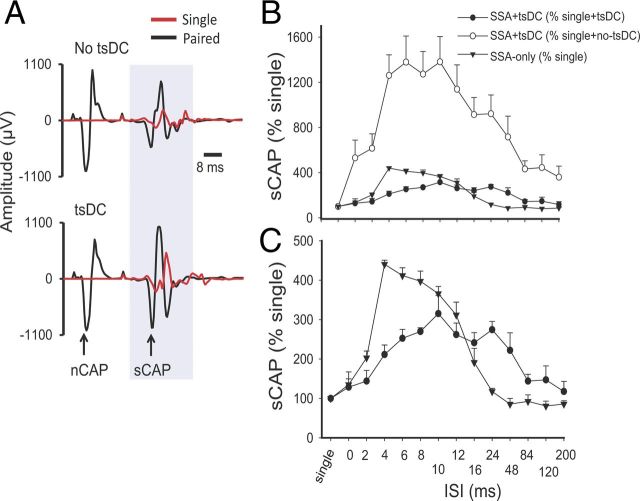
To determine the effects of associating sciatic nerve stimulation with spinal cord stimulation, both sites were stimulated with various ISIs. The spinal stimulus was initiated at delays from 0 to 200 ms relative to sciatic nerve stimulus (see Materials and Methods). To examine changes occurring during the SSA-only condition, sCAP during SSA was expressed as percentage of baseline sCAP and compared across groups. SSA had a significant effect (repeated-measures ANOVA, F = 57.56, p < 0.001; n = 9) with significant increases at ISIs of 2–16 ms (Holm–Sidak method, p < 0.001) (Fig. 4, top and bottom).
Figure 4.
Spinal excitability enhancement by SSA stimulation or SSA + tsDC. A, Top shows examples of sCAP and nCAP. The red trace is an sCAP evoked by single pulse, and the black trace shows two responses, the first in response to nCAP and the second in response to spinal stimulation. No tsDC was applied during this recording. Bottom shows examples of sCAP and nCAP during tsDC (−0.8 mA). Spinal stimulus intensity was the same during single, paired, no-tsDC, and tsDC conditions, and nerve stimulus intensity was the same during no-tsDC and tsDC conditions. B, Summary plot showing percentage change in sCAP during SSA and SSA + tsDC. sCAP evoked during SSA protocol were expressed as percentage of baseline sCAP evoked by single-pulse stimulation. sCAP evoked during SSA + tsDC were expressed both as a percentage of single-pulse during no-tsDC and as a percentage of single-pulse during tsDC. C, The data for SSA + tsDC and SSA-only from B are shown to clearly illustrate the difference between the two groups.
When sCAP during SSA + tsDC was expressed as percentage of single-pulse-induced potentials recorded without tsDC, there was a significant effect (repeated-measures ANOVA, F = 15.39, p < 0.001; n = 6) with significant increases at ISIs of 0–120 ms (Holm–Sidak method, p < 0.001) (Fig. 4B, top). In addition, when sCAP during SSA + tsDC was expressed as percentage of single-pulse-evoked potentials recorded during tsDC (tsDC singles), there was significant effect (repeated-measures ANOVA, F = 5.76, p < 0.001) and significant increases at ISIs of 6–24 ms (Holm–Sidak method, p < 0.005) (Fig. 4B, top and bottom). Baseline sCAP were identical in all conditions (one-way ANOVA, F = 0.74, p > 0.05).
Repetitive SSA-only and repetitive SSA during tsDC induce long-term potentiation of sCAP ipsilateral to stimulated nerve (experiment 2)
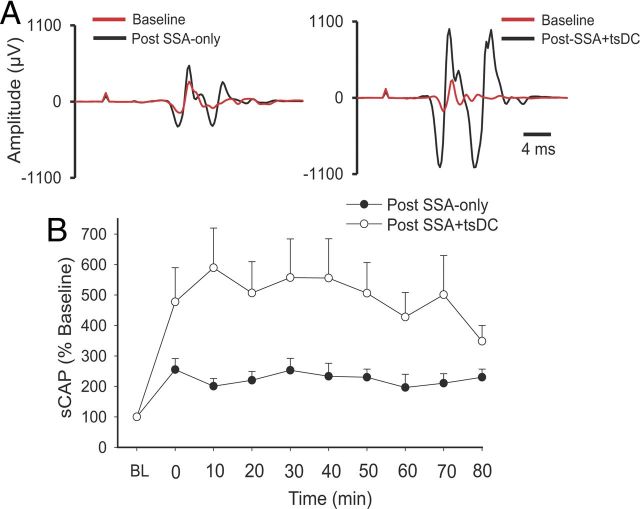
To investigate whether repetitive SSA-only could induce long-term aftereffects, an SSA protocol that applies 90 pulses at 1 Hz with an ISI of 12 ms was used. After establishing a baseline of single-pulse-induced sCAP (2 min), the SSA protocol was initiated. After the SSA protocol ended, single-pulse-induced sCAP with the same parameters as the baseline stimulus was used to test aftereffects for up to 80 min.
There was a significant effect of SSA-only (repeated-measures ANOVA, F = 3.4, p < 0.001; n = 10) and a significant increase in posttest sCAP at all time points compared with baseline (Holm–Sidak method, p < 0.005) (Fig. 5). A repetitive SSA protocol during tsDC of −0.8 mA (SSA + tsDC) also showed a significant effect (repeated-measures ANOVA, F = 2.7, p < 0.01; n = 5) and a significant increase at all time points of posttest sCAP compared to baseline (Holm–Sidak method, p < 0.03). Posttest sCAP after SSA-only (225.1 ± 6.2%) and after SSA + tsDC (493.1 ± 22.2%) were significantly different (t test, p < 0.001). Baseline sCAP showed no significant difference between the two groups (t test, p > 0.05).
Figure 5.
Long-term enhancement of sCAP after SSA-only and SSA + tsDC ipsilateral to the stimulated nerve. SSA (12 ms ISI) was repeated 90 times at 1 Hz. A, Left shows traces of sCAP evoked at baseline (red) and after SSA (black). Right shows traces of sCAP evoked at baseline (red) and after SSA + tsDC (black). B, Summary plot showing the time course of the changes in sCAP expressed as percentage of baseline (BL).
Effects of SSA-only and SSA + tsDC contralateral to stimulated nerve
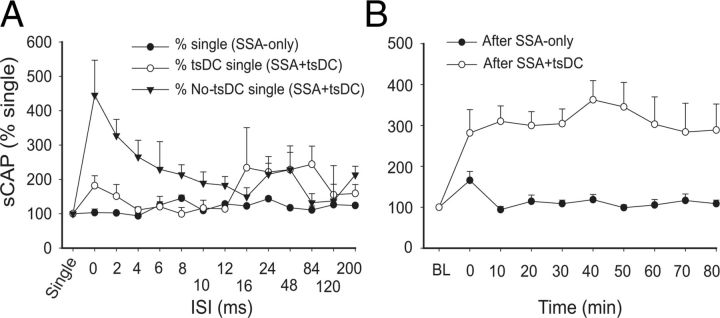
When the dorsal column of the spinal cord is stimulated, it evokes bilateral responses. Data from responses contralateral to the stimulated sciatic nerve were analyzed to examine the effects of SSA-only and SSA + tsDC with various ISIs (Fig. 6A). SSA-only had a significant contralateral effect (repeated-measures ANOVA, F = 4.59, p < 0.001) and a significant increase at ISIs of 8 and 24 ms compared with baseline single-pulse-induced sCAP (Holm–Sidak method, p < 0.001). SSA + tsDC had a significant contralateral effect (repeated-measures ANOVA, F = 4.86, p < 0.001) and a significant increase of sCAP compared with single-pulse-induced sCAP at ISIs of 0, 2, 4, and 6 ms (Holm–Sidak method, p < 0.001). However, sCAP induced during SSA + tsDC were not significantly different from single-pulse-induced sCAP during tsDC (repeated-measures ANOVA, F = 1.63, p = 0.18). Baseline sCAP were identical in all conditions (one-way ANOVA, F = 1.03, p > 0.05).
Figure 6.
Changes in the sCAP contralateral to the stimulated nerve. A, Effects of conditioning stimulus. sCAP evoked during SSA-only was expressed as a percentage of the single-pulse response. sCAP evoked during SSA + tsDC was expressed as a percentage of the single-pulse response during tsDC and no-tsDC conditions. B, Time course of SSA + tsDC mediated long-term enhancement contralateral to the stimulated nerve. Whereas SSA-only-mediated enhancement faded almost immediately after the end of the protocol, SSA + tsDC-mediated enhancement persisted for at least 80 min after stimulation [baseline (BL)].
Next, data from responses contralateral to the stimulated sciatic nerve were compared after repetitive SSA and SSA + tsDC (Fig. 6B). Repetitive SSA induced a significant effect on posttest sCAP (repeated-measures ANOVA, F = 3.06, p < 0.008) and a significant increase immediately after stimulation ended (p < 0.001), which reverted to baseline levels within 10 min (Holm–Sidak method, p > 0.05). Repetitive SSA + tsDC induced a significant difference compared with baseline single-pulse-induced sCAP (repeated-measures ANOVA, F = 4.14, p < 0.001) and a significant increase of posttest sCAP at all time points compared with pretest (Holm–Sidak method, p < 0.001). Baseline sCAP showed no significant difference between the two groups (t test, p > 0.05).
CSA stimulation facilitates cortical output on the ipsilateral side (to the stimulated nerve) (experiment 3)
Effects of ISI
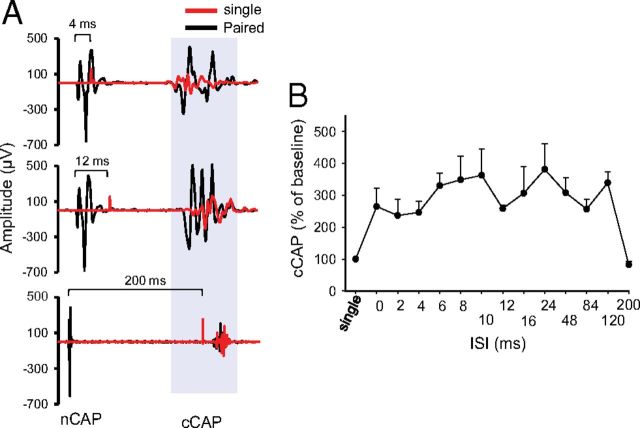
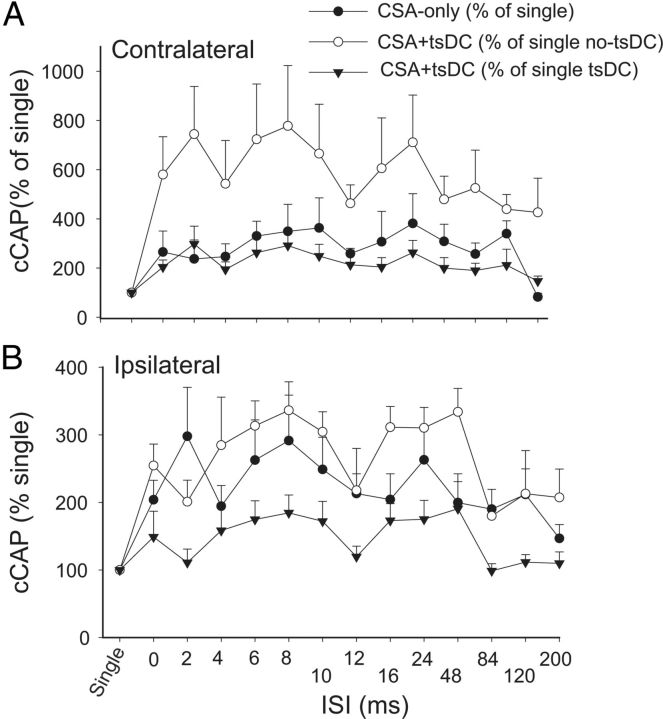
To examine the effect of associating sciatic nerve stimulation with cortical stimulation, sciatic and cortical pulses were paired at various ISIs (Fig. 7). Changes in cCAP were expressed as a percentage of baseline single-pulse-induced cCAP. CSA induced a significant effect (repeated-measures ANOVA, F = 2.82, p < 0.001; n = 8) and a significant increase compared with baseline single-pulse-induced cCAP (p < 0.05) at all ISIs except 200 ms (Holm–Sidak method, p < 0.001; p > 0.05 for 200 ms). Figure 8A summarizes the responses contralateral to the stimulated M1 during CSA + tsDC. When cCAP during CSA + tsDC was expressed as a percentage of baseline single-pulse-induced cCAP during the no-tsDC condition, there was a significant effect (repeated-measures ANOVA, F = 4.50, p < 0.001; n = 6) and a significant increase at all ISIs (Holm–Sidak method, p < 0.008). In addition, when cCAP during CSA + tsDC was expressed as a percentage of baseline single-pulse-induced cCAP during no-tsDC, there was a significant effect (repeated-measures ANOVA, F = 2.63, p < 0.007) and a significant increase at ISIs of 2–120 ms (Holm–Sidak method, p < 0.001). Note that the responses of the contralateral side during CSA-only are included for comparison (Fig. 8A). Baseline cCAP were identical in all conditions (one-way ANOVA, F = 1.06, p > 0.05). Figure 8B summarizes the responses ipsilateral to the stimulated M1 during CSA-only and CSA + tsDC. Ipsilateral responses during CSA-only showed a significant effect (repeated-measures ANOVA, F = 2.63, p < 0.007) with significant increases at ISIs of 2–10 and 24 ms (Holm–Sidak method, p < 0.003). Ipsilateral responses during CSA + tsDC showed a significant effect (repeated-measures ANOVA, F = 3.54, p < 0.001), with significant increases at ISIs of 6–10, 24, and 48 ms compared with single-pulse-induced cCAP during no-tsDC (Holm–Sidak method, p < 0.001). When cCAP during CSA + tsDC was expressed as a percentage of baseline single-pulse-induced cCAP during tsDC, there was a significant effect (repeated-measures ANOVA, F = 2.55, p < 0.008) and a significant increase at ISIs of 8 and 24 ms (Holm–Sidak method, p < 0.005). Baseline cCAP were identical in all conditions (one-way ANOVA, F = 2.4, p > 0.05).
Figure 7.
CSA stimulation enhanced contralateral cortical output. A, Sample traces of cCAP. Top shows single-pulse-induced cCAP (red) overlapped over CSA-induced trace (black) at 4 ms ISI. In all CSA traces, the first potential is the nCAP and the second is cCAP. The middle trace shows an overlay of single-pulse-induced cCAP (red) and 12 ms ISI CSA trace (black). The bottom shows overlay of single-pulse-induced cCAP (red) and 200 ms interstimulus CSA trace (black). B, Summary plot showing an increase in cCAP during various ISIs expressed as percentage of single-pulse-induced cCAP.
Figure 8.
CSA stimulation only or combined with tsDC enhanced contralateral and ipsilateral responses. The M1 was stimulated epicranially, and nCAP was recorded bilaterally. CSA was tested at various ISIs. A, Responses contralateral to M1. cCAP are expressed as a percentage of baseline single-pulse-induced CAP. CAP during CSA-only is expressed as a percentage of baseline single-pulse-induced CAP (percentage of single). CAP during CSA + tsDC is expressed as a percentage of single-pulse-induced CAP during tsDC (percentage of single tsDC) and during no tsDC (percentage of single no-tsDC). Overall, these results show significant effects of CSA and CSA + tsDC. Note that CSA-only values plotted in A are the same as in B to allow comparison. B, Responses ipsilateral to M1. All values are expressed as in A.
CSA-only and CSA + tsDC induce long-term enhancement of cCAP (experiment 4)
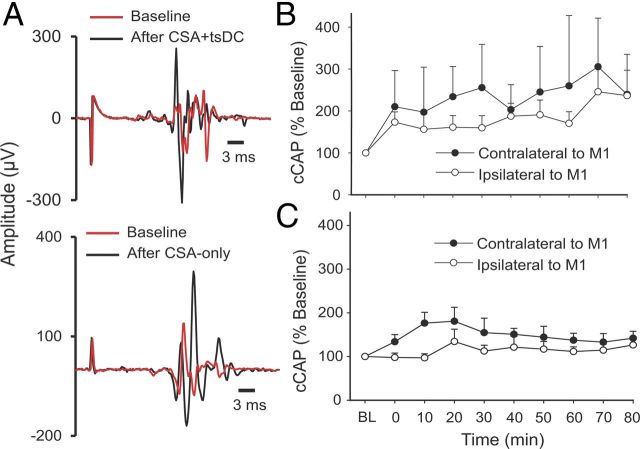
Repetitive CSA (90 pulses, 1 Hz) was used to determine the long-term aftereffects of CSA-only and CSA + tsDC. cCAP were examined bilaterally and were expressed as a percentage of baseline cCAP. There was an overall difference in percentage change after CSA + tsDC in responses contralateral to M1 (Fig. 9A,B) (repeated-measures ANOVA, F = 2.34, p < 0.001; n = 8) and significant increases at all posttest time points (Holm–Sidak method, p < 0.009). There was also an overall significant difference after CSA + tsDC in responses ipsilateral to M1 (repeated-measures ANOVA, F = 4.75, p < 0.001) and a significant increase at all posttest time points (Holm–Sidak method, p < 0.03). cCAP contralateral to M1 showed significant differences after CSA-only (repeated-measures ANOVA, F = 3.34, p < 0.001; n = 7) at all posttest time points compared with baseline (Holm–Sidak method, p < 0.03). In contrast, cCAP ipsilateral to M1 showed no significant differences compared with baseline (repeated-measures ANOVA, F = 0.76, p = 0.64) (Fig. 9A,C).
Figure 9.
Long-term enhancement of cCAP. The CSA protocol to induce persistent changes was 90 pulses at 1 Hz and 12 ms ISI, applied with and without tsDC. A, Examples of cCAP. Top shows contralateral cCAP traces recorded at baseline (red) and after CSA + tsDC stimulation (black). Note that pretest and posttest stimuli have identical parameters. Bottom shows contralateral traces of cCAP recorded at baseline (red) and after CSA-only (black). B, Summary plot showing long-term contralateral and ipsilateral changes after the CSA + tsDC stimulation. C, Summary plot showing contralateral and ipsilateral changes after CSA-only. Data are expressed as percentage of baseline (BL).
In addition, CSA-only and CSA + tsDC were compared at 80 min posttest. cCAP contralateral to M1 was significantly higher after CSA + tsDC (239.5 ± 15.9% of baseline) compared with CSA-only (141.9 ± 15.9% of baseline) (t test, p = 0.043). Moreover, cCAP ipsilateral to M1 was significantly higher after CSA + tsDC (236 ± 63.7% of baseline) compared with CSA-only (126.5 ± 13.1% of baseline) (t test, p = 0.026). Baseline cCAP showed no significant difference between the two groups (t test, p > 0.05).
Specificity of tsDC (experiment 5)
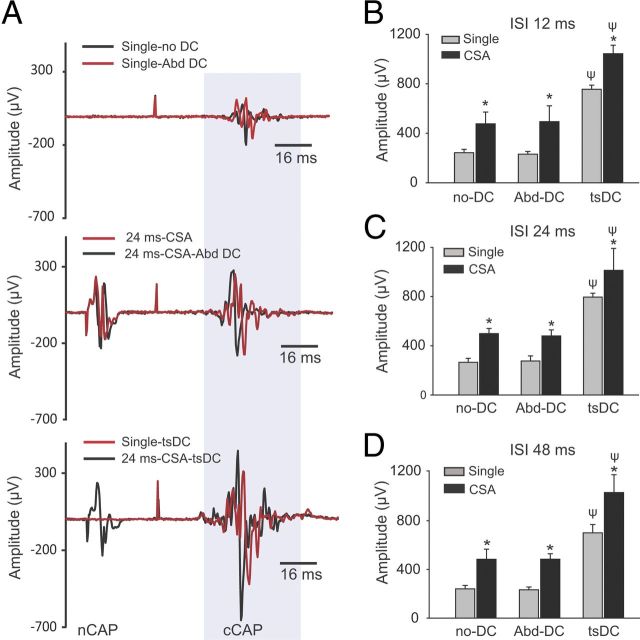
To test the specificity of tsDC, single cortical stimuli and CSA were applied under three conditions: (1) without tsDC; (2) during Abd-DC (electrode placed 1.5 cm lateral to spinal column over abdominal muscles); and (3) during tsDC. CSA was applied at three ISIs: 12, 24, and 48 ms. There was a significant group difference at 12, 24, and 48 ms ISI (repeated-measures ANOVA, F = 27.3, 48.6, and 32.6, respectively, p < 0.001; n = 5). As shown in Figure 10, single responses were similar without DC and with Abd-DC but had significantly greater amplitude during tsDC (Holm–Sidak method, p < 0.001). There was a significant increase in cortical responses by CSA-only and CSA + Abd-DC compared with their respective single-pulse-induced cCAP (Holm–Sidak method, p < 0.001). However, CSA-only and CSA + Abd-DC were similar (Holm–Sidak method, p > 0.05). CSA + tsDC was significantly different from CSA-only and CSA + Abd-DC (Holm–Sidak method, p < 0.001).
Figure 10.
The effect of tsDC is specific. CSA stimulation was performed during tsDC and Abd-DC. CSA was tested at ISIs of 12, 24, and 48 ms. Abd-DC was applied by a DC electrode placed on the abdominal muscles 1.5 cm lateral to the lumber spinal column (see Materials and Methods). Five animals were used in these experiments. A, Traces recorded under different conditions in the same animal. The top shows cCAP recorded under two conditions: without DC and during Abd-DC (−0.8 μA). The middle shows CSA (ISI of 24 ms) without DC (red) and during Abd-DC (black). The bottom shows responses to a single stimulation of M1 (red) and CSA during tsDC (−0.8 μA) (black). B, Summary plot showing that CSA at ISI of 12 ms was significantly increased by tsDC but not Abd-DC. C, Summary plot showing that CSA at ISI of 24 ms was significantly increased by tsDC but not Abd-DC. D, Summary plot showing that CSA at ISI of 48 ms was significantly increased by tsDC but not Abd-DC. Overall, these findings show that tsDC is specific in its effect on the spinal cord. *p < 0.001 relative to respective single potential; ψp < 0.001 relative to without tsDC.
Control experiments for long-term effects
To control for changes resulting from interventions used in the current study, the following basic stimulation protocols were tested: repetitive single-pulse stimulation only (90 pulses, 1 Hz), tsDC-only, and the two protocols combined. When the motor cortex, spinal cord, and sciatic nerve were stimulated using the single-pulse stimulation, pretest and posttest cCAP values were not significantly different (Table 1) (t test, p = 0.76, 0.87, and 0.82, respectively; n = 3, 3, and 4, respectively). These results indicate that the basic stimulation protocol does not induce an aftereffect. Similarly, short exposure (1.3 min) to tsDC-only did not produce long-term changes on sCAP or cCAP (t test, p = 0.44 and 0.43, respectively; n = 3 per group). Finally, combining single-pulse stimulation with tsDC (−0.8 mA) did not significantly affect sCAP or cCAP (t test, p = 0.11 and 0.62, respectively; n = 11 and 5, respectively). Therefore, it can be concluded that these basic protocols are not sufficient by themselves to produce long-term changes.
Table 1.
Control experiments testing aftereffects of basic protocols
| Protocol (evoked CAP) | Pretest (μV) (mean ± SEM) | Posttest (μV) (mean ± SEM) | Significance (paired t test) | n |
|---|---|---|---|---|
| Spinal-only (sCAP) | 847.0 ± 55.8 | 880.0 ± 188.8 | p = 0.81 | 3 |
| Nerve-only (sCAP) | 1068.0 ± 229.1 | 1002.1 ± 188.6 | p = 0.82 | 4 |
| Cortical-only (cCAP) | 944.4 ± 184.9 | 979.4 ± 82.7 | p = 0.76 | 3 |
| tsDC-only (cCAP) | 1248.4 ± 172.8 | 1013.8 ± 168.1 | p = 0.43 | 3 |
| tsDC-only (sCAP) | 1295.6 ± 250.9 | 1075.8 ± 173.7 | p = 0.44 | 3 |
| Spinal + tsDC (sCAP) | 686.0 ± 174.0 | 1009.0 ± 132.3 | p = 0.11 | 5 |
| Cortical + tsDC (cCAP) | 1160.4 ± 98.7 | 1214.6 ± 98.5 | p = 0.62 | 5 |
Latencies and duration of spinal responses (experiment 6)
To shed some light on synchronization of events during associative stimulation, extracellular recording was performed from the dorsal horn or ventral horn of the L4 spinal cord segment. Stimulation of contralateral M1 (1 mm posterior to bregma and 1 mm lateral from midline) produced CAP in the dorsal horn of the spinal cord that included three volleys with latencies at 1.4 ± 0.05, 2.3 ± 0.1, and 4.1 ± 0.1 ms. In addition to these three volleys, another volley with a latency of 9.9 ± 0.3 ms was recorded from the L4 ventral horn (Fig. 11A). The duration of the first three volleys was 6.7 ± 0.3 ms, and the duration of the delayed fourth volley was 20.5 ± 1.4 ms. These waves show some similarity to D- and I-waves characterized by Rothwell et al. (1994). Sciatic stimulation produced CAP recorded from the ventral horn with two distinct waves with latencies of 0.9 ± 0.03 and 3.1 ± 0.1 ms with a duration of 14.7 ± 0.6 ms (Fig. 11B). Spinal cord stimulation at the L1 segment produced CAP recorded from L4 ventral horn with a latency of 0.6 ± 0.1 ms and duration of 8.7 ± 0.6 ms (Fig. 11C). These findings allow estimation of synchronization between volleys generated by stimulation at different sites (cortical or spinal and sciatic nerve).
The nature of spinal potentials (experiment 7)
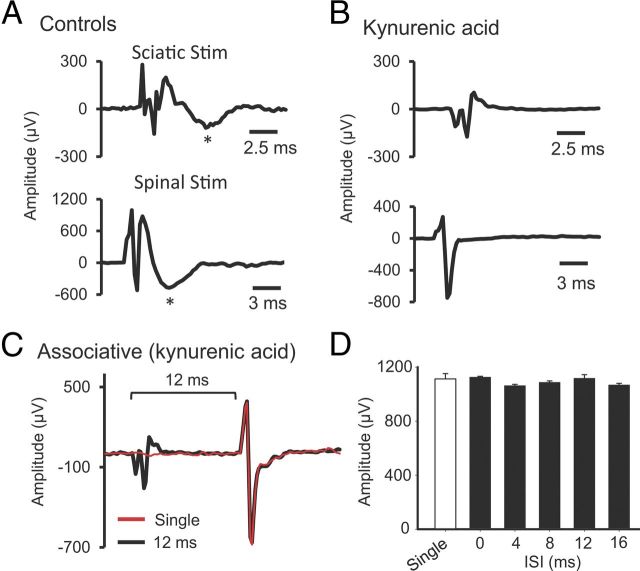
To study the nature of spinal potentials and their contributions to the immediate effects of SSA, two glutamatergic antagonists were used to block synaptic transmission. Kynurenic acid (nonselective glutamatergic antagonist, 10 μl; 2.5 mm) or CNQX (AMPA receptor antagonist, 10 μl; 200 μm) was injected to the spinal cord L4 level, and sciatic or spinal stimulation-evoked biphasic potentials were recorded from the L4 ventral horn area (Fig. 12A). Both antagonists completely blocked the second wave of sciatic or spinal stimulation-induced spinal potential (Fig. 12B). Similarly, both antagonists blocked effects of the SSA protocol on spinally recorded potentials at all of the ISIs (0, 4, 8, 12, 16 ms; Fig. 12C,D) (repeated-measures ANOVA, F = 1.5, p = 0.18). These data suggest that glutamatergic synaptic transmission was necessary for induction of concurrent associative plasticity in the present study.
Figure 12.
Synaptic activation was necessary for associative plasticity. Kynurenic acid (glutamatergic receptor antagonist) or CNQX (AMPA receptor antagonist) were injected into the L4 level of the spinal cord. Both molecules blocked the late components of either nCAP or sCAP. A, Vehicle control (no drug). Sciatic nerve stimulation (top) or spinal stimulation (bottom) induces a biphasic potential. B, The second wave (marked by asterisks in A) is synaptically mediated, because it disappeared after injection of kynurenic acid or CNQX (data not shown). C, An example of associative stimulation-induced potential overlaid with single-pulse-induced potential, showing that SSA stimulation is not effective in amplifying potentials in the presence of kynurenic acid. D, Summary plot showing that SSA stimulation was not effective at ISIs of 0, 4, 8, 12, and 16 ms.
CSA + tsDC improves skilled locomotion after hemisectioned SCI (experiment 8)
Unilateral injury was confirmed to be confined to the left side of the spinal cord in each of the animals (Fig. 2). A small portion of the ventral column of the spinal cord was not injured, probably because the angled microsurgical probe did not reach far enough to cut the ventral aspect. However, the injury was enough to cause significant impairment of skilled locomotion.
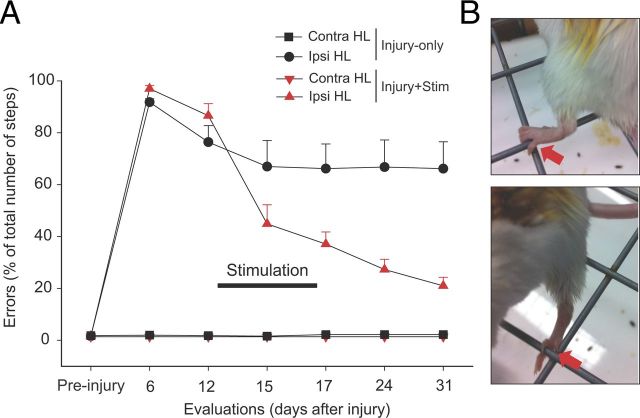
To test whether combined CSA + tsDC can efficiently restore skilled locomotion after hemisection SCI, injured mice were implanted with a stimulation system (see Materials and Methods) and divided into four groups: injury-only (n = 7), injury + tsDC (n = 5) injury + CSA (n = 4), and injury + CSA + tsDC (n = 10). Misstepping on the rungs of the horizontal ladder, defined as any miss or slip off the rung, was the main outcome measure. The rate of errors was ∼93% in all animals 1 week after SCI. Animals then received four sessions (20 min/d over 4 d) of CSA + tsDC, CSA-only, or sham treatment. Injury-only mice with sham treatment showed changes over time (repeated-measures ANOVA, F = 30.75, p < 0.001) with spontaneous partial recovery, indicated by a significant reduction in error rate at days 15, 17, 24, and 31 compared with day 6 (Holm–Sidak method, p < 0.01) (Fig. 13). Injury + tsDC and injury + CSA groups showed improvement similar to the injury-only group (∼23 and 22% of day 6 evaluation, respectively; data not shown). CSA + tsDC mice also showed changes over time (repeated-measures ANOVA, F = 140.0, p < 0.001) with a significant reduction in error rate at all poststimulation time points (days 15–31) compared with day 6 (Holm–Sidak method, p < 0.001). Moreover, the CSA + tsDC group showed a striking improvement (52% reduction in error rate) compared with day 6 after two treatment sessions (see day 15). At day 31, missteps in CSA + tsDC mice were reduced by 77% compared with day 6. In addition, CSA + tsDC mice showed a significant reduction in error rate compared with the other two groups from day 15 to 31 (Holm–Sidak method, all p < 0.023). In addition to improvements on the horizontal ladder, CSA + tsDC mice showed other improvements. Specifically, they were able to use their ipsilateral (affected) hindpaws to grip the mesh of a grid with one or all of the toes (Fig. 13B) and would stand in a bipedal stance while grooming. Although these behaviors were not quantified, they were not observed in mice in the injury-only or CSA + injury groups. Thus, combined CSA + tsDC stimulation seems to be extremely effective in improving hindlimb motor control in this model of SCI.
Figure 13.
Combined stimulation treatment improved skilled locomotor control. Mice were stimulated using an implanted system that delivers tsDC to the spinal cord and pulses to M1. Mice were stimulated 20 min/d for 4 consecutive days (days 13–16). A, Error rate was reduced significantly during and after the CSA + tsDC stimulation protocol. The graph summarizes data from two groups of animals: injury-only (black) and injury + CSA + tsDC (black). In both groups, the hindlimb contralateral to hemisection (Contra HL) injury showed no deficit. However, the ipsilateral hindlimb (Ipsi HL) was impaired during horizontal ladder walking, because mice committed >90% missteps, defined as any miss or slip off the rung. The injury-only group showed spontaneous partial recovery, indicated by a significant reduction in the number of errors 2 weeks after injury (see day 15). The group that received CSA + tsDC showed immediate and significant reduction in the number of missteps (see day 15), and they continued to improve to reach 24% errors on day 31. B, Photographs showing ipsilateral hindlimb use as mice walked on a grid. The top shows the animal gripping with the hindpaw, whereas the bottom shows the animal using an individual toe. These observations were not quantified but were seen only in animals that received the CSA + tsDC protocol.
Discussion
In associative stimulation, the unconditioned response (sciatic nerve) has a concurrent effect on the cCAP and sCAP conditioned responses. This effect is dependent on the ISI. In the current study, effective ISIs were narrower for SSA (2–24 ms) than CSA (0 to 120 ms), indicating mechanistic differences, such as the number and type of tracts that activate spinal motoneurons. In CSA, the motor cortex is stimulated, which in turn would activate the spinal motoneurons through the corticospinal or cortico-reticulospinal pathways (Alstermark and Ogawa, 2004; Isa et al., 2007). In SSA, stimulating the dorsal column of the spinal cord could activate many classes of spinal tracts passing underneath the electrode. The tip of the concentric bipolar electrode used for spinal stimulation was situated on the dorsal median sulcus. Therefore, it may have activated not only the dorsal corticospinal tracts (Hunanyan et al., 2012) but also nearby descending axons that terminate onto motoneurons (Cowley et al., 2008; Watson and Harvey, 2009). Another difference between SSA and CSA is probably the location in which the associative enhancement occurs. In SSA, associative plasticity should occur at the spinal cord, but in CSA, associative plasticity could be at the spinal cord (Meunier et al., 2007), cortex (Nitsche et al., 2007), or anywhere between.
Inputs onto motoneurons originate from multiple sources. For example, stimulating the sciatic nerve produces two inputs to spinal motoneurons, one attributable to backward propagation of action potentials initiated at the motor axons of the sciatic nerve and the second attributable to stimulation of the sensory afferents at the sciatic nerve. According to spike-timing-dependent plasticity rules (Dan and Poo, 2006), those two inputs are not expected to produce potentiation at their monosynaptic connection because postsynaptic activity is expected to precede presynaptic activity. The exact pre–post timing of activity cannot be determined in the current experiments. However, an approximation can be calculated. The antidromic activity of motoneurons takes ∼0.9 ms to travel from the site of stimulation at the sciatic nerve to the cell body of spinal motoneurons (Figs. 11, 12). Moreover, sciatic nerve stimulation activates sensory fibers that provide an input to spinal motoneurons, which may be responsible for the second volley (Figs. 11B, 12A). This is supported by findings that the second wave can be blocked by kynurenic acid or CNQX. The duration of sciatic-nerve-induced sCAP is ∼15 ms, which includes fiber volleys and the late wave. In addition, cortical stimulation evokes spinal activity that has a duration of 20 ms, and spinal (L1) stimulation induces activity at L4 that has a duration of ∼13 ms. Altogether, these data indicate that the most likely ISIs for synchronized activity at the spinal level would be between 0 and 16 ms. This could explain why spinal associative stimulation was effective in increasing response amplitude at ISIs between 0 and 16 ms, but it does not explain the effectiveness of cortical stimulation at longer ISIs (24–120 ms). The above latency analysis is an approximation of what might happen at the spinal cord level, but it is not known exactly how evoked potentials are channeled within the spinal cord and between supraspinal brain structures.
In previous studies, I and others showed that cathodal tsDC enhanced cortically evoked responses (Ahmed, 2011; Ahmed and Wieraszko, 2012). Thus, the current study investigated whether cathodal tsDC would change the outcome of SSA and CSA. Indeed, tsDC shifted the ISI curve upward, raising the question of whether that change arises from tsDC, associative enhancement, or an interaction between tsDC and associative plasticity. Interestingly, SSA + tsDC and CSA + tsDC show more enhancement than SSA-only and CSA-only or than single-pulse sCAP and cCAP during tsDC. This indicates that tsDC and associative stimulation produce an additive response when applied together.
One of the important findings in this study is that tsDC induced different patterns of enhancement contralateral to the stimulated nerve during SSA and CSA. However, this effect was more robust on the ipsilateral side. SSA showed significant enhancement at only two ISIs (8 and 24 ms). SSA + tsDC showed significant enhancement compared with single-pulse sCAP at 0, 2, 4, and 6 ms ISIs but not during longer ISIs. This suggests that applying tsDC enhanced certain intraspinal pathways engaged by SSA. Although the present results cannot offer a direct explanation for how the contralateral responses are achieved, I speculate that certain spinal pathways that project bilaterally (Carlin et al., 2006; Quinlan and Kiehn, 2007) are conditioned by nerve stimulation. Therefore, when these pathways are activated by a spinal or cortical stimulus, they send an enhanced bilateral output to motoneurons. In CSA, the effect contralateral to the stimulated nerve is stronger than in SSA, perhaps because in CSA, the associative enhancement happens at many bilateral projecting levels between the brain and spinal cord.
Repetitive SSA and CSA induces long-term enhancement of sCAP and cCAP, respectively. These findings agree with studies done in humans (Stefan et al., 2000; Ridding and Uy, 2003; Quartarone et al., 2006). In repetitive SSA, although the side ipsilateral to the stimulated nerve showed significant enhancement of sCAP that persisted for at least 80 min (as long as experiments were continued), the contralateral side showed sCAP for <10 min. Similarly, the side contralateral to the stimulated nerve showed no significant enhancement after CSA. This demonstrates specificity in the induction of long-term enhancement by SSA or CSA that is directed toward the associatively-stimulated side.
Combining repetitive SSA or CSA with tsDC caused long-term enhancement in both the contralateral and ipsilateral sides, with the ipsilateral side showing higher enhancement. This supports the idea that tsDC increases the excitability of spinal neurons, allowing bilateral projecting neurons to be engaged in the induction of associative plasticity. Spinal stimulation during tsDC application in control experiments did not induce significant long-term associative plasticity, suggesting an important interplay between tsDC and associative stimulation. It should be noted here that the CSA + tsDC protocol used in the current study differs from the one used previously (Ahmed, 2011) in two ways. First, the tsDC intensity was reduced in the current study (−0.8 mA) compared with the previous study (−2 mA); second, the time of exposure was decreased (from 3 min in the previous study to 1.3 min in the current study). These protocol modifications were necessary to prevent enhancement by combining cortical stimulation with tsDC, allowing the associative stimulation factor to be examined separately. In the study by Nitsche et al. (2007), cathodal transcranial DC combined with PAS induced long-term enhancement of motor cortex excitability. Although the current study and previous studies (Ahmed, 2011; Ahmed and Wieraszko, 2012) applied DC at different CNS locations than Nitsche et al., the results are consistent. This suggests that DC stimulation has similar effects, regardless of whether it is applied at the spinal cord or brain.
Behavioral recovery induced by combined CSA and tsDC demonstrates that this form of artificially induced associative connection translates into a form of motor learning that does not depend on practice or experience. PAS has been shown to improve motor behavior in a rat stroke model (Shin et al., 2008) and has had some limited success in humans with stroke (Jayaram and Stinear, 2008; Castel-Lacanal et al., 2009). To the best of my knowledge, the present study is the first to investigate the effectiveness of associative stimulation combined with tsDC in a model of SCI. It should be noted that, in the current study, I used the fewest number of treatment sessions that induced significant improvement to allow effects of CSA + tsDC to be distinguished from control protocols. Specifically, after four sessions, associative stimulation alone did not induce any significant improvements, but animals exposed to CSA + tsDC showed improvements on the horizontal ladder, were able to grip a mesh grid with one or all toes of the ipsilateral hindpaw, and performed grooming during bipedal standing. Although these latter two effects were not quantified, they demonstrated that the animals could use the hindlimb proficiently for natural behaviors.
These results support the principle of transference put forward by Kleim and Jones (2008), which states that plasticity in one circuit promotes concurrent or subsequent plasticity. Herein, the artificial associative stimulation-induced plasticity that was directed toward the disabled side promoted subsequent recovery of a skilled behavior. However, the significant improvement observed after the second treatment session suggests that improvement is not simply attributable to the testing procedure and that transference does not require synchronization of treatment and training.
The spinal cord contains a network of commissural interneurons that regulate movements bilaterally. This network is connected to supraspinal motor centers, such as the mesencephalic locomotor region and the reticulospinal, vestibulospinal, and contralateral and ipsilateral corticospinal systems (Jankowska, 2008). Therefore, in the current study, the most obvious mechanism by which behavioral improvement could occur is direct strengthening by tsDC + PAS of spared or newly sprouted descending motor connections contralateral to the injury. In addition, sensory information from the limb plays a vital role in maintaining postural control during locomotion and modifies ongoing gait patterns (Thibaudier and Hurteau, 2012). Interruption or loss of proprioceptive information from limbs disrupts gait (Sudarsky and Ronthal, 1983; Ferrell et al., 1985). Because tsDC was shown to strengthen the sensory pathway responses (Aguilar et al., 2011), strengthening the descending pathway could also contribute to the improvements observed in animals in the current study.
Footnotes
This study was supported by Grant 64727-00 42 from Professional Staff Congress of the City University of New York.
References
- Aguilar J, Pulecchi F, Dilena R, Oliviero A, Priori A, Foffani G. Spinal direct current stimulation modulates the activity of gracile nucleus and primary somatosensory cortex in anesthetized rats. J Physiol. 2011;589:4981–4996. doi: 10.1113/jphysiol.2011.214189. [DOI] [PMC free article] [PubMed] [Google Scholar]
- Ahmed Z. Trans-spinal direct current stimulation modulates motor cortex-induced muscle contraction in mice. J Appl Physiol. 2011;110:1414–1424. doi: 10.1152/japplphysiol.01390.2010. [DOI] [PubMed] [Google Scholar]
- Ahmed Z, Wieraszko A. Trans-spinal direct current enhances corticospinal output and stimulation-evoked release of glutamate analog, d-2,3-(3)H-aspartic acid. J Appl Physiol. 2012;112:1576–1592. doi: 10.1152/japplphysiol.00967.2011. [DOI] [PubMed] [Google Scholar]
- Alstermark B, Ogawa J. In vivo recordings of bulbospinal excitation in adult mouse forelimb motoneurons. J Neurophysiol. 2004;92:1958–1962. doi: 10.1152/jn.00092.2004. [DOI] [PubMed] [Google Scholar]
- An S, Yang JW, Sun H, Kilb W, Luhmann HJ. Long-term potentiation in the neonatal rat barrel cortex in vivo. J Neurosci. 2012;32:9511–9516. doi: 10.1523/JNEUROSCI.1212-12.2012. [DOI] [PMC free article] [PubMed] [Google Scholar]
- Brocke J, Irlbacher K, Hauptmann B, Voss M, Brandt SA. Transcranial magnetic and electrical stimulation compared: does TES activate intracortical neuronal circuits? Clin Neurophysiol. 2005;116:2748–2756. doi: 10.1016/j.clinph.2005.08.015. [DOI] [PubMed] [Google Scholar]
- Burke D, Hicks R, Gandevia SC, Stephen J, Woodforth I, Crawford M. Direct comparison of corticospinal volleys in human subjects to transcranial magnetic and electrical stimulation. J Physiol. 1993;470:383–393. doi: 10.1113/jphysiol.1993.sp019864. [DOI] [PMC free article] [PubMed] [Google Scholar]
- Carlin KP, Dai Y, Jordan LM. Cholinergic and serotonergic excitation of ascending commissural neurons in the thoraco-lumbar spinal cord of the neonatal mouse. J Neurophysiol. 2006;95:1278–1284. doi: 10.1152/jn.00963.2005. [DOI] [PubMed] [Google Scholar]
- Carmel JB, Berrol LJ, Brus-Ramer M, Martin JH. Chronic electrical stimulation of the intact corticospinal system after unilateral injury restores skilled locomotor control and promotes spinal axon outgrowth. J Neurosci. 2010;30:10918–10926. doi: 10.1523/JNEUROSCI.1435-10.2010. [DOI] [PMC free article] [PubMed] [Google Scholar]
- Castel-Lacanal E, Marque P, Tardy J, de Boissezon X, Guiraud V, Chollet F, Loubinoux I, Moreau MS. Induction of cortical plastic changes in wrist muscles by paired associative stimulation in the recovery phase of stroke patients. Neurorehabil Neural Repair. 2009;23:366–372. doi: 10.1177/1545968308322841. [DOI] [PubMed] [Google Scholar]
- Cogiamanian F, Vergari M, Pulecchi F, Marceglia S, Priori A. Effect of spinal transcutaneous direct current stimulation on somatosensory evoked potentials in humans. Clin Neurophysiol. 2008;119:2636–2640. doi: 10.1016/j.clinph.2008.07.249. [DOI] [PubMed] [Google Scholar]
- Cogiamanian F, Vergari M, Schiaffi E, Marceglia S, Ardolino G, Barbieri S, Priori A. Transcutaneous spinal cord direct current stimulation inhibits the lower limb nociceptive flexion reflex in human beings. Pain. 2011;152:370–375. doi: 10.1016/j.pain.2010.10.041. [DOI] [PubMed] [Google Scholar]
- Cowley KC, Zaporozhets E, Schmidt BJ. Propriospinal neurons are sufficient for bulbospinal transmission of the locomotor command signal in the neonatal rat spinal cord. J Physiol. 2008;586:1623–1635. doi: 10.1113/jphysiol.2007.148361. [DOI] [PMC free article] [PubMed] [Google Scholar]
- Dan Y, Poo MM. Spike timing-dependent plasticity of neural circuits. Neuron. 2004;44:23–30. doi: 10.1016/j.neuron.2004.09.007. [DOI] [PubMed] [Google Scholar]
- Dan Y, Poo MM. Spike timing-dependent plasticity: from synapse to perception. Physiol Rev. 2006;86:1033–1048. doi: 10.1152/physrev.00030.2005. [DOI] [PubMed] [Google Scholar]
- Di Lazzaro V, Oliviero A, Profice P, Meglio M, Cioni B, Tonali P, Rothwell JC. Descending spinal cord volleys evoked by transcranial magnetic and electrical stimulation of the motor cortex leg area in conscious humans. J Physiol. 2001;537:1047–1058. doi: 10.1111/j.1469-7793.2001.01047.x. [DOI] [PMC free article] [PubMed] [Google Scholar]
- Elmslie KS, Yoshikami D. Effects of kynurenate on root potentials evoked by synaptic activity and amino acids in the frog spinal cord. Brain Res. 1985;330:265–272. doi: 10.1016/0006-8993(85)90685-7. [DOI] [PubMed] [Google Scholar]
- Ferrell WR, Baxendale RH, Carnachan C, Hart IK. The influence of joint afferent discharge on locomotion, proprioception and activity in conscious cats. Brain Res. 1985;347:41–48. doi: 10.1016/0006-8993(85)90887-x. [DOI] [PubMed] [Google Scholar]
- Fregni F, Boggio PS, Nitsche M, Pascual-Leone A. Transcranial direct current stimulation. Br J Psychiatry. 2005;186:446–447. doi: 10.1192/bjp.186.5.446. [DOI] [PubMed] [Google Scholar]
- Franklin K, Paxinos G. The mouse brain in stereotaxic coordinates. 3rd edition. San Diego: Academic; 2007. [Google Scholar]
- Ganong AH, Lanthorn TH, Cotman CW. Kynurenic acid inhibits synaptic and acidic amino acid-induced responses in the rat hippocampus and spinal cord. Brain Res. 1983;273:170–174. doi: 10.1016/0006-8993(83)91108-3. [DOI] [PubMed] [Google Scholar]
- Hebb DO. The organization of behavior: a neuropsychological theory. New York: Wiley; 1949. [Google Scholar]
- Hunanyan AS, Petrosyan HA, Alessi V, Arvanian VL. Repetitive spinal electromagnetic stimulation opens a window of synaptic plasticity in damaged spinal cord: role of NMDA receptors. J Neurophysiol. 2012;107:3027–3039. doi: 10.1152/jn.00015.2012. [DOI] [PubMed] [Google Scholar]
- Isa T, Ohki Y, Alstermark B, Pettersson LG, Sasaki S. Direct and indirect cortico-motoneuronal pathways and control of hand/arm movements. Physiology (Bethesda) 2007;22:145–152. doi: 10.1152/physiol.00045.2006. [DOI] [PubMed] [Google Scholar]
- Jacob V, Brasier DJ, Erchova I, Feldman D, Shulz DE. Spike timing-dependent synaptic depression in the in vivo barrel cortex of the rat. J Neurosci. 2007;27:1271–1284. doi: 10.1523/JNEUROSCI.4264-06.2007. [DOI] [PMC free article] [PubMed] [Google Scholar]
- Jankowska E. Spinal interneuronal networks in the cat: elementary components. Brain Res Rev. 2008;57:46–55. doi: 10.1016/j.brainresrev.2007.06.022. [DOI] [PMC free article] [PubMed] [Google Scholar]
- Jayaram G, Stinear JW. Contralesional paired associative stimulation increases paretic lower limb motor excitability post-stroke. Exp Brain Res. 2008;185:563–570. doi: 10.1007/s00221-007-1183-x. [DOI] [PubMed] [Google Scholar]
- Kleim JA, Jones TA. Principles of experience-dependent neural plasticity: implications for rehabilitation after brain damage. J Speech Lang Hear Res. 2008;51:S225–S239. doi: 10.1044/1092-4388(2008/018). [DOI] [PubMed] [Google Scholar]
- Köbbert C, Thanos S. Topographic representation of the sciatic nerve motor neurons in the spinal cord of the adult rat correlates to region-specific activation patterns of microglia. J Neurocytol. 2000;29:271–283. doi: 10.1023/a:1026523821261. [DOI] [PubMed] [Google Scholar]
- Lamy JC, Ho C, Badel A, Arrigo RT, Boakye M. Modulation of soleus H reflex by spinal DC stimulation in humans. J Neurophysiol. 2012;108:906–914. doi: 10.1152/jn.10898.2011. [DOI] [PubMed] [Google Scholar]
- Levy WB, Steward O. Temporal contiguity requirements for long-term associative potentiation/depression in the hippocampus. Neuroscience. 1983;8:791–797. doi: 10.1016/0306-4522(83)90010-6. [DOI] [PubMed] [Google Scholar]
- Li CY, Lu JT, Wu CP, Duan SM, Poo MM. Bidirectional modification of presynaptic neuronal excitability accompanying spike timing-dependent synaptic plasticity. Neuron. 2004;41:257–268. doi: 10.1016/s0896-6273(03)00847-x. [DOI] [PubMed] [Google Scholar]
- Metz GA, Whishaw IQ. Cortical and subcortical lesions impair skilled walking in the ladder rung walking test: a new task to evaluate fore- and hindlimb stepping, placing, and co-ordination. J Neurosci Methods. 2002;115:169–179. doi: 10.1016/s0165-0270(02)00012-2. [DOI] [PubMed] [Google Scholar]
- Meunier S, Russmann H, Simonetta-Moreau M, Hallett M. Changes in spinal excitability after PAS. J Neurophysiol. 2007;97:3131–3135. doi: 10.1152/jn.01086.2006. [DOI] [PubMed] [Google Scholar]
- Nitsche MA, Paulus W. Excitability changes induced in the human motor cortex by weak transcranial direct current stimulation. J Physiol. 2000;527:633–639. doi: 10.1111/j.1469-7793.2000.t01-1-00633.x. [DOI] [PMC free article] [PubMed] [Google Scholar]
- Nitsche MA, Roth A, Kuo MF, Fischer AK, Liebetanz D, Lang N, Tergau F, Paulus W. Timing-dependent modulation of associative plasticity by general network excitability in the human motor cortex. J Neurosci. 2007;27:3807–3812. doi: 10.1523/JNEUROSCI.5348-06.2007. [DOI] [PMC free article] [PubMed] [Google Scholar]
- Priori A, Berardelli A, Rona S, Accornero N, Manfredi M. Polarization of the human motor cortex through the scalp. Neuroreport. 1998;9:2257–2260. doi: 10.1097/00001756-199807130-00020. [DOI] [PubMed] [Google Scholar]
- Quartarone A, Rizzo V, Bagnato S, Morgante F, Sant'Angelo A, Girlanda P, Siebner HR. Rapid-rate paired associative stimulation of the median nerve and motor cortex can produce long-lasting changes in motor cortical excitability in humans. J Physiol. 2006;575:657–670. doi: 10.1113/jphysiol.2006.114025. [DOI] [PMC free article] [PubMed] [Google Scholar]
- Quinlan KA, Kiehn O. Segmental, synaptic actions of commissural interneurons in the mouse spinal cord. J Neurosci. 2007;27:6521–6530. doi: 10.1523/JNEUROSCI.1618-07.2007. [DOI] [PMC free article] [PubMed] [Google Scholar]
- Ridding MC, Uy J. Changes in motor cortical excitability induced by paired associative stimulation. Clin Neurophysiol. 2003;114:1437–1444. doi: 10.1016/s1388-2457(03)00115-9. [DOI] [PubMed] [Google Scholar]
- Rossignol S, Schwab M, Schwartz M, Fehlings MG. Spinal cord injury: time to move? J Neurosci. 2007;27:11782–11792. doi: 10.1523/JNEUROSCI.3444-07.2007. [DOI] [PMC free article] [PubMed] [Google Scholar]
- Rothwell J, Burke D, Hicks R, Stephen J, Woodforth I, Crawford M. Transcranial electrical stimulation of the motor cortex in man: further evidence for the site of activation. J Physiol. 1994;481:243–250. doi: 10.1113/jphysiol.1994.sp020435. [DOI] [PMC free article] [PubMed] [Google Scholar]
- Schneider SP, Perl ER. Comparison of primary afferent and glutamate excitation of neurons in the mammalian spinal dorsal horn. J Neurosci. 1988;8:2062–2073. doi: 10.1523/JNEUROSCI.08-06-02062.1988. [DOI] [PMC free article] [PubMed] [Google Scholar]
- Shin HI, Han TR, Paik NJ. Effect of consecutive application of paired associative stimulation on motor recovery in a rat stroke model: a preliminary study. Int J Neurosci. 2008;118:807–820. doi: 10.1080/00207450601123480. [DOI] [PubMed] [Google Scholar]
- Song S, Miller KD, Abbott LF. Competitive Hebbian learning through spike-timing-dependent synaptic plasticity. Nat Neurosci. 2000;3:919–926. doi: 10.1038/78829. [DOI] [PubMed] [Google Scholar]
- Stefan K, Kunesch E, Cohen LG, Benecke R, Classen J. Induction of plasticity in the human motor cortex by paired associative stimulation. Brain. 2000;123:572–584. doi: 10.1093/brain/123.3.572. [DOI] [PubMed] [Google Scholar]
- Sudarsky L, Ronthal M. Gait disorders among elderly patients. A survey study of 50 patients. Arch Neurol. 1983;40:740–743. doi: 10.1001/archneur.1983.04050110058009. [DOI] [PubMed] [Google Scholar]
- Taylor JL, Martin PG. Voluntary motor output is altered by spike-timing-dependent changes in the human corticospinal pathway. J Neurosci. 2009;29:11708–11716. doi: 10.1523/JNEUROSCI.2217-09.2009. [DOI] [PMC free article] [PubMed] [Google Scholar]
- Tennant KA, Adkins DL, Donlan NA, Asay AL, Thomas N, Kleim JA, Jones TA. The organization of the forelimb representation of the C57BL/6 mouse motor cortex as defined by intracortical microstimulation and cytoarchitecture. Cereb Cortex. 2010;21:865–876. doi: 10.1093/cercor/bhq159. [DOI] [PMC free article] [PubMed] [Google Scholar]
- Thibaudier Y, Hurteau MF. Sensory regulation of quadrupedal locomotion: a top-down or bottom-up control system? J Neurophysiol. 2012;108:709–711. doi: 10.1152/jn.00302.2012. [DOI] [PubMed] [Google Scholar]
- van den Brand R, Heutschi J, Barraud Q, DiGiovanna J, Bartholdi K, Huerlimann M, Friedli L, Vollenweider I, Moraud EM, Duis S, Dominici N, Micera S, Musienko P, Courtine G. Restoring voluntary control of locomotion after paralyzing spinal cord injury. Science. 2012;336:1182–1185. doi: 10.1126/science.1217416. [DOI] [PubMed] [Google Scholar]
- Watson C, Harvey AR. Projections from the brain to the spinal cord. In: Watson C, Paxinos G, Kayalioglu G, editors. The spinal cord. San Diego: Academic; 2009. pp. 168–179. [Google Scholar]
- Watson C, Paxinos G, Kayalioglu G, Heise C. Atlas of the mouse spinal cord. In: Watson C, Paxinos G, Kayalioglu G, editors. The spinal cord. San Diego: Academic; 2009. pp. 308–379. [Google Scholar]


