

Abstract
The neurotrophin brain-derived neurotrophic factor (BDNF) has been implicated in regulating CNS myelination. BDNF mutant mice exhibit a hypomyelinating phenotype, and BDNF exerts distinct effects upon oligodendroglial proliferation, differentiation, and myelination in vitro. To investigate the precise influence that BDNF exerts in regulating CNS myelination in vivo, we have generated conditional knock-out mice in which TrkB has been deleted specifically in oligodendrocytes. Deletion of TrkB disrupted normal oligodendrocyte myelination, resulting in a significant reduction in myelin protein expression and myelination of CNS white matter tracts during development. Importantly, conditional knock-out mice exhibited normal numbers of mature oligodendrocytes and normal numbers of myelinated axons; however, myelin thickness was significantly reduced during development. These data indicate that while TrkB expression in oligodendrocytes plays no role in the initial contact with axons, it exerts an important influence in subsequent stages to promote myelin ensheathment. The conditional knock-out mice also exhibited an increased density of oligodendrocyte progenitor cells (OPCs) in CNS white matter tracts. Concordant with these results, in vitro analyses using OPCs subjected to TrkB knockdown also revealed increased OPC proliferation. Our data suggested this effect was dependent upon TrkC and p75 expression. Thus, our data demonstrate that TrkB expression in oligodendroglia exerts a direct effect on oligodendrocytes to promote myelination and an indirect effect upon the OPC population, modifying their proliferative potential.
Introduction
Oligodendrocyte progenitor cells (OPCs) arise from germinal regions within the CNS, proliferate, and migrate before differentiating into premyelinating oligodendrocytes. These cells subsequently mature into myelinating oligodendrocytes that ensheath axons and form myelin membrane (Baumann and Pham-Dinh, 2001). However the orchestration of CNS myelination is complex and multifactorial, as a number of distinct factors have been shown to regulate this process such as extracellular growth factors (Chan et al., 2004; Brinkmann et al., 2008; Furusho et al., 2011), extracellular matrix proteins (Colognato et al., 2007; Câmara et al., 2009; Laursen et al., 2011), receptors (Givogri et al., 2002; Chen et al., 2009), and electrical activity (Stevens et al., 2002; Káradóttir et al., 2008; Wake et al., 2011).
Brain-derived neurotrophic factor (BDNF) belongs to the neurotrophin family of growth factors and signals via two distinct classes of receptors: tropomyosin-related kinase (Trk) B and the structurally unrelated p75 kDa neurotrophin receptor (p75) (Huang and Reichardt, 2003). BDNF, like the other neurotrophins, can signal independently through either the Trk or p75 receptor, as well as through a Trk-p75 “high-affinity” receptor complex, which can increase the magnitude and duration of Trk signaling (Verdi and Anderson, 1994; Twiss et al., 1998; Wong et al., 2008). Analysis of both BDNF-null and heterozygote mice have identified hypomyelination in multiple regions of the CNS, supporting a promyelinating role for BDNF in vivo (Cellerino et al., 1997; Djalali et al., 2005). In vitro studies have identified that BDNF exerts direct effects upon oligodendroglia, variously promoting OPC proliferation and differentiation, as well as myelination via activation of endogenous TrkB receptors on oligodendroglia (Xiao et al., 2010). To investigate the precise influence BDNF exerts upon CNS myelination in vivo, we have generated a conditional deletion of TrkB from oligodendrocytes.
Our data indicate that oligodendroglial expression of TrkB exerts key influences at different stages in the oligodendroglial lineage. Conditional knock-out mice exhibited normal numbers of postmitotic mature oligodendrocytes and normal numbers of myelinated axons; however, myelin thickness was significantly reduced during development. On the other hand, there was a significantly increased density of OPCs within white matter tracts of the conditional knock-out mice. We conclude that the expression of TrkB exerts important and distinct influences in different stages of the oligodendroglial lineage, directly promoting myelination by oligodendrocytes and indirectly modifying the proliferative potential of OPCs.
Materials and Methods
Animals.
TrkB floxed (TrkBfl/fl) mice (He et al., 2004) were backcrossed for nine generations onto a C57BL/6 background, and crossed onto MBPCre mice (Emery et al., 2006) for a further two generations to create TrkBfl/fl MBPCre mice. Postnatal day 2 (P2) Sprague Dawley female rats were used for dorsal root ganglion (DRG) culture. P7 Sprague Dawley female rats and TrkBfl/fl MBPCre mice of either sex were used for OPC isolation. The R26R-EYFP mice (Srinivas et al., 2001) were crossed to MBPCre mice to generate MBPCre R26R-EYFP mice.
Isolation and culture of OPCs.
Detailed protocols for the purification and culture of rat OPCs were as previously described by Dugas et al., 2006. Mouse OPCs were isolated from dissociated P7 mouse brains as described by Cahoy et al., 2008, by positively immunopanning for PDGFRα after depletion of microglia with BSL1. Mouse OPCs were cultured in serum-free media (as described by Dugas et al., 2006), supplemented with 2% B-27 and 0.1% trace element B. PDGF-AA (10 ng/ml) and NT3 (5 ng/ml) were added to the media to proliferate the OPCs.
For the analysis of receptor expression in OPCs and oligodendrocytes, pure OPC cultures were either maintained as OPCs under proliferative conditions with NT3 and PDGF-AA, or differentiated into oligodendrocytes by the withdrawal of mitogens for 72 h. Protein lysates and RNA were collected for analysis.
Cocultures.
DRG-OPC cocultures were established as described previously (Xiao et al., 2010). Briefly, NGF-dependent DRGs were purified in the presence of NGF (100 ng/ml) for 2–3 weeks. Isolated OPCs were seeded onto the DRG cultures and maintained for 24–72 h for proliferation analysis or 14 d for Western blotting analysis. Treatment of the cocultures was as indicated.
Lentiviral shRNA knockdown.
Lentiviral particles were prepared from TrkB-shRNA and control-scrambled shRNA plasmids (Open Biosystems) by transfection into HEK293T cells. OPCs were infected with concentrated lentiviral particles for 48 h, then seeded onto the DRGs. The efficacy of knockdown of the receptors was determined by Western blot.
Proliferation analysis.
All proliferation assays were performed in the DRG-OPC coculture format. For the proliferation assays, bromodeoxyuridine (BrdU; 15 mm; Invitrogen #00–0103) was added to the coculture media after OPC seeding. The cocultures were subsequently fixed, stained with anti-BrdU (Becton Dickson #555627) and anti-Olig2 (Millipore #AB9610) antibodies and quantified for proliferating oligodendroglia after 48 and 72 h.
Western blotting analysis.
Western blot analysis of lysates generated from TrkBfl/fl MBPCre mice and control mice for the expression of myelin basic protein (MBP; Millipore #MAB381), myelin oligodendrocyte glycoprotein (MOG; R&D Systems #AF2395), TrkB (Santa Cruz Biotechnology #sc8316), and β-actin (Sigma #A5441) was performed; blots shown are representative of three mice per genotype. Western blot analysis was also performed on lysates generated from pure cultures of oligodendroglia from three independent experiments for the expression of TrkB and β-actin. The optical density value for each band was determined using Fujifilm imaging software LAS3000, corrected to actin loading control, then normalized against the control condition.
Histology.
The brain and spinal cord, collected from 4% paraformaldehyde perfused mice, were cryoprotected and frozen in Tissue-Tek OCT. Sections (10 μm thick) were prepared from the brain (at approximately bregma −0.94 μm) and lumbar spinal cord.
Immunohistochemistry and imaging.
Sections were blocked and incubated in primary antibody overnight, followed by incubation with the appropriate secondary antibody (Invitrogen Alexa Fluor 594 or 488). Primary antibodies used were directed against MBP, RIP (Millipore #MAB1580), APC/CC1 (Oncogene #OP-80), anti-PDGFRα (Becton Dickson #558774), anti-GFP/YFP (Abcam #ab13970), and anti-NeuN (Millipore #MAB377). Fluoromyelin (Invitrogen #F34652) was used for labeling compact myelin. Images of adjacent sections were captured and analyses were performed to assess myelin intensity and density of oligodendrocytes and OPCs.
Electron microscopy.
Tissues were postfixed in Karnovsky's fixative and processed for resin embedding. Semithin sections (0.5 μm) were prepared to assess the quality and orientation of the tissue. Representative samples were then chosen and ultrathin sections (90 nm) were cut. Images were captured using a Siemens stereoscope transmission electron microscope at 3000× and 10,000× magnification for analyzing the size of axons and myelin thickness respectively. G-ratios and axonal diameter were assessed from three mice per genotype, analyzing three distinct images per mouse (>200 axons per image).
Quantitative PCR.
All quantitative PCR (qPCR) was performed on an Applied Biosystem ABI7700 sequence detection system using the comparative Ct method (Livak and Schmittgen, 2001). Sequences of primers used were as follows: mouse and rat 18S, forward 5′-CGG CTA CCA CAT CCA AGG AA-3′, reverse 5′-GCT GGA ATT ACC GCG GCT-3′; rat TrkB full-length, forward 5′-GGCCGTGAAGACGCTGAA-3′, reverse 5′-CGGCTTCGCGATGAAAGT-3′; mouse TrkB full-length, forward 5′-TGAGGAGGACACAGGATGTTGA-3′, reverse 5′-TTCCAGTGCAAGCCAGTATCTG-3′; mouse TrkB truncated, forward 5′-GACCCAAACTCTTCGCTAACGA-3′, reverse 5′-CCTGGTGCTGCTCCGTTCTA-3′; mouse TrkC, forward 5′-TTAGGGCAGACTCTGGGTCTCT-3′, reverse 5′-GCTTTCCAACACGGAGGTCAT-3′.
Extracted RNA from tissues and cells (Qiagen RNEAsy kit) was reverse transcribed into cDNA, using TaqMan Reverse Transcription reagents (Applied Biosystems). PCRs were performed and analyzed according to previously published protocols (Livak and Schmittgen, 2001).
Statistical analysis.
All statistical tests were performed using GraphPad Prism (GraphPad Software) or Microscoft Excel statistical functions. Student's t tests were performed to compare three independent sets of data between different genotypes, or treatment groups in vitro. Two-way ANOVA with Bonferroni's post hoc tests were used for multiple comparisons (i.e., different genotypes and age groups).
Results
Oligodendroglial deletion of TrkB under control of the MBP promoter
To investigate the role of oligodendroglial TrkB receptors in CNS myelination in vivo, we generated mice in which TrkB was conditionally deleted from oligodendroglia using the cre-loxP system. We crossed mice in which the first coding exon and the two transcription initiation sites of the TrkB gene were flanked by loxP sites (TrkBfl/fl), with mice expressing cre recombinase under the regulatory control of the MBP promoter (MBPCre) (He et al., 2004; Emery et al., 2006; Li et al., 2008). This strategy was adopted to preferentially delete TrkB from postmitotic oligodendrocytes. To understand the temporal and spatial profile of MBP-driven Cre activity, MBPCre mice were crossed against a Cre reporter strain produced by targeted insertion of EYFP into the ROSA26 locus (R26R-EYFP) (Srinivas et al., 2001). MBPCre activity, as assessed by GFP+ immunoreactivity, was detected in the corpus callosum from as early as P9, and its expression profile was restricted to ∼50% CC1+ oligodendrocytes, as well as ∼10% of OPCs (Fig. 1A; quantified in Fig. 1B). Analysis of spinal cord sections revealed a similar expression profile (data not shown). No immunoreactivity was detected in either astrocytes (GFAP+) or neurons (NFL+) of the corpus callosum or spinal cord. Collectively, these data indicate that these mice exhibit a significant and robust deletion of TrkB from oligodendrocytes, albeit suggestive of incomplete penetrance.
Figure 1.
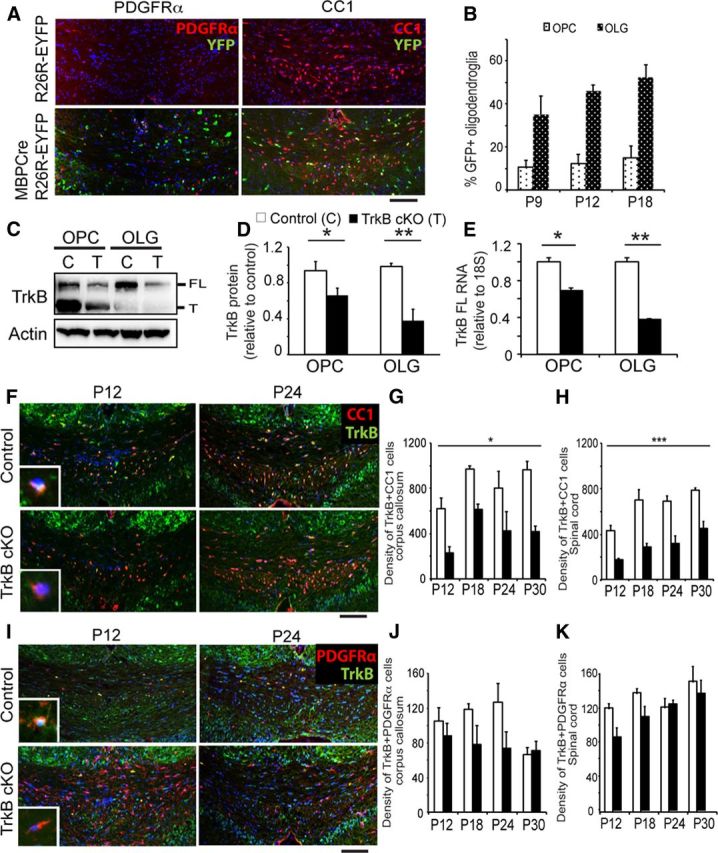
Reduced TrkB expression was specific to TrkBfl/fl MBPCre oligodendroglia. A, Coronal sections of corpus callosum from MBPCre R26R-EYFP and control R26R-EYFP mice at P18 immunolabeled for GFP (green; indicating Cre activity) and PDGFRα+ OPCs (red; left) or CC1+ oligodendrocytes (red; right). B, Quantitation of the proportion of double-labeled oligodendrocytes (GFP+/CC1+) and OPCs (GFP+/PDGFRα+) from P9 to P18 reveals that Cre activity, under the regulatory control of the MBP promoter, colocalizes to oligodendroglia during development. The relative level of cre recombination was higher in oligodendrocytes than OPCs in the corpus callosum. C, Western blot including (D) densitometric analysis of in vitro culture lysates from OPCs and differentiated oligodendrocytes (OLG) derived from TrkBfl/fl MBPCre (TrkB cKO, T) and littermate TrkBfl/fl (Control, C) mice and probed for TrkB and actin. Expression of both the full-length (FL) and truncated (T) TrkB isoforms are significantly reduced in OPCs and oligodendrocytes derived from TrkBfl/fl MBPCre mice. E, qPCR analysis for TrkB RNA expression in isolated OPC and oligodendrocyte cultures. TrkB mRNA levels were significantly decreased in OPCs and oligodendrocytes derived from TrkBfl/fl MBPCre mice compared with controls. Coronal sections of corpus callosum from TrkBfl/fl MBPCre and control mice at P12 and 24 immunolabeled for TrkB (green; F) and CC1 (red), or TrkB (green; I) and PDGFRα (red). The number of CC1+ve oligodendrocytes appeared similar, whereas an increased number of PDGFRα+ve OPCs was observed in the TrkBfl/fl MBPCre mice. High-power insets in F demonstrate a CC1+/TrkB+ oligodendrocyte in the P12 control image, and a CC1+/TrkB-oligodendrocyte in the P12 TrkB cKO image. Similarly, the high-power insets in I demonstrate a PDGFRα+/TrkB+ OPC in the P12 control image and a PDGFRα+/TrkB-OPC in the P12 TrkB cKO image. Quantitation of the density of TrkB+/CC1+ double-labeled oligodendrocytes (G) and TrkB+/PDGFRα+ double-labeled OPCs (J) in the corpus callosum from P12 to P30. TrkBfl/fl MBPCre mice have significantly fewer TrkB+ oligodendrocytes than controls, whereas the density of TrkB+ OPCs is not significantly different between genotypes. Quantitation of the density of TrkB+/CC1+ double-labeled oligodendrocytes (H) and TrkB+/PDGFRα+ double-labeled OPCs (K) was also performed in the spinal cord from P12 to P30. Similarly, TrkBfl/fl MBPCre mice have significantly fewer TrkB+ oligodendrocytes than controls, but have no significant difference in the density of TrkB+ OPCs. (n = 3/genotype, mean ± SEM, *p < 0.05, **p < 0.01, ***p < 0.001, two-tailed Student's t test and two-way ANOVA.) Scale bar, 150 μm.
To verify the fidelity of the knock-out mice, we first evaluated TrkB expression in the oligodendroglial lineage in vitro via Western blot analysis. Both OPCs and differentiated oligodendrocytes derived from conditional knock-out mice exhibited a significant decrease in TrkB protein expression compared with littermate control (TrkBfl/fl) mice (Fig. 1C; quantitated in Fig. 1D). This was confirmed by qPCR, with a significant decrease in TrkB RNA expression level in the OPCs and differentiated oligodendrocytes from the conditional knock-out mice compared with controls (Fig. 1E). As was observed with protein expression, a significantly greater reduction in TrkB was observed in differentiated oligodendrocytes compared with OPCs. This is concordant with quantitation of Cre recombinase RNA levels, which revealed significantly greater expression in oligodendrocytes than OPCs (data not shown). To investigate the extent of TrkB deletion in oligodendroglia from different CNS regions in vivo, we immunostained the corpus callosum and spinal cord with antibodies directed against TrkB and either the oligodendrocyte-specific marker CC1 or the OPC-specific marker PDGFRα, and quantitated the number of double-labeled cells. In the corpus callosum, the number of oligodendrocytes expressing TrkB was significantly reduced in TrkBfl/fl MBPCre mice compared with controls during development (Fig. 1F). Quantitatively, TrkBfl/fl MBPCre mice exhibited a significant (∼50%) decrease in the density of TrkB-expressing oligodendrocytes compared with controls during development, from P12 to P30 (Fig. 1G). In contrast, analysis showed that no significant difference was observed in the density of OPCs expressing TrkB between the genotypes (Fig. 1I; quantitated in Fig. 1J). Analyses of the ventral white matter tract of the lumbar spinal cord revealed statistically similar observations. In the spinal cord, the density of TrkB-expressing oligodendrocytes was reduced by ∼50% in the TrkBfl/fl MBPCre mice compared with control mice during development (quantified in Fig. 1H); however, the density of TrkB-expressing OPCs remained similar between the two genotypes (quantified in Fig. 1K).
TrkBfl/fl MBPCre mice exhibit fewer myelin wraps
To investigate the influence of reduced oligodendroglial TrkB expression upon CNS myelination, we first assessed myelin protein expression in the brain and spinal cord. For the brain, the corpus callosum and cerebral cortex were dissected out from cerebrum; for the spinal cord, the whole lumbar enlargement was isolated. Western blot analyses of corpus callosum showed a significant decrease in the expression of myelin proteins MBP and MOG in lysates derived from TrkBfl/fl MBPCre mice compared with controls during development, from P12 to P30 (Fig. 2A; quantitated in Fig. 2B,C). In the spinal cord, a similar decrease in MBP expression was observed in TrkBfl/fl MBPCre mice; however, no significant difference was detected in the expression of MOG (Fig. 2G; quantitated in Fig. 2H,I).
Figure 2.
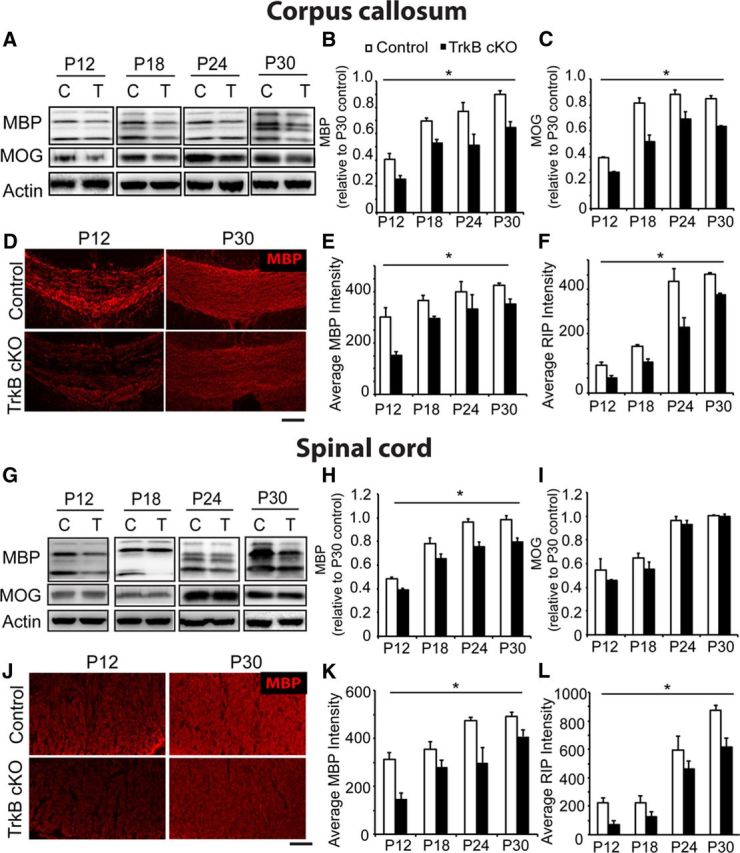
TrkBfl/fl MBPCre mice exhibited significantly reduced myelination during development. A, Western blot including (B, C) densitometric analysis of corpus callosum lysates derived from P12 to P30 TrkBfl/fl MBPCre (T) and control (C) mice and probed for myelin proteins MBP and MOG, with actin as a loading control. Both MBP and MOG expression are significantly reduced in TrkBfl/fl MBPCre mice compared with controls. D, Coronal sections of corpus callosum from TrkBfl/fl MBPCre and control mice at P12 and 30 immunolabeled for MBP. The corpus callosum from TrkBfl/fl MBPCre mice show reduced intensity of staining compared with littermate controls. Quantitation of the average fluorescence intensity of corpus callosum sections from P12 to P30 mice stained with MBP (E) and RIP (F) reveals that TrkBfl/fl MBPCre mice have a significant reduction in myelination. Similar analyses were performed on the spinal cord. G, Western blot and (H, I) densitometric analysis of lumbar spinal cord lysates derived from P12 to P30 TrkBfl/fl MBPCre and control mice and probed for myelin proteins MBP and MOG, with actin as a loading control. MBP expression was significantly reduced in TrkBfl/fl MBPCre mice compared with controls, whereas MOG expression was similar between the two genotypes. J, Transverse sections of ventral white matter tract from the lumbar spinal cord of TrkBfl/fl MBPCre and control mice at P12 and 30 immunolabeled for MBP. The TrkBfl/fl MBPCre spinal cords show reduced intensity of staining compared with controls. Quantitation of the average fluorescence intensity of the ventral white matter tract from P12 to P30 stained with MBP (K) and RIP (L) revealed that TrkBfl/fl MBPCre mice have a significant reduction in myelination. (n = 3/genotype, mean ± SEM, *p < 0.05, two-way ANOVA.) Scale bar, 150 μm.
To investigate the influence upon myelination, sections of corpus callosum and spinal cord were stained with antibodies directed against MBP. Analysis of average fluorescence in the corpus callosum revealed that TrkBfl/fl MBPCre mice exhibited a significant decrease in myelination during development (Fig. 2D; quantitated in Fig. 2E). To verify this, additional sections were stained for the myelin markers RIP and fluoromyelin. Analysis of these myelin stains also revealed a significant reduction in both RIP (Fig. 2F) and fluoromyelin fluorescence (data not shown) compared with controls. Therefore, analysis of fluorescence of three independent myelin markers revealed a significant decrease in corpus callosum myelination during development (average decrease from P12 to P30: ∼27% in MBP, ∼40% in RIP, and ∼30% in fluoromyelin; data not shown). In the ventral white matter tract of the lumbar spinal cord, analysis of average MBP fluorescence revealed that TrkBfl/fl MBPCre mice exhibited a significant decrease in myelination during development (Fig. 2J; quantitated in Fig. 2K). Additional sections stained for RIP (Fig. 2L) and fluoromyelin (data not shown) also revealed a similar reduction. Therefore, quantitation of the fluorescence of three independent myelin markers revealed a significant decrease in spinal cord myelination during development (average decrease from P12 to P30: ∼40% decrease in MBP, ∼36% decrease in RIP, ∼17% in fluoromyelin; data not shown).
To investigate whether the decreased myelination was due to fewer axons being myelinated or an overall decrease in myelin thickness, we undertook an ultrastructural analysis of myelinated axons in the ventrolateral white matter tract of the lumbar spinal cord at P12. The proportion of axons that were myelinated in TrkBfl/fl MBPCre mice appeared indistinguishable from controls (Fig. 3A). Quantitation revealed that the percentage of myelinated axons in TrkBfl/fl MBPCre mice was indistinguishable from controls (93.93 ± 2.11%, TrkBfl/fl MBPCre: 90.97 ± 1.83%). Further analysis of the myelinated axons as a function of axonal diameter revealed a similar distribution between the genotypes (Fig. 3B), indicating that the hypomyelinating phenotype was not due to fewer axons being myelinated or a particular influence upon a subset of axons. In contrast, analysis of the G-ratio, that is the ratio of axonal diameter to fiber diameter (axon and myelin), revealed a higher percentage of axons exhibiting an increased G-ratio in the TrkBfl/fl MBPCre mice (Fig. 3A; average G-ratio of control: 0.724 ± 0.01, TrkBfl/fl MBPCre: 0.819 ± 0.01; quantified in Fig. 3C), suggesting a decrease in the average myelin thickness within the myelinated axons of the TrkBfl/fl MBPCre mice. We also investigated whether the reduced myelination influenced the axon diameter but found that the TrkBfl/fl MBPCre mice exhibited the same axon diameter distribution to control mice (Fig. 3A; quantified in Fig. 3D). Overall, these data indicate that oligodendrocytes in the TrkBfl/fl MBPCre mice initially contact axons and commence myelination normally but exhibit comparatively thinner myelin compared with controls at this developmental time point, suggesting subsequent ensheathment and regulation of myelin thickness is attenuated.
Figure 3.

TrkBfl/fl MBPCre exhibited thinner myelin sheath in the CNS. A, Representative electron microscopy micrographs (3000× and 10,000×) of lumbar ventral spinal cord from TrkBfl/fl MBPCre and control (TrkBfl/fl) mice at P12. The TrkBfl/fl MBPCre axons appear wrapped by thinner layers of myelin compared with littermate controls. B, Quantification of the percentage of axons that are myelinated in relation to axonal diameter at P12. No difference in the percentage of axons that are myelinated across the range of axonal diameters was observed between the two genotypes. C, Graphical representation of the G-ratio of individual fibers in relation to axon diameter (presented as scatter plots) at P12. TrkBfl/fl MBPCre mice exhibited an increase in G-ratio (dark blue), indicative of decreased myelin thickness, compared with littermate controls (light blue). Dark lines represent the linear regression line for each dataset. D, Quantification of the proportion of axons in relation to axon diameter at P12 reveals a similar distribution of axonal diameter between TrkBfl/fl MBPCre and control mice. E, Coronal sections of corpus callosum from TrkBfl/fl MBPCre and control mice at P12 and 30 immunolabeled for CC1+ oligodendrocytes. The corpus callosum from TrkBfl/fl MBPCre mice show a similar number of oligodendrocytes compared with littermate controls. F, Quantitation of the density of CC1+ cells in corpus callosum sections from P12 to P30 mice reveals that TrkBfl/fl MBPCre mice have a similar number of oligodendrocytes compared with control mice. G, Similar analysis in the lumbar spinal cord also revealed no difference in the density of CC1+ oligodendrocytes in the TrkBfl/fl MBPCre mice compared with controls. (n = 3/genotype, mean ± SEM, two-way ANOVA.) Scale bar, 100 μm.
To investigate whether a change in the number of oligodendrocytes was contributing to the decreased myelination observed, we next assessed the number of CC1+ oligodendrocytes in TrkBfl/fl MBPCre and littermate control mice. Quantitation of the number of CC1+ oligodendrocytes in the midline corpus callosum (Fig. 3E; quantified in Fig. 3F) and lumbar spinal cord (quantified in Fig. 3G) white matter tracts at P12, 18, 24, and 30 detected no significant difference in oligodendrocyte density between the two genotypes. Collectively, these data suggest that the hypomyelination observed in the TrkBfl/fl MBPCre mice was not due to an absolute change in oligodendrocyte differentiation or number, nor a change in the capacity of oligodendrocytes to contact axons and initiate myelination, but rather specifically affected the capacity of oligodendrocytes to elongate processes to fully ensheath axons and to myelinate to their full extent.
To investigate whether the decreased myelination persisted in older mice, we undertook the same analyses of myelin protein expression and myelination of white matter tracts at 2, 6, and 12 months of age. Analysis of myelin protein (MBP and MOG) expression in the corpus callosum (Fig. 4A; quantified in Fig. 4B,C) and lumbar spinal cord (Fig. 4G; quantified in Fig. 4H,I) showed no change in expression levels compared with controls. Analysis of corpus callosum sections for MBP (Fig. 4D; quantified in Fig. 4E), RIP (quantified in Fig. 4F), and fluoromyelin (data not shown) at 2, 6, and 12 months of age revealed no change in fluorescence intensity compared with controls. Similarly, analysis of lumbar spinal cord MBP (Fig. 4J; quantified in Fig. 4K), RIP (quantified in Fig. 4L), and fluoromyelin (data not shown) levels revealed no differences compared with controls.
Figure 4.
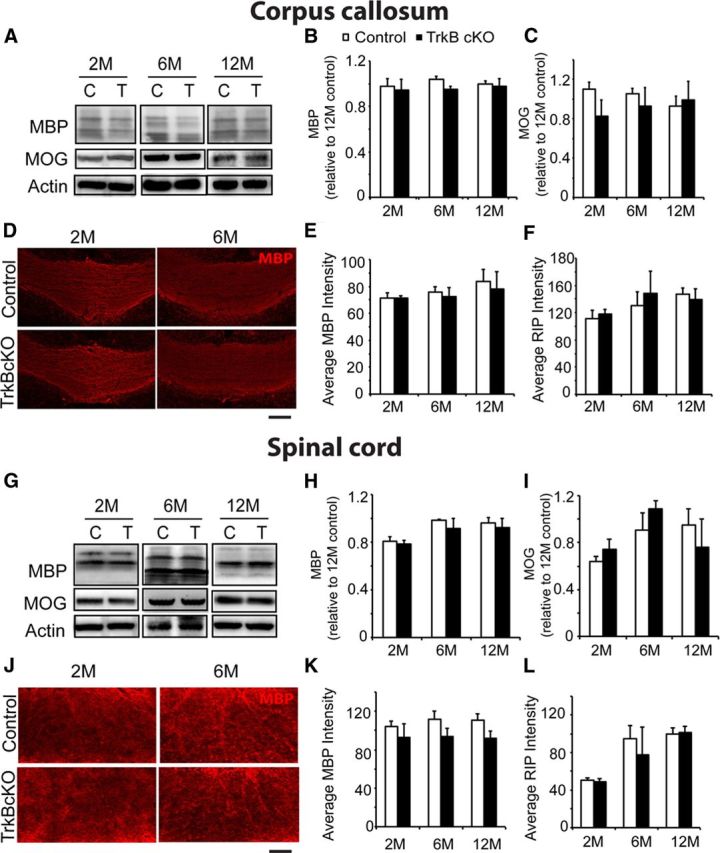
Myelination is normal in adult TrkBfl/fl MBPCre mice. A, Western blot including (B, C) densitometric analysis of corpus callosum lysates derived from 2-, 6-, and 12-month-old TrkBfl/fl MBPCre (T) and control (C) mice and probed for myelin proteins MBP and MOG, with actin as a loading control. MBP and MOG expression are similar between the genotypes. D, Coronal sections of corpus callosum from TrkBfl/fl MBPCre and control mice at 2 and 6 months of age immunolabeled for MBP. The corpus callosum from TrkBfl/fl MBPCre mice show similar intensity of staining compared with littermate controls. Quantitation of the average fluorescence intensity of corpus callosum sections from 2- to 12-month-old mice stained with MBP (E) and RIP (F) reveals normalization of myelination in TrkBfl/fl MBPCre mice compared with controls. Similar analyses were performed on the spinal cord of adult mice. G, Western blot and (H, I) densitometric analysis of lumbar spinal cord lysates derived from 2-, 6-, and 12-month-old TrkBfl/fl MBPCre and control mice and probed for myelin proteins MBP and MOG. The expression of MBP and MOG is similar between the genotypes. J, Transverse sections of ventral white matter tract from the lumbar spinal cord of TrkBfl/fl MBPCre and control mice at 2 and 6 months of age immunolabeled for MBP. The TrkBfl/fl MBPCre mice show similar intensity of MBP staining compared with littermate controls. Quantitation of the average fluorescence intensity of lumbar spinal cord sections from 2-, 6-, and 12-month-old mice stained with MBP (K) and RIP (L) also shows no statistical difference in myelination between TrkBfl/fl MBPCre and control mice. (n = 3/genotype, mean ± SEM, two-way ANOVA.) Scale bar, 150 μm.
Collectively these data suggest that oligodendrocyte-expressed TrkB receptors play a specific role in oligodendrocyte myelination during development. Loss of TrkB in oligodendrocytes does not affect axonal contact or the initial stages of myelination, but appears to selectively affect subsequent process extension. This influence is limited to development, as by ∼2 months of age myelination of white matter tracts in these mice was indistinguishable from controls.
TrkB indirectly influences OPC proliferation
We also examined the number of PDGFRα+ OPCs in the corpus callosum and lumbar spinal cord in TrkBfl/fl MBPCre and control mice. Interestingly, immunohistochemical analyses of corpus callosum revealed a significant increase in the density of PDGFRα+ OPCs in TrkBfl/fl MBPCre mice compared with controls (Fig. 5A; quantitated Fig. 5B). A significant increase was also observed in the lumbar spinal cord (quantified in Fig. 5C).
Figure 5.

Reduced TrkB expression in OPCs increases proliferation in vitro. A, Coronal sections of corpus callosum from TrkBfl/fl MBPCre and control mice at P12 immunolabeled for PDGFRα+ OPCs. The corpus callosum from TrkBfl/fl MBPCre mice show an increase in the density of OPCs compared with littermate controls. B, Quantitation of the density of PDGFRα+ cells in corpus callosum sections from P12 to P30 mice reveals that TrkBfl/fl MBPCre mice have a significantly higher density of OPCs than controls. C, Quantification of the PDGFRα+ cell density in the lumbar spinal cord sections from P12 to P30 also reveals a significant increase in the OPC density in the TrkBfl/fl MBPCre mice. Scale bar, 100 μm. D, E, Quantitation of BrdU proliferation assays from in vitro cocultures seeded with naive, scramble, or TrkB knockdown-infected OPCs after 24 and 48 h. D, Scramble-infected OPCs exhibit the same proportion of Olig2+ oligodendroglia colabeled with BrdU as naive OPCs. In contrast, TrkB knockdown-infected OPCs exhibit a significantly greater proportion of Olig2+ oligodendroglia colabeled with BrdU, indicative of increased proliferation. E, The total number of Olig2+ oligodendroglia was consequently greater in the cocultures seeded with TrkB knockdown OPCs after 24 and 48 h. F, qPCR analysis for TrkB and TrkC mRNA expression in isolated OPC cultures 48 h after infection with scramble and TrkB knockdown virus. Following TrkB knockdown, TrkB mRNA expression significantly decreased, whereas no significant change in TrkC mRNA expression was observed compared with scramble-infected cultures. G, Quantitation of BrdU proliferation assays from in vitro cocultures seeded with naive, scramble, or TrkB knockdown-infected OPCs after 48 h. Assays were either untreated (control), treated with a control antibody (IgG, 2 μg/ml), or treated with a TrkC blocking antibody (TrkC IgG, 2 μg/ml). The control antibody exerted no influence on the proportion of Olig2+ oligodendroglia that had incorporated BrdU. In contrast, addition of the TrkC blocking antibody selectively blocked BrdU incorporation in the TrkB knockdown OPCs, but not the naive or scramble OPCs. H, Quantitation of BrdU proliferation assays from in vitro cocultures seeded with either naive OPCs or OPCs subjected to infection with scramble, TrkB alone (TrkB kd), p75 alone (p75 kd), or combined TrkB and p75 (TrkB p75 kd) knockdown viruses after 48 h. Assays were either untreated (control) or treated with NT3 (5 ng/ml). NT3 increased the proliferation of naive and scramble-infected OPCs. TrkB kd OPCs exhibited increased proliferation under control conditions and exogenous NT3 exerted no additive effect. While p75 kd OPCs proliferated normally under basal conditions, they did not increase their proliferation in response to exogenous NT3. OPCs subjected to both TrkB and p75 knockdown did not increase their proliferation under control conditions nor increased their proliferative response to NT3. This indicates that p75 is required for both the proliferative response following TrkB knockdown and after addition of NT3. (n = 3/group, n = 5/group in F, mean ± SEM, *p < 0.05, two-tailed Student's t test and two-way ANOVA.)
Interestingly, we had observed that the number of TrkB+ OPCs in the TrkBfl/fl MBPCre mice was the same as controls (Fig. 1I–K). Our data indicate that the increased density of PDGFRα+ OPCs in the TrkBfl/fl MBPCre mice was due to a specific increase in the density of TrkB− OPCs. This observation raises the possibility that this increased number of OPCs is an indirect consequence of specific deletion of TrkB expression in OPCs. The parsimonious view of these observations is that the hypomyelinating phenotype resulted in an endogenous proliferative influence upon the OPCs, and that the magnitude of this influence was dependent upon the level of TrkB expression among the progenitor cells.
To assess this influence directly, we studied the consequence that the loss of TrkB exerted on OPC proliferation in vitro by inducing TrkB knockdown in these cells using a viral-based shRNA approach. In isolated OPC cultures, infection with shRNA lentivirus directed against TrkB resulted in a 65% reduction in TrkB expression, as assessed by quantitation of Western blot bands (data not shown). Infection with a scrambled control shRNA exerted no influence on TrkB expression levels (data not shown). To formally assess OPC proliferation, we undertook BrdU proliferation assays on naive, scramble, and TrkB knockdown OPCs, in coculture with DRG neurons. These data revealed that knockdown of TrkB in OPCs increased their proliferation, as the proportion of Olig2+ oligodendroglia that incorporated BrdU significantly increased compared with naive and scramble infected OPCs after 24 and 48 h (Fig. 5D) and the total number of Olig2+ oligodendroglia was also potentiated (Fig. 5E). These data indicated the loss of TrkB in OPCs promoted their proliferation.
OPC proliferation is dependent upon NT3 signaling
We next investigated the mechanism of the proliferative effect in OPCs following TrkB knockdown. In addition to TrkB, OPCs also express the neurotrophin receptors TrkC and p75. Interestingly, TrkC is known to exert a proliferative effect upon OPCs (Barres et al., 1993). One mechanism that could account for the increased OPC proliferation following TrkB knockdown is a compensatory increase in TrkC expression. However, a qPCR analysis on naive, scramble-infected, and TrkB shRNA-infected OPCs revealed no significant change in TrkC RNA levels (Fig. 5F).
An alternative hypothesis to account for the proliferative effect is that following TrkB knockdown, additional TrkC-p75 high-affinity receptor complexes increase TrkC signaling. To test this, we added a TrkC blocking antibody in the coculture assays and found that it exerted no influence upon the proliferation of naive or scramble-infected OPCs, but that it significantly decreased the proliferation in TrkB knockdown OPCs (Fig. 5G). These data suggest that TrkC signaling was mediating the increased proliferation observed following TrkB knockdown.
We also assessed whether p75 expression was required for the proliferative effect. OPCs were subjected to TrkB and/or p75 knockdown, and their proliferation was determined in response to exogenous NT3 after 48 h. NT3 significantly increased proliferation of naive and scramble-infected OPCs. TrkB knockdown OPCs exhibited significantly increased proliferation, but NT3 exerted no additive effect (Fig. 5H). The p75 knockdown OPCs proliferated normally, but also failed to increase their proliferation in response to NT3, suggesting that p75 is critical to the NT3-induced proliferative effect. Importantly, the TrkB and p75 knockdown OPCs also proliferated normally, but failed to increase proliferation in response to NT3 (Fig. 5H). These results indicate that the expression of p75 is required for OPC proliferation following TrkB knockdown. Collectively, the induction of proliferation observed following TrkB knockdown could be ameliorated by inhibition of TrkC signaling and knockdown of p75 expression, suggesting the proliferation is mediated by TrkC and p75 expression.
Discussion
In this study we have identified that TrkB exerts a distinct influence upon CNS myelination. The in vivo examination of TrkBfl/fl MBPCre mice revealed decreased myelin protein expression and decreased myelination of CNS white matter tracts, indicating a hypomyelinating phenotype in these mice. While cellular analysis showed normal numbers of postmitotic mature oligodendrocytes, ultrastructural examination of single axons revealed that while TrkBfl/fl MBPCre mice exhibited a normal number of myelinated axons, the significant decrease in myelination was selectively due to reduced myelin thickness during development. This indicates that TrkB exerts a direct and distinct effect upon oligodendrocytes to govern myelin membrane extension and ensheathment of axons in vivo. Interestingly, TrkBfl/fl MBPCre mice also displayed an increase in OPC density in white matter tracts. Our in vitro data strongly suggested that this was an indirect effect of the loss of TrkB in OPCs, resulting in augmented TrkC-dependent proliferative signals. Collectively, these data indicate that TrkB exerts differential effects upon the oligodendroglial lineage, indirectly tempering TrkC-induced proliferation of OPCs and directly regulating oligodendrocyte myelin thickness by promoting myelin membrane extension and ensheathment.
The role of oligodendroglial TrkB in CNS myelination in vivo
Our data clearly demonstrate the importance of oligodendrocyte-expressed TrkB in CNS myelination. Analysis of BDNF knock-out mice has revealed CNS hypomyelination; however, due to their failure to thrive, poor health, and early postnatal lethality, they have ultimately proved to have limited utility for detailed examination of myelin development (Cellerino et al., 1997; Djalali et al., 2005). Investigation of BDNF heterozygote mice, which have a normal life span, has revealed a reduction of myelin protein expression in the forebrain and myelination in the spinal cord, optic nerve, and corpus callosum (Vondran et al., 2010; Xiao et al., 2010). This indicated that BDNF was clearly exerting a positive effect upon myelination; however, it remained unclear whether this was primarily a neuronal or oligodendroglial-mediated effect. In this regard, analysis of the influence that BDNF exerted on oligodendrocytes in vitro provided some insight. Studies have identified that BDNF is not required for the survival, proliferation, or differentiation of OPCs from the optic nerve and cortex (Barres et al., 1993; Xiao et al., 2010). However, in vitro analyses of basal forebrain-derived OPCs reveal that BDNF increases their proliferation as well as their differentiation into mature oligodendrocytes (Du et al., 2006; Dugas et al., 2006). The reason for this diversity in response of oligodendroglia to BDNF in vitro is unclear, but could be due to regional differences and heterogeneity of progenitor populations of the cells analyzed. Alternatively, the nature of the influence that BDNF exerts on OPCs in vitro could be dependent on the culture conditions.
It is uniformly accepted that BDNF exerts its effects on oligodendroglia via activation of TrkB receptors (Du et al., 2003; 2006; Van't Veer et al., 2009; Xiao et al., 2010). As the TrkB knock-out mouse is neonatal lethal (Klein et al., 1993), this necessitated the use of a conditional TrkB deletion strategy to investigate the precise influence that TrkB signaling exerted upon myelination in vivo. Analysis of our TrkBfl/fl MBPCre mice demonstrate clear myelin deficits, indicating the influence the BDNF exerted upon myelination was direct and mediated via oligodendrocyte expressed TrkB receptors. Specifically, our data revealed thinner myelin sheaths, which from first principles must also reflect a reduction in the number of paranodal loops. However, despite deficits in myelin development being clearly evident, by 2 months of age myelination in the TrkBfl/fl MBPCre mice had normalized. The precise reason for this is unclear. Ultimately CNS myelination is orchestrated by an unknown number of extracellular influences (Emery, 2010; Taveggia et al., 2010), and the removal of the TrkB receptor may be insufficient to halt the process, however sufficient to reduce the intracellular signaling cascades that regulate the myelin program. As a consequence the kinetics of the myelin program may slow down and delay myelination. Interestingly, the developmental profile of TrkB expression in oligodendroglia is dynamic. The mRNA for TrkB is relatively high in OPCs, decreases as cells progress through the oligodendroglial lineage, and is lowest in myelinated oligodendrocytes (Cahoy et al., 2008). In addition, we have observed that oligodendroglial TrkB immunoreactivity is significantly lower in aged mice (data not shown). As a consequence, the influence TrkB exerts could be most relevant during development when it is most highly expressed. Thus the influence of TrkB could be highly developmentally regulated, such that as mice mature other influences expedite and normalize myelination in the TrkBfl/fl MBPCre mice. Thus the most parsimonious view, consistent with the downregulation of TrkB in oligodendroglia in adult mice, could be that the developmental specificity of the phenotype reflects the developmental regulation of the expression of TrkB by these cells. Alternatively, as our analysis revealed that some oligodendrocytes failed to undergo recombination in the TrkBfl/fl MBPCre mice, as more OPCs differentiate into oligodendrocytes more may escape recombination, thus myelin could have proceeded normally albeit in a significantly delayed manner. Regardless of the reason, our data clearly point to a key role played by TrkB expressed by oligodendrocytes in promoting CNS myelination.
Importantly, our strategy to selectively delete TrkB from oligodendroglia is the first to unequivocally identify a clear role for TrkB in mediating CNS myelination. Other studies have implicated TrkB in regulating CNS myelination; however, these have been confounded by deletion of the receptor in multiple cell types. For example, targeted deletion of TrkB by the nestin promoter showed significant reduction in cortical myelin expression (MBP and CNPase), the number of myelinated axons, and the thickness of myelin sheath in the corpus callosum (Medina et al., 2004). However, interpretation of the cause of the myelin deficit in the experiments is confounded by deletion of TrkB in neurons and glial precursors. Mice in which TrkB has been conditionally deleted from forebrain neurons (via the CaMKII promoter) and from neural precursors and astrocytes (via the GFAP promoter) have not been reported to have any CNS myelin deficits (Minichiello et al., 1999; Li et al., 2008). While these mice have provided insight into the role of TrkB in formation of the neocortex as well as hippocampal learning and neurogenesis, they provide no support for a role of neuronally expressed TrkB receptors in regulating CNS myelination. This corroborates our view that the key influence that TrkB exerts in promoting CNS myelination is specific to oligodendroglia.
We demonstrated that the loss of TrkB in OPCs resulted in a cell-autonomous effect that leads to increased OPC proliferation, putatively via the formation of TrkC-p75 high-affinity receptor complexes. Multiple neurotrophins, including NT3, the cognate ligand for TrkC, are expressed by CNS neurons in vivo and DRG neurons and OPCs in vitro. High-affinity neurotrophin signaling can increase the magnitude and duration of Trk signaling, and potentially account for the increased proliferation of OPCs in our assays (Verdi and Anderson, 1994; Twiss et al., 1998; Wong et al., 2008). Thus, ultimately the in vitro and in vivo observations of increased OPC proliferation are concordant. However, the increased density of OPCs in our TrkBfl/fl MBPCre mice raises an unresolved issue: What is the ultimate fate of these OPCs? Our data indicate that these mice exhibit normal numbers of postmitotic (CC1+) oligodendrocytes, which suggests these OPCs either do not differentiate or that innate mechanisms that control total oligodendrocyte number in the CNS kick in to remove the excess.
The finding that TrkB exerts a key influence in promoting oligodendrocyte myelination invites speculation about the signaling mechanisms required. TrkB is a canonical receptor tyrosine kinase that initiates a number of well characterized signaling pathways such as Shc-Ras-Erk (MAPK/Erk), PI3K/Akt, and PLC-γ pathways (Huang and Reichardt, 2003). Interestingly, some of these pathways have been implicated in regulating myelination. The expression of constitutively active Akt in OPCs and oligodendrocytes (via the PLP promoter) exerted no influence on oligodendrocyte number, but dramatically increased myelin thickness (Flores et al., 2008; Narayanan et al., 2009). Importantly, and relevant to the phenotype of our TrkBfl/fl MBPCre mice, oligodendroglial deletion of Erk1 and Erk2 revealed normal OPC proliferation, survival, and differentiation, as well as normal initial ensheathment of axons, but the subsequent increase in myelin thickness and myelination failed to occur (Fyffe-Maricich et al., 2011; Ishii et al., 2012). Indeed, we have recently demonstrated that that Erk1/2 appears to play a critical role in mediating the promyelinating influence of BDNF in vitro (Xiao et al., 2012). Collectively, these data suggest a mechanism wherein BDNF, signaling through oligodendrocyte-expressed TrkB, could be a key factor in influencing myelin thickness through Erk1/2 activation, at least in the developmental context, in vivo.
In summary, we demonstrate that selective deletion of TrkB in oligodendroglia exerts differential effects upon OPCs and oligodendrocytes. Our data indicate that TrkB exerts important and independent effects that indirectly influence OPC proliferation and perhaps more importantly directly promotes oligodendrocyte myelination, specifically regulating myelin membrane extension and myelin thickness during postnatal development in vivo.
Footnotes
This work was supported by the Australian National Health and Medical Research Council grants (#454330, #628761, #569575), Multiple Sclerosis Research Australia grants, National Multiple Sclerosis Society (U.S.) Grant #RG 4309A5/2, the University of Melbourne, and the Victorian Government Operational Infrastructure Support Program.
The authors declare no competing financial interests.
References
- Barres BA, Schmid R, Sendnter M, Raff MC. Multiple extracellular signals are required for long-term oligodendrocyte survival. Development. 1993;118:283–295. doi: 10.1242/dev.118.1.283. [DOI] [PubMed] [Google Scholar]
- Baumann N, Pham-Dinh D. Biology of oligodendrocyte and myelin in the mammalian central nervous system. Physiol Rev. 2001;81:871–927. doi: 10.1152/physrev.2001.81.2.871. [DOI] [PubMed] [Google Scholar]
- Brinkmann BG, Agarwal A, Sereda MW, Garratt AN, Müller T, Wende H, Stassart RM, Nawaz S, Humml C, Velanac V, Radyushkin K, Goebbels S, Fischer TM, Franklin RJ, Lai C, Ehrenreich H, Birchmeier C, Schwab MH, Nave KA. Neuregulin-1/ErbB signaling serves distinct functions in myelination of the peripheral and central nervous system. Neuron. 2008;59:581–595. doi: 10.1016/j.neuron.2008.06.028. [DOI] [PMC free article] [PubMed] [Google Scholar]
- Cahoy JD, Emery B, Kaushal A, Foo LC, Zamanian JL, Christopherson KS, Xing Y, Lubischer JL, Krieg PA, Krupenko SA, Thompson WJ, Barres BA. A transcriptome database for astrocytes, neurons, and oligodendrocytes: a new resource for understanding brain development and function. J Neurosci. 2008;28:264–278. doi: 10.1523/JNEUROSCI.4178-07.2008. [DOI] [PMC free article] [PubMed] [Google Scholar]
- Câmara J, Wang Z, Nunes-Fonseca C, Friedman HC, Grove M, Sherman DL, Komiyama NH, Grant SG, Brophy PJ, Peterson A, ffrench-Constant C. Integrin-mediated axoglial interactions initiate myelination in the central nervous system. J Cell Biol. 2009;185:699–712. doi: 10.1083/jcb.200807010. [DOI] [PMC free article] [PubMed] [Google Scholar]
- Cellerino A, Carroll P, Thoenen H, Barde YA. Reduced size of retinal ganglion cell axons and hypomyelination in mice lacking brain-derived neurotrophic factor. Mol Cell Neurosci. 1997;9:397–408. doi: 10.1006/mcne.1997.0641. [DOI] [PubMed] [Google Scholar]
- Chan JR, Watkins TA, Cosgaya JM, Zhang C, Chen L, Reichardt LF, Shooter EM, Barres BA. NGF controls axonal receptivity to myelination by Schwann cells or oligodendrocytes. Neuron. 2004;43:183–191. doi: 10.1016/j.neuron.2004.06.024. [DOI] [PMC free article] [PubMed] [Google Scholar]
- Chen Y, Wu H, Wang S, Koito H, Li J, Ye F, Hoang J, Escobar SS, Gow A, Arnett HA, Trapp BD, Karandikar NJ, Hsieh J, Lu QR. The oligodendrocyte-specific G protein-coupled receptor GPR17 is a cell-intrinsic timer of myelination. Nat Neurosci. 2009;12:1398–1406. doi: 10.1038/nn.2410. [DOI] [PMC free article] [PubMed] [Google Scholar]
- Colognato H, Galvin J, Wang Z, Relucio J, Nguyen T, Harrison D, Yurchenco PD, Ffrench-Constant C. Identification of dystroglycan as a second laminin receptor in oligodendrocytes, with a role in myelination. Development. 2007;134:1723–1736. doi: 10.1242/dev.02819. [DOI] [PubMed] [Google Scholar]
- Djalali S, Höltje M, Grosse G, Rothe T, Stroh T, Grosse J, Deng DR, Hellweg R, Grantyn R, Hörtnagl H, Ahnert-Hilger G. Effects of brain-derived neurotrophic factor (BDNF) on glial cells and serotonergic neurones during development. J Neurochem. 2005;92:616–627. doi: 10.1111/j.1471-4159.2004.02911.x. [DOI] [PubMed] [Google Scholar]
- Du Y, Fischer TZ, Lee LN, Lercher LD, Dreyfus CF. Regionally specific effects of BDNF on oligodendrocytes. Dev Neurosci. 2003;25:116–126. doi: 10.1159/000072261. [DOI] [PubMed] [Google Scholar]
- Du Y, Lercher LD, Zhou R, Dreyfus CF. Mitogen-activated protein kinase pathway mediates effects of brain-derived neurotrophic factor on differentiation of basal forebrain oligodendrocytes. J Neurosci Res. 2006;84:1692–1702. doi: 10.1002/jnr.21080. [DOI] [PubMed] [Google Scholar]
- Dugas JC, Tai YC, Speed TP, Ngai J, Barres BA. Functional genomic analysis of oligodendrocyte differentiation. J Neurosci. 2006;26:10967–10983. doi: 10.1523/JNEUROSCI.2572-06.2006. [DOI] [PMC free article] [PubMed] [Google Scholar]
- Emery B. Regulation of oligodendrocyte differentiation and myelination. Science. 2010;330:779–782. doi: 10.1126/science.1190927. [DOI] [PubMed] [Google Scholar]
- Emery B, Cate HS, Marriott M, Merson T, Binder MD, Snell C, Soo PY, Murray S, Croker B, Zhang JG, Alexander WS, Cooper H, Butzkueven H, Kilpatrick TJ. Suppressor of cytokine signaling 3 limits protection of leukemia inhibitory factor receptor signaling against central demyelination. Proc Natl Acad Sci U S A. 2006;103:7859–7864. doi: 10.1073/pnas.0602574103. [DOI] [PMC free article] [PubMed] [Google Scholar]
- Flores AI, Narayanan SP, Morse EN, Shick HE, Yin X, Kidd G, Avila RL, Kirschner DA, Macklin WB. Constitutively active Akt induces enhanced myelination in the CNS. J Neurosci. 2008;28:7174–7183. doi: 10.1523/JNEUROSCI.0150-08.2008. [DOI] [PMC free article] [PubMed] [Google Scholar]
- Furusho M, Kaga Y, Ishii A, Hébert JM, Bansal R. Fibroblast growth factor signaling is required for the generation of oligodendrocyte progenitors from the embryonic forebrain. J Neurosci. 2011;31:5055–5066. doi: 10.1523/JNEUROSCI.4800-10.2011. [DOI] [PMC free article] [PubMed] [Google Scholar]
- Fyffe-Maricich SL, Karlo JC, Landreth GE, Miller RH. The ERK2 mitogen-activated protein kinase regulates the timing of oligodendrocyte differentiation. J Neurosci. 2011;31:843–850. doi: 10.1523/JNEUROSCI.3239-10.2011. [DOI] [PMC free article] [PubMed] [Google Scholar]
- Givogri MI, Costa RM, Schonmann V, Silva AJ, Campagnoni AT, Bongarzone ER. Central nervous system myelination in mice with deficient expression of Notch1 receptor. J Neurosci Res. 2002;67:309–320. doi: 10.1002/jnr.10128. [DOI] [PubMed] [Google Scholar]
- He XP, Kotloski R, Nef S, Luikart BW, Parada LF, McNamara JO. Conditional deletion of TrkB but not BDNF prevents epileptogenesis in the kindling model. Neuron. 2004;43:31–42. doi: 10.1016/j.neuron.2004.06.019. [DOI] [PubMed] [Google Scholar]
- Huang EJ, Reichardt LF. Trk receptors: roles in neuronal signal transduction. Annu Rev Biochem. 2003;72:609–642. doi: 10.1146/annurev.biochem.72.121801.161629. [DOI] [PubMed] [Google Scholar]
- Ishii A, Fyffe-Maricich SL, Furusho M, Miller RH, Bansal R. ERK1/ERK2 MAPK signaling is required to increase myelin thickness independent of oligodendrocyte differentiation and initiation of myelination. J Neurosci. 2012;32:8855–8864. doi: 10.1523/JNEUROSCI.0137-12.2012. [DOI] [PMC free article] [PubMed] [Google Scholar]
- Káradóttir R, Hamilton NB, Bakiri Y, Attwell D. Spiking and nonspiking classes of oligodendrocyte precursor glia in CNS white matter. Nat Neurosci. 2008;11:450–456. doi: 10.1038/nn2060. [DOI] [PMC free article] [PubMed] [Google Scholar]
- Klein R, Smeyne RJ, Wurst W, Long LK, Auerbach BA, Joyner AL, Barbacid M. Targeted disruption of the trkB neurotrophin receptor gene results in nervous system lesions and neonatal death. Cell. 1993;75:113–122. [PubMed] [Google Scholar]
- Laursen LS, Chan CW, Ffrench-Constant C. Translation of myelin basic protein mRNA in oligodendrocytes is regulated by integrin activation and hnRNP-K. J Cell Biol. 2011;192:797–811. doi: 10.1083/jcb.201007014. [DOI] [PMC free article] [PubMed] [Google Scholar]
- Li Y, Luikart BW, Birnbaum S, Chen J, Kwon CH, Kernie SG, Bassel-Duby R, Parada LF. TrkB regulates hippocampal neurogenesis and governs sensitivity to antidepressive treatment. Neuron. 2008;59:399–412. doi: 10.1016/j.neuron.2008.06.023. [DOI] [PMC free article] [PubMed] [Google Scholar]
- Livak KJ, Schmittgen TD. Analysis of relative gene expression data using real-time quantitative PCR and the 2(-Delta Delta C(T)) Method. Methods. 2001;25:402–408. doi: 10.1006/meth.2001.1262. [DOI] [PubMed] [Google Scholar]
- Medina DL, Sciarretta C, Calella AM, Von Bohlen Und Halbach O, Unsicker K, Minichiello L. TrkB regulates neocortex formation through the Shc/PLCgamma-mediated control of neuronal migration. EMBO J. 2004;23:3803–3814. doi: 10.1038/sj.emboj.7600399. [DOI] [PMC free article] [PubMed] [Google Scholar]
- Minichiello L, Korte M, Wolfer D, Kühn R, Unsicker K, Cestari V, Rossi-Arnaud C, Lipp HP, Bonhoeffer T, Klein R. Essential role for TrkB receptors in hippocampus-mediated learning. Neuron. 1999;24:401–414. doi: 10.1016/s0896-6273(00)80853-3. [DOI] [PubMed] [Google Scholar]
- Narayanan SP, Flores AI, Wang F, Macklin WB. Akt signals through the mammalian target of rapamycin pathway to regulate CNS myelination. J Neurosci. 2009;29:6860–6870. doi: 10.1523/JNEUROSCI.0232-09.2009. [DOI] [PMC free article] [PubMed] [Google Scholar]
- Srinivas S, Watanabe T, Lin CS, William CM, Tanabe Y, Jessell TM, Costantini F. Cre reporter strains produced by targeted insertion of EYFP and ECFP into the ROSA26 locus. BMC Dev Biol. 2001;1:4. doi: 10.1186/1471-213X-1-4. [DOI] [PMC free article] [PubMed] [Google Scholar]
- Stevens B, Porta S, Haak LL, Gallo V, Fields RD. Adenosine: a neuron-glial transmitter promoting myelination in the CNS in response to action potentials. Neuron. 2002;36:855–868. doi: 10.1016/s0896-6273(02)01067-x. [DOI] [PMC free article] [PubMed] [Google Scholar]
- Taveggia C, Feltri ML, Wrabetz L. Signals to promote myelin formation and repair. Nat Rev Neurol. 2010;6:276–287. doi: 10.1038/nrneurol.2010.37. [DOI] [PMC free article] [PubMed] [Google Scholar]
- Twiss JL, Wada HG, Fok KS, Chan SD, Verity AN, Baxter GT, Shooter EM, Sussman HH. Duration and magnitude of nerve growth factor signaling depend on the ratio of p75LNTR to TrkA. J Neurosci Res. 1998;51:442–453. doi: 10.1002/(SICI)1097-4547(19980215)51:4<442::AID-JNR4>3.0.CO;2-C. [DOI] [PubMed] [Google Scholar]
- Van't Veer A, Du Y, Fischer TZ, Boetig DR, Wood MR, Dreyfus CF. Brain-derived neurotrophic factor effects on oligodendrocyte progenitors of the basal forebrain are mediated through trkB and the MAP kinase pathway. J Neurosci Res. 2009;87:69–78. doi: 10.1002/jnr.21841. [DOI] [PMC free article] [PubMed] [Google Scholar]
- Verdi JM, Anderson DJ. Neurotrophins regulate sequential changes in neurotrophin receptor expression by sympathetic neuroblasts. Neuron. 1994;13:1359–1372. doi: 10.1016/0896-6273(94)90421-9. [DOI] [PubMed] [Google Scholar]
- Vondran MW, Clinton-Luke P, Honeywell JZ, Dreyfus CF. BDNF+/− mice exhibit deficits in oligodendrocyte lineage cells of the basal forebrain. Glia. 2010;58:848–856. doi: 10.1002/glia.20969. [DOI] [PMC free article] [PubMed] [Google Scholar]
- Wake H, Lee PR, Fields RD. Control of local protein synthesis and initial events in myelination by action potentials. Science. 2011;333:1647–1651. doi: 10.1126/science.1206998. [DOI] [PMC free article] [PubMed] [Google Scholar]
- Wong AW, Willingham M, Xiao J, Kilpatrick TJ, Murray SS. Neurotrophin receptor homolog-2 regulates nerve growth factor signaling. J Neurochem. 2008;106:1964–1976. doi: 10.1111/j.1471-4159.2008.05539.x. [DOI] [PubMed] [Google Scholar]
- Xiao J, Wong AW, Willingham MM, van den Buuse M, Kilpatrick TJ, Murray SS. Brain-derived neurotrophic factor promotes central nervous system myelination via a direct effect upon oligodendrocytes. Neurosignals. 2010;18:186–202. doi: 10.1159/000323170. [DOI] [PubMed] [Google Scholar]
- Xiao J, Ferner AH, Wong AW, Denham M, Kilpatrick TJ, Murray SS. Extracellular signal-regulated kinase 1/2 signaling promotes oligodendrocyte myelination in vitro. J Neurochem. 2012 doi: 10.1111/j.1471-4159.2012.07871.x. [DOI] [PubMed] [Google Scholar]