

Abstract
Behavioral studies have shown that humans can adapt to conflicting sensorimotor mappings that cause interference after intensive training. While previous research works indicate the involvement of distinct brain regions for different types of motor learning (e.g., kinematics vs dynamics), the neural mechanisms underlying joint adaptation to conflicting mappings within the same type of perturbation (e.g., different angles of visuomotor rotation) remain unclear. To reveal the neural substrates that represent multiple sensorimotor mappings, we examined whether different mappings could be classified with multivoxel activity patterns of functional magnetic resonance imaging data. Participants simultaneously adapted to opposite rotational perturbations (+90° and − 90°) during visuomotor tracking. To dissociate differences in movement kinematics with rotation types, we used two distinct patterns of target motion and tested generalization of the classifier between different combinations of rotation and motion types. Results showed that the rotation types were classified significantly above chance using activities in the primary sensorimotor cortex and the supplementary motor area, despite no significant difference in averaged signal amplitudes within the region. In contrast, low-level sensorimotor components, including tracking error and movement speed, were best classified using activities of the early visual cortex. Our results reveal that the sensorimotor cortex represents different visuomotor mappings, which permits joint learning and switching between conflicting sensorimotor skills.
Introduction
Humans can concurrently learn and switch among various motor skills. There are two kinds of multiple-skill acquisition: one is learning the different types of perturbations, such as kinematics versus dynamics transformation, which involves independent processes in the sense that joint learning of two separate skills does not cause interference (Krakauer et al., 1999). The other type is adaptation to different parameters within the same type of perturbation, such as varying angles of visuomotor rotation, which sometimes induces conflicting interference (Wigmore et al., 2002). For example, people do not confuse riding a bike with driving a car, but they have difficulty in switching between driving on the left and on the right side of the road in different countries. Related to the latter type of adaptation, behavioral experiments have shown successful learning for conflicting force fields (Wada et al., 2003; Osu et al., 2004; Nozaki et al., 2006; Howard et al., 2008) or opposite visuomotor rotations (Cunningham and Welch, 1994; Ghahramani and Wolpert, 1997; Imamizu et al., 2007b; Choi et al., 2008) after intensive training. Another study showed that exposure to various angles of visuomotor rotation induces structural learning (Braun et al., 2009).
Previous literature revealed the involvement of separate brain regions in the learning of different types of perturbation (Imamizu et al., 2003; Krakauer et al., 2004; Girgenrath et al., 2008 for human neuroimaging; Rabe et al., 2009 for a lesion study), which is consistent with behavioral evidence of independent learning as well as the computational theory (Wolpert and Kawato, 1998). In contrast, the neural mechanisms underlying joint adaptation to the multiple parameters within the same types of perturbation remain unclear. To reveal the neural substrates that represent multiple sensorimotor mappings, we used functional magnetic resonance imaging (fMRI) to measure brain activities related to conflicting visuomotor mappings. However, the conventional univoxel fMRI analysis evaluates overall increases in activation of specific regions and would not be sensitive to distributed representations contained in patterns of voxel activity. To overcome this issue, this study used multivoxel pattern analysis (Haynes and Rees, 2005; Kamitani and Tong, 2005; Norman et al., 2006) for examining whether different mappings could be classified with distributed patterns of neural activities.
Using visuomotor tracking, participants simultaneously adapted to two types of visuomotor rotation (i.e., dual adaptation task) in which the cursor position of a joystick was rotated by +90° or −90° around the starting position. After adaptation, we classified the two rotation types during the tracking with the multivariate activity pattern of fMRI. One possible concern is that tracking under different rotation types could be accompanied with differences in movement kinematics, which is a major confound for decoding. We thus used two patterns of target motions by manipulating target velocities (Imamizu et al., 2000, 2003) and tested the classifier generalization between different combinations of rotation and motion types. This cross-validation ensures that the decoding of rotation types is not confounded by differences in low-level kinematics or reafferent sensory inputs associated with the rotational perturbations. Successful classification of rotation types would support the existence of neural substrates representing conflicting visuomotor mappings.
Materials and Methods
Subjects.
Subjects were seven male volunteers with a mean age of 30.0 years (range, 22–49 years). All subjects were right-handed, as assessed by a modified version of the Edinburgh Handedness Inventory (Oldfield, 1971). Written informed consent was obtained from all subjects in accordance with the Declaration of Helsinki. The experimental protocol received approval from the local ethics committee.
Task procedures.
We used a continuous visuomotor tracking task (Imamizu et al., 2000, 2003, 2004, 2007a): subjects moved a small crosshair cursor on the screen with a joystick and continuously tracked a moving target. After a starting message shown for 2 s, target and cursor were presented on the screen. The target was a small green circle on a dark background, which moved around within a square subtending horizontal and vertical visual angles of ∼14°. The cursor was a small yellow cross. We introduced a rotational perturbation between cursor positions and a joystick angle of 90° around the screen center, in either clockwise or counterclockwise direction. During the task block of 21 s, subjects continuously tracked the moving target. A fixation dot was displayed for 4 s during intertrial intervals (ITI) (Fig. 1A). After a practice session to become familiarized with the scanner environment, the subject underwent five sessions, with each consisting of 24 blocks. One session lasted ∼11 min. The block order was counterbalanced as A-B-B-A-A-B-B-A… with A and B pseudorandomly assigned the two rotation types across sessions. Unlike previous studies (Osu et al., 2004), we did not provide visual or auditory cues for different rotation types to equate sensory inputs between conditions.
Figure 1.

A, Time course of experiment. After display of start message for 2 s, target (circle) and cursor (cross) were presented on the screen. Subjects continuously tracked a moving target with cursor using joystick for 21 s, with rotational perturbations of +90° or −90°. Task blocks were interleaved with rest periods of 4 s. B, Examples of target trajectory under different rotation types and velocity types in single block. C, Examples of horizontal positions of target with those of cursor within single block of first (left) and last (right) practice sessions.
Stimuli were presented on a liquid crystal display and projected onto a custom-made viewing screen. Subjects lay supine in the scanner and viewed the screen via a mirror, being unable to see their hand throughout this task. They used their right index and middle fingers to control the joystick, with the right upper arm immobilized using foam pads to minimize body motions. A custom-made bite bar was used for all participants to prevent head motions for all the scanning sessions. The amount of subjects' head motion, which was estimated from alignment of functional images (see below), ranged from 0.07–2.0 mm, with a median of 0.36 mm within a session.
Functional localizer scans.
On a separate day from the main rotational experiment, an independent localizer scan was performed for all participants to define sensorimotor areas related to visuomotor tracking. The task was the same as in the main experiment except that it had a longer baseline period to reliably detect increased fMRI responses related to visuomotor tracking, and that subjects used a normal joystick without rotation. One session lasted ∼12 min and had 24 task blocks of 15 s, interleaved with 15 s rest periods using a fixation display.
Target trajectory.
Stimuli were generated using Psychophysics Toolbox (http://www.psychtoolbox.org; Brainard, 1997) for MATLAB (MathWorks). The x- and y-components of the target trajectory were the sums of sinusoids whose amplitudes and frequencies were pseudorandomly determined using the same procedure as in our previous studies (Imamizu et al., 2000, 2003, 2004, 2007a). Since these parameters were determined pseudorandomly for each run, the target paths differ across sessions and among subjects. In addition, two different patterns of target trajectory were created to dissociate low-level movement kinematics or reafferent sensory inputs with two rotation types (see below, Multivoxel pattern analysis). We applied three kinds of manipulations in target motion: (1) velocity: fast (average speed of 378 pixels/s) or slow (265 pixels/s), (2) position: bias of either +50 or −50 pixels introduced to on-screen position of target trajectory for both x- and y-axes, and (3) phase between x- and y-components: manipulated to be in-phase (results in positive correlation) or anti-phase (negative correlation) by introducing different phases into the x- and y- components of target sinusoids. The position and phase were explicitly manipulated in addition to the velocity because some participants showed differences in these measures between the rotation types in our preliminary behavioral experiment. These three types of manipulations were introduced in fixed combinations: fast target was always accompanied with positional bias of +50 and −50 pixels for x- and y-axis, respectively, and with in-phase motion, which generated two different types of target trajectory. Figure 1 illustrates an example of the target trajectory of a single block under each rotation and velocity type (Figure 1B) and examples of the horizontal positions of the target together with those of a cursor within a single block of the first (left) and last (right) practice sessions (Figure 1C). Hereafter, these two target types are referred to as “fast” and “slow” conditions (Fig. 1B). Note that target motion was still pseudorandom but had these constraints. The two target patterns (fast, slow) were manipulated independently of rotation types, and the numbers of the two target types were equalized between the two rotation types.
Behavioral training.
Before the fMRI scanning, subjects underwent 9–16 sessions of training outside the MRI scanner for 3 or 4 d. The training session is the same as those used for fMRI scanning, including the same rotation perturbations, except that ITI is shorter (2 s). One session lasted ∼10 min. One subject (author K.O.) did not participate in the training sessions because he had already undergone sufficient practice during the preliminary experiment.
Behavioral analysis.
Cartesian coordinates of the on-screen target and cursor positions were recorded at 60 Hz. We then calculated the following measures separately for x- and y-components: (1) tracking error defined as a Euclidean distance between target position and cursor position, (2) distance of cursor trajectory, (3) correlation coefficient between target and cursor trajectories, and (4) correlation coefficient between x- and y-components. These behavioral measures were calculated for each block, normalized as a z-score among all trials within subjects and then compared both between the two conditions of rotation (+90° vs −90°) and between those of velocity (fast vs slow). The power spectrum of cursor velocity was calculated with fast Fourier transform to measure the intermittency, which evaluates the frequency of on-line corrections based on visual feedback in manual tracking (Miall, 1996; Foulkes and Miall, 2000).
MRI acquisition.
A 3 T Siemens Trio scanner with a 12-channel head coil was used to perform T2*-weighted echo planar imaging (EPI). A total of 222 and 246 scans were acquired for the main and localizer sessions, respectively, with a gradient echo EPI sequence. The first four scans were discarded to allow for T1 equilibration. Scanning parameters were TR, 3000 ms; TE, 30 ms; FA, 80°; FOV, 192 × 192 mm; matrix, 64 × 64; 50 axial slices; and slice thickness, 3 mm without gap. T1-weighted anatomical imaging with an MP-RAGE sequence was performed with the following parameters: TR, 2250 ms; TE, 3.06 ms; FA, 9°; FOV, 256 × 256 mm; matrix, 256 × 256; 192 axial slices; and slice thickness, 1 mm without gap.
Processing of fMRI data.
Image preprocessing was performed using SPM8 software (Wellcome Department of Cognitive Neurology; http://www.fil.ion.ucl.ac.uk/spm). All functional images were first realigned to adjust for motion-related artifacts. The realigned images were then spatially normalized with the Montreal Neurological Institute (MNI) template, based on affine and nonlinear registration of coregistered T1-weighted anatomical images (normalization procedure of SPM), and resampled into 3 mm cube voxels with sinc interpolation. All images were spatially smoothed using a Gaussian kernel of 8 × 8 × 8 mm full-width at half-maximum. The smoothing was not performed except for the localizer scans, as this could blur fine-grained information contained in multivoxel activity (Mur et al., 2009).
Using the general linear model, the 24 blocks per session were modeled as separate 24 box-car regressors that were convolved with a canonical hemodynamic response function. Our previous study using the same tracking task showed that switching of different visuomotor perturbations takes ∼5 s after block onset (Imamizu et al., 2004). We thus removed the initial 6 s, corresponding to two fMRI scannings, to remove transient blood oxygenation level-dependent activity at task onsets associated with task switching or increased tracking error, and thus box-car length was 15 s covering the latter part of a 21 s block. The behavioral analysis was also conducted by removing the first 6 s period corresponding with the fMRI analysis. The six movement parameters resulting from the realignment stage were modeled as confounding covariates. Low-frequency noise was removed using a high-pass filter with a cutoff period of 128 s, and serial correlations among scans were estimated with an autoregressive model implemented in SPM8. This analysis yielded 24 independently estimated parameters (β values) per session for each individual voxel, which were subsequently used as inputs for decoding analysis.
Definition of regions of interest.
The regions of interest (ROIs) were defined for each subject, both functionally with activations of localizer scans (Fig. 2) and anatomically with the automated anatomical labeling (AAL) toolbox (Tzourio-Mazoyer et al., 2002) or Brodmann areas included in the MRICro software (http://www.mricro.com). First, the localizer scan was used to identify the activated areas that showed significantly higher response during a task epoch compared with the baseline period with an uncorrected threshold of p < 0.01 at voxel level. The primary motor and lateral premotor areas (Mot) and the somatosensory area (Som) were then anatomically masked with the precentral and postcentral cortices of AAL, respectively. The supplementary motor area (SMA) was also defined using AAL mask. The early visual area was anatomically masked within Brodmann areas 17 and 18. In the posterior parietal cortex, we selected the medial intraparietal cortex (mIPS), which is related to visually guided hand movements (Ogawa and Inui, 2012). The parietal ROI was masked both with mIPS having a 15 mm radius sphere around the peak average of previously reported coordinates of [−29, −51, 58] (Grefkes et al., 2004; Prado et al., 2005) and anatomically with the superior parietal lobule (SPL). The anterior and posterior parts of the cerebellum were anatomically defined based on the primary fissure. As a control ROI, we chose voxels outside of the brain centered at [57, 60, 57] with a radius of 15 mm (nonbrain). Several areas of one subject did not show significant activations in the localizer scan, and thus ROIs were based on activations of group-level results of other subjects (n = 6) only for this participant. Table 1 describes mean (SD) MNI coordinates and the number of voxels of ROIs.
Figure 2.

The activated areas of localizer scans, averaged over subjects (p < 0.001 uncorrected for multiple comparisons with an extent of 50 voxels) in the cerebral cortex (A) and in the cerebellum (B). Mot, Lateral premotor and primary motor area; Som, primary somatosensory area; SMA, supplementary motor area; SPL, superior parietal lobule; Vis, early visual area; CBLa, anterior part of cerebellum; CBLp, posterior part of cerebellum; CS, central sulcus; PoCS, postcentral sulcus; PF, primary fissure.
Table 1.
Mean ROI coordinates and sizes (number of voxels) with SD in parenthesis across subjects
| ROI name | MNI coordinates |
ROI size | ||
|---|---|---|---|---|
| x | y | z | ||
| Mot | −22 (4.9) | −20 (6.4) | 74 (5.2) | 655 (139) |
| Som | −34 (7.0) | −38 (7.7) | 68 (4.4) | 712 (92) |
| SMA | −4 (6.8) | −16 (8.3) | 68 (6.7) | 605 (203) |
| SPL | −32 (6.5) | −56 (9.8) | 62 (3.7) | 900 (158) |
| Vis | −1 (17.6) | −86 (11.3) | −5 (7.6) | 437 (55) |
| CBLa | 12 (7.9) | −60 (9.4) | −15 (4.9) | 1234 (239) |
| CBLp | 6 (20.5) | −64 (7.6) | −26 (12.5) | 2131 (333) |
| Nonbrain | 57 (0) | 60 (0) | 57 (0) | 500 (0) |
Mass univariate analysis.
For the conventional univariate analysis of individual voxels, we directly compared two conditions for both rotations (+90° vs −90°) and velocity (fast vs slow). Contrast images of each subject, generated using a fixed-effects model, were taken into the group analysis using a random-effects model of a two-way ANOVA with rotation and velocity types as within-subject factors. Activation was reported with a lenient threshold of p < 0.01 uncorrected for multiple comparisons at voxel level with an extent threshold of 10 voxels. The ROI analysis was additionally performed by comparing averaged parameter estimates (β values) between the two conditions of rotation types as well as velocity types.
Multivoxel pattern analysis.
The multivariate classification analysis of fMRI was performed with a binary classifier based on linear support vector machine (SVM) implemented in LIBSVM (http://www.csie.ntu.edu.tw/∼cjlin/libsvm/), with default parameters (a fixed regularization parameter C = 1). Parameter estimates (β values) of each trial of voxels within ROIs were used as inputs to the classifier.
We conducted two types of classification analysis. First, we classified the rotation types with cross-validation between different velocity types. The decoder was first trained to classify +90 and −90 rotations with fast target trials, and the same decoder was tested to classify +90 and −90 rotations with slow target trials (Fig. 3A) to test whether the decoder for rotation types could generalize between different kinematics (i.e., target motion) patterns. We also conducted classification in the reverse direction and estimated the averaged decoding accuracy. The classification of velocity types between different rotation types was conducted in the same manner. The decoder was first trained to classify fast and slow target with +90° trials, and the same decoder was tested to classify fast and slow with −90° trials. Second, we used different combinations of rotation types and velocity types for training and testing datasets: the classifier was first trained to discriminate the trials with rotation of +90° and fast target from those of −90° rotation and slow target. The same decoder was then tested to see if it could classify the trials of −90° rotation and fast target separately from those of +90° rotation and slow target. We also conducted classification in the reverse direction. In this analysis, manipulation of rotation types and velocity types was orthogonal to each other, and thus classification accuracy of rotation was the opposite to that of velocity (i.e., the accuracy of rotation equals to 100% minus the accuracy of velocity; Fig. 3B). This was done to explicitly dissociate low-level movement kinematics or reafferent sensory inputs associated with rotation types, since all types of behavioral differences including tracking error and movement distance were larger in velocity types compared with rotation types (see Results, Behavioral performance). Such a “cross-classification,” a cross-validation between trials with different sets of tasks or stimuli, has been previously used to investigate the similarity or invariance of neural representations by testing the generalization of a classifier between different conditions or modalities (Etzel et al., 2008; Knops et al., 2009; Stokes et al., 2009; Meyer et al., 2010; Oosterhof et al., 2010; Gallivan et al., 2011a; Kahnt et al., 2011; Ogawa and Inui, 2011, 2012; Corradi-Dell'Acqua et al., 2011). A cross-validation was conducted 10 times (5 sessions × 2 combinations) and then the average accuracy was estimated.
Figure 3.

Schematic illustrations of MVPA. A, Classification of rotation types with cross-validation between different velocity types; the decoder was first trained to classify +90 and −90 rotations with fast target trials, and the same decoder was tested to classify +90 and −90 rotations with slow target trials (left). Classification of velocity types with cross-validation between different rotation types was also conducted (right). B, Procedure of cross-classification, where trials with different combinations of rotations (+90° vs −90°) and velocity types (fast vs slow) were used for the decoder training and testing.
Tests of statistical significance for classification accuracy were conducted in both parametric and nonparametric methods. First, a two-sided t test was used to determine whether the observed decoding accuracy was significantly higher than chance (50%) with intersubject difference treated as a random factor (df = 6). To control for the problem of multiple comparisons, we applied the Holm–Bonferroni procedure (Holm, 1979) based on the number of ROIs. Second, we conducted a nonparametric test, since the observed classification accuracies may not be normally distributed (Nichols and Holmes, 2002). We conducted a randomization test that was identical to the decoding analysis described previously, except that we randomly shuffled correspondence between the fMRI activations and the condition labels before training the classifier within each subject and obtained average decoding accuracy across participants. This procedure was separately repeated 1000 times for each ROI by reshuffling the labels each time, which created an empirical distribution of decoding accuracy under a null hypothesis of chance. A significant above chance accuracy of p < 0.05 was assumed if the decoding accuracy with correct labeling exceeded the 95th percentile of the null distribution.
Complementary to the a priori ROI analysis, we additionally conducted a volume-based “searchlight” analysis (Kriegeskorte et al., 2006). Cross-classification with different pairs of rotation and velocity types (Fig. 3B) was performed using multivoxel activation patterns within a 9 mm radius sphere (searchlight) containing at least 100 voxels (maximum of 123 voxels). The searchlight moved over the gray matter of the whole brain, and the average classification accuracy for each searchlight with leave-one-session-out cross-validation was assigned to the sphere's center voxel. The resulting map of the decoding accuracy was averaged over subjects. Results were first thresholded at voxel level using a randomization test as in the ROI analysis. We conducted the same searchlight analysis by randomly shuffling the correspondence between the voxel activities and the condition labels, and estimated the average accuracy across participants. This procedure, which was repeated 100 times by reshuffling the labels each time, created an empirical distribution of decoding accuracy under a null hypothesis of chance, which was then collapsed over all searchlights (the number of searchlights was 35,512, and so the number of data in the null distribution was 3,551,200). For each searchlight (i.e., each center voxel), a significant above-chance accuracy of p < 0.0001 was assumed if the observed accuracy with correct labeling exceeded the 99.99th percentile of the null distribution. To correct for multiple comparisons, a cluster-level threshold was further applied with a randomization test (Nichols and Holmes, 2002; Oosterhof et al., 2010) using the same permutation distribution generated above. We obtained a maximum cluster size (i.e., the number of voxels) for each randomization sample at the same voxel-level threshold, which yields an empirical null distribution of a maximum cluster extent. Clusters were reported as significant at a cluster level of p < 0.01 if the observed number of voxels within the cluster with correct labeling exceeded the 99th percentile of this null distribution.
Additional experiment with normal joystick.
To further confirm that the classification result of rotation types was not confounded with differences in movement kinematics associated with rotational perturbations, we conducted another experiment with five of the seven subjects who participated in the main experiment. This time subjects used a normal (not rotated) joystick to track a target whose motions followed their own joystick trajectory of the previous rotational experiments. The task design and number of trials as well as sessions per subject were the same as those in the rotational experiment. We hypothesized that if differences in movement patterns between rotational conditions had contributed to successful classification of rotations, significant classification accuracy could also be obtained in this control experiment.
Eye-movement recording.
Our subjects freely made eye movements during the tracking, which could be a potential confound. To exclude the possibility that differences in eye movements contributed to the successful classification of rotation types, we measured the eye positions during the rotational tracking outside the fMRI scanner after the main fMRI experiment. The horizontal and vertical eye positions of four among seven subjects who participated in the main experiment were measured at 60 Hz with the Tobii X120 infrared recording system (Tobii Technology;http://www.tobii.com). The task sequences were the same as those of the fMRI experiment except for a shorter trial duration (12 s) to minimize eye blinks; five sessions were conducted per participant. We then ran the classification analysis based on the time series of the eye positions as well as the power spectrum of the eye movement velocity with the same procedure as multivoxel pattern analysis (MVPA) using different combinations of rotation types and velocity types (Fig. 3B).
Results
Behavioral performance
Over the training sessions, subjects gradually learned two rotational types, as indicated by the decrease in tracking errors as the number of sessions proceeded (Fig. 4A). We compared the average tracking errors of the first and the last three sessions, respectively, for each subject, and found a significant decrease (paired t test, t(5) = 6.49, p = 0.001; Fig. 4B). We next analyzed the maximal cross-correlation between the trajectories of the target and the cursor averaged during the first and last three sessions. This revealed a significant increase in correlation coefficients, indicating that the cursor followed the target trajectory more accurately in the later sessions (paired t test, t(5) = 4.55, p < 0.01; Fig. 4C).
Figure 4.

A, The average (error bars indicate SDs) tracking error as the number of sessions performed in the practice sessions. B, The average tracking error of first and last three practice sessions. C, Maximal cross-correlation between trajectories of target and those of cursor averaged during first and last three sessions. Each dot represents the results of an individual participant (n = 6).
The time series of tracking errors within a 21 s block was compared between rotation and velocity types (Fig. 5A). Because a transient increase in errors was found after block onset, behavioral and fMRI data were used only after 6 s of trial onset (Fig. 5A, gray areas) for later analysis. We also compared the power spectrum of the cursor velocity between the two conditions (Fig. 5B), which showed the differences in the cursor movement frequency or the intermittency of the feedback control. The figures show that differences in both tracking errors and power spectrum were larger between velocity types compared with rotations. For quantitative comparison, we calculated various behavioral measures for cursor trajectory and compared the normalized absolute differences between the two conditions of rotation and velocity types (see Materials and Methods, Behavioral analysis for details; Fig. 5C). We then compared the differences between the rotation and velocity types and found significantly larger differences between the two velocity types compared with the rotation types for measures including tracking error and movement distance, while no measure showed significantly greater differences in the reverse direction. These behavioral results indicate that the kinematic differences are larger in the two velocity types compared with those of the rotation types, which ensures that a higher decoding accuracy of rotation types than velocity types later found in MVPA cannot be due to kinematic differences.
Figure 5.
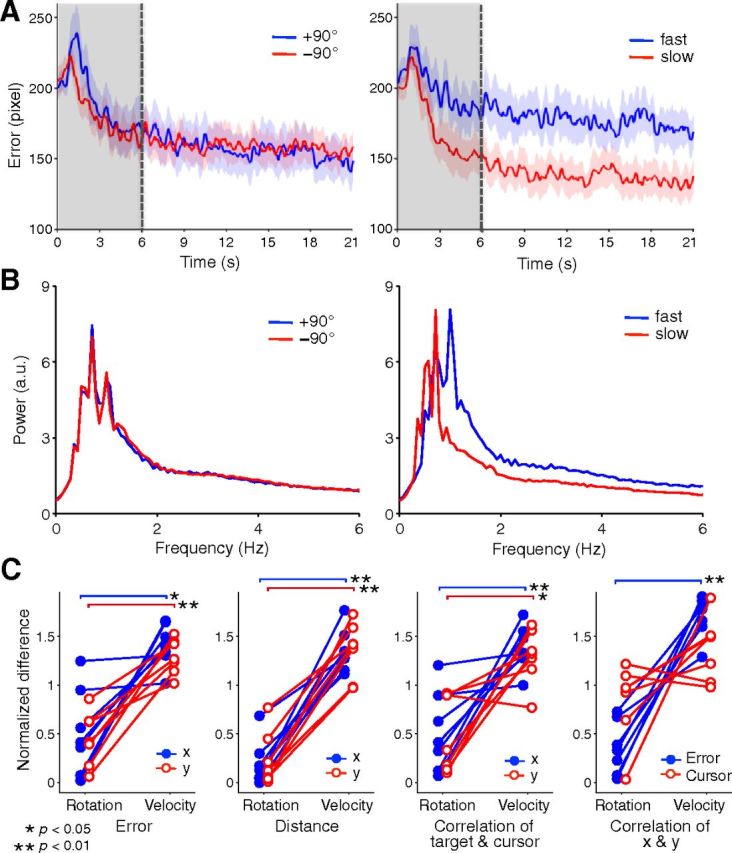
Behavioral results during fMRI scanning. A, Time series of mean tracking error within block. Two rotation and velocity types were compared in left and right figures, respectively. Trial onset of 6 s (gray areas) was removed for later analysis. Shaded region with colors denotes SD across subjects. B, Power spectrum of cursor trajectory averaged over trials and two dimensions during fMRI scanning. Two rotation and velocity types were compared in left and right figure, respectively. C, The comparisons of behavioral measures between rotation and velocity types.
Mass univariate analysis
We directly compared two conditions of both rotation (+90° vs −90°) and velocity (fast vs slow), using the traditional univariate analysis of single voxels. A significant main effect of velocity types was observed in the early visual areas bilaterally at a lenient threshold of p < 0.01 uncorrected for multiple comparisons (Fig. 6A). No significant main effect of rotation types or interactions was found at the same threshold. In addition, the ROI analysis comparing averaged parameter estimates (β values) between the two conditions of rotation and velocity within each ROI revealed no significant difference in either rotation or velocity comparison (Fig. 6B).
Figure 6.

Mass-univariate fMRI results. A, The areas with a significant main effect of velocity types at p < 0.01 uncorrected for multiple comparisons with an extent of 10 voxels. B, ROI analysis comparing averaged parameter estimates (β values) between two conditions of rotation and velocity within each ROI. Error bars indicate SEMs. Abbreviations are as defined in Figure 2 legend.
MVPA
First, we classified the rotation types with the cross-validation between different velocity types to test whether the decoder trained to classify two rotation types in one motion pattern could be generalized to the other (Fig. 3A). While the statistical results were described based on the corrected threshold unless otherwise mentioned, we included both the corrected and uncorrected significance in Figure 7 for completeness. The results showed significant above-chance classification accuracy of rotation types in Mot (62.2%, t(6) = 10.97, p < 0.001), Som (67.3%, t(6) = 4.14, p < 0.01), SMA (62.3%, t(6) = 6.10, p < 0.001), early visual area, Vis (60.6%, t(6) = 4.80, p < 0.005), anterior part of cerebellum, CBLa (61.5%, t(6) = 3.34, p < 0.05), and posterior part of cerebellum, CBLp (61.3%, t(6) = 4.46, p < 0.005). The successful classification of velocity types between different rotation types was found in Vis (78.9%, t(6) = 11.33, p < 0.001) (Fig. 7A).
Figure 7.
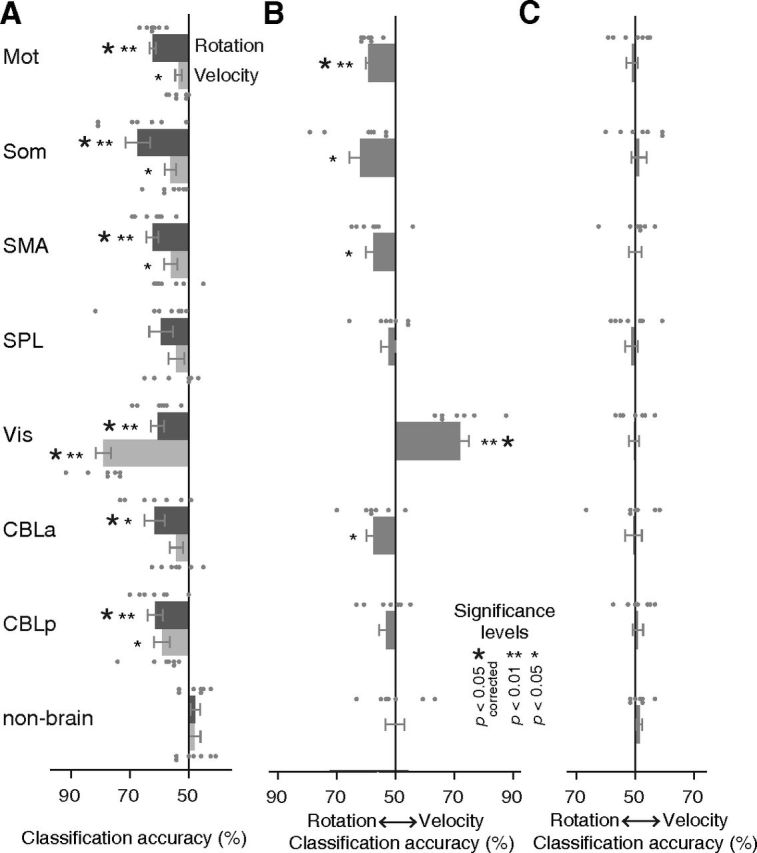
MVPA results. A, Averaged classification accuracy of rotation types or velocity types with cross-validation among different velocity or rotation conditions (Fig. 3A). B, Averaged classification accuracy of “cross-classification” with different combinations of rotation and velocity types (Fig. 3B). C, The result of the same analysis as B except using the averaged activation within ROIs. Error bars and small dots indicate SEMs and individual result of subjects (n = 7), respectively. Small and large asterisks indicate statistical significance of p values uncorrected and corrected for multiple comparisons using Holm–Bonferroni procedure. Abbreviations are as defined in the Figure 2 legend.
Since we found small differences in the behavioral measures between two rotation types and the velocity types (Fig. 5C), the successful classification of rotation types might reflect differences in the low-level kinematics or the resultant visual feedback of cursor motions. The higher than chance decoding accuracy for rotations together with the velocity types in Vis suggests that slight differences in kinematics could also contribute to the classification of rotation and velocity types. To exclude that possibility, we then performed “cross-classification” with different combinations of rotation and velocity types to explicitly dissociate the movement kinematics with rotation types (Fig. 3B). If the kinematics contributed to successful classification of rotation types, the accuracies for velocity types should exceed those of rotation types in this analysis, because the differences in all the behavioral measures were larger among the velocity types compared with rotation types (Fig. 5). Significant decoding accuracy of rotation was found for Mot (59.2%, t(6) = 9.21, p < 0.001), Som (62.1%, t(6) = 3.12, p < 0.05), SMA (57.6%, t(6) = 2.94, p < 0.05), and CBLa (57.5%, t(6) = 2.78, p < 0.05), while that of velocity was found for Vis (71.9%, t(6) = 6.94, p < 0.001) (Fig. 7B). Among these ROIs, Mot and Vis showed significant above-chance accuracy after correction for multiple comparisons, and the results of each individual subject (denoted by small dots in Fig. 7B) show high consistency. We additionally conducted a nonparametric randomization test and found that it generally produced a more lenient threshold for p values compared with the parametric t test (similar results were reported by Gallivan et al., 2011b). This confirmed that all of the significant above-chance accuracies found by the t test were also significant by the randomization test.
The same classification was also conducted by equating the number of voxels across ROIs to eliminate differences in feature size. The voxels in each ROI were selected in the order of highest t value of the localizer scan, which was based on the univariate analysis, until the number of voxels reached 400 for each subject (Pereira et al., 2009). This replicated the previous results: significant decoding accuracy of rotation for Mot (56.2%, t(6) = 4.79, p < 0.005), Som (60.3%, t(6) = 2.74, p < 0.05), and SMA (57.3%, t(6) = 2.45, p < 0.05), and that of velocity for Vis (70.0%, t(6) = 5.59, p < 0.005) with uncorrected p values.
Next, the same classification was performed with averaged β values of all voxels within an ROI as inputs. No significantly higher than chance accuracy was found in any ROI, which indicates that decoding was based on differences in distributed spatial patterns of multiple voxels, rather than overall amplitude differences within the ROI (Fig. 7C). This is also supported by the voxel bias map, which displays the averaged weights (positive or negative) of the classifier across 10 folds (i.e., iterations) in the cross-validation for individual voxels within ROIs; this map showed intermingled patterns of voxels with two rotational types (+90 vs −90 biased voxels) within ROIs in all subjects (Fig. 8A for a single typical subject). In addition, the bias patterns between different pairs of participants showed low correlations around zero (Fig. 8B), which indicates idiosyncratic patterns of weights specific to each subject.
Figure 8.

Voxel bias of classifiers. A, The voxel bias maps of “cross-classification” shown in Figure 3B from a single typical subject, within the ROIs having significant accuracy of rotation types. The yellow and pink voxels show positive weight for +90° and −90° rotation, respectively. B, Distributions of correlation coefficients (R) of bias between different pairs of subjects. Each dot denotes R of a single pair, where the total number of dots is 21 (combination of 2 of 7 subjects). The thick horizontal line and gray patch represent mean and SD, respectively. Abbreviations are as defined in the Figure 2 legend.
Finally, the searchlight map revealed the voxels for higher accuracy of rotation types in the sensorimotor cortex as well as in the SMA (Fig. 9, red). These areas closely correspond to the activated regions in the localizer scans that were conducted separately (Fig. 2A). We also found the voxels for higher accuracy of velocity types mostly located in the early visual areas (Fig. 9, blue). These are largely consistent with the results of the previous ROI analysis.
Figure 9.

The classification accuracy map with the searchlight analysis. The red and blue voxels show significant above-chance decoding accuracy of rotation and velocity types, respectively (p < 0.01 corrected for multiple comparisons at the cluster level).
Classification with behavioral measures
To further validate that successful classification of rotation types is not due to differences in low-level movement kinematics, we conducted multivariate classification analysis using the various behavioral measures. In this analysis, all of the observed behavioral measures (see Materials and Methods, Behavioral performance) were used separately or jointly as features (Fig. 10A), and classification of rotation types versus velocity types was conducted in the same way as the fMRI–MVPA (Fig. 3B). The time series of tracking error as well as the power spectrum of cursor trajectory was also used as a feature vector for classification (Fig. 10B). These analyses revealed significantly greater classification accuracy only between velocity types compared with rotations. We further conducted the same classification analysis using the time series as well as the power spectrum of the eye movements, which again showed a higher accuracy for the velocity types compared with the rotation types (Fig. 10C). These results indicate that higher classification accuracy for rotation over velocity in MVPA (Fig. 7B) cannot be attributed to the differences in the movement or the sensory reafferents associated with rotational perturbations as well as in eye movements.
Figure 10.
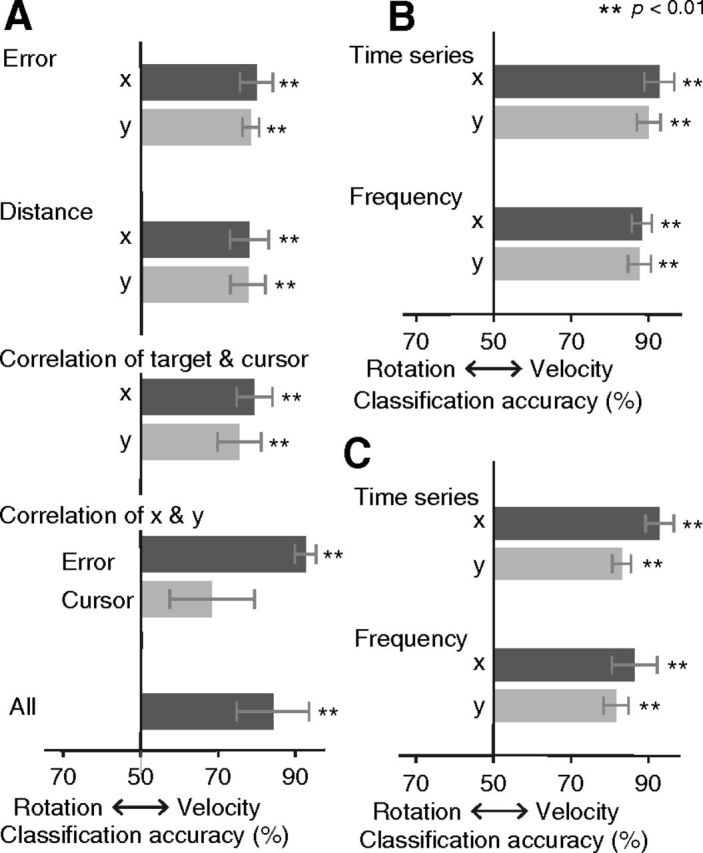
Decoding accuracy of “cross-classification” based on the behavioral measures (A) and the time series and power spectrum of the tracking errors (B) as well as the eye movements (C). Error bars indicate SEMs.
Additional experiment with normal joystick
We additionally conducted the same MVPA using different combinations of rotation types and velocity types (Fig. 3B) when subjects used a normal (not rotated) joystick to track a target in a control experiment. The averaged (SD) maximum cross-correlations between the target and cursor trajectory of the x- and y-directions were 0.78 (0.05) and 0.81 (0.04), respectively. This indicates that all of the subjects accurately followed the target trajectory. A significant decrease in classification accuracies for rotation types compared with those of the main rotational experiment was observed in Mot (paired t test; t(4) = 5.38, p < 0.01), Som (t(4) = 4.11, p < 0.05), and CBLa (t(4) = 3.30, p < 0.05), and a marginal significance was found in SMA (t(4) = 2.41, p = 0.07), with nonsignificant differences with the chance level in the control experiment (all p > 0.5) (Fig. 11). In a post experimental debriefing, none of the subjects could discriminate whether a target motion was from their cursor trajectory of the +90° or −90° condition in the previous rotational experiment, while they could notice fast versus slow target trajectories. This indicates that movement kinematics were more similar between the two rotation types than between the velocity types, which is consistent with the results of behavioral analysis (Figs. 5, 10).
Figure 11.

Classification accuracy of additional experiment using normal (not rotated) joystick, within ROIs of significant accuracy of rotation types. Abbreviations are as defined in the Figure 2 legend. Each dot represents the result of an individual participant (n = 5).
Discussion
This study aimed to reveal neural substrates that represent conflicting visuomotor mappings. After intensive training, the participants jointly adapted to the two rotational perturbations, which is indicated by the behavioral measures (Fig. 4). The fMRI decoding showed that rotation types were successfully classified with multivariate activity patterns in the sensorimotor cortex when trials with different types of rotation and velocity were combined and cross-validated in the ROI analysis (Fig. 7B). Searchlight analysis also revealed a significant above-chance accuracy of rotation types in the sensorimotor cortex and the SMA (Fig. 9). Our findings reveal that the sensorimotor cortex represents different mappings, which subserves simultaneous adaptation of multiple visuomotor correspondences.
This successful classification cannot be due to differences in low-level movement kinematics or sensory reafferents associated with the rotational perturbations for the following two reasons. First, the differences in the various behavioral measures, including tracking error, movement distances, and correlation of target and cursor motions, as well as power spectrum, are larger between the velocity type compared with the rotation type (Fig. 5). The classification using these behavioral measures as well as eye movements, conducted in the same way as the fMRI–MVPA, further showed significantly higher accuracies of velocity types over rotation types (Fig. 10). Second, the additional experiment, in which subjects tracked their joystick trajectory with a normal joystick, showed a significant decrease in accuracy for rotation types in the same ROIs with a chance-level performance (Fig. 11). These results indicate that successful decoding of rotation types is not confounded with movement kinematics. In contrast, low-level sensorimotor components, which were associated with different velocity types including tracking error and movement speed, were best classified using activities of the early visual cortex (Figs. 7, 9). We also found a significantly higher than chance decoding accuracy of velocity types as well as rotation types in the sensorimotor cortex and the cerebellum when classification of velocity types was cross-validated between different rotation types (Fig. 7A). This indicates that low-level sensorimotor components were also represented in these areas, together with the rotational types.
Previous studies with MVPA or fMRI adaptation (Grill-Spector and Malach, 2001) revealed the directional selectivity of hand movements in the primary motor cortex (Eisenberg et al., 2010, 2011; Fabbri et al., 2010; Ogawa and Inui, 2012). Eisenberg et al. (2011) introduced a single rotational perturbation (45°) between hand and cursor movements to dissociate movement directions in the visual and motor coordinates. In contrast, our current study introduced the two conflicting rotational perturbations between hand and cursor movements (+90 or −90°), requiring participants to move their hands in an opposite direction depending on the rotation types. We then decoded the rotational directions of the visuomotor perturbation that are independent of the movement directions. Our study indicates, for the first time, that multiple visuomotor mappings can be decoded with distributed neural activity patterns of fMRI. Previous human neuroimaging studies revealed that separate brain regions are involved in the learning of different types of perturbation (Imamizu et al., 2003; Krakauer et al., 2004; Girgenrath et al., 2008), which indicates that the size of these separate modules are larger than fMRI individual-voxel resolution. In contrast, our results showed that parametric differences in the same type of perturbation cannot be discriminated with the mass univoxel analysis (Fig. 6) but could be revealed using MVPA. The voxel bias map showed intermingled patterns of voxels with two rotational types idiosyncratic to each participant (Fig. 8). The previous studies showed that orientation columns in the early visual cortex could be discriminated using MVPA that is beyond fMRI voxel resolution (Haynes and Rees, 2005; Kamitani and Tong, 2005). Our results suggest that parametric differences within the same perturbation are represented more closely and intermixed at a resolution below that of fMRI voxels, compared with different perturbations in separate areas that are larger than voxel size. This discrepancy may correspond to the existence of behavioral interference: joint learning of the different types of perturbations, such as kinematics versus dynamics, does not cause interference (Krakauer et al., 1999), while adaptation to different parameters within the same type of perturbation, like that in the current study, induces conflicting interference (Wigmore et al., 2002). This interference could be caused by the conflicting use of the same neural representations, which are more closely located for multiple parametric mapping within the same type rather than different types of perturbations. Noted that the possible information source of MVPA remains unclear with some recent controversies (Freeman et al., 2011; Beckett et al., 2012). The decoding accuracy of MVPA is considered to be dependent on the spatial patterns of distinct neuronal populations and/or accompanying vasculature units together with the spatial resolution of fMRI (Bartels et al., 2008; Gardner, 2010). Our results are also in line with recent papers showing the effectiveness of MVPA in motor systems by successfully decoding multiple actions (Dinstein et al., 2008; Gallivan et al., 2011a,b), representations of individual fingers (Wiestler et al., 2011; Diedrichsen et al., 2013), or movement directions (Eisenberg et al., 2010, Ogawa and Inui, 2011, 2012), which are not possible with the conventional univoxel analysis.
There are two possibilities for the neural mechanisms underlying the joint adaptation of the multiple parameters within the same types of perturbation. One is that a single component that represents the visuomotor correspondence continuously adapts and readapts to different mappings depending on the current environment, which regards switching as recalibration between the visual and motor frames of reference. The other is that multiple mappings have distinct substrates, each of which represents a specific visuomotor correspondence (Lee and Schweighofer, 2009). In our current study, it remains unclear whether the motor system serially recalibrates a single general model or acquires multiple models specific to each mapping, since both possibilities induce specific distributed activation patterns of multiple voxels for decoding. Further studies are needed to clarify whether the distinct mappings are represented with a single or multiple models.
Previous research identified the sensorimotor cortex and cerebellum as neural substrates of visuomotor learning (for review, see Shmuelof and Krakauer, 2011). Neurophysiological studies with nonhuman primates revealed changes in neuronal response reflecting learning of rotational perturbations in the primary motor cortex (M1) (Wise et al., 1998; Paz et al., 2003; Paz and Vaadia, 2004) as well as in the SMA (Padoa-Schioppa et al., 2004; Paz et al., 2005). A recent study using unit recording of nonhuman primates suggested that two opposing rotations cannot be represented with a single neuron in M1 (Zach et al., 2012). Their results support the existence of separate representations for different mapping, consistent with our current findings. Together with these previous unit recordings of nonhuman primates, our results indicate the existence of different neuronal populations in the motor-related region.
Human neuroimaging studies also indicated increased activations (Karni et al., 1995) as well as structural changes in M1 related to motor learning (Draganski et al., 2004; Landi et al., 2011). The recent studies using transcranial magnetic stimulation or transcranial direct current stimulation indicate the acquisition (Hunter et al., 2009) as well as storage (Hadipour-Niktarash et al., 2007; Galea et al., 2011) of sensorimotor skills in the human M1. The error-related increase in fMRI signal was also reported in the human sensorimotor areas when subjects learned visuomotor perturbations, which could be used as training signals for acquisition of internal models (Diedrichsen et al., 2005). These findings indicate the role of the sensorimotor cortex in representing motor skills, and they are generally consistent with the view that the primary motor cortex is not a low-level static controller of muscles but rather contains higher level representation of various movement parameters (for review, see Scott, 2003). Our results support this view, indicating that distinct visuomotor mappings are stored in the sensorimotor cortex.
Human neuroimaging has shown activities related to the acquisition of an internal model in the cerebellum (Imamizu et al., 2000, 2003; Seidler and Noll, 2008). Imamizu et al. (2003) showed that the learning of different types of sensorimotor perturbations (rotation and velocity) is subserved with the acquisition of multiple internal models in the cerebellum. Our study revealed significant above-chance accuracy in the anterior cerebellum in the ROI analysis, which supports the existence of multiple internal models in the cerebellum. However, since the accuracy in the cerebellum did not survive the threshold corrected for the multiple comparisons in the both the ROI and the searchlight analysis, we do not consider the cerebellum result to be robust and discuss it no further.
Previous studies indicated a role of the posterior parietal cortex (PPC) in visuomotor rotational learning (Inoue et al., 2000; Graydon et al., 2005). In contrast, we did not observe significant classification accuracy in the parietal cortex. While the previous research reported changes of activity in the midst of learning, our studies focused on activations when subjects sufficiently adapted to rotations after intensive practice. Our results indicate that the parietal cortex might be related to the early middle phases of a learning process, rather than long-term storing of motor memories. A recent computational model-based study also predicted that the site for learning is not in the PPC but in the connectivity between the PPC and the motor areas (Tanaka et al., 2009).
This study investigated opposite rotational perturbations that cause interference in joint learning. However, it is known that positive transfer of learning occurs when the rotational degrees of perturbations are close to each other (e.g., 30° or 45°) (Seidler and Noll, 2008). Future studies are needed to examine whether distinct visuomotor mappings exist in such cases, or if multivoxel pattern analysis can identify the mappings for close perturbations, if any. Extension of our studies to joint learning between various degrees of visuomotor rotations would give us important clues to understanding the modular units used for sensorimotor learning as well as the neural mechanisms used for positive and negative (interference) transfer of learning.
In summary, our findings indicate that the sensorimotor cortex represents conflicting visuomotor mappings, which subserves simultaneous adaptation of multiple sensorimotor mappings. We hypothesize that similar neural mechanisms underlie joint adaptation of opposing force fields. In future applications, decoding of a specific parameter in sensorimotor transformation could be used as a neurofeedback signal to achieve efficient structural learning with reduced interference (Braun et al., 2009), using a method recently applied to perceptual learning (Shibata et al., 2011).
Footnotes
This work was supported in part by a grant-in-aid for Japan Society for the Promotion of Science Fellows (No. 23-8279) to K.O. We thank Drs. Mitsuo Kawato, Hirokazu Tanaka, and Nicolas Schweighofer for helpful comments on an early version of this manuscript, and Satoshi Tada and Yuka Furukawa for technical support.
The authors declare no competing financial interests.
References
- Bartels A, Logothetis NK, Moutoussis K. fMRI and its interpretations: an illustration on directional selectivity in area V5/MT. Trends Neurosci. 2008;31:444–453. doi: 10.1016/j.tins.2008.06.004. [DOI] [PubMed] [Google Scholar]
- Beckett A, Peirce JW, Sanchez-Panchuelo RM, Francis S, Schluppeck D. Contribution of large scale biases in decoding of direction-of-motion from high-resolution fMRI data in human early visual cortex. Neuroimage. 2012;63:1623–1632. doi: 10.1016/j.neuroimage.2012.07.066. [DOI] [PubMed] [Google Scholar]
- Brainard DH. The Psychophysics Toolbox. Spat Vis. 1997;10:433–436. doi: 10.1163/156856897X00357. [DOI] [PubMed] [Google Scholar]
- Braun DA, Aertsen A, Wolpert DM, Mehring C. Motor task variation induces structural learning. Curr Biol. 2009;19:352–357. doi: 10.1016/j.cub.2009.01.036. [DOI] [PMC free article] [PubMed] [Google Scholar]
- Choi Y, Qi F, Gordon J, Schweighofer N. Performance-based adaptive schedules enhance motor learning. J Mot Behav. 2008;40:273–280. doi: 10.3200/JMBR.40.4.273-280. [DOI] [PubMed] [Google Scholar]
- Corradi-Dell'Acqua C, Hofstetter C, Vuilleumier P. Felt and seen pain evoke the same local patterns of cortical activity in insular and cingulate cortex. J Neurosci. 2011;31:17996–18006. doi: 10.1523/JNEUROSCI.2686-11.2011. [DOI] [PMC free article] [PubMed] [Google Scholar]
- Cunningham HA, Welch RB. Multiple concurrent visual-motor mappings: implications for models of adaptation. J Exp Psychol Hum Percept Perform. 1994;20:987–999. doi: 10.1037/0096-1523.20.5.987. [DOI] [PubMed] [Google Scholar]
- Diedrichsen J, Hashambhoy Y, Rane T, Shadmehr R. Neural correlates of reach errors. J Neurosci. 2005;25:9919–9931. doi: 10.1523/JNEUROSCI.1874-05.2005. [DOI] [PMC free article] [PubMed] [Google Scholar]
- Diedrichsen J, Wiestler T, Krakauer JW. Two distinct ipsilateral cortical representations for individuated finger movements. Cereb Cortex. 2013 doi: 10.1093/cercor/bhs120. in press. [DOI] [PMC free article] [PubMed] [Google Scholar]
- Dinstein I, Gardner JL, Jazayeri M, Heeger DJ. Executed and observed movements have different distributed representations in human aIPS. J Neurosci. 2008;28:11231–11239. doi: 10.1523/JNEUROSCI.3585-08.2008. [DOI] [PMC free article] [PubMed] [Google Scholar]
- Draganski B, Gaser C, Busch V, Schuierer G, Bogdahn U, May A. Neuroplasticity: changes in grey matter induced by training. Nature. 2004;427:311–312. doi: 10.1038/427311a. [DOI] [PubMed] [Google Scholar]
- Eisenberg M, Shmuelof L, Vaadia E, Zohary E. Functional organization of human motor cortex: directional selectivity for movement. J Neurosci. 2010;30:8897–8905. doi: 10.1523/JNEUROSCI.0007-10.2010. [DOI] [PMC free article] [PubMed] [Google Scholar]
- Eisenberg M, Shmuelof L, Vaadia E, Zohary E. The representation of visual and motor aspects of reaching movements in the human motor cortex. J Neurosci. 2011;31:12377–12384. doi: 10.1523/JNEUROSCI.0824-11.2011. [DOI] [PMC free article] [PubMed] [Google Scholar]
- Etzel JA, Gazzola V, Keysers C. Testing simulation theory with cross-modal multivariate classification of fMRI data. PLoS ONE. 2008;3:e3690. doi: 10.1371/journal.pone.0003690. [DOI] [PMC free article] [PubMed] [Google Scholar]
- Fabbri S, Caramazza A, Lingnau A. Tuning curves for movement direction in the human visuomotor system. J Neurosci. 2010;30:13488–13498. doi: 10.1523/JNEUROSCI.2571-10.2010. [DOI] [PMC free article] [PubMed] [Google Scholar]
- Foulkes AJ, Miall RC. Adaptation to visual feedback delays in a human manual tracking task. Exp Brain Res. 2000;131:101–110. doi: 10.1007/s002219900286. [DOI] [PubMed] [Google Scholar]
- Freeman J, Brouwer GJ, Heeger DJ, Merriam EP. Orientation decoding depends on maps, not columns. J Neurosci. 2011;31:4792–4804. doi: 10.1523/JNEUROSCI.5160-10.2011. [DOI] [PMC free article] [PubMed] [Google Scholar]
- Galea JM, Vazquez A, Pasricha N, de Xivry JJ, Celnik P. Dissociating the roles of the cerebellum and motor cortex during adaptive learning: the motor cortex retains what the cerebellum learns. Cereb Cortex. 2011;21:1761–1770. doi: 10.1093/cercor/bhq246. [DOI] [PMC free article] [PubMed] [Google Scholar]
- Gallivan JP, McLean DA, Smith FW, Culham JC. Decoding effector-dependent and effector-independent movement intentions from human parieto-frontal brain activity. J Neurosci. 2011a;31:17149–17168. doi: 10.1523/JNEUROSCI.1058-11.2011. [DOI] [PMC free article] [PubMed] [Google Scholar]
- Gallivan JP, McLean DA, Valyear KF, Pettypiece CE, Culham JC. Decoding action intentions from preparatory brain activity in human parieto-frontal networks. J Neurosci. 2011b;31:9599–9610. doi: 10.1523/JNEUROSCI.0080-11.2011. [DOI] [PMC free article] [PubMed] [Google Scholar]
- Gardner JL. Is cortical vasculature functionally organized? Neuroimage. 2010;49:1953–1956. doi: 10.1016/j.neuroimage.2009.07.004. [DOI] [PubMed] [Google Scholar]
- Ghahramani Z, Wolpert DM. Modular decomposition in visuomotor learning. Nature. 1997;386:392–395. doi: 10.1038/386392a0. [DOI] [PubMed] [Google Scholar]
- Girgenrath M, Bock O, Seitz RJ. An fMRI study of brain activation in a visual adaptation task: activation limited to sensory guidance. Exp Brain Res. 2008;184:561–569. doi: 10.1007/s00221-007-1124-8. [DOI] [PubMed] [Google Scholar]
- Graydon FX, Friston KJ, Thomas CG, Brooks VB, Menon RS. Learning-related fMRI activation associated with a rotational visuo-motor transformation. Brain Res Cogn Brain Res. 2005;22:373–383. doi: 10.1016/j.cogbrainres.2004.09.007. [DOI] [PubMed] [Google Scholar]
- Grefkes C, Ritzl A, Zilles K, Fink GR. Human medial intraparietal cortex subserves visuomotor coordinate transformation. Neuroimage. 2004;23:1494–1506. doi: 10.1016/j.neuroimage.2004.08.031. [DOI] [PubMed] [Google Scholar]
- Grill-Spector K, Malach R. fMR-adaptation: a tool for studying the functional properties of human cortical neurons. Acta Psychol. 2001;107:293–321. doi: 10.1016/S0001-6918(01)00019-1. [DOI] [PubMed] [Google Scholar]
- Hadipour-Niktarash A, Lee CK, Desmond JE, Shadmehr R. Impairment of retention but not acquisition of a visuomotor skill through time-dependent disruption of primary motor cortex. J Neurosci. 2007;27:13413–13419. doi: 10.1523/JNEUROSCI.2570-07.2007. [DOI] [PMC free article] [PubMed] [Google Scholar]
- Haynes JD, Rees G. Predicting the orientation of invisible stimuli from activity in human primary visual cortex. Nat Neurosci. 2005;8:686–691. doi: 10.1038/nn1445. [DOI] [PubMed] [Google Scholar]
- Holm S. A simple sequentially rejective multiple test procedure. Scand J Stat. 1979;6:65–70. [Google Scholar]
- Howard IS, Ingram JN, Wolpert DM. Composition and decomposition in bimanual dynamic learning. J Neurosci. 2008;28:10531–10540. doi: 10.1523/JNEUROSCI.3473-08.2008. [DOI] [PMC free article] [PubMed] [Google Scholar]
- Hunter T, Sacco P, Nitsche MA, Turner DL. Modulation of internal model formation during force field-induced motor learning by anodal transcranial direct current stimulation of primary motor cortex. J Physiol. 2009;587:2949–2961. doi: 10.1113/jphysiol.2009.169284. [DOI] [PMC free article] [PubMed] [Google Scholar]
- Imamizu H, Miyauchi S, Tamada T, Sasaki Y, Takino R, Pütz B, Yoshioka T, Kawato M. Human cerebellar activity reflecting an acquired internal model of a new tool. Nature. 2000;403:192–195. doi: 10.1038/35003194. [DOI] [PubMed] [Google Scholar]
- Imamizu H, Kuroda T, Miyauchi S, Yoshioka T, Kawato M. Modular organization of internal models of tools in the human cerebellum. Proc Natl Acad Sci U S A. 2003;100:5461–5466. doi: 10.1073/pnas.0835746100. [DOI] [PMC free article] [PubMed] [Google Scholar]
- Imamizu H, Kuroda T, Yoshioka T, Kawato M. Functional magnetic resonance imaging examination of two modular architectures for switching multiple internal models. J Neurosci. 2004;24:1173–1181. doi: 10.1523/JNEUROSCI.4011-03.2004. [DOI] [PMC free article] [PubMed] [Google Scholar]
- Imamizu H, Higuchi S, Toda A, Kawato M. Reorganization of brain activity for multiple internal models after short but intensive training. Cortex. 2007a;43:338–349. doi: 10.1016/S0010-9452(08)70459-3. [DOI] [PubMed] [Google Scholar]
- Imamizu H, Sugimoto N, Osu R, Tsutsui K, Sugiyama K, Wada Y, Kawato M. Explicit contextual information selectively contributes to predictive switching of internal models. Exp Brain Res. 2007b;181:395–408. doi: 10.1007/s00221-007-0940-1. [DOI] [PubMed] [Google Scholar]
- Inoue K, Kawashima R, Satoh K, Kinomura S, Sugiura M, Goto R, Ito M, Fukuda H. A PET study of visuomotor learning under optical rotation. Neuroimage. 2000;11:505–516. doi: 10.1006/nimg.2000.0554. [DOI] [PubMed] [Google Scholar]
- Kahnt T, Heinzle J, Park SQ, Haynes JD. Decoding the formation of reward predictions across learning. J Neurosci. 2011;31:14624–14630. doi: 10.1523/JNEUROSCI.3412-11.2011. [DOI] [PMC free article] [PubMed] [Google Scholar]
- Kamitani Y, Tong F. Decoding the visual and subjective contents of the human brain. Nat Neurosci. 2005;8:679–685. doi: 10.1038/nn1444. [DOI] [PMC free article] [PubMed] [Google Scholar]
- Karni A, Meyer G, Jezzard P, Adams MM, Turner R, Ungerleider LG. Functional MRI evidence for adult motor cortex plasticity during motor skill learning. Nature. 1995;377:155–158. doi: 10.1038/377155a0. [DOI] [PubMed] [Google Scholar]
- Knops A, Thirion B, Hubbard EM, Michel V, Dehaene S. Recruitment of an area involved in eye movements during mental arithmetic. Science. 2009;324:1583–1585. doi: 10.1126/science.1171599. [DOI] [PubMed] [Google Scholar]
- Krakauer JW, Ghilardi MF, Ghez C. Independent learning of internal models for kinematic and dynamic control of reaching. Nat Neurosci. 1999;2:1026–1031. doi: 10.1038/14826. [DOI] [PubMed] [Google Scholar]
- Krakauer JW, Ghilardi MF, Mentis M, Barnes A, Veytsman M, Eidelberg D, Ghez C. Differential cortical and subcortical activations in learning rotations and gains for reaching: a PET study. J Neurophysiol. 2004;91:924–933. doi: 10.1152/jn.00675.2003. [DOI] [PubMed] [Google Scholar]
- Kriegeskorte N, Goebel R, Bandettini P. Information-based functional brain mapping. Proc Natl Acad Sci U S A. 2006;103:3863–3868. doi: 10.1073/pnas.0600244103. [DOI] [PMC free article] [PubMed] [Google Scholar]
- Landi SM, Baguear F, Della-Maggiore V. One week of motor adaptation induces structural changes in primary motor cortex that predict long-term memory one year later. J Neurosci. 2011;31:11808–11813. doi: 10.1523/JNEUROSCI.2253-11.2011. [DOI] [PMC free article] [PubMed] [Google Scholar]
- Lee JY, Schweighofer N. Dual adaptation supports a parallel architecture of motor memory. J Neurosci. 2009;29:10396–10404. doi: 10.1523/JNEUROSCI.1294-09.2009. [DOI] [PMC free article] [PubMed] [Google Scholar]
- Meyer K, Kaplan JT, Essex R, Webber C, Damasio H, Damasio A. Predicting visual stimuli on the basis of activity in auditory cortices. Nat Neurosci. 2010;13:667–668. doi: 10.1038/nn.2533. [DOI] [PubMed] [Google Scholar]
- Miall RC. Task-dependent changes in visual feedback control: a frequency analysis of human manual tracking. J Mot Behav. 1996;28:125–135. doi: 10.1080/00222895.1996.9941739. [DOI] [PubMed] [Google Scholar]
- Mur M, Bandettini PA, Kriegeskorte N. Revealing representational content with pattern-information fMRI- an introductory guide. Soc Cogn Affect Neurosci. 2009;4:101–109. doi: 10.1093/scan/nsn044. [DOI] [PMC free article] [PubMed] [Google Scholar]
- Nichols TE, Holmes AP. Nonparametric permutation tests for functional neuroimaging: a primer with examples. Hum Brain Mapp. 2002;15:1–25. doi: 10.1002/hbm.1058. [DOI] [PMC free article] [PubMed] [Google Scholar]
- Norman KA, Polyn SM, Detre GJ, Haxby JV. Beyond mind-reading: multi-voxel pattern analysis of fMRI data. Trends Cogn Sci. 2006;10:424–430. doi: 10.1016/j.tics.2006.07.005. [DOI] [PubMed] [Google Scholar]
- Nozaki D, Kurtzer I, Scott SH. Limited transfer of learning between unimanual and bimanual skills within the same limb. Nat Neurosci. 2006;9:1364–1366. doi: 10.1038/nn1785. [DOI] [PubMed] [Google Scholar]
- Ogawa K, Inui T. Neural representation of observed actions in the parietal and premotor cortex. Neuroimage. 2011;56:728–735. doi: 10.1016/j.neuroimage.2010.10.043. [DOI] [PubMed] [Google Scholar]
- Ogawa K, Inui T. Reference frame of human medial intraparietal cortex in visually guided movements. J Cogn Neurosci. 2012;24:171–182. doi: 10.1162/jocn_a_00132. [DOI] [PubMed] [Google Scholar]
- Oldfield RC. The assessment and analysis of handedness: the Edinburgh inventory. Neuropsychologia. 1971;9:97–113. doi: 10.1016/0028-3932(71)90067-4. [DOI] [PubMed] [Google Scholar]
- Oosterhof NN, Wiggett AJ, Diedrichsen J, Tipper SP, Downing PE. Surface-based information mapping reveals crossmodal vision-action representations in human parietal and occipitotemporal cortex. J Neurophysiol. 2010;104:1077–1089. doi: 10.1152/jn.00326.2010. [DOI] [PMC free article] [PubMed] [Google Scholar]
- Osu R, Hirai S, Yoshioka T, Kawato M. Random presentation enables subjects to adapt to two opposing forces on the hand. Nat Neurosci. 2004;7:111–112. doi: 10.1038/nn1184. [DOI] [PubMed] [Google Scholar]
- Padoa-Schioppa C, Li CS, Bizzi E. Neuronal activity in the supplementary motor area of monkeys adapting to a new dynamic environment. J Neurophysiol. 2004;91:449–473. doi: 10.1152/jn.00876.2002. [DOI] [PubMed] [Google Scholar]
- Paz R, Vaadia E. Specificity of sensorimotor learning and the neural code: neuronal representations in the primary motor cortex. J Physiol Paris. 2004;98:331–348. doi: 10.1016/j.jphysparis.2005.09.005. [DOI] [PubMed] [Google Scholar]
- Paz R, Boraud T, Natan C, Bergman H, Vaadia E. Preparatory activity in motor cortex reflects learning of local visuomotor skills. Nat Neurosci. 2003;6:882–890. doi: 10.1038/nn1097. [DOI] [PubMed] [Google Scholar]
- Paz R, Natan C, Boraud T, Bergman H, Vaadia E. Emerging patterns of neuronal responses in supplementary and primary motor areas during sensorimotor adaptation. J Neurosci. 2005;25:10941–10951. doi: 10.1523/JNEUROSCI.0164-05.2005. [DOI] [PMC free article] [PubMed] [Google Scholar]
- Pereira F, Mitchell T, Botvinick M. Machine learning classifiers and fMRI: a tutorial overview. Neuroimage. 2009;45:S199–209. doi: 10.1016/j.neuroimage.2008.11.007. [DOI] [PMC free article] [PubMed] [Google Scholar]
- Prado J, Clavagnier S, Otzenberger H, Scheiber C, Kennedy H, Perenin MT. Two cortical systems for reaching in central and peripheral vision. Neuron. 2005;48:849–858. doi: 10.1016/j.neuron.2005.10.010. [DOI] [PubMed] [Google Scholar]
- Rabe K, Livne O, Gizewski ER, Aurich V, Beck A, Timmann D, Donchin O. Adaptation to visuomotor rotation and force field perturbation is correlated to different brain areas in patients with cerebellar degeneration. J Neurophysiol. 2009;101:1961–1971. doi: 10.1152/jn.91069.2008. [DOI] [PubMed] [Google Scholar]
- Scott SH. The role of primary motor cortex in goal-directed movements: insights from neurophysiological studies on non-human primates. Curr Opin Neurobiol. 2003;13:671–677. doi: 10.1016/j.conb.2003.10.012. [DOI] [PubMed] [Google Scholar]
- Seidler RD, Noll DC. Neuroanatomical correlates of motor acquisition and motor transfer. J Neurophysiol. 2008;99:1836–1845. doi: 10.1152/jn.01187.2007. [DOI] [PubMed] [Google Scholar]
- Shibata K, Watanabe T, Sasaki Y, Kawato M. Perceptual learning incepted by decoded fMRI neurofeedback without stimulus presentation. Science. 2011;334:1413–1415. doi: 10.1126/science.1212003. [DOI] [PMC free article] [PubMed] [Google Scholar]
- Shmuelof L, Krakauer JW. Are we ready for a natural history of motor learning? Neuron. 2011;72:469–476. doi: 10.1016/j.neuron.2011.10.017. [DOI] [PMC free article] [PubMed] [Google Scholar]
- Stokes M, Thompson R, Cusack R, Duncan J. Top-down activation of shape-specific population codes in visual cortex during mental imagery. J Neurosci. 2009;29:1565–1572. doi: 10.1523/JNEUROSCI.4657-08.2009. [DOI] [PMC free article] [PubMed] [Google Scholar]
- Tanaka H, Sejnowski TJ, Krakauer JW. Adaptation to visuomotor rotation through interaction between posterior parietal and motor cortical areas. J Neurophysiol. 2009;102:2921–2932. doi: 10.1152/jn.90834.2008. [DOI] [PMC free article] [PubMed] [Google Scholar]
- Tzourio-Mazoyer N, Landeau B, Papathanassiou D, Crivello F, Etard O, Delcroix N, Mazoyer B, Joliot M. Automated anatomical labeling of activations in SPM using a macroscopic anatomical parcellation of the MNI MRI single-subject brain. Neuroimage. 2002;15:273–289. doi: 10.1006/nimg.2001.0978. [DOI] [PubMed] [Google Scholar]
- Wada Y, Kawabata Y, Kotosaka S, Yamamoto K, Kitazawa S, Kawato M. Acquisition and contextual switching of multiple internal models for different viscous force fields. Neurosci Res. 2003;46:319–331. doi: 10.1016/S0168-0102(03)00094-4. [DOI] [PubMed] [Google Scholar]
- Wiestler T, McGonigle DJ, Diedrichsen J. Integration of sensory and motor representations of single fingers in the human cerebellum. J Neurophysiol. 2011;105:3042–3053. doi: 10.1152/jn.00106.2011. [DOI] [PubMed] [Google Scholar]
- Wigmore V, Tong C, Flanagan JR. Visuomotor rotations of varying size and direction compete for a single internal model in motor working memory. J Exp Psychol Hum Percept Perform. 2002;28:447–457. doi: 10.1037/0096-1523.28.2.447. [DOI] [PubMed] [Google Scholar]
- Wise SP, Moody SL, Blomstrom KJ, Mitz AR. Changes in motor cortical activity during visuomotor adaptation. Exp Brain Res. 1998;121:285–299. doi: 10.1007/s002210050462. [DOI] [PubMed] [Google Scholar]
- Wolpert DM, Kawato M. Multiple paired forward and inverse models for motor control. Neural Netw. 1998;11:1317–1329. doi: 10.1016/S0893-6080(98)00066-5. [DOI] [PubMed] [Google Scholar]
- Zach N, Inbar D, Grinvald Y, Vaadia E. Single neurons in m1 and premotor cortex directly reflect behavioral interference. PLoS ONE. 2012;7:e32986. doi: 10.1371/journal.pone.0032986. [DOI] [PMC free article] [PubMed] [Google Scholar]