

Abstract
Developmental perturbations during adolescence have been hypothesized to be a risk factor for the onset of several neuropsychiatric diseases. However the physiological alterations that result from such insults are incompletely understood. We investigated whether a defined perturbation during adolescence affected hippocampus-dependent sensorimotor gating functions, a proposed endophenotype in several psychiatric diseases, most notably schizophrenia. The developmental perturbation was induced during adolescence in mice using an antimitotic agent, methylazoxymethanol acetate (MAM), during postnatal weeks (PW) 4–6. MAM-treated mice showed a decrease in hippocampal neurogenesis immediately after treatment, which was restored by PW10 in adulthood. However, the mice treated with MAM during adolescent stages exhibited a persistent sensorimotor gating deficiency and a reduction in prepulse inhibition-related activation of hippocampal and prefrontal neurons in adulthood. Cellular analyses found a reduction of GABAergic inhibitory neurons and abnormal dendritic morphology of immature neurons in the dentate gyrus (DG). Interestingly, bilateral infusion of muscimol, a GABAA receptor agonist, into the DG region reversed the prepulse inhibition abnormality in MAM-treated mice. Furthermore, the behavioral deficits together with the decrease in the number of GABAergic neurons in this MAM model were rescued by exposure to an enriched environment during a defined critical adolescent period. These observations suggest a possible role for GABAergic interneurons in the DG during adolescence. This role may be related to the establishment of neural circuitry required for sensorimotor gating. It is plausible that changes in neurogenesis during this window may affect the survival of GABAergic interneurons, although this link needs to be causally addressed.
Introduction
In general, neuropsychiatric diseases, such as schizophrenia, are thought to result from a developmental defect with poorly defined etiology and pathophysiology (Weinberger, 1996; Lewis and Levitt, 2002; Rapoport et al., 2005). People who experience developmental insults in adolescence are hypothesized to be at risk for schizophrenia (Douaud et al., 2009; Gogtay et al., 2011). Therefore, studying this population could be key to understanding how abnormal neurodevelopment leads to subsequent psychopathology.
During adolescence, the brain undergoes extensive synaptic remodeling, including reductions in dendritic arborization, axon myelination, and pruning of synapses (Sisk and Zehr, 2005). The integrity of these processes may be crucial for a wide range of sensory and cognitive functions that are impaired in neuropsychiatric diseases (Lewis, 1997). Thus, given the importance of the hippocampus in several psychiatric diseases (Heckers and Konradi, 2010; Tamminga et al., 2010), we wanted to know whether perturbation in a defined adolescent period could affect hippocampal functions in adulthood.
Another noticeable feature of adolescence is the developmental change of the GABA inhibitory system (Kapur and Macdonald, 1999; Fleming et al., 2007). Abnormalities in the hippocampal GABA system, including a significant reduction in the number of interneurons, reduced GABA-receptor (GABAR) expression, and the disinhibition of pyramidal cells, have been implicated in a variety of neuropsychiatric disorders, including deficient sensorimotor processes (Lewis et al., 2004; Heckers and Konradi, 2010). A recent postmortem study has demonstrated developmental changes in the expression of GABA signaling genes in the hippocampus of normal subjects and this progressive pattern of expression is disturbed in schizophrenic patients (Hyde et al., 2011).
It is difficult to fully model neuropsychiatric diseases in rodents. However, endophenotypes in rodents have received considerable attention recently owing to greater tractability for their objective assessment in both rodents and humans. Sensorimotor gating is one such endophenotype that can be modeled in rodents (Cadenhead et al., 2000; Louchart-de la Chapelle et al., 2005). This process can be evaluated across several species, including human beings, using prepulse inhibition (PPI) testing (Ciaroni et al., 2002; Swerdlow et al., 2008). PPI is considered an endophenotype of several neuropsychiatric diseases, including schizophrenia (Braff et al., 2001; Braff and Light, 2005). Therefore, in this study, we focused on adolescent perturbations that caused transient decreases in neurogenesis and that may relate to the formation of the hippocampal GABAergic system and proper establishment of PPI (Swerdlow and Geyer, 1998; Bast and Feldon, 2003).
Methylazoxymethanol acetate (MAM) is an alkylating agent that exerts its effects on neuroblasts undergoing their final mitosis without affecting either glial cells or quiescent cells (Haddad et al., 1972; Cattaneo et al., 1995). Moreover, MAM treatment induces a transient decrease in postnatal neurogenesis, which can be rescued (Ciaroni et al., 1999). Here, we established a MAM-induced mouse model that showed a transient decrease in neurogenesis during a defined postnatal period and subsequent behavioral deficiencies in early adulthood. We propose a MAM-sensitive “vulnerable” period in adolescence, during which the dentate gyrus (DG) GABA system establishes the PPI circuitry and is modulated by enriched environment.
Materials and Methods
Animals.
Three-week-old male C57BL/6J mice were purchased from Japan Charles River and were maintained in the animal facility at Tohoku University School of Medicine, Sendai, Japan. To identify GABAergic interneurons, we used heterozygous GAD67-GFP knock-in mice expressing GFP under the control of the endogenous GAD67 gene promoter (Tamamaki et al., 2003). The mice were housed in pairs in standard housing conditions [cage, 25 × 18 cm (height, 15 cm); 22 ± 2°C] with a 12 h light-dark cycle (lights on at 8:00 A.M.) and with food and water available ad libitum. After 1 week of breeding and habituation in the animal facility, the mice were subjected to the experiments described below. All the animal experiments were performed in accordance with the National Institutes of Health guidelines for the care and use of laboratory animals and were approved by the Committee for Animal Experiments at Tohoku University.
MAM treatment and subsequent analyses.
Mice were subcutaneously injected with MAM (1, 3, or 5 mg/kg) or saline once a day for 2 weeks. For 5-bromo-2-deoxyuridine (BrdU) analysis, MAM-treated mice were injected with BrdU 24 h after the last MAM injection, and were killed 2 h later. For the behavioral analyses, the MAM-treated mice rested for 0 or 4 weeks, and were then subjected to further analyses.
PPI measurements.
PPI was measured as previously reported (Hayashi et al., 2008). The mice were tested in a startle chamber (SR-LAB System, San Diego Instruments). After the mice were placed into the chamber, they were allowed to habituate for a period of 10 min, during which 65 dB of white noise was generated in the background. The PPI test began and ended with five presentations of the startle trials (pulse, 120 dB; length, 40 ms), and these startle trials were excluded from the data analysis. After five startle trials, the animals randomly received 10 startle trials, 10 no-stimulus trials (pulse, 65 dB), and 30 PPI trials. The PPI trials were presented with a 68, 72, or 77 dB prepulse (i.e., 3, 6, or 12 dB higher than background, for 20 ms in length, indicated as PP3, PP6, and PP12, respectively), followed 100 ms later by a 40 ms, 120 dB pulse. Each of the three PPI trials (PP3, PP6, and PP12) was presented 10 times. The intertrial interval was between 10 and 20 s and the total session lasted ∼17 min. In the study, PPI-related c-fos expression, after 10 min habituation, 30 startle trials, or PPI trials (PP3, PP6 and PP12, randomly presented 10 times each) were delivered to the mice. The percentage PPI of the startle response was calculated using the following formula: 100 − [(SRPP/SR) × 100], where SR denotes the startle response to the pulse stimulus and SRPP denotes the startle response to the pulse with the prepulse stimulus.
Open-field test.
The animal was placed in the center of the activity-field arena of a transparent cage [50 × 50 cm (height, 30 cm)] for 10 min. The locomotor activity of each mouse was monitored for a total of 10 min with a video camera, a tracking system, and tracking software (ANY-maze, Stoelting), which allowed total movement activity to be read out directly and calculated.
Forced swim test.
A mouse was placed in a 10-cm-diameter cylinder filled with 25 ± 1°C water to a height of 10 cm and was exposed to swim stress for 7 min. The total duration of immobility during the last 6 min of the test was measured using the same tracking system used in the open-field test.
Exposure to enriched environment.
Four or five mice were raised together in a large cage [40 × 30 cm (height, 20 cm)] with running wheel, toys, extra nesting material, and small plastic houses and tubes. The objects were rearranged every 2 weeks. The enriched environment (EE) was maintained for 6 weeks [during postnatal weeks (PW) 4–10] or 4 weeks (during PW6–PW10). All of the groups were counterbalanced for saline or MAM treatment; therefore multiple groups of animals were generated: standard housing with saline injection, standard housing with MAM injection, 6 week or 4 week enriched housing with saline injection, and 6 week or 4 week enriched housing with MAM injection.
Elevated plus maze.
This apparatus consisted of a plus-shaped maze elevated 60 cm from the floor and comprised two opposing open arms (25 × 5 cm each) and two arms of the same dimensions enclosed by 30-cm-high walls with an open roof. In addition, a 1-cm-high clear Plexiglas edge surrounded the open arms to prevent falls. Each animal was placed in the middle of the maze facing the open arm. Following 10 min of testing, the animals were returned to their home cages. Arm preference was automatically analyzed using ANY-maze video tracking software.
Immunohistochemistry.
Immunohistochemistry was performed as described previously (Matsumata et al., 2012). Briefly, mice were anesthetized with sodium pentobarbital (40 mg/kg, i.p.) and were transcardially perfused with 0.9% NaCl solution (preheated at 37°C), followed by fixation with 4% paraformaldehyde dissolved in 0.01 m phosphate-buffer saline (PBS) at 4°C. After decapitation, the brains were removed from the skull and submerged in a series of sucrose solutions from (10, 20, and 30%) until they sank. The frozen brains were sectioned into 16-μm-thick coronal sections using a cryostat (CM3050, Leica). The sections were washed with Tris-buffered saline containing Tween 20, pH 7.4. For immunostaining, the cryostat sections were incubated with primary antibodies overnight at 4°C and were then incubated at 4°C for 2 h with the appropriate secondary antibodies. Fluorescently labeled sections were visualized using either a confocal laser scanning microscope (LSM5 PASCAL, Carl Zeiss, http://www.Zeiss.com) or a fluorescence microscope (AxioPlan2, Carl Zeiss; BZ-9000, Keyence) using a 20× objective lens. Images of single optical sections were captured and recorded digitally. Information concerning the antibodies used in this study is presented in Table 1.
Table 1.
Antibodies used
| Antibody | Species | Working dilution | Vender |
|---|---|---|---|
| BrdU | Rat IgG2a | 1:500 | AbD Serotec |
| Caspase-3 | Rabbit IgG | 1:400 | BD Pharmingen |
| c-fos | Rabbit IgG | 1:500 | Santa Cruz Biotechnology |
| Doublecortin | Rabbit IgG | 1:1000 | Abcam |
| GFP | Chicken IgY | 1:500 | Abcam |
| Parvalbumin | Mouse IgG1 | 1:1000 | Chemicon |
| Anti-chicken IgG Alexa 488 | Goat IgG | 1:400 | Invitrogen |
| Anti-mouse IgG Cy3 | Donkey IgG | 1:400 | Jackson ImmunoResearch |
| Anti-rabbit IgG Cy3 | Donkey IgG | 1:400 | Jackson ImmunoResearch |
| Anti-rat IgG Alexa 488 | Goat IgG | 1:400 | Invitrogen |
BrdU labeling, immunofluoresence, and quantification of labeled cells.
Mice were intraperitoneally injected with BrdU at 25 or 50 mg/kg body weight (10 mg/ml stock, dissolved in 0.9% saline), and brains were collected either 2 h or 4 weeks after BrdU injection to visualize the proliferation and survival of hippocampal newborn cells. Before incubation with an anti-BrdU antibody, the frozen sections (16 μm) were boiled in 0.01 m citric acid for 15 min, incubated in 2N HCl for 10 min at 37°C, and washed in 0.01 m PBS. For quantification analyses, BrdU+ cells, caspase3+ cells, c-fos+ cells, and parvalbumin+ cells were counted throughout rostra-caudal extension of the DG. The c-fos+ cells in the prelimbic (PL) cortex and nucleus accumbens were restricted to two discrete points from 2.34 and 1.70 mm bregma. Because the brightness of c-fos+ cells varied with different intensity, we set a brightness threshold at 200% of the background level; cell nuclei darker than the threshold value were not considered to be positive for c-Fos and were not counted. Quantification of doublecortin+ (DCX+) cell density was restricted to two discrete points from bregma that represented the anterior (−1.94 mm from bregma) and posterior (−2.92 mm from bregma) DG. DCX+ cells were morphologically categorized into two groups according to previously established criteria (Plümpe et al., 2006, see results). Approximately 300 DCX+ cells were analyzed per animal. Every sixth section of the hippocampus was used for cell counting, and the total number of positive cells was obtained by multiplying the value by 6.
Muscimol administration.
For cannula implantation, mice were anesthetized with sodium pentobarbital (60 mg/kg, i.p.) and fixed in a stereotaxic frame (Narishige SN-2). A pair of cannulae were implanted bilaterally with stainless steel guide cannulae (8 mm; 26 gauge) aimed at the DG region (bregma, −2.0 mm; lateral, ±1.5 mm; depth, 1.5 mm). Dummy cannulae were inserted into the guide cannulae to reduce the risk of infection. The mice recovered for at least 7 d before receiving behavioral training. The GABAAR agonist muscimol (Sigma-Aldrich) was diluted in saline, and 10 or 100 ng was administered to each side of the brain. Fluorescein isothiocyanate (FITC) (Jackson ImmunoResearch), either 50 or 500 ng per hemisphere, was bilaterally injected into the region of DG to visualize the spread of the muscimol. The mouse was gently held during drug infusion. The dummy cannula was removed from the guide cannula. An injection needle (30 gauge; length, 8.8 mm) was inserted into the guide cannula to a depth of 0.8 mm lower than the guide cannula (depth, 1.5 mm). Muscimol was bilaterally infused into the DG region (1.0 μl to each hemisphere) at a rate of 0.2 μl/min. The infusion was administered 15–20 min before the PPI test. The injection needle remained in the guide cannula for an additional 3 min after the infusion was completed. Then, the dummy cannula was reinserted into the guide cannula.
Statistics.
Data in the text and figures are expressed as the means ± SEM, and were analyzed using ANOVA, or ANOVA repeated measures. The body weights of the saline-treated and MAM-treated mice were analyzed using a one-way ANOVA for the body weight at the final injection day and the repeated ANOVA for body weight over injection time. The PPI experiments were analyzed using two-way ANOVAs with group treatment and prepulse intensity as the between-subject factors. This is followed by a one-way ANOVA for the single prepulse intensities tested. All statistical analysis was conducted using STATISTICA (StatSoft). p < 0.05 was defined as statistically significant.
Results
MAM treatment during the adolescent stage induced sensorimotor gating deficits in young adults
To optimize the appropriate conditions of MAM treatment for later experiments, we first determined the dose of MAM required for a robust depletion of newborn cells without impairment of the overall health of the mice (Fig. 1). As established in the literature, adolescence occurs during postnatal days 28–42 in male rodents (Spear, 2000). Therefore, we first target PW4–PW6 in mice. Treatment with 1 mg/kg MAM per day during PW4–PW6 (Fig. 1A) effectively blocked neurogenesis and preserved body weight at PW6 levels, and neurogenesis returned to the control levels at PW10. Higher concentrations caused a slightly greater blockade of neurogenesis but body weight was also significantly affected (Fig. 1B–E). We examined the sensorimotor gating function using the PPI paradigm at both PW6 and PW10. At PW10, but not at PW6, a significant reduction in PPI was observed for all prepulse levels (Fig. 2A,B). The acoustic startle response and the response to background were unchanged at PW10 (Fig. 2G,H).
Figure 1.
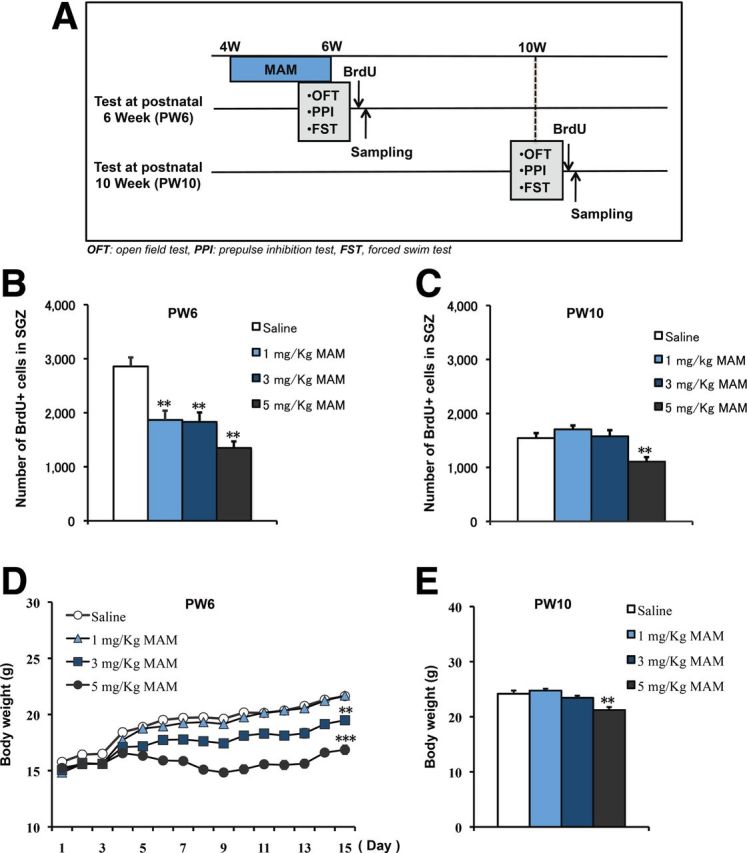
Decrease in newborn cell proliferation at PW6 by MAM treatment and rescue at PW10. A, Experimental design for MAM treatment and behavioral tests. B, ANOVA analysis revealed a significant decrease in newborn cell numbers in a dose-dependent manner immediately after 2 week MAM treatment (F(3,28) = 15.58428, p < 0.0001, n = 8 mice for each group). C, Rescue of new cell proliferation was observed 4 weeks later at PW10 (F(2,21) = 1.88832, p = 0.17614 for 1 mg/kg and 3 mg/kg MAM vs saline control), except for the highest dose of MAM treatment (F(1,14) = 30.96936, p = 0.00007 for 5 mg/kg MAM vs saline control, n = 8 mice for each group). D, MAM treatment induced a dose-dependent change in body weight (repeated ANOVA: F(3,44) = 116.77, p < 0.001; 1-way ANOVA at the last day of MAM treatment: F(1,22) = 0.02353, p = 0.87949 for 1 mg/kg MAM vs saline control; F(1,22) = 26.76762, p = 0.00003 for 3 mg/kg MAM vs saline control; F(1,22) = 106.61121, p < 0.0001, n = 12 mice for each group). E, Body weights were recovered by PW10 (F(2,21) = 2.12923, p = 0.14389 at 1 mg/kg and 3 mg/kg MAM vs saline control, n = 8 mice for each group), except for the highest dose of MAM (F(1,14) = 13.92006, p = 0.00224 for 5 mg/kg MAM vs saline control, n = 8 mice for each group). *p < 0.05; **p < 0.01.
Figure 2.
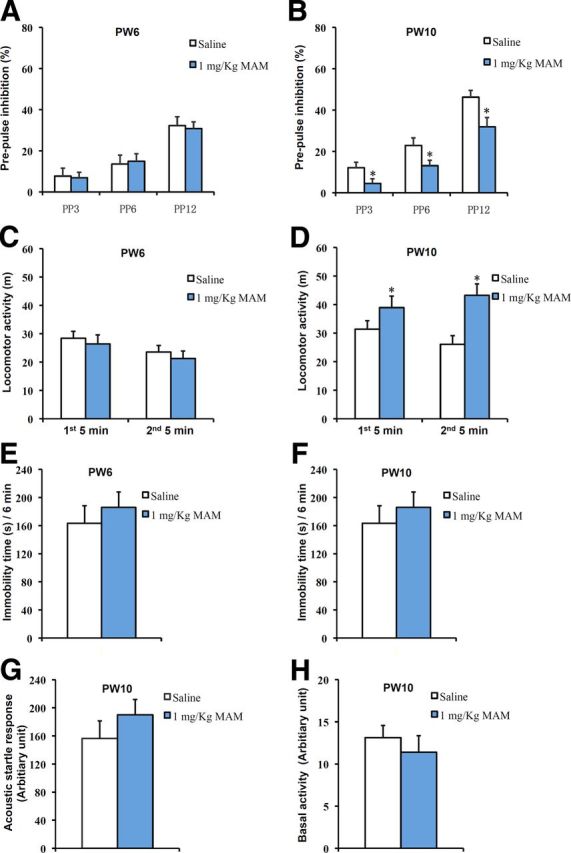
PPI deficiency and increased spontaneous hyperactivity were observed at PW10 but not at PW6 in MAM-treated mice. A, The PPI scores were not different between the saline-treated and MAM-treated groups at PW6 (2-way ANOVA with group treatment and prepulse intensity: F(2,42) = 0.0904, p = 0.914; 1-way ANOVA with PP3: F(1,14) = 0.02919, p = 0.86678; PP6: F(1,14) = 0.09199, p = 0.76612; PP12: F(1,14) = 0.06947, p = 0.9595 for MAM vs saline, n = 8 for each group). B, PPI deficits were observed at each prepulse intensity level in MAM-treated mice at PW10 (2-way ANOVA with group treatment and prepulse intensity: F(2,42) = 0.561, p = 0.575; 1-way ANOVA with PP3: F(1,14) = 4.76369, p = 0.04659; PP6: F(1,14) = 4.61941, p = 0.04958; PP12: F(1,14) = 6.58918, p = 0.02237 for MAM vs saline, n = 8 for each group). C, There was no change in spontaneous activity between groups at PW6 (first 5 min, F(1,10) = 0.24641, p = 0.63034; second 5 min, F(1,10) = 0.3524, p = 0.56594 for MAM vs saline, n = 6 for each group). D, Spontaneous hyperactivity was observed in the MAM group at PW10 (first 5 min: F(1,12) = 7.45188, p = 0.01827; second 5 min: F(1,12) = 7.6342, p = 0.01718 for MAM vs saline, n = 7 for each group). E, F, During the 6 min forced swimming test, there were no differences in the immobility times (E) between groups at PW6 (F(1,12) = 1.28709, p = 0.29987 for MAM vs saline control, n = 7 for each group) or (F) between groups at PW10 (F(1,16) = 0.68658, p = 0.41952 for MAM vs saline, n = 9 mice for each group). G, There was no difference between the two groups in the acoustic startle response to the startle stimulus at PW10 (F(1,14) = 0.52523, p = 0.48056 for MAM vs saline, n = 8 mice for each group). H, There was no difference between the two groups in the response to the background stimulus at PW10 (F(1,14) = 0.50669, p = 0.48827 for MAM vs saline, n = 8 mice for each group). *p < 0.05 vs saline control.
To gain greater insight into the general physical state of MAM-treated mice, we performed the behavioral tests at PW6 and PW10. As shown, spontaneous locomotor activity was unchanged between the two groups at PW6, but MAM-treated mice became hyperactive at PW10 (Fig. 2C,D). MAM treatment did not induce depression-like behavior, as measured by either the immobility time within the recording period (Fig. 2E,F) or by the latency to first immobility (one-way ANOVA, F(1,16) = 0.57682, p = 0.45861 for MAM vs saline) in the forced swim test during the juvenile stage or in early adulthood.
Therefore, MAM treatment during the adolescent stage transiently decreased hippocampal neurogenesis and specifically impaired sensorimotor gating and locomotor activity in early adulthood.
Developmental effects of MAM treatment on PPI scores
We next examined the PPI scores of mice treated with MAM during four different postnatal periods (Fig. 3A). As shown in Figure 3B, MAM treatment during PW3–PW5 produced a deficit in PPI at PW10 at all the prepulse levels. Similar results were obtained for MAM treatment during PW4–PW6 (Fig. 3C). PPI impairment was also observed at PW18 (Fig. 3G), suggesting a persistent effect of MAM treatment on PPI deficiency. However, when mice were exposed to MAM during PW5–PW7, the reducing effect of MAM treatment on PPI was observed only for the PP3 prepulse level at PW10 (Fig. 3D). The mice treated with MAM during PW6–PW8 exhibited no significant difference at any prepulse intensity level at either PW10 (Fig. 3E) or PW12 (Fig. 3F). Regarding neurogenesis, all of the groups displayed a similar reduction in the number of BrdU+ cells immediately after MAM treatment (Figs. 1B, 3H), showing that the MAM treatment was effective in all conditions. As mentioned above, when MAM treatment began after PW6, the PPI deficit was not observed. These results indicate a defined postnatal period during which MAM perturbation leads to PPI deficits that persist into adulthood.
Figure 3.
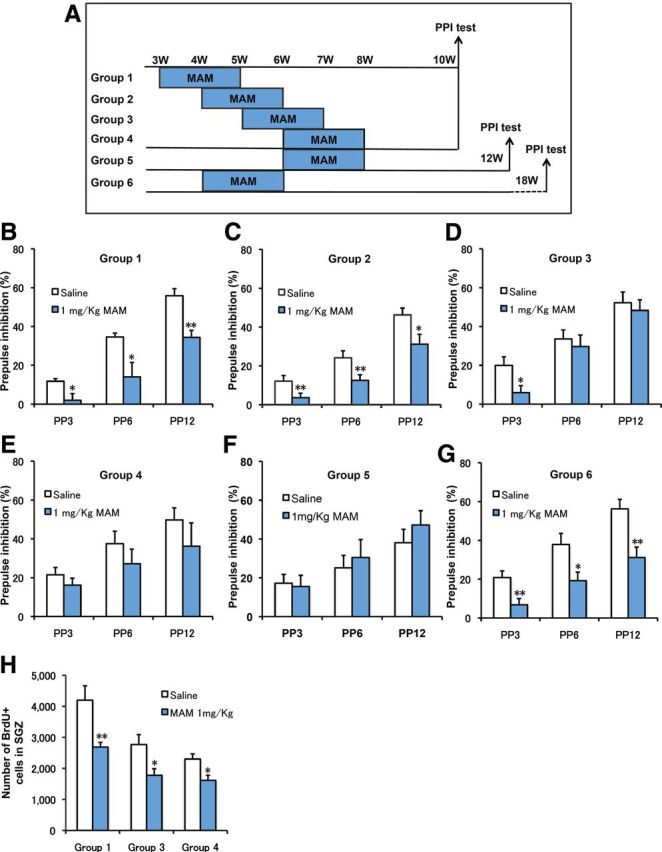
Developmental changes in PPI performance induced by MAM treatment. A, Experimental design for MAM treatment at different periods and PPI testing at PW10 or PW18. B, PPI defects were observed at PW10 in animals that received MAM treatment during PW3–PW5 (2-way ANOVA with group treatment and prepulse intensity: F(2,33) = 1.102, p = 0.344; 1-way ANOVA with PP3: F(1,11) = 5.95075, p = 0.03286; PP6: F(1,11) = 6.35471, p = 0.02844; PP12: F(1,11) = 14.28306, p = 0.00305 for MAM vs saline, n = 7 for saline and n = 6 for MAM). C, PPI deficits were observed at PW10 following MAM treatment during PW4–PW6 (2-way ANOVA with group treatment and prepulse intensity: F(4,36) = 0.676, p = 0.613; 1-way ANOVA with PP3: F(1,13) = 5.69986, p = 0.03285; PP6: F(1,13) = 6.39256, p = 0.0252; PP12: F(1,13) = 6.46156, p = 0.02456 for MAM vs saline, n = 8 for saline and n = 7 for MAM). D, PPI defects were observed only in PP3 at PW10 in animals that received MAM treatment during PW5–PW7 (2-way ANOVA with group treatment and prepulse intensity: F(2,33) = 0.56, p = 0.577; 1-way ANOVA with PP3: F(1,11) = 4.98357, p = 0.04733; PP6: F(1,11) = 0.21936, p = 0.64867; PP12: F(1,11) = 0.21027, p = 0.65549 for MAM vs saline, n = 7 for saline and n = 6 for MAM). E, There were no changes in PPI scores due to MAM treatment during PW6–PW8 (2-way ANOVA with group treatment and prepulse intensity: F(2,36) = 0.146, p = 0.864; 1-way ANOVA with PP3: F(1,12) = 0.91403, p = 0.35791; PP6: F(1,12) = 0.94648, p = 0.34982; PP12: F(1,12) = 0.8762, p = 0.3677 for MAM vs saline, n = 7 for each group). F, There were no changes in PPIs tested at PW12 following a 2 week MAM treatment during PW6–PW8 (2-way ANOVA with group treatment and prepulse intensity: F(2,42) = 0.319, p = 0.729; 1-way ANOVA with PP3: F(1,14) = 0.05173, p = 0.82336; PP6: F(1,14) = 0.22695, p = 0.64115; PP12: F(1,14) = 0.81549, p = 0.38178 for MAM vs saline, n = 5 for each group). G, PPI deficits were observed at PW18 following MAM treatment during PW4–PW6 (2-way ANOVA with group treatment and prepulse intensity: F(2,42) = 0.832, p = 0.442; 1-way ANOVA with PP3: F(1,14) = 10.28012, p = 0.00634; PP6: F(1,14) = 7.6342, p = 0.01525; PP12: F(1,14) = 13.58056, p = 0.00245 for MAM vs saline, n = 8 for saline and n = 7 for MAM). H, ANOVA analysis revealed that MAM treatment during PW3–PW5 (Group 1), PW5–PW7 (Group 3), or PW6–PW8 (Group 4) significantly decreased the number of newborn cells, identified by BrdU staining (Group 1: F(1,14) = 9.66715, p = 0.00769; Group 3: F(1,14) = 6.89389, p = 0.01996; Group 4: F(1,14) = 8.6382, p = 0.01078 for MAM vs saline control, n = 8 mice for each group). *p < 0.05 vs saline control; **p < 0.01 vs saline control.
PPI-associated hippocampal activation was blocked by MAM treatment
To further identify how hippocampal dysfunction affects sensorimotor gating function in our mouse model, we examined neuronal activation in the DG after PPI testing. Mice were treated with saline or MAM from PW4 to PW6, as described previously. Concurrently, a low dose of BrdU (25 mg/kg) was delivered during this period to evaluate newborn cells. Four weeks later, each group of mice was exposed to 30 trials of a startle stimulus, either with or without a prepulse. The mice were scarified 2 h later (Fig. 4A). ANOVA analysis revealed a significant increase in the number of c-fos+ cells in the startle-with-prepulse group compared with the startle-only group with saline treatment (p = 0.049), but this increase was completely ameliorated by MAM treatment compared with the startle-only group with MAM treatment (p = 0.93) (Fig. 4B). Furthermore, startle-with-prepulse testing with MAM treatment induced a significant decrease in the number of c-fos+ cells, but this effect was not observed in the startle-only group (Fig. 4B,C). However, only a few of the BrdU+ cells that survived for 4–6 weeks were positive for c-fos (4 of 467; Fig. 5). These data consistently indicate that MAM perturbation during the “critical period” causes decreased hippocampal neurogenesis and impaired DG activation in the PPI paradigm, which suggests the noncell autonomous involvement of the newborn cells in the establishment of the PPI circuit.
Figure 4.
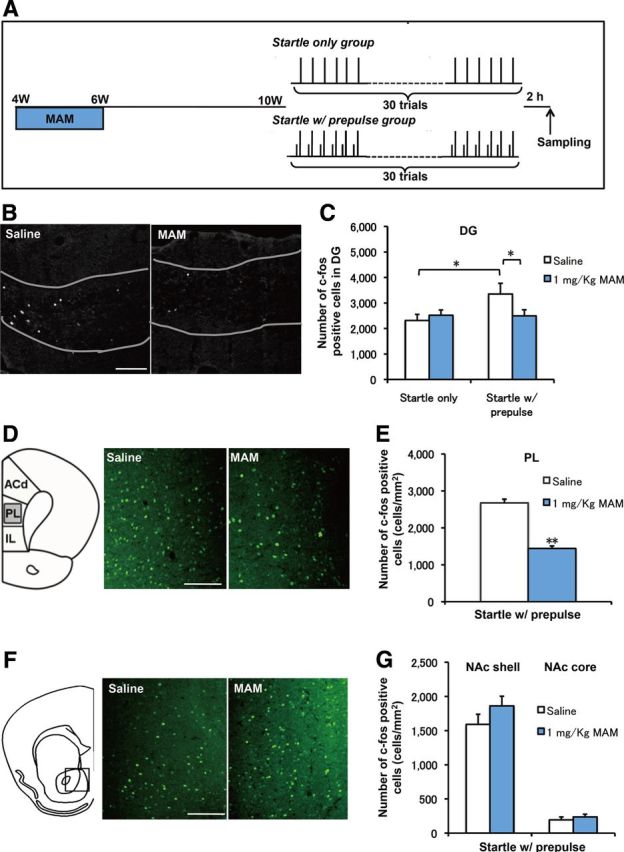
PPI-induced hippocampal activation was blocked by MAM treatment. A, Experimental design of MAM treatment and the behavioral manipulation protocol. B, Representative c-fos staining in the DG. C, There was an increase in the number of c-fos+ cells in the startle-with-prepulse group compared with the startle-only group (F(1,14) = 4.62166, p = 0.04953 startle with prepulse plus saline vs startle only plus saline, n = 8 for each group), but this increase was blocked by MAM treatment during PW4–PW6 (F(1,16) = 4.54244, p = 0.4892 for startle with prepulse plus MAM vs startle with prepulse plus saline, n = 8 for startle with prepulse plus saline and n = 10 for startle with prepulse plus MAM). D, Representative c-fos staining in the PL cortex. E, MAM treatment decreased the number of c-fos+ cells in the PL cortex (F(1,18) = 89.19019, p < 0.001 for startle with prepulse plus MAM vs startle with prepulse plus saline, n = 10 for each group). E, Representative c-fos staining in the nucleus accumbence (NAc). F, There were no changes in c-fos+ cells in the NAc shell and NAc core between groups (NAc shell: F(1,20) = 1.79051, p = 0.19588 for MAM vs saline control, n = 11 for each group; NAc core: F(1,14) = 0.56137, p = 0.4611 for MAM vs saline n = 8 mice for each group). Scale bar, 200 μm. *p < 0.05; **p < 0.01.
Figure 5.

Representative double staining for c-fos and BrdU within the DG at PW10. A, Experimental design of MAM treatment, BrdU injection, and the behavioral manipulation protocol. B, Representative double staining for c-fos and BrdU within the DG at PW10. Scale bars: single labeled images, 200 μm; merged images, 50 μm.
We examined PPI-associated activation in other brain regions to further determine the effects of MAM treatment. In PL cortex (Fig. 4D), which receives an efferent projection from the ventral hippocampus (Saint Marie et al., 2010), the number of c-fos+ cells in MAM-treated mice was significantly decreased compared with the saline group (Fig. 4E). However, in the shell or the core of the nucleus accumbence, there was no change in PPI-associated c-fos expression between the saline and MAM groups (Fig. 4F,G). These results exclude a global toxic effect of MAM treatment but instead emphasize a specific dysfunction of the hippocampus and PL cortex in the PPI-related regulatory neural circuitry in our animal model.
Disturbance of the GABA system by MAM treatment
As mentioned earlier, MAM treatment caused impaired hippocampal neurogenesis in adolescence and reduced activation of the DG during PPI testing. However, the c-fos+ neurons detected shortly after PPI task were not granule cells newly generated during the critical period because c-fos+ cells in the DG were rarely positive for BrdU (Fig. 5). These data suggest that MAM treatment during adolescence modulates neuronal activation through other mechanisms that may not be linked to changes in neurogenesis. Therefore, we examined changes in inhibition, as inhibition in the DG is critical for maintaining a sparse pattern of activation and optimal function of the DG in encoding. We used GAD67-GFP knock-in mice (Tamamaki et al., 2003; Hoskison et al., 2007; Doischer et al., 2008) to quantify the number of GABAergic interneurons. We also examined parvalbumin (PV)-containing GABAergic neurons that provide inhibitory input to the perisomatic region of principal cells.
Mice were exposed to MAM during PW4–PW6, and the total number of GFP+ and PV+ neurons in the DG were analyzed at PW10 (Fig. 6A). In the DG, exposure to MAM resulted in a significant decrease in the total number of GFP+ and PV+ interneurons (Fig. 6B,C). In contrast, the total number of PV+ cells was not altered in the non-neurogenic cornu ammonis areas (i.e., CA1, CA2, and CA3 regions) (Fig. 6D). Therefore, the influence of MAM treatment on inhibitory circuit was specific to the DG although MAM may directly affect the inhibitory system, suggesting a developmental consequence of neurogenic ablation during the critical adolescent stage.
Figure 6.
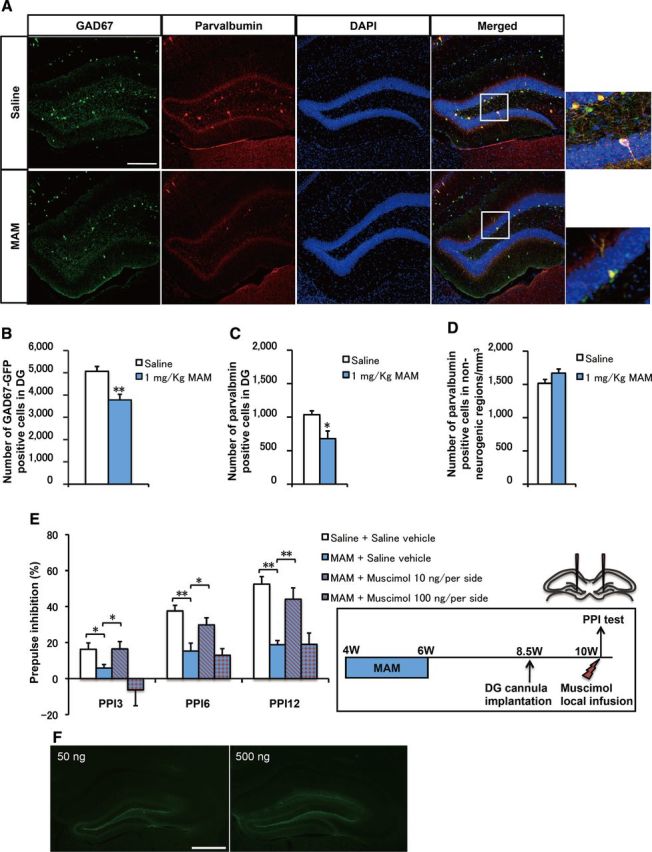
MAM-treated mice showed decreased numbers of GABA interneurons and PPI deficits rescued by a 6 week EE application and local DG infusion of the GABAAR agonist muscimol. A, Representative GAD67-EGFP and PV staining in the DG. Scale bar, 200 μm. B, C, The numbers of (B) GAD67-EGFP+ cells (F(1,14) = 14.90636, p = 0.00173 for MAM vs saline, n = 8 for each group) and (C) PV+ cells (F(1,14) = 7.85009, p = 0.01413 for MAM vs saline, n = 8 for each group) in the DG were decreased by MAM treatment. D, There were no changes in the numbers of PV+ cells in non-neurogenic regions (CA1, CA2, and CA3) (F(1,14) = 2.7165, p = 0.12157 for MAM vs saline, n = 8 samples for each group). E, The groups of mice were bilaterally implanted with cannulae into DG at PW8.5 and locally infused with muscimol at PW10 (left). As shown, PPI deficits were observed in the MAM group at PW10 (2-way ANOVA with group treatment and prepulse intensity: F(9,44) = 0.885, p = 0.546; 1-way ANOVA with PP3: F(1,10) = 6.80619, p = 0.03119; PP6: F(1,10) = 17.16855, p = 0.00324; PP12: F(1,10) = 49.75486, p = 0.000113 for saline plus saline vehicle group vs MAM plus saline vehicle group) and these deficits were further rescued by a local DG muscimol infusion of 10 ng/per hemisphere (PP3: F(1,10) = 5.36461, p = 0.04921; PP6: F(1,10) = 6.0888, p = 0.03886; PP12: F(1,10) = 14.19858, p = 0.00548 for MAM plus saline vehicle group vs MAM plus 10 ng/per hemisphere muscimol group), but not by a local DG muscimol infusion of 100 ng/per hemisphere (PP3: F(1,10) = 1.77437, p = 0.21954; PP6: F(1,10) = 0.16899, p = 0.6918; PP12: F(1,10) = 0.00142, p = 0.97089 for MAM plus saline vehicle group vs MAM plus 100 ng/per hemisphere muscimol group, n = 6 mice for each group). F, Representative images for bilaterally local injection of FITC (left, 50 ng/per hemisphere; right, 500 ng/per hemisphere) into DG to visualize the spread of muscimol. Scale bar, 200 μm. *p < 0.05; **p < 0.01.
To further examine the GABA system deficiency in our animal model, we investigated the effect of GABAAR activation against MAM treatment (Fig. 6E). Mice were exposed to MAM from PW4 to PW6 and, 4 weeks later, the GABAAR agonist muscimol (10 or 100 ng per hemisphere) was bilaterally infused into the DG region 15–20 min before PPI testing (Fig. 6E, left). Saline was infused as a vehicle control. MAM treatment from PW4 to PW6 produced a significant deficit at every prepulse intensity level (Fig. 6E). The MAM-induced PPI deficits were rescued by a bilateral acute infusion of 10 ng per hemisphere muscimol into the DG (Fig. 6E). However, the higher dose of muscimol, 100 ng per hemisphere, failed to rescue the PPI deficits. The similar molar amount of florescent dye of FITC was injected into DG to visualize the spread of the muscimol. As shown, FITC was restricted to the DG without spreading into the CA1 or CA3 region of hippocampus (Fig. 6F). These results indicate that the GABAergic abnormality in the DG is associated with the deficient PPI phenotype in our animal model, and further suggest that the balance between excitatory and inhibitory inputs might be significant for the proper establishment of PPI.
Rescue of PPI deficits by exposure to EE
To further examine the link between the decrease in neurogenesis and the impairment in PPI performance, we applied an EE regimen, which increased neurogenesis in the DG (Kempermann et al., 1997). Mice were treated with MAM from PW4 to PW6 and were maintained in an EE from PW4 to PW10 (6 week EE application) or normal conditions. At PW10, the PPI scores and other behavioral abnormalities of the mice were evaluated (Fig. 7A). Although an EE application did not alter PPI performance in mice without MAM treatment (Fig. 7B), a 6 week exposure to an EE restored the PPI deficits that had been induced by MAM treatment at all the prepulse intensity levels (Fig. 7B). In addition, MAM-induced spontaneous hyperactivity in the open-field test (Fig. 7C) was also rescued by the 6 week EE application. Furthermore, we examined the effects of the EE application on anxiety behavior in the elevated plus maze test. MAM-treated mice spent significantly less time in open arms than the control mice, and this difference was rescued by a 6 week EE application (Fig. 7D). Therefore, all three abnormal behavioral phenotypes (PPI deficits, hyperactivity, and anxiety), which were induced by MAM treatment during PW4–PW6, could be reversed by placing the mice in an EE during the 2 week MAM treatment.
Figure 7.
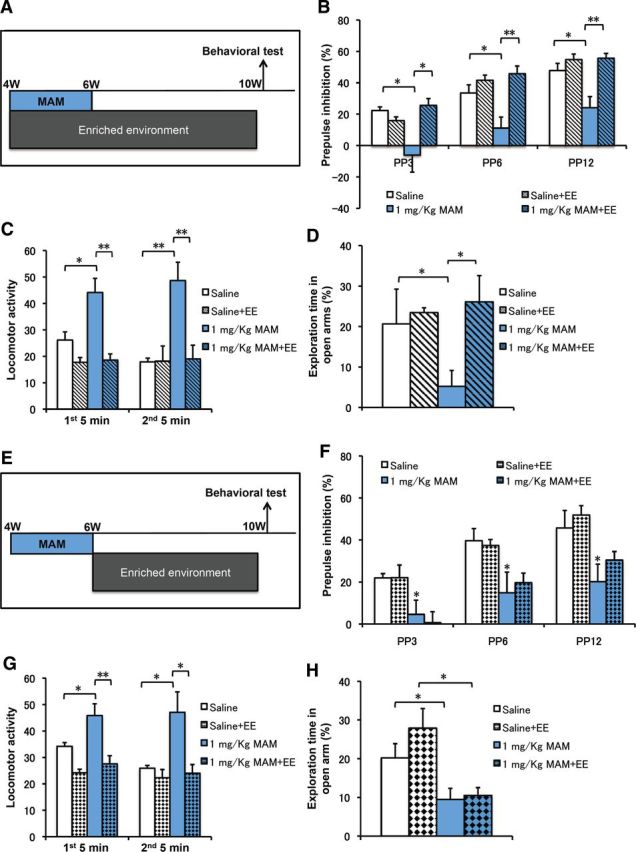
Behavioral defects in MAM mice were rescued by an EE application that included PW4–PW6. A, Experimental design for MAM treatment, EE application during PW4–PW10, and PPI testing. B, MAM group displayed PPI deficits, which were rescued by an EE application during PW4–PW10 (2-way ANOVA with group treatment and prepulse intensity: F(9,44) = 0.999, p = 0.455; 1-way ANOVA with blue bar, PP3: F(1,10) = 5.35715, p = 0.04934; PP6: F(1,10) = 5.52419, p = 0.04666; PP12: F(1,10) = 6.53438, p = 0.03384 for MAM vs saline; hatched blue bar, PP3: F(1,10) = 6.01467, p = 0.03978; PP6: F(1,10) = 13.71342, p = 0.00602; PP12: F(1,10) = 13.79835, p = 0.00592 for MAM plus EE vs MAM, n = 6 for each group). C, The spontaneous hyperactivity in the MAM group was rescued by EE application during PW4–PW10 (first minutes: F(1,10) = 8.44982, p = 0.01565 for MAM vs saline; F(1,10) = 19.25921, p = 0.00136 for MAM plus EE vs MAM; second 5 min: F(1,10) = 26.81883, p = 0.00023 for MAM vs saline; F(1,10) = 23.71114, p = 0.00039 for MAM plus EE vs MAM, n = 6 for each group). D, Anxiety-like behaviors in the MAM group were also rescued by EE application (F(1,10) = 6.33847, p = 0.03051 for MAM vs saline, F(1,10) = 10.00856, p = 0.0101 for MAM plus EE vs MAM, n = 6 for each group). *p < 0.05; **p < 0.01. E, Experimental design for MAM treatment, EE application during PW6–PW10 and PPI testing. F, The MAM group displayed PPI deficits that were not rescued by an EE application during PW6–PW10 (2-way ANOVA with group treatment and prepulse intensity: F(9,56) = 0.902, p = 0.53; 1-way ANOVA with blue bar, PP3: F(1,10) = 5.03714, p = 0.04864; PP6: F(1,10) = 10.97326, p = 0.00784; PP12: F(1,10) = 7.63621, p = 0.02001 for MAM vs saline; hatched blue bar, PP3: F(1,10) = 0.90189, p = 0.36466; PP6: F(1,10) = 0.45422, p = 0.51561; PP12: F(1,10) = 0.00407, p = 0.9504 for MAM vs saline, n = 6 for each group). G, The spontaneous hyperactivity in the MAM group was rescued by EE application during PW6–PW10 (first minutes: F(1,10) = 6.17334, p = 0.03229 for MAM vs saline; F(1,10) = 11.23893, p = 0.00733 for MAM plus EE vs MAM; second 5 min: F(1,10) = 7.35725, p = 0.02184 for MAM vs saline; F(1,10) = 7.53281, p = 0.02067 for MAM plus EE vs MAM, n = 6 mice for each group). H, Anxiety-like behaviors in the MAM group were also rescued by EE application (F(1,10) = 5.25848, p = 0.04477 for MAM vs saline; F(1,10) = 0.55739, p = 0.4725 for MAM plus EE vs MAM, n = 6 mice for each group). *p < 0.05; **p < 0.01.
To further examine the critical period during which the rescue effects were delivered by EE application, we designed another experiment to perform a 4 week EE application from PW6 to PW10, which excluded the 2 week MAM-treatment period (Fig. 7E). In contrast to the 6 week EE application, the 4 week EE application that excluded the critical period failed to rescue the MAM-induced PPI deficits (Fig. 7F). Regarding the other tests, the 4 week EE application decreased MAM-induced spontaneous hyperactivity (Fig. 7G), which is consistent with a previous report (Brenes et al., 2008). However, the same 4 week EE did not rescue the MAM-induced anxiety behavior (Fig. 7H). An ANOVA analysis comparing the 6 and 4 week EE against the MAM group (p = 0.045) confirmed a rescue by the 6 week EE but not by the 4 week EE treatment. That is, the difference in anxiety levels in the mice exposed to EE results from the exclusion of the 2 week period of MAM treatment during the EE exposure.
To further address the critical period, we also examined the anxiety-related behaviors of mice treated with MAM at three different stages (Fig. 8A). As shown, mice treated with MAM during PW3–PW5 spent less time in the open arms of the maze than the control group (Fig. 8B), whereas those treated either during PW5–PW7 (Fig. 8C) or during PW6–PW8 (Fig. 8D) did not show any significant differences when compared with the control group. We also confirmed that, for mice treated with MAM during PW4–PW6, EE application during PW6–PW12 ameliorated hyperactivity but failed to rescue PPI deficits or anxiety-related behaviors (data not shown). Together, these results demonstrate the existence of a defined period for postnatal environmental intervention, which is subsequently related to the establishment of PPI and anxiety-related behaviors but not to hyperactivity. This observation proposes a beneficial role of an EE during the adolescent critical period against the onset of schizophrenia-like behaviors in early adulthood.
Figure 8.
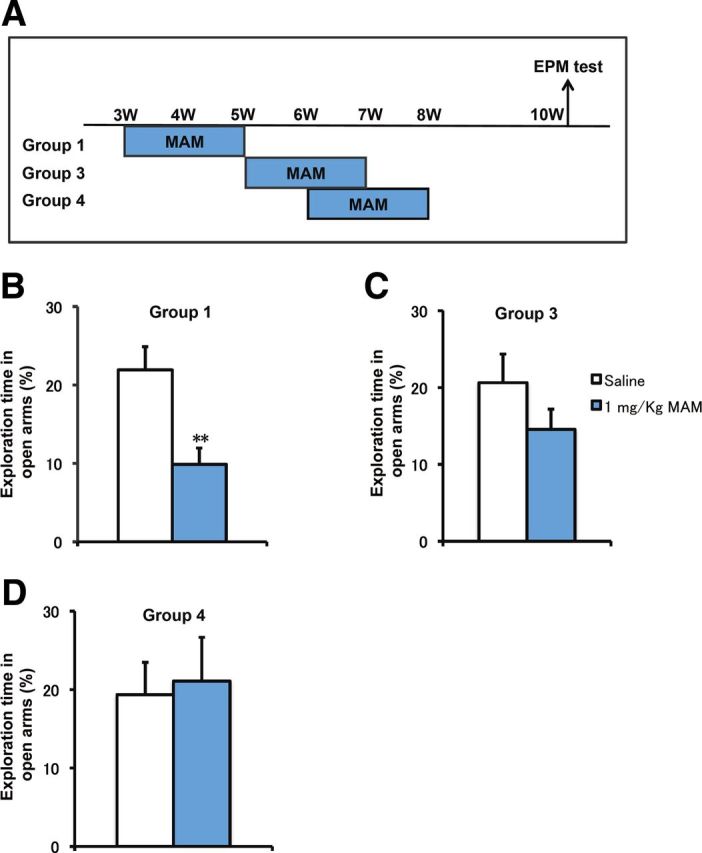
Developmental changes in the elevated plus maze (EPM) test induced by MAM treatment. A, Experimental design for MAM treatment at different periods and EPM testing at PW10. B, Anxiety-like behaviors were observed at PW10 in animals that received MAM treatment during PW3–PW5 (F(1,14) = 11.11031, p = 0.00493 for MAM vs saline, n = 8 for each group). C, D, Mice with MAM treatment at PW5–PW7 (C) and PW6–PW8 (D) showed normal behavioral phenotypes compared with the saline group in the EPM test at PW10 (PW5–PW7: F(1,14) = 1.76874, p = 0.2048; PW6–PW8: F(1,14) = 0.06245, p = 0.80629 for MAM vs saline, n = 8 for each group). *p < 0.05 vs saline control; **p < 0.01 vs saline control.
Morphological deficit in DCX+ cells was recovered by 6 week EE
We next examined how the different manipulations affected cellular phenotypes in the brain in the newborn neurons (Fig. 1C). We focused on a population of DCX+ cells, transient amplifying cells, and postmitotic immature neurons (Plümpe et al., 2006).
We estimated the density of DCX+ cells in the saline group, the MAM-treated group, the MAM-plus-4-week-EE group (EE application excluding the 2 week MAM treatment), and the MAM-plus-6-week-EE group (EE application including the 2 week MAM treatment) (Fig. 9A). There was no change in the density of DCX+ cells in the saline-treated and MAM-treated groups in the DG at PW10 (Fig. 9B), which is consistent with the full rescue of BrdU+ granule cells (Fig. 1C). As expected, both the 4 and 6 week EE conditions increased the density of DCX+ cells in the DG (Fig. 9B). Therefore, an overall increase in immature neurons is the common effect of EE application, regardless of inclusion or exclusion of the 2 week MAM exposure period. In contrast to the above results regarding the density of newly generated immature neurons, there was a marked difference in the morphology of the DCX+ cells among these groups. We categorized DCX+ cells into two types according to their morphological characteristics (Fig. 9C): immature type A cells had no or very short vertical processes and did not reach into the molecular layer (Fig. 9C, arrowhead), whereas more mature type B cells had thick vertical dendritic processes that reached the molecular layer (Fig. 9C, arrow). The ratio of the number of B cells to the total number of DCX+ cells was significantly decreased in the MAM-treated group. This ratio was rescued by a 6 week EE application but not by the 4 week EE application (Fig. 9D). This result was in parallel with the above findings: PPI deficits were rescued by 6 week EE application but not 4 week EE application (Fig. 7B,F).
Figure 9.
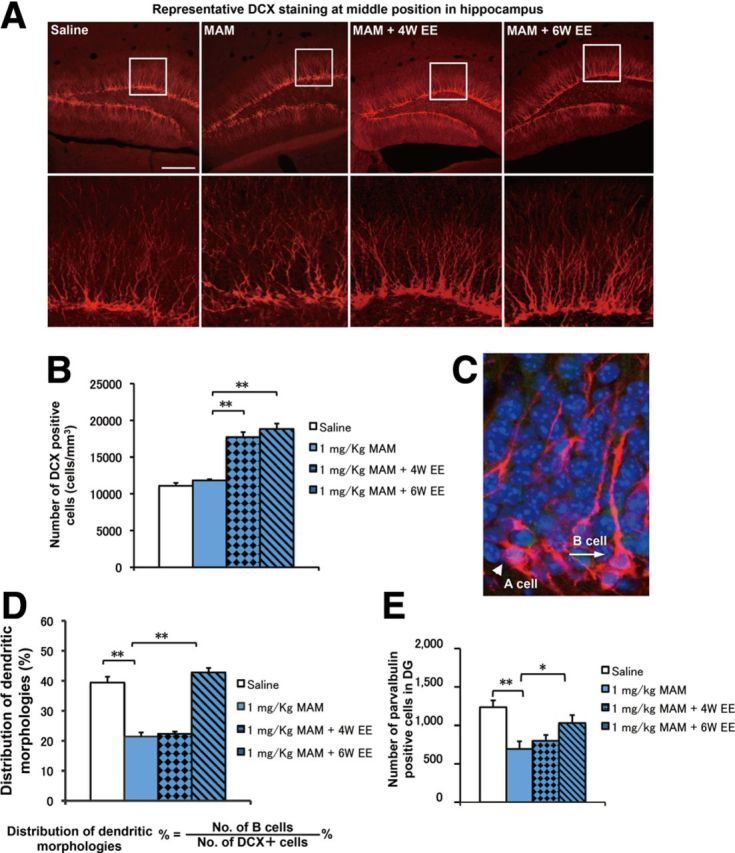
Morphological deficits in DCX+ cells were rescued by EE application in MAM-treated mice. A, Representative DCX staining in the DG in each group. Scale bar, 200 μm. B, The total number of DCX+ cells in the saline (open bar) and MAM (blue bar) groups was comparable in the DG (F(1,14) = 3.0005, p = 0.1052 for MAM vs saline). EE application significantly increased the number of DCX+ cells (F(2,21) = 58.27158, p < 0.001, n = 8 for each group). C, Representative DCX morphology without (category A cell) and with (category B cell) strong vertical processes. D, The proportion of category B cells was significantly decreased in the MAM group (F(1,14) = 80.53699, p < 0.001 for MAM vs saline) but was rescued by a 6 week EE application (F(1,14) = 173.91939, p < 0.001 for MAM plus 6 week EE vs MAM) but not by a 4 week EE application (F(1,14) = 1.89102, p = 0.19069 for MAM plus 4 week EE vs MAM, n = 8 for each group). E, The decrease in the number of PV+ cells was rescued by a 6 week EE application (F(1,14) = 16.87865, p = 0.00106 for MAM vs saline; F(1,14) = 5.56777, p = 0.03335 for MAM vs MAM plus 6 week EE, n = 8 samples for each group) but not by a 4 week EE application (F(1,14) = 0.72633, p = 0.40842 for MAM vs MAM plus 4 week EE, n = 8 for each group). *p < 0.05; **p < 0.01.
We also examined whether EE application for 6 weeks could rescue the MAM-induced deficits in GABAergic cells. The number of PV+ cells in the DG was significantly decreased in the MAM group compared with the saline group (Fig. 9E). As expected, the number of PV+ cells in the MAM-treated mice was restored by 6 week EE application but not by a 4 week EE application (Fig. 9E). It is noteworthy that there were no differences in the numbers of PV+ cells in the hippocampal non-neurogenic regions, including CA1, CA2, and CA3, either with or without EE application (Fig. 10F). This finding suggests that proper development of the GABAergic system in the DG during the defined adolescent period is critical for the establishment of PPI responses.
Figure 10.

The effect of EE application on the proliferation of newborn cells and MAM-induced cell death. A, Experimental design for MAM treatment, EE application during PW4–PW10, BrdU injection, and cellular analysis. B, Cell proliferation in the DG, which was indicated by one pulse of BrdU incorporation (50 mg/kg) 2 h before sampling, was significantly decreased by MAM treatment (blue bar) compared with the saline group (open bar) (F(1,10) = 24.94531, p = 0.00054 for MAM vs saline, n = 6 for each group). EE application increased the number of BrdU+ cells compared with MAM treatment (F(1,10) = 17.49274, p = 0.00127 for MAM vs saline, n = 6 for saline and n = 8 for MAM group). C, Consistently, the number of caspase3+ cells was increased immediately after MAM treatment at PW6 (F(1,10) = 5.09431, p = 0.04761 for MAM vs saline, n = 6 for each group) and returned to the control level at PW10 (F(1,10) = 1.17259, p = 0.30429 for MAM vs saline, n = 6 for each group) after a 4 week withdrawal from MAM treatment. D, EE application from PW4 to PW6 effectively restored the number of caspase3+ cells to the control level at PW6 (F(1,14) = 12.2023, p = 0.00358 for MAM vs saline, n = 8 samples for each group). E, There were no differences in the numbers of PV+ cells in non-neurogenic regions between the saline and MAM groups or between the MAM and MAM with EE application groups at PW10 (F(3,28) = 1.08798, p = 0.37037 for MAM vs saline, n = 8 samples for each group). *p < 0.05; **p < 0.01.
To further test the association between decreased neurogenesis at adolescent stages and PPI deficits in early adulthood, we also examined the proliferation of newborn cells in the DG of mice treated with MAM and exposed to EE (Fig. 10B). An ANOVA analysis revealed that the decrease in BrdU+ cells in the DG at PW6 was partially rescued by EE application; there were significant differences between the MAM-plus-6-week-EE group and the MAM group (Fig. 10B). We also examined cell death by immunostaining for caspase3. The number of caspase3+ cells increased due to MAM treatment at PW6 and returned to the control level by PW10 (Fig. 10C). The increase in caspase3+ cells caused by MAM treatment was abolished at PW6 after a 2 week EE application (Fig. 10D). Consistent with rescued PPI, rescue of the morphological phenotypes of DCX+ cells and proliferation of newborn cells by EE application support our idea of a critical period, during which intact neurogenesis is associated with the amelioration of PPI deficits caused by environmental intervention.
Discussion
In the present study, we established a developmental model of neuropsychiatric disorders by using the antiproliferative drug MAM. In our model (Fig. 11), a transient reduction in adolescent neurogenesis (PW3–PW6) may be associated with an impaired hippocampal GABAergic system and subsequently induces PPI deficits in early adulthood. The morphological and behavioral abnormalities in this MAM model were successfully rescued by the application of an EE during a defined vulnerable period.
Figure 11.

Graphical summary showing that the developmental intervention during vulnerable postnatal stage affects the PPI circuit establishment at adulthood. EE and MAM treatment before critical time point (PW6) may modulate the GABA inhibitory system by affecting the postnatal neurogenesis in the DG.
Postnatal neurogenesis, which is closely related to brain plasticity and adaptability, has received much attention as a target for therapeutics for various neuropsychiatric diseases (Eisch et al., 2008; Kempermann et al., 2008; Thomas and Peterson, 2008; Pieper et al., 2010). There is a reproducible association between a decrease in neurogenesis and impairment in PPI scores in a variety of rodent models (Table 2; Osumi and Guo, 2011). It remains to be shown whether this PPI deficit is temporary or whether it persists into adulthood. Neurogenesis continues to occur throughout life in the hippocampus, but several aspects of neuronal production dramatically change during the postnatal development stage, including an 80% loss of granule cell production from adolescence to young adulthood in rats (He and Crews, 2007). Therefore, it is very likely that neurogenesis during adolescent stages may be more susceptible to the various insults and environmental interventions used in the study of neuropsychiatric disorders.
Table 2.
Association of impaired neurogenesis and deficits in prepulse inhibition
| Species (strain) | Treatment method | Treatment time | Neurogenesis | Test time point | PPI | References |
|---|---|---|---|---|---|---|
| Lewis rat | Polyinosinic-polycytidylic acid, 4 mg/kg, i.v. | Gestational day 15 | Not mentioned | Adult offspring | ↓ | Cardon M et al., 2010 |
| Sprague Dawley rat | MAM, 25 mg/kg, i.v. | Gestational day 17 | Not mentioned | Adult female offspring | ↓ | Hazane F et al., 2009 |
| Sprague Dawley rat | Ara-c, i.c.v | Adult | ∼90% decrease at adult stage | 4 d after injection | ↓ | Lau BW et al., 2009 |
| Sprague Dawley rat | Corticosterone, s.c. | Adult | ∼45% decrease at adult stage | 2 weeks after injection | ↓ | Lau BW et al., 2009 |
| Sprague Dawley rat | Paroxetine, i.p. | Adult | ∼45% increase at adult stage | 2 weeks after injection | Not significant | Lau BW et al., 2009 |
| Sprague Dawley rat | Exercise | Adult | ∼45% increase at adult stage | 2 weeks after injection | Not significant | Lau BW et al., 2009 |
| Sprague Dawley rat | Heterozygous Pax6 mutant | Not mentioned | ∼30% and ∼40% decrease at 4 weeks and 12 weeks respectively | Not mentioned | Not mentioned | Maekawa M et al., 2005 |
| Sprague Dawley rat | Heterozygous Pax6 mutant | Not mentioned | Not mentioned | 12 weeks | ↓ | Maekawa M et al., 2009 |
| Sprague Dawley rat | MAM, 10 mg/kg, i.p. | 4∼5 weeks | ∼25% decrease at 5 weeks | 12 weeks | ↓ | Maekawa M et al., 2009 |
| 129/SvEv C57BL/6 | Npas3−/− mice | 12 weeks | ∼85% decrease at 12 weeks | Not mentioned | Not mentioned | Brunskill EW et al., 2005 |
| C57BL/6J mouse | Severe combined immune deficient model | Not mentioned | ∼20% and ∼40% decrease at 4 weeks and 12 weeks respectively | 12 weeks | ↓ | Cardon M et al., 2009 |
| 129/SvEv C57BL/6 | Npas1−/−:Npas3−/− mice | Not mentioned | Not mentioned | 17∼20 weeks | ↓ | Erbel-Sieler C et al., 2004 |
| C57BL/6J mouse | X-irradiated | 4 weeks | ∼90% decrease at 4 weeks | 12 weeks | ↓ | Hayashi H et al., 2008 |
| C57BL/6J mouse | Enrichment environment | 3∼11 weeks | ∼65% increase at 12 weeks | 12∼13 weeks | ↑ | Iso H et al., 2007 |
| C57BL/6J mouse | Fabp7-null mice | Not mentioned | ∼30% decrease at 4 weeks | Not mentioned | ↓ | Watanabe A et al., 2007 |
In the present study, we chose a dose of MAM that was sufficient to block neurogenesis but was low enough to minimize any general physiological disturbance. Although we could not verify a direct effect of MAM on neuronal functions, MAM treatments at perinatal and early postnatal stages have already attracted attention as potential methods for creating animal models of schizophrenia and related mental illness (Flagstad et al., 2004; Penschuck et al., 2006; Lodge et al., 2009; Maekawa et al., 2009). Since our previous MAM treatment in rats from PW4 to PW5 successfully reduces the hippocampal neurogenesis (Maekawa et al., 2009) and such an adolescent period is the stage when the GABAergic system develops in the hippocampus (Kapur and Macdonald, 1999; Fleming et al., 2007), we chose the postnatal stage ∼PW4. This simple approach was able to temporarily decrease hippocampal neurogenesis to 74% of the baseline level after the 2 week treatment period, which, as expected, was rescued in early adulthood. Under these conditions, PPI performance was normal at PW6 but was impaired at PW10, suggesting that the delayed PPI deficit was induced by the developmental alteration of postnatal processes, such as abnormal neurogenesis. It remains to be shown whether this PPI deficit is temporary or persists into full adulthood. We further performed experiments to confirm that this PPI deficit persisted into later adulthood at PW18 (Fig. 3G). Therefore, adolescent neurogenesis may act in a cell-nonautonomous manner to establish the proper neural circuitry responsible for normal behaviors in adulthood.
A primary finding of our study is the involvement of the GABA interneuron system in the establishment of the PPI-related circuit. Consistent with previous animal studies (Harte et al., 2007; Tseng et al., 2008, Sun et al., 2011), a decrease in the number of GABAergic neurons was observed in our MAM-treated mice. Disturbances in the anatomy, histology, and function of the GABAergic system are implicated in various psychiatric disorders (Charych et al., 2009; Cherlyn et al., 2010; Vinkers et al., 2010). It is known that the GABAAR agonist benzodiazepines are potentially useful as an adjuvant to neuroleptics in the initial treatment of schizophrenia (Guidotti et al., 2005). However, several side effects, such as amnesia, profound sedation, and development of tolerance, limit their acute or protracted use (Rudolph and Knoflach, 2011). This may be because benzodiazepines have high affinity and intrinsic activity for α1-containing GABAARs even after a brief period of treatment, and act indiscriminately as full-positive allosteric modulators at every GABAAR subtype (Volz et al., 2007). Therefore, to directly implicate the DG GABAergic system in the modulating of sensorimotor gating, we bilaterally infused the muscimol, a potent, selective agonist for the GABAARs, into the DG region to rescue the PPI deficit in our MAM model. We found that the infusion of muscimol into the DG could ameliorate the PPI deficits in a dose-dependent manner. The MAM-induced PPI deficits were rescued by a lower-dose (10 ng per hemisphere), bilateral acute infusion of muscimol into the DG, but a higher dose (100 ng per hemisphere) failed to rescue the PPI deficits (Fig. 6E). It is thus likely that the developmental modification of inhibitory circuits during adolescence may provide susceptibility to the deleterious effects of stress or other environmental influences that could trigger pathological changes in a vulnerable circuit. Furthermore, the decreased number of GABAergic neurons was not directly due to the loss of newborn cells directly incorporated into the PPI circuit, as the cells that were generated during PW4–PW6 did not exhibit the morphological features of interneurons (data not shown). Therefore, we propose a scenario in which an initial GABAergic deficit is a developmental consequence mediated by the suppression of neurogenesis during an early stage of development and may result in further deficits in neuronal circuitry and the onset of mental illnesses, such as schizophrenia, during the second or third decades of life.
The beneficial effects of an EE, including increased hippocampal neurogenesis and improved mental and cognitive abilities, have been reported in various paradigms (Schloesser et al., 2010; Bednarczyk et al., 2011) For example, phospholipase C-β1 pathway-deficient mice display impaired hippocampal neurogenesis, spontaneous hyperactivity, and PPI deficits, which are rescued by an EE (McOmish et al., 2008; Manning et al., 2012). An EE is also highly effective at extinguishing submissive behavioral traits that develop under chronic social stress and are critically dependent on adult neurogenesis (Schloesser et al., 2010). In contrast, there are studies that present rather negative results against the behavioral effects of an EE through increasing adult hippocampal neurogenesis (Meshi et al., 2006; Silva et al., 2011). Thus, it is still vague whether the use of an EE has beneficial effects on brain function and behavior (Kempermann et al., 2002; Nithianantharajah and Hannan, 2006; Redolat and Mesa-Gresa, 2012).
The main reason for this conflict is multiple EE paradigms; researchers use different conditions to induce and ameliorate behavioral abnormalities via decreasing and increasing neurogenesis, especially in regard to the age of animals. EE paradigms may exert differential effects on developing and mature brains. There may be critical periods when EE intervention has the greatest impact on specific aspects of brain structure, function, and behavior. In the present study, we first defined a critical period (before PW6) during which the transient decrease in neurogenesis induced by MAM treatment is specifically associated with PPI deficits, anxiety, and hyperactivity at PW10. In this MAM model, the application of EE over this critical period (PW4–PW10) corrected all the three behavioral abnormalities, whereas EE application during PW6–PW10 or PW6–PW12 (data not shown) ameliorated hyperactivity but could not rescue PPI deficits or anxiety. Hence, we propose that the sensitivity and adaptability of EE application to adolescent brains differ from those of the mature brain in terms of the biological vulnerability of neurogenesis and subsequent developmental consequences. This further implicates advantageous gene–environment interactions in the developing human brain and supports early environmental intervention to modulate the late onset of developmental neuropsychiatric diseases.
Footnotes
This work was supported by the Core Research for Evolutional Science and Technology from Japan Science and Technology Agency. N.G. is a postdoctoral fellow supported by Tohoku Neuroscience Global Center of Excellence. We thank Drs. Shun Nakamura, Takeo Yoshikawa, and Naoshige Uchida for their suggestions on the manuscript. We thank Ms. Ayumi Ogasawara, Sayaka Makino, and Emiko Ootsuki for the maintenance and care of the mice and for their great help with additional experiments. We are also grateful for the encouragement of all of the members of our laboratory.
The authors declare no competing financial interests.
References
- Bast T, Feldon J. Hippocampal modulation of sensorimotor processes. Prog Neurobiol. 2003;70:319–345. doi: 10.1016/S0301-0082(03)00112-6. [DOI] [PubMed] [Google Scholar]
- Bednarczyk MR, Hacker LC, Fortin-Nunez S, Aumont A, Bergeron R, Fernandes KJ. Distinct stages of adult hippocampal neurogenesis are regulated by running and the running environment. Hippocampus. 2011;21:1334–1347. doi: 10.1002/hipo.20831. [DOI] [PubMed] [Google Scholar]
- Braff DL, Light GA. The use of neurophysiological endophenotypes to understand the genetic basis of schizophrenia. Dialogues Clin Neurosci. 2005;7:125–135. doi: 10.31887/DCNS.2005.7.2/dlbraff. [DOI] [PMC free article] [PubMed] [Google Scholar]
- Braff DL, Geyer MA, Swerdlow NR. Human studies of prepulse inhibition of startle: normal subjects, patient groups, and pharmacological studies. Psychopharmacology (Berl) 2001;156:234–258. doi: 10.1007/s002130100810. [DOI] [PubMed] [Google Scholar]
- Brenes JC, Rodríguez O, Fornaguera J. Differential effect of environment enrichment and social isolation on depressive-like behavior, spontaneous activity and serotonin and norepinephrine concentration in prefrontal cortex and ventral striatum. Pharmacol Biochem Behav. 2008;89:85–93. doi: 10.1016/j.pbb.2007.11.004. [DOI] [PubMed] [Google Scholar]
- Cadenhead KS, Light GA, Geyer MA, Braff DL. Sensory gating deficits assessed by the P50 event-related potential in subjects with schizotypal personality disorder. Am J Psychiatry. 2000;157:55–59. doi: 10.1176/ajp.157.1.55. [DOI] [PubMed] [Google Scholar]
- Cattaneo E, Reinach B, Caputi A, Cattabeni F, Di Luca M. Selective in vitro blockade of neuroepithelial cells proliferation by methylazoxymethanol, a molecule capable of inducing long lasting functional impairments. J Neurosci Res. 1995;41:640–647. doi: 10.1002/jnr.490410510. [DOI] [PubMed] [Google Scholar]
- Charych EI, Liu F, Moss SJ, Brandon NJ. GABA(A) receptors and their associated proteins: implications in the etiology and treatment of schizophrenia and related disorders. Neuropharmacology. 2009;57:481–495. doi: 10.1016/j.neuropharm.2009.07.027. [DOI] [PMC free article] [PubMed] [Google Scholar]
- Cherlyn SY, Woon PS, Liu JJ, Ong WY, Tsai GC, Sim K. Genetic association studies of glutamate, GABA and related genes in schizophrenia and bipolar disorder: a decade of advance. Neurosci Biobehav Rev. 2010;34:958–977. doi: 10.1016/j.neubiorev.2010.01.002. [DOI] [PubMed] [Google Scholar]
- Ciaroni S, Cuppini R, Cecchini T, Ferri P, Ambrogini P, Cuppini C, Del Grande P. Neurogenesis in the adult rat dentate gyrus is enhanced by vitamin E deficiency. J Comp Neurol. 1999;411:495–502. doi: 10.1002/(SICI)1096-9861(19990830)411:3<495::AID-CNE11>3.0.CO;2-I. [DOI] [PubMed] [Google Scholar]
- Ciaroni S, Cecchini T, Ferri P, Ambrogini P, Cuppini R, Lombardelli G, Peruzzi G, Del Grande P. Postnatal development of rat dentate gyrus: effects of methylazoxymethanol administration. Mech Ageing Dev. 2002;123:499–509. doi: 10.1016/S0047-6374(01)00359-1. [DOI] [PubMed] [Google Scholar]
- Doischer D, Hosp JA, Yanagawa Y, Obata K, Jonas P, Vida I, Bartos M. Postnatal differentiation of basket cells from slow to fast signaling devices. J Neurosci. 2008;28:12956–12968. doi: 10.1523/JNEUROSCI.2890-08.2008. [DOI] [PMC free article] [PubMed] [Google Scholar]
- Douaud G, Mackay C, Andersson J, James S, Quested D, Ray MK, Connell J, Roberts N, Crow TJ, Matthews PM, Smith S, James A. Schizophrenia delays and alters maturation of the brain in adolescence. Brain. 2009;132:2437–2448. doi: 10.1093/brain/awp126. [DOI] [PubMed] [Google Scholar]
- Eisch AJ, Cameron HA, Encinas JM, Meltzer LA, Ming GL, Overstreet-Wadiche LS. Adult neurogenesis, mental health, and mental illness: hope or hype? J Neurosci. 2008;28:11785–11791. doi: 10.1523/JNEUROSCI.3798-08.2008. [DOI] [PMC free article] [PubMed] [Google Scholar]
- Flagstad P, Mørk A, Glenthøj BY, van Beek J, Michael-Titus AT, Didriksen M. Disruption of neurogenesis on gestational day 17 in the rat causes behavioral changes relevant to positive and negative schizophrenia symptoms and alters amphetamine-induced dopamine release in nucleus accumbens. Neuropsychopharmacology. 2004;29:2052–2064. doi: 10.1038/sj.npp.1300516. [DOI] [PubMed] [Google Scholar]
- Fleming RL, Wilson WA, Swartzwelder HS. Magnitude and ethanol sensitivity of tonic GABAA receptor-mediated inhibition in dentate gyrus changes from adolescence to adulthood. J Neurophysiol. 2007;97:3806–3811. doi: 10.1152/jn.00101.2007. [DOI] [PubMed] [Google Scholar]
- Gogtay N, Vyas NS, Testa R, Wood SJ, Pantelis C. Age of onset of schizophrenia: perspectives from structural neuroimaging studies. Schizophr Bull. 2011;37:504–513. doi: 10.1093/schbul/sbr030. [DOI] [PMC free article] [PubMed] [Google Scholar]
- Guidotti A, Auta J, Davis JM, Dong E, Grayson DR, Veldic M, Zhang X, Costa E. GABAergic dysfunction in schizophrenia: new treatment strategies on the horizon. Psychopharmacology (Berl) 2005;180:191–205. doi: 10.1007/s00213-005-2212-8. [DOI] [PubMed] [Google Scholar]
- Haddad RK, Rabe A, Dumas R. Comparison of effects of methylazoxymethanol acetate on brain development in different species. Fed Proc. 1972;31:1520–1523. [PubMed] [Google Scholar]
- Harte MK, Powell SB, Swerdlow NR, Geyer MA, Reynolds GP. Deficits in parvalbumin and calbindin immunoreactive cells in the hippocampus of isolation reared rats. J Neural Transm. 2007;114:893–898. doi: 10.1007/s00702-007-0627-6. [DOI] [PubMed] [Google Scholar]
- Hayashi F, Takashima N, Murayama A, Inokuchi K. Decreased postnatal neurogenesis in the hippocampus combined with stress experience during adolescence is accompanied by an enhanced incidence of behavioral pathologies in adult mice. Mol Brain. 2008;1:22. doi: 10.1186/1756-6606-1-22. [DOI] [PMC free article] [PubMed] [Google Scholar]
- He J, Crews FT. Neurogenesis decreases during brain maturation from adolescence to adulthood. Pharmacol Biochem Behav. 2007;86:327–333. doi: 10.1016/j.pbb.2006.11.003. [DOI] [PubMed] [Google Scholar]
- Heckers S, Konradi C. Hippocampal pathology in schizophrenia. Curr Top Behav Neurosci. 2010;4:529–553. doi: 10.1007/7854_2010_43. [DOI] [PubMed] [Google Scholar]
- Hoskison MM, Yanagawa Y, Obata K, Shuttleworth CW. Calcium-dependent NMDA-induced dendric injury and MAP2 loss in acute hippocampal slices. Neuroscience. 2007;145:66–79. doi: 10.1016/j.neuroscience.2006.11.034. [DOI] [PMC free article] [PubMed] [Google Scholar]
- Hyde TM, Lipska BK, Ali T, Mathew SV, Law AJ, Metitiri OE, Straub RE, Ye T, Colantuoni C, Herman MM, Bigelow LB, Weinberger DR, Kleinman JE. Expression of GABA signaling molecules KCC2, NKCC1, and GAD1 in cortical development and schizophrenia. J Neurosci. 2011;31:11088–11095. doi: 10.1523/JNEUROSCI.1234-11.2011. [DOI] [PMC free article] [PubMed] [Google Scholar]
- Kapur J, Macdonald RL. Postnatal development of hippocampal dentate granule cell gamma-aminobutyric acidA receptor pharmacological properties. Mol Pharmacol. 1999;55:444–452. [PubMed] [Google Scholar]
- Kempermann G, Kuhn HG, Gage FH. More hippocampal neurons in adult mice living in an enriched environment. Nature. 1997;386:493–495. doi: 10.1038/386493a0. [DOI] [PubMed] [Google Scholar]
- Kempermann G, Gast D, Gage FH. Neuroplasticity in old age: sustained fivefold induction of hippocampal neurogenesis by long-term environmental enrichment. Ann Neurol. 2002;52:135–143. doi: 10.1002/ana.10262. [DOI] [PubMed] [Google Scholar]
- Kempermann G, Krebs J, Fabel K. The contribution of failing adult hippocampal neurogenesis to psychiatric disorders. Curr Opin Psychiatry. 2008;21:290–295. doi: 10.1097/YCO.0b013e3282fad375. [DOI] [PubMed] [Google Scholar]
- Lewis DA. Development of the prefrontal cortex during adolescence: insights into vulnerable neural circuits in schizophrenia. Neuropsychopharmacology. 1997;16:385–398. doi: 10.1016/S0893-133X(96)00277-1. [DOI] [PubMed] [Google Scholar]
- Lewis DA, Levitt P. Schizophrenia as a disorder of neurodevelopment. Annu Rev Neurosci. 2002;25:409–432. doi: 10.1146/annurev.neuro.25.112701.142754. [DOI] [PubMed] [Google Scholar]
- Lewis DA, Cruz D, Eggan S, Erickson S. Postnatal development of prefrontal inhibitory circuits and the pathophysiology of cognitive dysfunction in schizophrenia. Ann N Y Acad Sci. 2004;1021:64–76. doi: 10.1196/annals.1308.008. [DOI] [PubMed] [Google Scholar]
- Lodge DJ, Behrens MM, Grace AA. A loss of parvalbumin-containing interneurons is associated with diminished oscillatory activity in an animal model of schizophrenia. J Neurosci. 2009;29:2344–2354. doi: 10.1523/JNEUROSCI.5419-08.2009. [DOI] [PMC free article] [PubMed] [Google Scholar]
- Louchart-de la Chapelle S, Nkam I, Houy E, Belmont A, Ménard JF, Roussignol AC, Siwek O, Mezerai M, Guillermou M, Fouldrin G, Levillain D, Dollfus S, Campion D, Thibaut F. A concordance study of three electrophysiological measures in schizophrenia. Am J Psychiatry. 2005;162:466–474. doi: 10.1176/appi.ajp.162.3.466. [DOI] [PubMed] [Google Scholar]
- Maekawa M, Takashima N, Matsumata M, Ikegami S, Kontani M, Hara Y, Kawashima H, Owada Y, Kiso Y, Yoshikawa T, Inokuchi K, Osumi N. Arachidonic acid drives postnatal neurogenesis and elicits a beneficial effect on prepulse inhibition, a biological trait of psychiatric illnesses. PLoS One. 2009;4:e5085. doi: 10.1371/journal.pone.0005085. [DOI] [PMC free article] [PubMed] [Google Scholar]
- Manning EE, Ransome MI, Burrows EL, Hannan AJ. Increased adult hippocampal neurogenesis and abnormal migration of adult-born granule neurons is associated with hippocampal-specific cognitive deficits in phospholipase C-β1 knockout mice. Hippocampus. 2012;22:309–319. doi: 10.1002/hipo.20900. [DOI] [PubMed] [Google Scholar]
- Matsumata M, Sakayori N, Maekawa M, Owada Y, Yoshikawa T, Osumi N. The effects of Fabp7 and Fabp5 on postnatal hippocampal neurogenesis in the mouse. Stem Cells. 2012;30:1532–1543. doi: 10.1002/stem.1124. [DOI] [PubMed] [Google Scholar]
- McOmish CE, Burrows E, Howard M, Scarr E, Kim D, Shin HS, Dean B, van den Buuse M, Hannan AJ. Phospholipase C-beta1 knockout mice exhibit endophenotypes modeling schizophrenia which are rescued by environmental enrichment and clozapine administration. Mol Psychiatry. 2008;13:661–672. doi: 10.1038/sj.mp.4002046. [DOI] [PubMed] [Google Scholar]
- Meshi D, Drew MR, Saxe M, Ansorge MS, David D, Santarelli L, Malapani C, Moore H, Hen R. Hippocampal neurogenesis is not required for behavioral effects of environmental enrichment. Nat Neurosci. 2006;9:729–731. doi: 10.1038/nn1696. [DOI] [PubMed] [Google Scholar]
- Nithianantharajah J, Hannan AJ. Enriched environments, experience-dependent plasticity and disorders of the nervous system. Nat Rev Neurosci. 2006;7:697–709. doi: 10.1038/nrn1970. [DOI] [PubMed] [Google Scholar]
- Osumi N, Guo N. Impaired neuroscience as a risk factor for schizophrenia and related mental diseases. In: Seki T, Sawamoto K, Parent JM, Alvarez-Buylla A, editors. Neurogenesis in the Adult Brain II. Tokyo: Springer; 2011. pp. 109–131. [Google Scholar]
- Penschuck S, Flagstad P, Didriksen M, Leist M, Michael-Titus AT. Decrease in parvalbumin-expressing neurons in the hippocampus and increased phencyclidine-induced locomotor activity in the rat methylazoxymethanol (MAM) model of schizophrenia. Eur J Neurosci. 2006;23:279–284. doi: 10.1111/j.1460-9568.2005.04536.x. [DOI] [PubMed] [Google Scholar]
- Pieper AA, Xie S, Capota E, Estill SJ, Zhong J, Long JM, Becker GL, Huntington P, Goldman SE, Shen CH, Capota M, Britt JK, Kotti T, Ure K, Brat DJ, Williams NS, MacMillan KS, Naidoo J, Melito L, Hsieh J, et al. Discovery of a proneurogenic, neuroprotective chemical. Cell. 2010;142:39–51. doi: 10.1016/j.cell.2010.06.018. [DOI] [PMC free article] [PubMed] [Google Scholar]
- Plümpe T, Ehninger D, Steiner B, Klempin F, Jessberger S, Brandt M, Römer B, Rodriguez GR, Kronenberg G, Kempermann G. Variability of doublecortin-associated dendrite maturation in adult hippocampal neurogenesis is independent of the regulation of precursor cell proliferation. BMC Neurosci. 2006;7:77. doi: 10.1186/1471-2202-7-77. [DOI] [PMC free article] [PubMed] [Google Scholar]
- Rapoport JL, Addington AM, Frangou S, Psych MR. The neurodevelopmental model of schizophrenia: update 2005. Mol Psychiatry. 2005;10:434–449. doi: 10.1038/sj.mp.4001642. [DOI] [PubMed] [Google Scholar]
- Redolat R, Mesa-Gresa P. Potential benefits and limitations of enriched environments and cognitive activity on age-related behavioural decline. Curr Top Behav Neurosci. 2012;10:293–316. doi: 10.1007/7854_2011_134. [DOI] [PubMed] [Google Scholar]
- Rudolph U, Knoflach F. Beyond classical benzodiazepines: novel therapeutic potential of GABAA receptor subtypes. Nat Rev Drug Discov. 2011;10:685–697. doi: 10.1038/nrd3502. [DOI] [PMC free article] [PubMed] [Google Scholar]
- Saint Marie RL, Miller EJ, Breier MR, Weber M, Swerdlow NR. Projections from ventral hippocampus to medial prefrontal cortex but not nucleus accumbens remain functional after fornix lesions in rats. Neuroscience. 2010;168:498–504. doi: 10.1016/j.neuroscience.2010.03.037. [DOI] [PMC free article] [PubMed] [Google Scholar]
- Schloesser RJ, Lehmann M, Martinowich K, Manji HK, Herkenham M. Environmental enrichment requires adult neurogenesis to facilitate the recovery from psychosocial stress. Mol Psychiatry. 2010;15:1152–1163. doi: 10.1038/mp.2010.34. [DOI] [PMC free article] [PubMed] [Google Scholar]
- Silva CF, Duarte FS, Lima TC, de Oliveira CL. Effects of social isolation and enriched environment on behavior of adult Swiss mice do not require hippocampal neurogenesis. Behav Brain Res. 2011;225:85–90. doi: 10.1016/j.bbr.2011.07.007. [DOI] [PubMed] [Google Scholar]
- Sisk CL, Zehr JL. Pubertal hormones organize the adolescent brain and behavior. Front Neuroendocrinol. 2005;26:163–174. doi: 10.1016/j.yfrne.2005.10.003. [DOI] [PubMed] [Google Scholar]
- Spear LP. The adolescent brain and age-related behavioral manifestations. Neurosci Biobehav Rev. 2000;24:417–463. doi: 10.1016/S0149-7634(00)00014-2. [DOI] [PubMed] [Google Scholar]
- Sun Y, Farzan F, Barr MS, Kirihara K, Fitzgerald PB, Light GA, Daskalakis ZJ. Gamma oscillations in schizophrenia: mechanisms and clinical significance. Brain Res. 2011;1413:98–114. doi: 10.1016/j.brainres.2011.06.065. [DOI] [PubMed] [Google Scholar]
- Swerdlow NR, Geyer MA. Using an animal model of deficient sensorimotor gating to study the pathophysiology and new treatments of schizophrenia. Schizophr Bull. 1998;24:285–301. doi: 10.1093/oxfordjournals.schbul.a033326. [DOI] [PubMed] [Google Scholar]
- Swerdlow NR, Weber M, Qu Y, Light GA, Braff DL. Realistic expectations of prepulse inhibition in translational models for schizophrenia research. Psychopharmacology (Berl) 2008;199:331–388. doi: 10.1007/s00213-008-1072-4. [DOI] [PMC free article] [PubMed] [Google Scholar]
- Tamamaki N, Yanagawa Y, Tomioka R, Miyazaki J, Obata K, Kaneko T. Green fluorescent protein expression and colocalization with calretinin, parvalbumin, and somatostatin in the GAD67-GFP knock-in mouse. J Comp Neurol. 2003;467:60–79. doi: 10.1002/cne.10905. [DOI] [PubMed] [Google Scholar]
- Tamminga CA, Stan AD, Wagner AD. The hippocampal formation in schizophrenia. Am J Psychiatry. 2010;167:1178–1193. doi: 10.1176/appi.ajp.2010.09081187. [DOI] [PubMed] [Google Scholar]
- Thomas RM, Peterson DA. Even neural stem cells get the blues: evidence for a molecular link between modulation of adult neurogenesis and depression. Gene Expr. 2008;14:183–193. [PMC free article] [PubMed] [Google Scholar]
- Tseng KY, Lewis BL, Hashimoto T, Sesack SR, Kloc M, Lewis DA, O'Donnell P. A neonatal ventral hippocampal lesion causes functional deficits in adult prefrontal cortical interneurons. J Neurosci. 2008;28:12691–12699. doi: 10.1523/JNEUROSCI.4166-08.2008. [DOI] [PMC free article] [PubMed] [Google Scholar]
- Vinkers CH, Mirza NR, Olivier B, Kahn RS. The inhibitory GABA system as a therapeutic target for cognitive symptoms in schizophrenia: investigational agents in the pipeline. Expert Opin Investig Drugs. 2010;19:1217–1233. doi: 10.1517/13543784.2010.513382. [DOI] [PubMed] [Google Scholar]
- Volz A, Khorsand V, Gillies D, Leucht S. Benzodiazepines for schizophrenia. Cochrane Database Syst Rev. 2007;1:CD006391. doi: 10.1002/14651858.CD006391. [DOI] [PubMed] [Google Scholar]
- Weinberger DR. On the plausibility of “the neurodevelopmental hypothesis” of schizophrenia. Neuropsychopharmacology. 1996;14:1S–11S. doi: 10.1016/0893-133X(95)00199-N. [DOI] [PubMed] [Google Scholar]