

Abstract
Exposure of cortical cells to sustained sensory stimuli results in changes in the neuronal response function. This phenomenon, known as adaptation, is a common feature across sensory modalities. Here, we quantified the functional effect of adaptation on the ensemble activity of cortical neurons in the rat whisker-barrel system. A multishank array of electrodes was used to allow simultaneous sampling of neuronal activity. We characterized the response of neurons to sinusoidal whisker vibrations of varying amplitude in three states of adaptation. The adaptors produced a systematic rightward shift in the neuronal response function. Consistently, mutual information revealed that peak discrimination performance was not aligned to the adaptor but to test amplitudes 3–9 μm higher. Stimulus presentation reduced single neuron trial-to-trial response variability (captured by Fano factor) and correlations in the population response variability (noise correlation). We found that these two types of variability were inversely proportional to the average firing rate regardless of the adaptation state. Adaptation transferred the neuronal operating regime to lower rates with higher Fano factor and noise correlations. Noise correlations were positive and in the direction of signal, and thus detrimental to coding efficiency. Interestingly, across all population sizes, the net effect of adaptation was to increase the total information despite increasing the noise correlation between neurons.
Introduction
At various stages of sensory processing, single neurons are believed to encode stimuli in the rate at which they generate spikes. However the limited range of firing rates that a neuron can produce imposes a limit on the number of stimuli that can be distinguished according to that neuron's output. Adaptation is a strategy that is believed to improve efficiency by changing neuronal response functions to match the statistics of the environment (Barlow, 1961; Smirnakis et al., 1997; Kvale and Schreiner, 2004; Dean et al., 2005; Hosoya et al., 2005; Price et al., 2005; Nagel and Doupe, 2006; Maravall et al., 2007).
The effect of adaptation has generally been quantified for individual neurons. It is still not clear how adaptation changes the responses of neuronal populations, and how this change affects coding. Theoretical studies reveal that even weak correlations distributed across large populations can significantly reduce the efficiency of coding (Zohary et al., 1994; Abbott and Dayan, 1999; Wilke and Eurich, 2002) but see (Romo et al., 2003; Cafaro and Rieke, 2010). Such correlations in the trial-to-trial response fluctuations, or “noise correlations”, have been reported in the literature to lie in the range of 0.1 to 0.3 (Gawne and Richmond, 1993; Zohary et al., 1994; Gawne et al., 1996; Reich et al., 2001; Kohn and Smith, 2005; Gutnisky and Dragoi, 2008; Smith and Kohn, 2008; Khatri et al., 2009; Cohen and Kohn, 2011; Hofer et al., 2011). Most empirical studies characterizing the effect of noise correlations on population coding have been limited to “pairs” of neurons (Gawne and Richmond, 1993; Gawne et al., 1996; Petersen et al., 2001; Averbeck and Lee, 2003; Romo et al., 2003; Cafaro and Rieke, 2010), nonetheless new technical advances in simultaneously recording from tens of neurons offer the potential to investigate correlations of activity across large populations (Schneidman et al., 2006; Pillow et al., 2008; Graf et al., 2011). Here, we apply principal component analysis and an information theoretic framework to simultaneous recordings from barrel cortex and quantify the effect of adaptation on population coding efficiency.
The whisker sensory system represents the major channel through which rodents collect information from the environment (Diamond et al., 2008b; Diamond and Arabzadeh, 2012). This system is well-suited to examining sensory coding issues by virtue of its functional efficiency and its elegant structural organization. The whisker area of somatosensory cortex (known as barrel cortex) is arranged as an anatomical and physiological topographic map where neurons in a given “barrel” yield the strongest response to the corresponding whisker (Woolsey and van der Loos, 1970). Previous electrophysiological studies revealed that barrel cortex neurons encode vibro-tactile stimuli in terms of the mean speed of whisker movement (Arabzadeh et al., 2003, 2004), and this representation forms the basis of whisker movement sensation in awake rats (Adibi et al., 2012). We quantify the functional effect of adaptation on the encoding of vibro-tactile stimuli at the level of single neurons and cortical ensembles.
Materials and Methods
Surgery and electrophysiological recording.
Six adult male Wistar rats, weighing 340–550 g, were used for acute recording. All components of the experiment were conducted in accordance with international guidelines and were approved by the Animal Care and Ethics Committee at the University of New South Wales. Anesthesia was induced by intraperitoneal administration of urethane (1.5 g/kg body weight) to the right side. During the recording sessions, the level of anesthesia was monitored by the hind paw and the corneal reflexes, and maintained at a stable level by administrating 10% of the original dose, if necessary. The rat's head was fixed in a stereotaxic apparatus, an incision was made from bregma to lambda and the fascia was removed. Craniotomy was performed directly over the barrel cortex on the right hemisphere over an area of 5 × 5 mm, centered at 2.6 mm posterior to bregma and 5 mm lateral.
Neuronal activity was acquired using a 32-channel 4-shank multielectrode probe (NeuroNexus Technologies), as shown in Figure 1a. Dura mater was removed and the probe was lowered by means of a micromanipulator in steps of 50 μm. The principal whisker was determined by manual flicks of individual whiskers. Data acquisition and online amplification were performed using Cheetah data acquisition hardware and software (Neuralynx). During the recording sessions (n = 16), data were acquired at a sampling rate of 30.3 kHz and filtered online by applying a bandpass filter between 600 and 6000 Hz. From the filtered data, spikes were detected using an amplitude threshold, which was set manually. A liberal threshold was used for online spike detection to avoid losing neuronal activity. A more rigorous spike sorting was performed offline using template matching implemented in MATLAB (Mathworks). Across six rats we recorded a total of 73 single neurons (up to 11 simultaneously) and 86 multiunit neuronal clusters (see Table 1). Figure 1 depicts the general acute recording paradigm.
Figure 1.

Multi-electrode array recording in rat barrel cortex. a, An illustration of the whisker barrels in rat S1 cortex. Inset shows a close-up schematic of the recording probe's penetration of a barrel and the isolated spikes of a typical single unit recorded from Barrel D4. b, Each panel shows response of the sample neuron to the 30 μm test stimulus in each adaptation condition: red, no adaptation; green, 6 μm magnitude adaptation; blue, 12 μm magnitude adaptation. Middle trace is a raster plot of spiking activity over 100 trials. The bottom graph is the peristimulus time histogram. Spike rate is calculated in a 5ms long bin that slides in 1 ms steps.
Table 1.
The number of single units and multiunits recorded in each session
| Session no. |
||||||||||||||||
|---|---|---|---|---|---|---|---|---|---|---|---|---|---|---|---|---|
| 1 | 2 | 3 | 4 | 5 | 6 | 7 | 8 | 9 | 10 | 11 | 12 | 13 | 14 | 15 | 16 | |
| Single unit | 11 | 7 | 11 | 9 | 8 | 8 | 6 | 3 | 3 | 2 | 1 | 1 | 1 | 1 | 1 | 0 |
| Multiunit | 15 | 18 | 13 | 13 | 10 | 6 | 5 | 3 | 0 | 0 | 1 | 1 | 0 | 0 | 0 | 1 |
| Total | 26 | 25 | 24 | 22 | 18 | 14 | 11 | 6 | 3 | 2 | 2 | 2 | 1 | 1 | 1 | 1 |
Sessions are sorted by their total number of recorded units.
Whisker stimulation.
The stimulus train was composed of a 250 ms adaptation stimulus of 80 Hz sinusoidal vibration followed by a half-cycle (6.25 ms) pause and a single-cycle sinusoidal test stimulus (frequency of 80 Hz, 12.5 ms). We used three blocked adaptation amplitudes (0, 6, and 12 μm) and a series of 12 single-cycle sinusoidal whisker vibrations (amplitudes of 0–33 μm with equal increment steps of 3 μm) were delivered to the principal contralateral whisker while recording the neuronal activity. In each block, each test stimulus was presented 10 times in a pseudorandom order. Each block was preceded by 5 s of continuous presentation of the adaptor, and there was 2 s inter-block interval. Across 10 blocks for each adaptation state, each test stimulus was repeated 100 times. Stimuli were generated in MATLAB, and were presented through the analog output of a data acquisition card (National Instruments) at a sampling rate of 44.1 kHz. The output of the data acquisition card was amplified (25.4 dB gain) before arriving at a piezoelectric ceramic (Morgan Matroc). For precise stimulation of the principal whisker, a lightweight thin piece of plastic micropipette was glued to the piezoelectric ceramic. The principal whisker was placed into the micropipette such that the distance of the micropipette tip to the base of the whisker was 2 mm. To engage the whisker with the inside wall of the micropipette, the stimulator was slightly tilted by ∼10° against the whisker shaft. The movement trajectories were monitored using a custom-built infrared optic sensor; this was used to calibrate the vibro-tactile stimulator and to measure motion waveforms at a 10 kHz sampling frequency. The highest amplitude was limited to 33 μm to ensure that no distortion or poststimulus ringing was present.
Neuronal response analyses.
The sequences of spikes corresponding to trials of the same stimulus were separated and aligned with respect to the stimulus onset to generate raster plots (Fig. 1b). The probability of spiking over time was evaluated by counting the average number of spikes within each bin of 5 ms. This provided the neuronal response profile over time (also known as the peristimulus time histogram) for each stimulus (Fig. 1b). Neuronal response to different stimulus amplitudes was further characterized by counting the number of spikes generated in each trial over the window 0–50 ms poststimulus onset (Fig. 1b, middle traces). A cumulative Gaussian sigmoid function was fitted to the neuronal responses. The sigmoid function can be described with four parameters: its minimum and maximum asymptotes, which respectively correspond to baseline activity and the maximum response rate; the inflection point (M50) at which the neural response is half of maximum response range; and the slope of the function at M50, which represents the sensitivity of response function. The fitting covered >75% of the neuronal response variability for 75% of the recordings. The M50 and the asymptotes (Fig. 2e,f) were estimated only for neurons that reached their response saturation across all three adaptation states.
Figure 2.
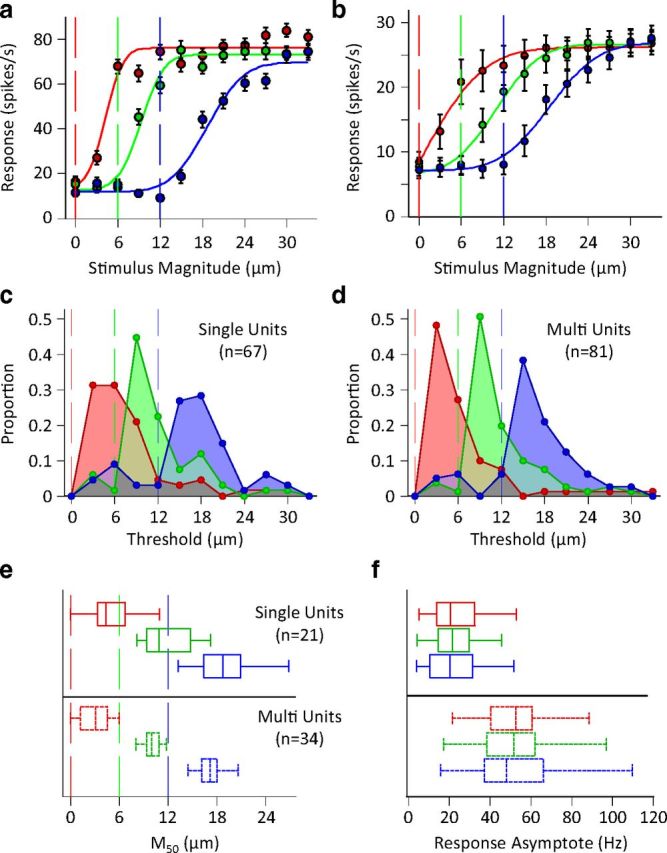
Single unit and population response characteristics in different adaptation states. a, Amplitude response functions of the example neuron from Figure 1. Data points in red indicate response to the test stimulus following no adaptation; points in green and blue indicate response following adaptation to 6 and 12 μm vibration (this convention will be used henceforth). Vertical lines represent the magnitude of the adapting stimulus. Continuous lines represent the best fit of a cumulative Gaussian function to each of the three neuronal response functions. Error bars represent standard error of means across trials. b, Average population response functions. The responses of simultaneously recorded units were averaged to produce a population spike count for individual sessions with a minimum of 5 units. The population spike counts were then averaged across sessions (n = 8). Conventions and fitting are as described in a. Error bars represent the standard error of means across sessions. c, The histogram of the distribution of neuronal thresholds for single units. d, As in c but for clusters of multiunits. e, Distribution of the M50 for single-units (top) and multiunit clusters (bottom). Whiskers of the box plot indicate the extent of the M50 distribution, ends of the boxes represent the upper and lower quartiles, and the bisection line of the boxes indicates the median of the distribution. Vertical lines indicate the magnitude of adapting stimulus. f, Distribution of maximum response rate of fitted cumulative Gaussians for the units in e.
Mutual information analyses.
To quantify the neuronal coding efficiency on a trial-to-trial basis, the mutual information (MI) between test stimuli and neuronal responses was calculated for each adaptation state using the following formula (Cover and Thomas, 1991):
 |
where S and R denote the set of stimuli and neuronal responses across trials, and p(s), p(r) and p(r|s) represent the probability of presenting test stimulus s, probability of observing response r evoked across all stimuli, and the conditional probability of observing response r given stimulus s was presented. For population analysis, r represents the summed activity across neurons. The probabilities in Equation 1 are estimated from a limited number of stimulus repetitions (100 trials per stimulus), potentially leading to an upward bias in information (Panzeri et al., 2007). To calculate this bias we used a number of bias-correction procedures—a simple bootstrap method, the quadratic extrapolation method (Strong et al., 1998; Nemenman et al., 2004), and the Panzeri–Treves method (Panzeri and Treves, 1996; Panzeri et al., 2007). Given the high number of trials relative to the number of response combinations, these methods yielded almost identical results (Pearson's correlation coefficients of all pairwise comparisons > 0.99). Here, we report the results based on the Panzeri–Treves correction method (Magri et al., 2009). In all reported results, this bias is subtracted from the estimated mutual information between neuronal responses and stimuli. For the mutual information analysis of Figure 10d, the range of the pooled responses could potentially lead to an undersampling of the neuronal responses. To obtain unbiased estimates of information, we reduced the dimensionality of the response space R by grouping the spike counts into a smaller number of classes before applying the bias subtraction procedure. The mutual information was independent of the number of response classes (from 12 to the maximum number possible). This grouping procedure verified that the estimation of sampling bias was accurate for all population sizes.
Figure 10.

Noise correlation reduces the information efficiency. a, Mutual information for simultaneously recorded single neurons (abscissa) compared with the mutual information for the shuffled responses (ordinate) for each session. The shuffling procedure was repeated 50 times, and the average mutual information value was plotted as MItrial-shuffled. Each line connects different population sizes within a session. Multiple levels of brightness are used for better visibility. For each population size, the information content of all possible selections of that size was averaged within session. Error bars indicate the standard error of means. b, Solid lines with circles as marker indicate mutual information for the simultaneously recorded neural responses (carried over from Fig. 6). Dashed lines with triangles as marker indicate mutual information for the same neuronal responses, but now with a shuffled trial structure. Error bars are the standard error of means across eight recording sessions. c, The percentage improvement in mutual information after shuffling as a function of pool size. d, Mutual information between stimuli and pooled neuronal response across all sessions. Trials of the simultaneously recorded neurons were shuffled to remove noise correlation. For each population size, the information content of 1000 random selections of that size was averaged. This was done with the exception of the population sizes of 1, 72, and 73 neurons, where the number of possible selections was limited to 73, 73, and 1, respectively. The data points after the break in the abscissa includes multiunit clusters with the single-unit data to provide the full population response across all sessions (n = 16). From the firing rates, we estimate that the total population consisted of ∼215 single units.
Principal component analyses.
To quantify the noise correlations for a population of more than two neurons, we applied principal component analysis (PCA) (Pearson, 1901), on the z-scored neuronal spike counts. For a population of N neurons, let the N × 100 matrix R̃N × 100 denote the z-scored neuronal responses to stimulus s across 100 trials. Below we show that neuronal covariability or noise correlation could be represented by the largest eigenvalue of the z-scored neuronal response covariance matrix:
 |
where † represents the Hermitian transpose. Let UΛU† be the eigenvalue decomposition of the covariance matrix C, where UN × N = [ui,j] is a unitary matrix containing the eigenvectors of C, and ΛN × N is the diagonal matrix of the eigenvalues of C sorted in descending order. This eigendecomposition is equivalent to PCA. The first eigenvalue of covariance matrix is then:
 |
where the vertical vector u1represents the first eigenvector (first column of U). As the neuronal responses are z-scored, ci,i equals unity; hence, the second term of the summation in Equation 2 equals 1. Subsequently, normalized λ1, defined as the ratio of λ1 and the sum of all eigenvalues can be formulated as follows:
 |
However, the sum of all eigenvalues equals the sum of all diagonal elements of covariance matrix C, which is equal to N. Thus the normalized λ1 can be re-expressed as follows:
 |
Therefore, normalized λ1 has a positive constant term that is the inverse of the number of neurons in the population. We defined the noise correlation index, denoted by NCI, as the rescaled version of normalized λ1, such that it falls between 0 and 1:
 |
The noise correlation index depends solely on the covariance of the neuronal responses, not their variance. We also quantified the direction of the noise compared to the diagonal line in the N dimensional space of neuronal activity as follows:
 |
As the response of cortical neurons increases with stimulus intensity, the diagonal line in the space of z-scored neuronal responses provides a suitable reference for the signal direction. Based on this equation, the noise direction is a value between 0 and π.
For the special case of a pair of neurons (N = 2)
 |
where c is the covariance of the two z-scored neuronal responses, and sign denotes the sign function (1 for positive values, −1 for negative values, and 0 for 0).
By applying the same normalization as in Equation 5, the noise correlation index equals |c|, which is identical to the absolute value of Pearson's correlation coefficient. Moreover, by substituting the value of u1 for N = 2 into Equation 6 and after some mathematical simplifications, the noise direction can be expressed as follows:
 |
Accordingly, for the special case of two neurons, the noise correlation index is identical to the absolute value of the Pearson's correlation coefficient, and noise direction determines the polarity of the correlation. Figure 9c empirically illustrates this relationship.
Figure 9.

Correlations in variability in the neuronal population activity as revealed by principal component analysis. a. Left panels: z-scored neuronal responses were used to calculate normalized eigenvalues which are plotted as a function of test stimulus amplitude for each adaptation condition, for populations of 8 simultaneously recorded single units. Right panels: the average normalized eigenvalues with the order of trials shuffled. Error bars are the standard error of the means across recording sessions which contain at least 8 single neurons (n = 5). Vertical lines indicate the magnitude of the adaptor. b, Replotting the first eigenvalues (λ1) from a for direct comparison across adaptation states. The shuffled values are subtracted to remove the bias and provide a direct measure of noise correlation. Error bars are the standard error of means across sessions. The inset demonstrates the distribution of angles between the first eigenvector (u1) and the diagonal line. This eigenvector is referred to as noise direction. For clarity of illustration, the histogram of the shuffled angles is scaled down by a factor of 3. As the noise direction did not change as a function of stimulus amplitude, the histogram is plotted for all stimuli. c, The relationship between noise correlation index (abscissa) and Pearson's correlation coefficient (ordinate) for neuronal pairs. Each data point corresponds to a unique neuron pair recorded in a unique stimulus-adaptation condition. ϕ denotes the angle between the noise direction and the diagonal line. d, The noise correlation index as a function of stimulus amplitude averaged across sessions containing at least five simultaneously recorded units (n = 8). Error bars are standard error of mean across sessions. e, The noise correlation indices from d but replotted as a function of average population firing rate. Each data point corresponds to the average noise correlation index for each stimulus and adaptation condition. The average population firing rate was calculated by averaging firing rates across neurons and trials within each session. The solid tick lines indicate the linear regressions for each adaptation state. The horizontal and vertical lines show the mean of average values (center of the distribution of data points) for each adaptation state.
All of the aforementioned equations can be generalized to the cases where the covariance matrix is not full rank simply by removing the rows and columns of singularity from the covariance matrix C. These rows and columns correspond to the neurons with zero average spike counts, and hence zero variability and covariability with any other neurons.
In Figure 9d, the noise correlation index was calculated separately for the neuronal populations recorded in each session (1–8). This analysis includes both single-unit and multiunit recordings. The average value of 250 trial-shuffled noise correlation indices was subtracted from the data. Shuffling the order of trials for a given population decorrelates the neuronal responses.
We calculated the expected value of noise direction of an uncorrelated neuronal population in the N-dimensional space, as follows. Since the direction is measured with respect to the diagonal line, it varies between 0 and π. After shuffling, the probability distribution of the eigenvectors is uniform on the surface area of a half N-dimensional hyper-sphere of unit radius centered around the diagonal line. Thus the expected value of the noise direction, denoted by ϕ̄, can be expressed as
 |
where Sn(r) is the surface area of an n-dimensional hypersphere with radius r. Here the numerator is the element of surface area on the N-dimensional hypersphere at angle ϕ with respect to the diagonal line, which forms an (N − 1)-dimensional hyper-sphere with radius sinϕ. The surface area Sn(r) is calculated by the following formula (Sommerville, 1958):
 |
where Γ denotes the Gamma function. Substituting the surface areas in Equation 9 yields:
 |
This integration can be expressed in terms of generalized hyper-geometric function 3F̃2. In a two-dimensional space ϕ̄ equals 45°, while in three-dimensional space ϕ̄ is equal to 1 radian or 57.3°. For an eight-dimensional space, ϕ̄ is equal to 72.6°. As the number of dimensions increases, the value of ϕ̄ tends toward 90°.
Results
Using a 32 channel (eight electrodes per four shanks) probe (Fig. 1a), we simultaneously sampled multiple neuronal responses from rat barrel cortex under urethane anesthesia. A piezoelectric wafer vibrated the principal contralateral whisker that corresponded to the recording site. Stimuli were a brief (250 ms) adaptation stimulus of sinusoidal vibration followed by a half-cycle (6.25 ms) pause and a single sinusoidal cycle of test stimulation (12.5 ms). We used three blocked adaptation amplitudes (0, 6, and 12 μm) and twelve test amplitudes (0 to 33 μm, in 3 μm steps); each repeated 100 times. Each block was preceded by 5 s of continuous presentation of the adaptor. A sample of stimulus blocks is shown in Figure 1a; the traces in the red, green, and blue boxes correspond to blocks of 0, 6, and 12 μm adaptation stimuli. This color convention will be used henceforth. Figure 1b illustrates the responses of a typical single neuron to a 30 μm amplitude test stimulus in each of the three adaptation conditions.
The neuronal activity measure that is most commonly used in sensory coding and behavior is the whole-stimulus spike count (Britten et al., 1992). To investigate the effect of adaptation on the responses to the test stimuli, we calculated the evoked responses in a 50 ms window poststimulus onset (rectangles in Fig. 1b). Previous recordings from barrel cortex have revealed that most of the information about vibration stimuli is transmitted within this time window (Arabzadeh et al., 2004). All of following analyses therefore focus on the spike counts measured within this window.
Adaptation causes a lateral shift in neuronal response function
Figure 2a shows the average spike count across 100 trials as a function of test amplitude for the example neuron from Figure 1. The neuron has a sigmoidal input–output function with adaptation causing a rightward shift and a minimal change in the maximum response. To capture this effect across all recorded units, for each adaptation condition we fit a cumulative Gaussian function to the neuronal responses (solid colored lines; see Materials and Methods for details). For this example neuron, the inflection point (M50) of the sigmoid was at test amplitudes of 4.3, 9.3, and 18.7 μm for the 0, 6, and 12 μm adaptors, respectively. M50 identifies the informative portion of the response curve because small changes in test amplitude result in large changes in response. For this neuron, M50 remained systematically above the adapting stimulus amplitude. This motif was repeated when we looked at the population activity across sessions, as shown in Figure 2b. To quantify lateral shift in the response function of cortical neurons, for every recording we defined threshold as the lowest stimulus magnitude to which the neuronal response was significantly different from the baseline activity at each adaptation state (Wilcoxon rank-sum test with p values < 0.05). Figure 2c,d show the distribution of neuronal thresholds separately for single units and clusters of multiunits. For all adaptation conditions, 67 single units out of 73, and 81 multiunits out of 86 had a threshold within the range of the stimuli we applied. Overall, 81% of units whose threshold was lower than the adaptor raised their threshold to above the adaptor after adaptation to 6 μm vibration. Likewise, 94% of units whose threshold was lower than the adaptor raised their threshold to above the adaptor after adaptation to 12 μm vibration. Figure 2e plots the box and whisker representation of the M50 values for all valid fits (only neurons which reached saturation within the range of the stimulus set were included; see Materials and Methods). For both single unit and multiunit recordings we found that nearly all M50 values were above the adaptation amplitudes. In comparison, Figure 2f demonstrates that the maximum response (i.e., the asymptote of the fitted function) of the same neurons was not systematically affected by adaptation.
Adaptation increases overall neuronal response variability
Given identical stimulation, the response of each neuron exhibits random variability from trial to trial. The quality of neural coding efficacy and response fidelity prominently depends upon this stochastic neuronal variability. Fano factor, defined as the ratio of the variance of neuronal responses to their average, is a measure of neuronal response reliability; the higher the Fano factor, the less reliable the neuronal coding. To quantify coding reliability at the level of individual neurons, we calculated neuronal response Fano factor for every stimulus amplitude at each adaptation state. The Fano factor of single units and multiunit clusters of neurons decreased in a nonlinear manner as the stimulus amplitude increased, as shown in Figure 3a,b. For individual neurons, Fano factor dropped from 1.2 to a plateau of 0.9, describing a change in the stochasticity of the firing regime from supra-Poisson to sub-Poisson (Fig. 3a). In the case of clusters of multiunits, Fano factor dropped from 1.6 to a plateau of 1.0 (Fig. 3b). Adaptation caused a rightward shift in the Fano factor profile; the stimulus amplitude at which Fano factor began to drop was proportional to the amplitude of the adapting stimulus. Figure 3c,d characterize neuronal variability in terms of neuronal firing rate rather than stimulus amplitude. While the average firing rate decreased with adaptor amplitude, the average Fano factor increased (Fig. 3c,d; see vertical and horizontal lines). Fano factor exhibited an inverse proportionality with respect to firing rate. Linear regression analysis indicated that a linear function well-characterized the relationship between neuronal firing rate and Fano factor for every adaptation state (r2>0.93; p < 10−6). Although the distribution of data points in Figure 3c,d differed across adaptation states, the relationship between firing rate and Fano factor was essentially independent of adaptation state (permutation test; p > 0.07 for all pairwise comparisons between adaptation states). Figure 3e plots the variance of the firing rate as a function of the mean firing rate. As expected, variance increased as the mean firing rate increased for both low and high firing rate regimes (the low firing rate regime is better visible in the right panel with the logarithmic axes). The drop in Fano factor as a function of firing rate (Fig. 3c,d) thus indicates that the increase in mean firing rate outweighs the increase in variance.
Figure 3.
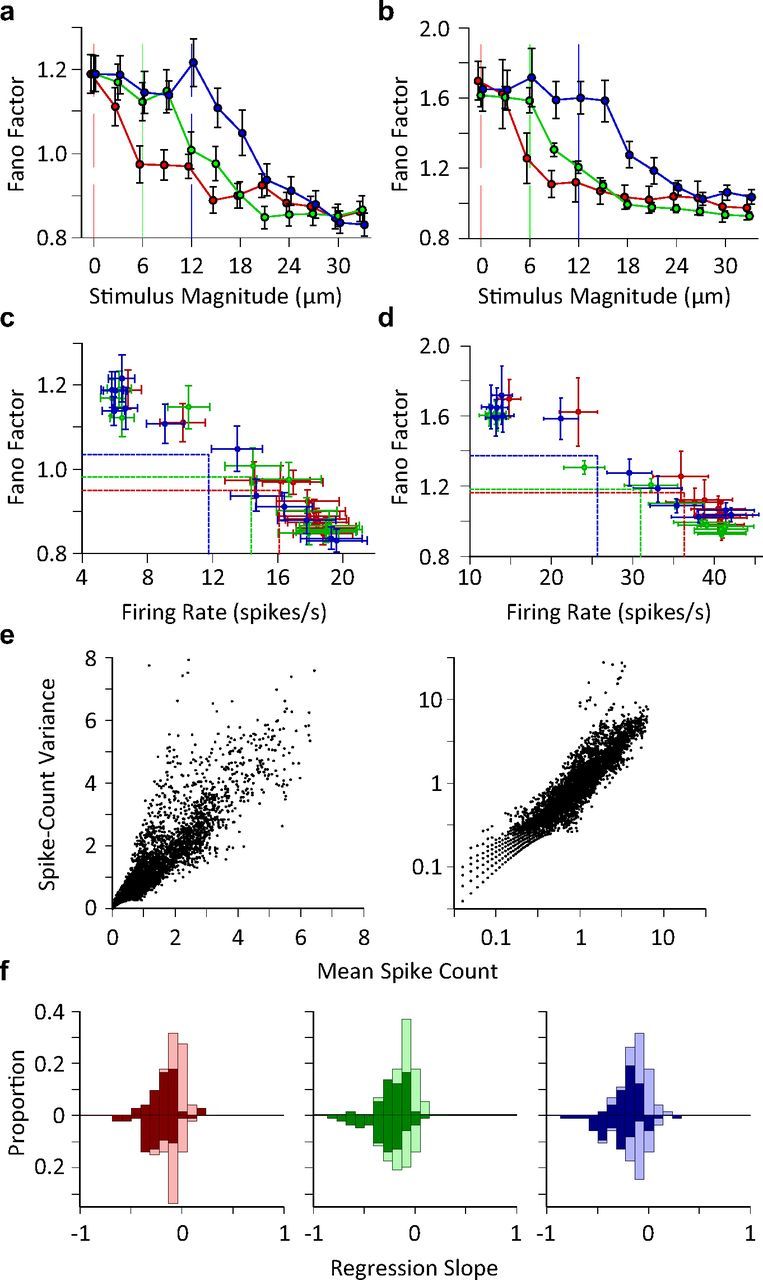
Trial-to-trial variations in neuronal response. a, Single unit Fano factor as a function of stimulus intensity. The plot includes 64 single units as 9 (out of 73) units had zero firing rate in one or more conditions and, consequently, calculating the Fano factor meant division by zero. Each data point represents one stimulus. Error bars indicate standard error of means across neurons. b, as in a but for multiunit clusters (n = 69). c, Fano factor as a function of average firing rate for single neurons. Each data point represents the average Fano factor versus the average firing rate across recordings for a unique stimulus. The horizontal and vertical lines show the mean of average values (center of the distribution of data points) along y- and x-axes for each adaptation state. d, As in c, but for multiunit clusters from b. e, Spike count variance as a function of average spike count. Spike count is calculated over a 50 ms window post stimulus onset. Each data point corresponds to a unique neuron-stimulus-adaptation state triplet. Right panel contains the same data as in the left panel; however, the axes are in logarithmic scale for a clear demonstration of low firing rate regimes. f, The histogram of the linear regression slope of the Fano factor with respect to the z-scored neuronal activity for single units (upward bars) and multiunit clusters (downward bars) separately plotted for every adaptation state. The dark bars correspond to recordings with a significant linear regression (p < 0.05).
To what extent does the negative dependency between Fano factor and neuronal response rate occur at the level of individual neurons? To address this question, we calculated the linear regression slope of Fano factor against z-scored firing rate across all stimulus–adaptation conditions for every individual recording. Figure 3f demonstrates the histogram of linear regression slopes for individual recordings for each adaptation state. Over 84% of individual neurons and 88% of clusters of multiunits exhibit a negative regression slope. For over 85% of these neurons, the linear regression was significant (p < 0.05). These findings indicate that the effect of adaptation on single neuron response variability can be formulated in terms of the induced changes in the average firing rate.
Adaptation improves coding efficiency
Sensory judgments are usually made from single encounters with short durations of vibration stimulation (Adibi and Arabzadeh, 2011). We asked how an ideal observer of neuronal responses could decode the stimuli using a single trial observation. We quantified the mutual information between a 3 μm increase in test stimulus amplitude and the corresponding change in neuronal response. Figures 4a,b show the mutual information between neuronal responses and pairs of stimuli with 3 μm amplitude difference. Consistent with the lateral shifts of response functions observed in Figure 2, here the mutual information values were highest at and above the adapting amplitude. In addition, we quantified the information transmitted about the total stimulus set for each of the adaptation conditions (Fig. 4c). A Wilcoxon signed-rank test revealed that the total stimulus set information was significantly higher for each of the two adapted conditions compared to the nonadapted one (p < 0.001). What are the mechanisms leading to enhanced coding efficiency? To address this question, we furthered the analysis by quantifying the mutual information between all possible stimulus pairs (n = 66) and their corresponding neuronal responses. Figure 5 illustrates pairwise stimulus discriminability (in terms of mutual information) for single units (top left triangles) and multiunit clusters (bottom right triangles). Rows and columns indicate stimulus magnitude, and brightness entries give the information available between the two corresponding stimuli. For both single units and multiunit clusters, as the neurons adapt, low amplitude stimuli become less discriminable from each other while higher levels of discriminability become available within the intermediate range. This results in a net increase in the number of pairwise discriminations after adaptation. Across single units, mean number of significantly discriminable stimulus pairs (based on a permutation test for every stimulus pair and unit, p < 0.05) increased from 24.4 ± 13.1 (mean ± SD) in the nonadapted state to 31.0 ± 13.0 and 32.2 ± 13.4, respectively for the 6 and 12 μm adaptation states. Likewise, for the multiunit clusters the mean number of significantly discriminable stimulus pairs was 29.0 ± 12.5 (nonadapted), 35.6 ± 11.9 (6 μm adaptation), and 35.0 ± 12.3 (12 μm adaptation). This pattern of results is consistent with the lateral shift in the response function of neurons as established in Figure 2.
Figure 4.

Information transmission in single- and multi-units. a, Mutual information between responses of single neurons and pairs of stimuli (with a magnitude difference of Δs = 3 μm). Abscissa is the smaller stimulus magnitude of each stimulus pair. Vertical lines indicate the amplitude of the adaptors. Error bars are standard error of means across single neurons. b, As in a, but for multiunit clusters. c, Mutual information between neural responses and the total set of stimuli (n = 12). Box and whisker plots and colors follow previous conventions.
Figure 5.
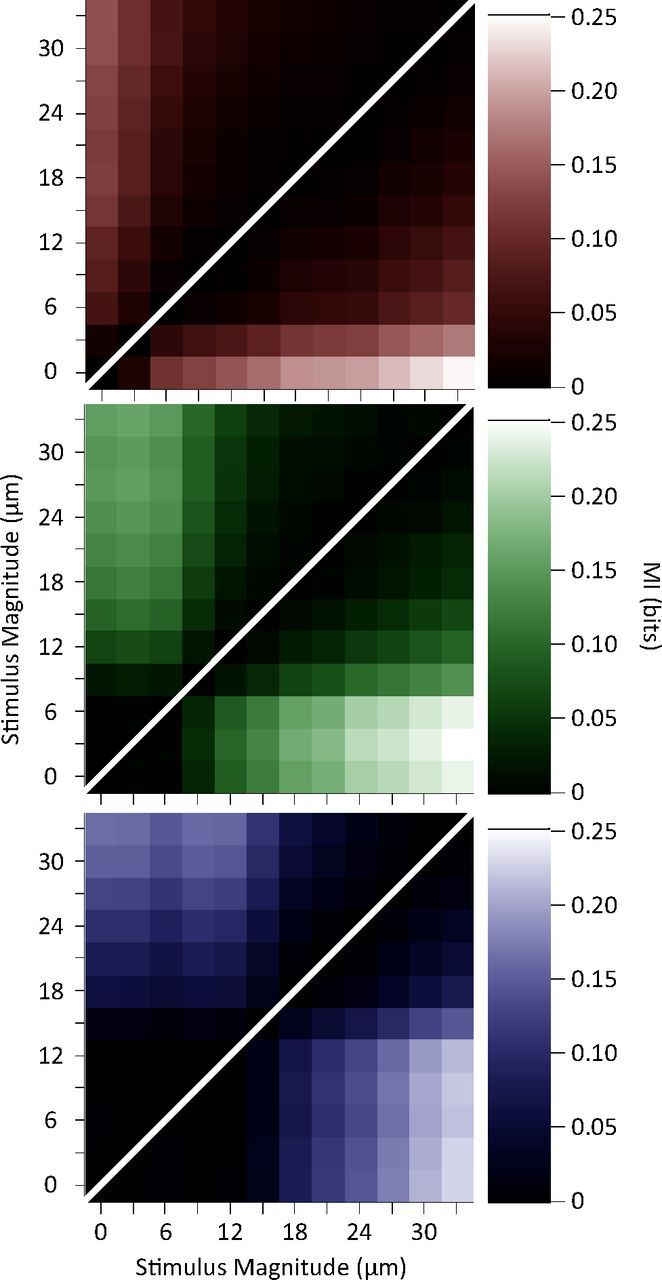
Discriminability between pairs of stimuli measured as the mutual information between responses of neurons and each stimulus pair. The brightness of each element in the graph gives the mutual information value about that stimulus pair averaged across single units (top left triangle) and multiunit clusters (bottom right triangle).
Although adaptation increased the total information, the amount of information carried by individual neurons or by multiunit clusters remained relatively low compared to the stimulus entropy (log22 = 1 for pairwise comparisons, and log212 = 3.58 for comparisons within the whole stimulus set). We thus asked to what extent pooling the activity of multiple neurons increases the information transmitted. This is illustrated in Figure 6; pooling had a more pronounced effect for the two adapted conditions compared to the nonadapted condition. However, the surprising finding was that across all adaptation conditions, the effect of pooling was prominent for up to only about three single neurons (Fig. 6c), and the gain in pooling was reduced thereafter. To what extent is this reduction in gain due to correlations in response variability across neurons?
Figure 6.

Population coding efficiency. a, The mutual information in the 6 μm adaptation state (ordinate) and nonadapted state (abscissa). Various population sizes within a session are connected with a line. Multiple levels of brightness are used for better visibility. For each population size, the information content of all possible selections of that size were averaged within session. Error bars indicate the standard error of means. b, As in a, but for 12 μm adaptation state (ordinate) compared to the nonadapted state (abscissa). The y-axis is the same as the one in a. c, Mutual information between pooled single-unit responses and the total set of stimuli as a function of pool size. Different adaptation conditions are colored as per convention. Error bars are standard error of means across recording sessions. The data points after the break in the abscissa include multiunit clusters with the single-unit data to provide the full population response in each session. We estimate that these recordings consisted of between 17 and 45 single units.
Correlations in response variability across neurons
Previous research (Zohary et al., 1994; Reich et al., 2001; Averbeck et al., 2006) indicates that one hindrance to optimal stimulus encoding is correlations in neurons' trial-to-trial variability. When we compared the responses of two simultaneously recorded neurons (Fig. 7a), it became evident that the neurons' responses covary within each stimulus level. We quantified the correlation in trial-to-trial variability in spike counts, i.e., noise correlation, by calculating the Pearson's correlation coefficient between neuronal pairs. Figure 7b plots the histogram of the correlation coefficient values across all simultaneously recorded neuronal pairs (if both are single units, n = 245, upward bars; otherwise, n = 1207, downward bars). Under all adaptation conditions and test stimuli, some neuronal pairs showed significant correlations (dark bars). However, the proportion of significantly correlated pairs decreased as test stimulus intensity increased. Furthermore, the stimulus intensity at which this proportion noticeably dropped depended on the adaptation condition. In the nonadapted condition even a low intensity stimulus (i.e., 6 μm) caused a noticeable drop in the number of correlated pairs, while a higher intensity stimulus was needed to generate a similar drop for the adapted conditions. Figure 7c demonstrates that the mean correlation coefficient across all pairs of neuronal recordings declined as stimulus intensity increased. Adaptation caused a lateral shift in the profile of the correlation coefficients. Furthermore, correlation coefficients were inversely proportional to the average firing rate, as shown in Figure 7d. Linear regression analyses for each adaptation state revealed that this relationship was significant (all p values < 10−5 and r2 > 0.91), but there was little difference across adaptation conditions. This implies that adaptation changes the distribution of data points from a highly active, weakly correlated regime to a less active, more correlated regime (Fig. 7d, dashed lines) without affecting the relationship between average firing rate and correlations. This inverse proportionality was observed at the level of individual pairs, for 83.7% of single unit pairs and 79.2% of other possible pairs. Of these pairs, over 55.1 and 56.1% showed a significant negative regression slope (p < 0.05) respectively (see insets in Fig. 7d).
Figure 7.
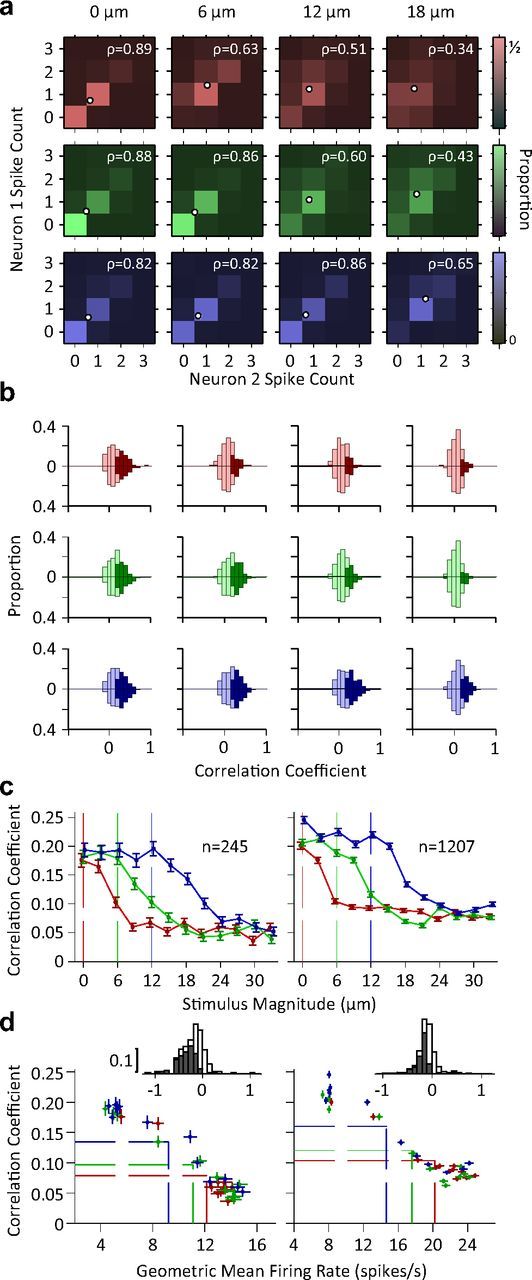
Correlations in variability across pairs of neurons. a, Color indicates the proportion of joint spike counts for a pair of simultaneously recorded single neurons. White circles indicate mean spike counts for each stimulus. The Pearson's correlation coefficient of the spike counts is indicated by ρ for each panel. b, Histogram of pairwise correlation coefficients across all possible simultaneously recorded single unit pairs (n = 245; upward bars) and other neuronal pairs (n = 1207; downward bars). Dark colors indicate correlation coefficients that are significantly different from zero (p < 0.05). c, The mean Pearson's correlation coefficient across all possible pairs of single units (left) and other neuronal recording pairs (right) as a function of stimulus intensity. Error bars indicate standard error of means. d, Pearson's correlation coefficient as a function of geometric mean firing rate of neuronal pairs. Each data point represents average correlation coefficient against geometric mean firing rate averaged across all pairs of simultaneously recorded single neurons (left; n = 245) or averaged across all other possible pairs of recordings excluding pairs of single neurons (right; n = 1207). Every data point represents one stimulus. Dashed lines show the mean of average values (center of the distribution of data points) for each adaptation state. The insets depict the histogram of regression slopes of Pearson's correlation against average firing rate for individual pairs (single unit pairs on the left, other pairs on the right). For each pair, regression analysis was performed across all stimuli and adaptation states. Dark bars indicate the cases that linear regression was significant (p < 0.05).
The cross-correlation analysis could not be applied to dimensions beyond two neurons. Therefore, we further scrutinized the covariability of multiple neurons with PCA. To do this, we consider the population response in a multidimensional space where each of the simultaneously recorded neurons in the population represents one dimension. As schematically illustrated in Figure 8a, each point in this space corresponds to the population response in a single trial. First the response variance is equalized across individual neurons by z-scoring their response within a stimulus and adaptation condition. Consequently, any stretch in the distribution of the data points reflects trial-to-trial covariations across the population. Randomly shuffling the order of trials across neurons is expected to remove the covariation and result in a spherical distribution (Fig. 8b).
Figure 8.

Schematic illustration of neuronal response covariation for a population of 3 neurons. a, Each dimension represents the z-scored activity of one neuron. The marginal distribution of responses for individual neurons are plotted on their corresponding axes. PCA is used to characterize the shape of the population response distributions in terms of the maximum amount of stretch (highest eigenvalue, λ1) and its direction (first eigenvector, u1). b, Shuffling trial sequence across neurons eliminates the covariation without affecting the marginal distributions.
PCA is a mathematical procedure that allows us to characterize the shape of the population response distributions in terms of the amount of stretch and its direction. It converts the data into a set of values of linearly uncorrelated variables called principal components, with the first principal component capturing the maximum covariation in the data. In mathematical terms, the first eigenvalue of the z-scored neuronal spike-count covariance matrix, denoted by λ1, signifies the greatest co-variance of the data which lies on the first eigenvector of the covariance matrix (Fig. 8). The value of λ1 normalized to all eigenvalues quantifies the degree of the stretch in the data, and thus the strength of noise correlation. The first principal component direction indicates the “noise direction.”
We first focus on eight simultaneously recorded single units as a specific population size. Five sessions contained eight single units or more and were therefore included in this analysis. Figure 9a shows the eight eigenvalues for each stimulus intensity separately under the three adaptation states. Here, normalized λ1 captures most of the covariations in the neuronal responses. Removing noise correlation by shuffling the order of trials led to a significant drop in the value of normalized λ1 as expected, but it did not affect the value of other eigenvalues. Furthermore, trial shuffling eliminated the dependency of normalized λ1 on stimulus amplitude, as shown in Figure 9a, right panels. These observations confirm that the first eigenvalue captures the neuronal covariability or noise correlation. Figure 9b summarizes the joint effect of stimulus and adaptation on the normalized λ1. To directly quantify correlations, the shuffled values were subtracted from normalized λ1. The neuronal responses became more decorrelated with stimulus amplitude. Consistent with the cross-correlation analysis, adaptation caused a lateral rightward shift in the profile of normalized λ1.
We found that the direction of the noise correlation was close to the signal direction (Fig. 9b, inset). The average direction of the noise in the shuffled set was 72.2°, which was consistent with the expected value of the angle of a random vector uniformly distributed on a hypersphere (72.6°) in an eight-dimensional space (see Materials and Methods).
How can one extend the PCA analysis to provide a direct comparison across populations of different sizes? The value of normalized λ1 is biased by one over the number of neurons in the population (neuronal space dimensionality). To generalize the normalized λ1 as a measure of noise correlation to populations with any arbitrary number of neurons, we rescaled the normalized λ1 between 0 and 1 (see Materials and Methods). This new measure, called “noise correlation index,” quantifies noise correlation within a population with any number of neurons.
To provide a simple validation of this analysis, Figure 9c compares the noise correlation index with Pearson's correlation coefficient for pairs of units. The comparison demonstrated an exact match between the values of both measures (as mathematically predicted), with the noise correlation angle, denoted by φ, indicating the polarity of correlation.
We employed this index to quantify noise correlation across all sessions with different population sizes. Figure 9d illustrates the noise correlation index as a function of stimulus amplitude for all adaptation states across sessions. In agreement with the results obtained in Figure 9b, the neuronal populations demonstrate a significant covariation or noise correlation. The noise correlation declined with increasing stimulus amplitude. Adaptation shifted the noise correlation profile to the right, leading to an increase in the neuronal noise correlation for stimuli at amplitudes around and below that of the adaptor.
Similar to the neuronal variability analysis, Figure 9e further characterizes noise correlations in terms of the average population firing rate. Noise correlation strength decreased with population firing rate. Linear regression analyses revealed that noise correlation is inversely proportional to population firing rate for all adaptation conditions (all p values < 0.001). Moreover, the relationship between noise correlation and firing rate remained unchanged across different states of adaptation (Fig. 9e). Adaptation changed the neuronal operating regime to lower rates with higher correlated variability (horizontal and vertical lines in Fig. 9E) without affecting the intrinsic covariability of any given response level.
The effect of noise correlation on neural coding efficiency
As neuronal variability is positively correlated in the signal direction, we hypothesized that this correlation is detrimental to the transmission of information about the stimuli. To verify this, we recalculated the mutual information between the stimuli and neuronal responses after shuffling the order of trials. This shuffling eliminates the simultaneity and consequently the noise correlation without affecting the response of individual neurons. The presence of noise correlation reduced mutual information at all adaptation states, as shown in Figure 10a,b. This reduction is more marked at larger pool sizes. Figure 10c quantifies the percentage increase in mutual information when the noise correlation is removed. Noise correlation affected the neural coding efficiency (in terms of mutual information) in the adapted states more than in the nonadapted case.
To quantify the information that could have potentially been carried by the population in the absence of noise correlation, we recalculated the mutual information for any possible number of decorrelated single units pooled together. For each pool size, the neurons were selected randomly from all recording sessions. Thus, in each population those neurons that were not recoded simultaneously had no noise correlation. For those neurons in the population that were recorded simultaneously, if any, we shuffled the order of trials to eliminate the noise correlation. Figure 10d demonstrates the mutual information for each adaptation state versus the pool size. In the absence of noise correlation, coding efficiency was higher for the adapted states. The relationship between mutual information and pool size was highly nonlinear. For uncorrelated neurons, the mutual information continued to rise without reaching saturation, up to the maximum number of recorded neurons.
Discussion
Effect of adaptation on neuronal response function
Efficient coding requires that tuning curves change, optimally mapping stimulus inputs to outputs. We found that sensory adaptation causes a lateral shift in the amplitude response function of neurons in rat barrel cortex while having no consistent effect on the dynamic range of their firing response. This finding is consistent with previous research in cat auditory nerve fibers (Wen et al., 2009), auditory midbrain (Dean et al., 2005), and primary visual cortex (Durant et al., 2007) and in rat primary somatosensory cortex (Garcia-Lazaro et al., 2007). Here, adaptation shifted the steepest part of the response function to amplitudes above that of the adaptor. In a sinusoidal deflection with fixed frequency, greater amplitude directly leads to greater speed. Previous electrophysiological studies revealed that barrel cortex neurons encode vibrations in terms of the speed of movement (Arabzadeh et al., 2003, 2004). Our results suggest that the whisker system adapts to optimally encode not the baseline stimulus signal, but signal strengths greater than baseline. During whisking most whisker motion is imparted by the rat rather than by the environment; faster whisker displacements occur when the whiskers catch on an object and are then released (Arabzadeh et al., 2005) and can thus signal informative environmental features.
Effect of adaptation on neuronal response variability
The Fano factor of single- and multi-unit clusters of neurons decreased as the stimulus intensity increased (Fig. 3). This drop is consistent with previous findings in visual area V4 (Cohen and Maunsell, 2009) and MT (Uka and DeAngelis, 2003; Osborne et al., 2004), premotor cortex (Churchland et al., 2006), and superior temporal sulcus (Oram, 2011) of monkeys (for a detailed review see Churchland et al., 2010). Adaptation caused a lateral shift in the Fano factor profile similar to that observed for the neuronal response function. However, the relationship between Fano factor and firing rate remained unchanged across different states of adaptation (Fig. 3c,d). Adaptation thus transferred the neuronal operating regime to lower rates with higher variability (Fano factor) without affecting the intrinsic variability of any given response level.
Effect of adaptation on population response covariability
We found that at all levels of adaptation there is a positive correlation in “noise” between simultaneously recorded units (Fig. 7). Applying principal component analysis to z-scored spike counts demonstrated a general drop in the noise correlation as a function of stimulus amplitude (Fig. 9). Cortical neurons thus exhibited less correlation in variability when driven by external stimuli. Such stimulus-driven decorrelations have been reported in recent studies in monkey primary visual cortex (Kohn and Smith, 2005) and superior temporal sulcus (Oram, 2011) and in rat primary somatosensory (Ghim et al., 2008) and prefrontal (Ghim et al., 2011) cortices. Likewise, computer simulations of a recurrent neural network showed that stimulus-induced activity can suppress the intrinsic variability as measured in terms of eigenvalues of covariance matrix (Abbott et al., 2011). The dependence of noise correlation on stimulus intensity could be explained based on changes in firing rate; as firing rate increased, noise correlation between cortical neurons decreased regardless of adaptation condition and stimulus intensity (Fig. 7d and Fig.9e). This is however at odds with the findings of de la Rocha et al. (2007); who demonstrated that increased firing rate led to a rise in the spike count correlation. This difference can be attributed to two factors. Firstly, de la Rocha and colleagues (de la Rocha et al., 2007) injected a correlated current into the soma to precisely simulate shared presynaptic inputs. In contrast, we recorded the activity of neurons in an interconnected network. It has been shown that inhibitory and excitatory connections and network dynamics affect the correlation of neuronal activity (Cafaro and Rieke, 2010; Renart et al., 2010; Hofer et al., 2011). Secondly, the difference might be due to the nonlinearity of response functions. The suppressive nonlinearity in the response function of cortical neurons could decrease spike correlations (de la Rocha et al., 2007); spike correlation may not be apparent when neuronal responses saturate. Indeed, in our data as population response saturates (Fig. 2b), there is a corresponding reduction in the noise correlation (Fig. 7c and Fig.9d).
Plotting noise correlation as a function of stimulus amplitude (Fig. 7c and Fig.9d) reveals a rightward shift following adaptation and thus an overall increase in the strength of noise correlation (most prominent at amplitudes lower than the adaptor). This finding is in conflict with a recent study demonstrating that adaptation reduced neuronal correlation in primary visual cortex and hence improved the efficiency of neuronal orientation discriminability and population coding (Gutnisky and Dragoi, 2008). This discrepancy can be attributed to the difference in the stimulus parameters applied in the latter study and ours. In that study (Gutnisky and Dragoi, 2008), Gutnisky and Dragoi used fixed contrast sine-wave gratings at a range of orientations. Stimuli varying in orientation recruit different populations of orientation-tuned neurons. We, however, varied stimulus intensity; this recruits identical neuronal ensembles and predominantly affects the magnitude of the population response. Previous studies also showed that neuronal correlation in primary visual cortex is orientation independent (Zohary et al., 1994; Kohn and Smith, 2005) but contrast dependent (Kohn and Smith, 2005). It thus remains unclear to what extent the modulation of neuronal correlation observed by Gutnisky and Dragoi (Gutnisky and Dragoi, 2008) is due to the difference between adapting and test stimulus orientations.
Effect of adaptation on neural coding efficiency
At the level of individual neurons and small clusters, our information theoretic analyses revealed that response adaptation shifts the efficient coding region to intensities above the adaptor intensity (Fig. 4a,b) which is consistent with previous studies (Dean et al., 2005; Durant et al., 2007; Garcia-Lazaro et al., 2007; Wen et al., 2009). Beyond a simple redistribution of resources, adaptation increased the overall mutual information between the whole stimulus set and neuronal responses (Fig. 4c).
To quantify the effect of adaptation on population coding efficiency, it is crucial to incorporate neuronal response correlations. Previous studies have quantified the effect of noise correlation between “pairs” of neurons on the coding efficiency in retinal ganglion cells (Cafaro and Rieke, 2010), rat vibrissa system (Petersen et al., 2001), monkey and cat primary visual cortex (Gawne et al., 1996; Golledge et al., 2003), monkey somatosensory cortex (Romo et al., 2003), inferior temporal cortex (Gawne and Richmond, 1993; Rolls et al., 2003), supplementary motor area (Averbeck and Lee, 2003; 2006), and prefrontal cortex (Averbeck et al., 2003). Because of their focus on pairs of neurons, these studies reported a relatively small effect of noise correlation on neural coding (but see Averbeck and Lee, 2006). However, other studies revealed that strongly correlated populations can appear weak when correlation is quantified at the level of pairs of neurons (Schneidman et al., 2006) and that such correlations can significantly degrade neural decoding performances if neglected (Graf et al., 2011).
Theoretical studies indicate that noise correlation could either increase or decrease the amount of information, depending on the relative direction of signal and noise correlations (Johnson, 1980; Oram et al., 1998; Panzeri et al., 1999). We characterized the effect of noise for neuronal ensembles of 3–11 single neurons and for multiunit clusters of up to 45 neurons. The direction of noise and signal correlations was similar; thus, noise correlation was detrimental to the neuronal information content. This was further confirmed by information theoretic analysis comparing the shuffled trial structures with the actual recorded trials (Fig. 10).
We found that adaptation-induced noise correlation reduces the population information content at stimulus intensities lower than that of the adaptor and hence degrades population coding efficiency. The detrimental effect of noise correlations on the information content of the population responses increased as the population size increased, reducing the information gained for each new addition to the pool (Fig. 10b). This impairment is greater under adaptation and can reduce the information content by 50% for a large population (Fig. 10c). This observation is consistent with previous theoretical studies showing a plateau in the information content of correlated populations (Zohary et al., 1994; Abbott and Dayan, 1999; Sompolinsky et al., 2001; Wilke and Eurich, 2002; Schneidman et al., 2006). However, in our study the adaptation-induced improvement in coding efficiency at the level of single neurons outweighed the detrimental effect of noise correlations across neurons such that under adaptation the total information content of the neural population responses surpassed that of the nonadapted case. The enhancement in population coding efficiency by sensory adaptation is achieved at reduced metabolic cost because of the adaptation-induced drop in population response (Laughlin et al., 1998; Niven and Laughlin, 2008).
Recently, there has been rapid progress in understanding the behavioral capacities that are supported by the whisker sensory system, such as how cortical neurons efficiently represent key aspects of the animals' environment like object location (Ahissar and Knutsen, 2008) and surface texture (Diamond et al., 2008a). Vibro-tactile detection and discrimination provide another behavioral task at which rats excel (Adibi and Arabzadeh, 2011). An interesting question for future experiments is to directly test the behavioral consequences of sensory adaptation using vibro-tactile discrimination paradigms.
Footnotes
This work was supported by the Australian Research Council Discovery Project DP0987133 and the Australian National Health and Medical Research Council Project Grant 1028670.
The authors declare no competing financial interests.
References
- Abbott LF, Dayan P. The effect of correlated variability on the accuracy of a population code. Neural Comput. 1999;11:91–101. doi: 10.1162/089976699300016827. [DOI] [PubMed] [Google Scholar]
- Abbott LF, Rajan K, Sompolinsky H. Interactions between intrinsic and stimulus-evoked activity in recurrent neural networks. In: Ding M, Glanzman DL, editors. The Dynamic brain: an exploration of neuronal variability and its functional significance. New York: Oxford UP; 2011. pp. 65–82. [Google Scholar]
- Adibi M, Arabzadeh E. A comparison of neuronal and behavioral detection and discrimination performances in rat whisker system. J Neurophysiol. 2011;105:356–365. doi: 10.1152/jn.00794.2010. [DOI] [PubMed] [Google Scholar]
- Adibi M, Diamond ME, Arabzadeh E. Behavioral study of whisker-mediated vibration sensation in rats. Proc Natl Acad Sci U S A. 2012;109:971–976. doi: 10.1073/pnas.1116726109. [DOI] [PMC free article] [PubMed] [Google Scholar]
- Ahissar E, Knutsen PM. Object localization with whiskers. Biological Cybernetics. 2008;98:449–458. doi: 10.1007/s00422-008-0214-4. [DOI] [PubMed] [Google Scholar]
- Arabzadeh E, Petersen RS, Diamond ME. Encoding of whisker vibration by rat barrel cortex neurons: implications for texture discrimination. J Neurosci. 2003;23:9146–9154. doi: 10.1523/JNEUROSCI.23-27-09146.2003. [DOI] [PMC free article] [PubMed] [Google Scholar]
- Arabzadeh E, Panzeri S, Diamond ME. Whisker vibration information carried by rat barrel cortex neurons. J Neurosci. 2004;24:6011–6020. doi: 10.1523/JNEUROSCI.1389-04.2004. [DOI] [PMC free article] [PubMed] [Google Scholar]
- Arabzadeh E, Zorzin E, Diamond ME. Neuronal encoding of texture in the whisker sensory pathway. PLoS Biol. 2005;3:e17. doi: 10.1371/journal.pbio.0030017. [DOI] [PMC free article] [PubMed] [Google Scholar]
- Averbeck BB, Lee D. Neural noise and movement-related codes in the macaque supplementary motor area. J Neurosci. 2003;23:7630–7641. doi: 10.1523/JNEUROSCI.23-20-07630.2003. [DOI] [PMC free article] [PubMed] [Google Scholar]
- Averbeck BB, Lee D. Effects of noise correlations on information encoding and decoding. J Neurophysiol. 2006;95:3633–3644. doi: 10.1152/jn.00919.2005. [DOI] [PubMed] [Google Scholar]
- Averbeck BB, Crowe DA, Chafee MV, Georgopoulos AP. Neural activity in prefrontal cortex during copying geometrical shapes. Exp Brain Res. 2003;150:142–153. doi: 10.1007/s00221-003-1417-5. [DOI] [PubMed] [Google Scholar]
- Averbeck BB, Latham PE, Pouget A. Neural correlations, population coding and computation. Nat Rev Neurosci. 2006;7:358–366. doi: 10.1038/nrn1888. [DOI] [PubMed] [Google Scholar]
- Barlow HB. Possible principles underlying the transformation of sensory messages. In: Rosenblith WA, editor. Sensory Communication. Cambridge, MA: MIT; 1961. pp. 217–234. [Google Scholar]
- Britten KH, Shadlen MN, Newsome WT, Movshon JA. The analysis of visual motion: a comparison of neuronal and psychophysical performance. J Neurosci. 1992;12:4745–4765. doi: 10.1523/JNEUROSCI.12-12-04745.1992. [DOI] [PMC free article] [PubMed] [Google Scholar]
- Cafaro J, Rieke F. Noise correlations improve response fidelity and stimulus encoding. Nature. 2010;468:964–967. doi: 10.1038/nature09570. [DOI] [PMC free article] [PubMed] [Google Scholar]
- Churchland MM, Yu BM, Ryu SI, Santhanam G, Shenoy KV. Neural variability in premotor cortex provides a signature of motor preparation. J Neurosci. 2006;26:3697–3712. doi: 10.1523/JNEUROSCI.3762-05.2006. [DOI] [PMC free article] [PubMed] [Google Scholar]
- Churchland MM, Yu BM, Cunningham JP, Sugrue LP, Cohen MR, Corrado GS, Newsome WT, Clark AM, Hosseini P, Scott BB, Bradley DC, Smith MA, Kohn A, Movshon JA, Armstrong KM, Moore T, Chang SW, Snyder LH, Lisberger SG, Priebe NJ, et al. Stimulus onset quenches neural variability: a widespread cortical phenomenon. Nat Neurosci. 2010;13:369–378. doi: 10.1038/nn.2501. [DOI] [PMC free article] [PubMed] [Google Scholar]
- Cohen MR, Kohn A. Measuring and interpreting neuronal correlations. Nat Neurosci. 2011;14:811–819. doi: 10.1038/nn.2842. [DOI] [PMC free article] [PubMed] [Google Scholar]
- Cohen MR, Maunsell JHR. Attention improves performance primarily by reducing interneuronal correlations. Nat Neurosci. 2009;12:1594–1600. doi: 10.1038/nn.2439. [DOI] [PMC free article] [PubMed] [Google Scholar]
- Cover TM, Thomas JA. Elements of information theory. New York: Wiley; 1991. [Google Scholar]
- de la Rocha J, Doiron B, Eric Shea-Brown E, Josić K, Reyes A. Correlation between neural spike trains increases with firing rate. Nature. 2007;448:802–806. doi: 10.1038/nature06028. [DOI] [PubMed] [Google Scholar]
- Dean I, Harper NS, McAlpine D. Neural population coding of sound level adapts to stimulus statistics. Nat Neurosci. 2005;8:1684–1689. doi: 10.1038/nn1541. [DOI] [PubMed] [Google Scholar]
- Diamond ME, Arabzadeh E. Whisker sensory system–from receptor to decision. Prog Neurobiol. 2012 doi: 10.1016/j.pneurobio.2012.05.013. Advance online publication. Retrieved June 6, 2012. [DOI] [PubMed] [Google Scholar]
- Diamond ME, von Heimendahl M, Arabzadeh E. Whisker-mediated texture discrimination. PloS Biol. 2008a;6:e220. doi: 10.1371/journal.pbio.0060220. [DOI] [PMC free article] [PubMed] [Google Scholar]
- Diamond ME, von Heimendahl M, Knutsen PM, Kleinfeld D, Ahissar E. Where and what is the whisker sensorimotor system? Nat Rev Neurosci. 2008b;9:601–612. doi: 10.1038/nrn2411. [DOI] [PubMed] [Google Scholar]
- Durant S, Clifford CWG, Crowder NA, Price NSC, Ibbotson MR. Characterizing contrast adaptation in a population of cat primary visual cortical neurons using Fisher information. J Opt Soc Am Opt Image Vis Sci. 2007;24:1529–1537. doi: 10.1364/josaa.24.001529. [DOI] [PubMed] [Google Scholar]
- Garcia-Lazaro JA, Ho SS, Nair A, Schnupp JW. Shifting and scaling adaptation to dynamic stimuli in somatosensory cortex. Eur J Neurosci. 2007;26:2359–2368. doi: 10.1111/j.1460-9568.2007.05847.x. [DOI] [PubMed] [Google Scholar]
- Gawne TJ, Richmond BJ. How independent are the messages carried by adjacent inferior temporal cortical neurons? J Neurosci. 1993;13:2758–2771. doi: 10.1523/JNEUROSCI.13-07-02758.1993. [DOI] [PMC free article] [PubMed] [Google Scholar]
- Gawne TJ, Kjaer TW, Hertz JA, Richmond BJ. Adjacent visual cortical complex cells share about 20% of their stimulus-related information. Cereb Cortex. 1996;6:482–489. doi: 10.1093/cercor/6.3.482. [DOI] [PubMed] [Google Scholar]
- Ghim JW, Huh N, Jung MW, Oh JH. Information transmission by stimulus-dependent modulation of noise correlation. Neuroreport. 2008;19:453–457. doi: 10.1097/WNR.0b013e3282f5ddb6. [DOI] [PubMed] [Google Scholar]
- Ghim JW, Baeg EH, Kim YB, Jung MW. Stimulus-induced reduction of noise correlation in rat prefrontal cortex. Neuroreport. 2011;22:824–829. doi: 10.1097/WNR.0b013e32834b93bc. [DOI] [PubMed] [Google Scholar]
- Golledge HDR, Panzeri S, Zheng F, Pola G, Scannell JW, Giannikopoulos DV, Mason RJ, Tovée MJ, Young MP. Correlations, feature-binding and population coding in primary visual cortex. Neuroreport. 2003;14:1045–1050. doi: 10.1097/01.wnr.0000073681.00308.9c. [DOI] [PubMed] [Google Scholar]
- Graf ABA, Kohn A, Jazayeri M, Movshon JA. Decoding the activity of neuronal populations in macaque primary visual cortex. Nat Neurosci. 2011;14:239–245. doi: 10.1038/nn.2733. [DOI] [PMC free article] [PubMed] [Google Scholar]
- Gutnisky DA, Dragoi V. Adaptive coding of visual information in neural populations. Nature. 2008;452:220–224. doi: 10.1038/nature06563. [DOI] [PubMed] [Google Scholar]
- Hofer SB, Ko H, Pichler B, Vogelstein J, Ros H, Zeng H, Lein E, Lesica NA, Mrsic-Flogel TD. Differential connectivity and response dynamics of excitatory and inhibitory neurons in visual cortex. Nat Neurosci. 2011;14:1045–1052. doi: 10.1038/nn.2876. [DOI] [PMC free article] [PubMed] [Google Scholar]
- Hosoya T, Baccus SA, Meister M. Dynamic predictive coding by the retina. Nature. 2005;436:71–77. doi: 10.1038/nature03689. [DOI] [PubMed] [Google Scholar]
- Johnson KO. Sensory discrimination: decision process. J Neurophysiol. 1980;43:1771–1792. doi: 10.1152/jn.1980.43.6.1771. [DOI] [PubMed] [Google Scholar]
- Khatri V, Bruno RM, Simons DJ. Stimulus-specific and stimulus-nonspecific firing synchrony and its modulation by sensory adaptation in the whisker-to-barrel pathway. J Neurophysiol. 2009;101:2328–2338. doi: 10.1152/jn.91151.2008. [DOI] [PMC free article] [PubMed] [Google Scholar]
- Kohn A, Smith MA. Stimulus dependence of neuronal correlation in primary visual cortex of the macaque. J Neurosci. 2005;25:3661–3673. doi: 10.1523/JNEUROSCI.5106-04.2005. [DOI] [PMC free article] [PubMed] [Google Scholar]
- Kvale MN, Schreiner CE. Short-term adaptation of auditory receptive fields to dynamic stimuli. J Neurophysiol. 2004;91:604–612. doi: 10.1152/jn.00484.2003. [DOI] [PubMed] [Google Scholar]
- Laughlin SB, de Ruyter van Steveninck RR, Anderson JC. The metabolic cost of neural information. Nat Neurosci. 1998;1:36–41. doi: 10.1038/236. [DOI] [PubMed] [Google Scholar]
- Magri C, Whittingstall K, Singh V, Logothetis NK, Panzeri S. A toolbox for the fast information analysis of multiple-site LFP, EEG and spike train recordings. BMC Neurosci. 2009;10:81. doi: 10.1186/1471-2202-10-81. [DOI] [PMC free article] [PubMed] [Google Scholar]
- Maravall M, Petersen RS, Fairhall AL, Arabzadeh E, Diamond ME. Shifts in coding properties and maintenance of information transmission during adaptation in barrel cortex. PLoS Biol. 2007;5:e19. doi: 10.1371/journal.pbio.0050019. [DOI] [PMC free article] [PubMed] [Google Scholar]
- Nagel KI, Doupe AJ. Temporal processing and adaptation in the songbird auditory forebrain. Neuron. 2006;51:845–859. doi: 10.1016/j.neuron.2006.08.030. [DOI] [PubMed] [Google Scholar]
- Nemenman I, Bialek W, Van Steveninck RR. Entropy and information in neural spike trains: Progress on the sampling problem. Phys Rev E Stat Nonlin Soft Matter Phys. 2004;69 doi: 10.1103/PhysRevE.69.056111. 056111. [DOI] [PubMed] [Google Scholar]
- Niven JE, Laughlin SB. Energy limitation as a selective pressure on the evolution of sensory systems. J Exp Biol. 2008;211:1792–1804. doi: 10.1242/jeb.017574. [DOI] [PubMed] [Google Scholar]
- Oram MW. Visual stimulation decorrelates neuronal activity. J Neurophysiol. 2011;105:942–957. doi: 10.1152/jn.00711.2009. [DOI] [PubMed] [Google Scholar]
- Oram MW, Földiák P, Perrett DI, Sengpiel F. The ‘Ideal Homunculus’: decoding neural population signals. Trends Neurosci. 1998;21:259–265. doi: 10.1016/s0166-2236(97)01216-2. [DOI] [PubMed] [Google Scholar]
- Osborne LC, Bialek W, Lisberger SG. Time course of information about motion direction in visual area MT of macaque monkeys. J Neurosci. 2004;24:3210–3222. doi: 10.1523/JNEUROSCI.5305-03.2004. [DOI] [PMC free article] [PubMed] [Google Scholar]
- Panzeri S, Treves A. Analytical estimates of limited sampling biases in different information measures. Network. 1996;7:87–107. doi: 10.1080/0954898X.1996.11978656. [DOI] [PubMed] [Google Scholar]
- Panzeri S, Schultz SR, Treves A, Rolls ET. Correlations and the encoding of information in the nervous system. Proc R Soc Lond B Biol Sci. 1999;266:1001–1012. doi: 10.1098/rspb.1999.0736. [DOI] [PMC free article] [PubMed] [Google Scholar]
- Panzeri S, Senatore R, Montemurro MA, Petersen RS. Correcting for the sampling bias problem in spike train information measures. J Neurophysiol. 2007;98:1064–1072. doi: 10.1152/jn.00559.2007. [DOI] [PubMed] [Google Scholar]
- Pearson KFRS. LIII. On lines and planes of closest fit to systems of points in space. The London, Edinburgh, and Dublin Philosophical Magazine and Journal of Science. 1901;2:559–572. [Google Scholar]
- Petersen RS, Panzeri S, Diamond ME. Population coding of stimulus location in rat somatosensory cortex. Neuron. 2001;32:503–514. doi: 10.1016/s0896-6273(01)00481-0. [DOI] [PubMed] [Google Scholar]
- Pillow JW, Shlens J, Paninski L, Sher A, Litke AM, Chichilnisky EJ, Simoncelli EP. Spatio-temporal correlations and visual signalling in a complete neuronal population. Nature. 2008;454:995–999. doi: 10.1038/nature07140. [DOI] [PMC free article] [PubMed] [Google Scholar]
- Price NSC, Ono S, Mustari MJ, Ibbotson MR. Comparing acceleration and speed tuning in macaque MT: physiology and modeling. J Neurophysiol. 2005;94:3451–3464. doi: 10.1152/jn.00564.2005. [DOI] [PubMed] [Google Scholar]
- Reich DS, Mechler F, Victor JD. Independent and redundant information in nearby cortical neurons. Science. 2001;294:2566–2568. doi: 10.1126/science.1065839. [DOI] [PubMed] [Google Scholar]
- Renart A, de la Rocha J, Bartho P, Hollender L, Parga N, Reyes A, Harris KD. The asynchronous state in cortical circuits. Science. 2010;327:587–590. doi: 10.1126/science.1179850. [DOI] [PMC free article] [PubMed] [Google Scholar]
- Rolls ET, Franco L, Aggelopoulos NC, Reece S. An information theoretic approach to the contributions of the firing rates and the correlations between the firing of neurons. J Neurophysiol. 2003;89:2810–2822. doi: 10.1152/jn.01070.2002. [DOI] [PubMed] [Google Scholar]
- Romo R, Hernández A, Zainos A, Salinas E. Correlated neuronal discharges that increase coding efficiency during perceptual discrimination. Neuron. 2003;38:649–657. doi: 10.1016/s0896-6273(03)00287-3. [DOI] [PubMed] [Google Scholar]
- Schneidman E, Berry MJ, 2nd, Segev R, Bialek W. Weak pairwise correlations imply strongly correlated network states in a neural population. Nature. 2006;440:1007-1012. doi: 10.1038/nature04701. [DOI] [PMC free article] [PubMed] [Google Scholar]
- Smirnakis SM, Berry MJ, Warland DK, Bialek W, Meister M. Adaptation of retinal processing to image contrast and spatial scale. Nature. 1997;386:69–73. doi: 10.1038/386069a0. [DOI] [PubMed] [Google Scholar]
- Smith MA, Kohn A. Spatial and temporal scales of neuronal correlation in primary visual cortex. J Neurosci. 2008;28:12591–12603. doi: 10.1523/JNEUROSCI.2929-08.2008. [DOI] [PMC free article] [PubMed] [Google Scholar]
- Sommerville DMY. An introduction to the geometry of n dimensions. New York: Dover; 1958. [Google Scholar]
- Sompolinsky H, Yoon H, Kang K, Shamir M. Population coding in neuronal systems with correlated noise. Phys Rev E Stat Nonlin Soft Matter Phys. 2001;64 doi: 10.1103/PhysRevE.64.051904. 051904. [DOI] [PubMed] [Google Scholar]
- Strong SP, Koberle R, de Ruyter van Steveninck RR, Bialek W. Entropy and information in neural spike trains. Phys Rev Lett. 1998;80:197–200. [Google Scholar]
- Uka T, DeAngelis GC. Contribution of middle temporal area to coarse depth discrimination: comparison of neuronal and psychophysical sensitivity. J Neurosci. 2003;23:3515–3530. doi: 10.1523/JNEUROSCI.23-08-03515.2003. [DOI] [PMC free article] [PubMed] [Google Scholar]
- Wen B, Wang GI, Dean I, Delgutte B. Dynamic range adaptation to sound level statistics in the auditory nerve. J Neurosci. 2009;29:13797–13808. doi: 10.1523/JNEUROSCI.5610-08.2009. [DOI] [PMC free article] [PubMed] [Google Scholar]
- Wilke SD, Eurich CW. Representational accuracy of stochastic neural populations. Neural Comput. 2002;14:155–189. doi: 10.1162/089976602753284482. [DOI] [PubMed] [Google Scholar]
- Woolsey TA, Van der Loos H. The structural organization of layer IV in the somatosensory region (SI) of mouse cerebral cortex. The description of a cortical field composed of discrete cytoarchitectonic units. Brain Res. 1970;17:205–242. doi: 10.1016/0006-8993(70)90079-x. [DOI] [PubMed] [Google Scholar]
- Zohary E, Shadlen MN, Newsome WT. Correlated neuronal discharge rate and its implications for psychophysical performance. Nature. 1994;370:140–143. doi: 10.1038/370140a0. [DOI] [PubMed] [Google Scholar]