

Abstract
Electrical stimulation of the motor cortex in the rat can evoke complex forelimb multi-joint movements, including movement of limb and paw. In this study, these movements have been quantified in terms of 3D displacement and kinematic variables of two markers positioned on the wrist and middle digits (limb and paw movement, respectively). Electrical microstimulation was applied to the motor cortex using a pulse train of 500 ms duration. Movements were measured using a high-resolution 3D optical system. Five classes of limb movements (abduction, adduction, extension, retraction, elevation) and four classes of paw movements (opening, closure, opening/closure sequence, supination) were described according to their kinematics. A consistent topography of these classes of movements was presented across the motor cortex together with a topography of spatial locations to which the paw was directed. In about one-half of cortical sites, a specific pattern of limb–paw movement combination did exist. Four categories of limb–paw movements resembling behavioral repertoire were identified: reach-shaping, reach-grasp sequence, bring-to-body, and hold-like movement. Overall, the forelimb motor region included: (1) a large caudal forelimb area dominated by reach-shaping movement representation; (2) a small rostral area containing reach-grasp sequence and bring-to-body movement representation; and (3) a more lateral portion where hold-like movement was represented. These results support the view that, in rats, the motor cortex controls forelimb movements at a relatively complex level and suggest that the orderly representation of complex movements and their dynamics/kinematics emerge from the principles of forelimb motor cortex organization.
Introduction
Electrical intracortical microstimulation (ICMS), carried out at low current level (≤60 μA) with brief trains of electrical pulses (≤60 ms; short-duration ICMS), has been used to characterize the topographic map of body in mammal motor cortices (Asanuma et al., 1976; Donoghue and Wise, 1982). However, short-duration ICMS has not exhaustively characterized the complex aspects of cortical motor control on voluntary movement (Schieber, 2001). Indeed, muscle twitches evoked by short-duration ICMS revealed the strength of the synaptic link between cortical neurons and spinal motoneurons but shed little light on the activation of spinal motoneurons during natural movement. On the contrary, ICMS with longer stimulus trains (500 ms; long-duration ICMS) evoked complex and coordinated movements, similar to those of natural behavior (Graziano et al., 2002b). Studies employing long-duration ICMS in monkeys (Graziano et al., 2002a, Graziano et al., 2005, Gharbawie et al., 2011) provided evidence that the primate motor cortex contains not only the body map, but also a map of motor repertoire as well as a map of target locations for the hand in the extrinsic space. These maps could span the entire surface of the motor cortex, including the primary motor cortex (M1) and premotor areas, overlapping different regions. However, whether the organizing features of cortical motor control described in primates are consistent across mammals has not been thoroughly explored (Stepniewska et al., 2005, Stepniewska et al., 2011). A previous study in rats (Haiss and Schwarz, 2005) provided evidence that different patterns of whisker movement are spatially separated and integrated into the whisker motor map, suggesting that cortical separation was due to the specific drive of the subcortical motoneurons needed to generate different patterns of movement. Ramanathan et al. (2006) have reported that long-duration ICMS in the rat motor cortex can result in complex multi-joint forelimb movements organized into a rough topography. However, since this study did not examine the topography of evoked movements in detail and did not provide kinematic information on such evoked movement, it would be of interest to define quantitatively the patterns of forelimb movements evoked by long-duration ICMS. The purpose of the current research was to extend previous study of the rat motor cortex, focusing on the kinematic relations between the limb (shoulder and arm) and paw (wrist and digits) components in forelimb movements evoked by long-duration ICMS. A comprehensive description of the kinematic relations between the limb and paw components in forelimb movements should pave the way to understanding the internal organization of the rat motor cortex (i.e., movement patterns, topography, and spatial map); indeed, such a description could even provide a foundation for extending analysis to the neurobiological basis of motor plasticity under physiological (Ramanathan et al., 2006) and pathological conditions (Whishaw and Coles, 1996; Viaro et al. 2011, Küper et al., 2011).
Materials and Methods
Seven male albino Wistar rats, weighing 280–330 g, were used to characterize forelimb movements evoked by long-duration ICMS and perform a quantitative analysis of kinematics of these complex movements. Seven additional rats were used in a pilot study (data not shown). The experimental plan was designed in compliance with Italian law regarding the care and use of experimental animals (DL116/92) and approved by the institutional review board of the University of Ferrara and by the Italian Ministry of Health. For all experimental procedures rats were anesthetized initially with ketamine HCl (80 mg/kg, i.p.). For the duration of the experiment, anesthesia was maintained by supplementary ketamine injections (4 mg/kg, i.m., given as required, typically every 25–30 min) so as to achieve long latency and sluggish hindlimb withdrawal upon pinching the hindfoot. Under anesthesia, the body temperature was maintained at 36–38°C with a heat lamp.
Long-duration intracortical microstimulation.
ICMS mapping was aimed at defining the topographic distribution of complex forelimb movements in M1. The mapping procedure was similar to the one described by Ramanathan et al. (2006) in the rat and Graziano et al. (2002a) and Graziano et al. (2002b) in the monkey. Animals were placed in a Kopf stereotaxic apparatus. The body of the animal was laid in a prone position on a table with its forelimbs hanging down and free to move in all direction against gravity. The position of the trunk was stabilized to the back of the table to minimize spontaneous trunk movements (head/chest-fixed coordinates). The resting position for each forelimb was in approximately half-way extension/adduction, and the wrist rested palm down with the finger joints in semi-extension (Fig. 1A). To perform the experiment, a large craniotomy was performed to expose the frontal cortex of one hemisphere. The dura remained intact and was kept moist with saline solution. Electrode penetrations were regularly spaced out over a 500 μm grid. Alteration in the coordinate grid, up to 50 μm, was sometimes necessary to prevent the electrode from penetrating a surface blood vessel. Glass-insulated tungsten electrodes (0.6–1 MΩ, impedance at 1 kHz) were used for stimulation. The electrode was lowered vertically to 1.5 mm below the cortical surface, corresponding to layer V of the frontal agranular cortex (Franchi, 2000). To identify complex movements at each cortical site studied, stimulation was applied by an S88 stimulator and two PSIU6 stimulus isolation units (Grass). A 500 ms train of 200 μs duration bipolar pulses was delivered at 333 Hz. Each stimulation pulse was obtained using biphasic current where a negative phase was followed by a positive phase to minimize damage that could occur during long-duration stimulation (Graziano et al., 2002a; Graziano et al., 2002b). Current was measured by the voltage drop across a 1 kOhm resistor in series with return of the stimulus isolation units. At each cortical site, the stimulating current was injected starting from 10 μA and increased gradually in 5 μA steps until a clear multi-joint movement of the forelimb was detected. The threshold, i.e., the current at which the movement was evoked 50% of the time, was determined by two observers. Once a movement threshold was detected (∼50 μA, see Results), the current was raised to 100 μA to optimize movement and facilitate characterization, and then quantitative testing was begun. If no movement was detected at 100 μA, the site was defined as nonresponsive.
Figure 1.
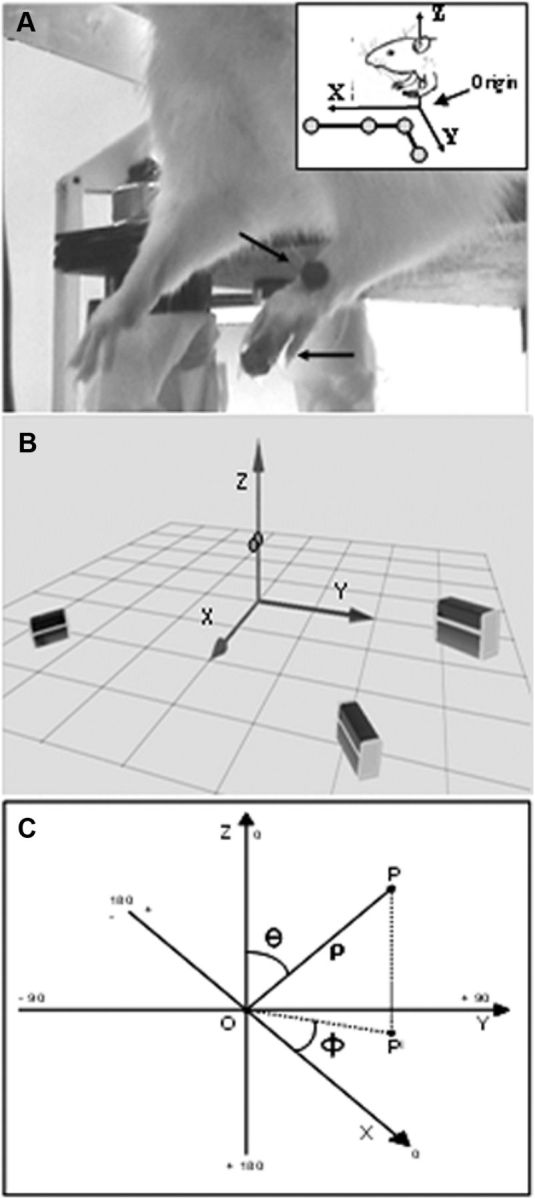
Experimental setup and coordinates system. A, Placement of the reflective markers and forelimbs resting position hanging free. The stationary L-shaped reference structure (top right box) with its four markers defined the origin and orientation of the coordinate system. B, Reconstruction of the real experimental space showing the cameras and markers position. The three cameras were positioned to allow each camera to detect the markers (suspended circles) simultaneously. C, Spherical coordinate system is illustrated for the 3D evaluation of movement direction. Spherical coordinates of a given point P in the XYZ space were defined as follows: rho (ρ) was the distance between P and O. In the present data ρ was the movement vector; all vectors were made to originate from the intersection of axes; phi (ϕ) was the angle between the positive X-axis and OPI; counterclockwise was considered the positive direction (ϕ, between 0 and ±180°); theta (θ) was the angle between the z-axis and OP (θ, between 0 and 180°).
Video recording of complex movements.
Movements evoked by long-duration ICMS were visually identified during mapping sessions and videotaped at 30 frames/s using a standard camera. The recording video camera was positioned to obtain a lateral or a frontal view of the animal. To detect onset of the stimulus, a triggered led was located near the body of the animal within the visual field of the camera. The video recording served as a backup to clarify the data analysis and provide information on the occurrence of the forelimb movements. Videotaped movements were analyzed frame-by-frame using QuickTime and iMovie software (Apple).
Kinematic recording of complex movements and analysis.
Movements evoked by long-duration ICMS were recorded and measured with a motion 3D optical analyzer (Qualisys Motion Capture System). Two adhesive infrared-reflective spheres (diameter, 0.30 cm; weight, 0.04 g) were placed as a markers at two anatomic landmarks on the forelimb skin, the dorsal middle of the wrist and the last phalangeal joint (tip) of the two middle digits, which were used, respectively, to detect limb movement and paw movement (Fig. 1A). Markers in all experiments were placed by the same operator to minimize the variability in terms of their positioning. Three infrared cameras, placed around the animals (Fig. 1B), were used to record the position of markers. The cameras were calibrated according to the Qualisys Motion Capture Analysis System proceedings, placing a stationary L-shaped reference structure with four markers below the animals (Fig. 1A, box at the top right) to define the origin and orientation of the 3D-coordinate system. The direction of coordinate X-, Y-, and Z-axes was anterior, lateral, and dorsal, respectively. Movements were recorded for 2 s at a sampling rate of 100 Hz, and kinematic features were analyzed off-line with Qualisys Track Manager software and with custom MATLAB programs (The MathWorks). The forelimb starting position was not modified during any of the stimulation trials performed in the absence of spontaneous movement. In each animal, sham stimulations were performed both while the animal was standing quietly with the forelimb stationary and while moving it spontaneously. To avoid interference between spontaneous and evoked movements, for analysis purposes ≥4 mm displacement of the wrist or the digit marker in at least one of the X-, Y-, or Z-axes was considered. All measures were achieved by subtracting the marker's resting position in Cartesian coordinates from all points along the trajectory; thus, all datasets began at (0,0,0). At first, the analysis sought to define the classes of movement and their topography across the cortical surface. Since a vertical component (Z-axis displacement) was found in all evoked limb movements, the maximal displacement in one of the X- or Y-axes defined the class of limb movement when the distance exceeded 15% of the displacement in other axis. The Z-axis displacement defined the type of movement when X- and Y-axis displacement was <4 mm (i.e., cutoff of movement). We found that, in all animals, these values were the most reliable for defining the type of limb movement (see Results). When a paw movement was observed, each paw component was obtained by subtracting the wrist marker value from the digit marker value at all points throughout the movement. For each stimulated site, the kinematic variables were obtained by averaging the values obtained in 3–5 microstimulation trials. Analysis provides information on different and complementary movement patterns. Onset of movement was defined as the time-point (in ms) at which the tangential velocity exceeded 5% of maximum velocity (Adamovich et al., 2001), and the time range between stimulation and onset of movement was defined as movement latency (in ms). The end of movement was defined as the time-point (in ms) at which the marker reached maximal displacement (in mm) in one of the X-, Y-, or Z-axes. Displacement toward the resting position and outlasting the stimulus was not considered. The total time spent during movement was defined as movement duration (in ms). For each movement we determined the mean velocity (in mm/s), the peak velocity (in mm/s), and the number of peaks (in absolute value). A peak velocity was counted when it exceeded the mean velocity. The number of peaks within the speed profile has been used to quantify smoothness of movement, and thus each peak velocity represents a period of acceleration and deceleration during movement. For the wrist marker we also determined the trajectory (in mm) and vector (in mm) from initial to final position for each stimulated site. Limb trajectory straightness was determined by the path index (defined as trajectory/vector length ratio) according to the definition that a trajectory following a straight line has an index of 1, while a semicircular one has an index of 1.57 (Archambault et al., 1999). In any case, a path index >1.57 indicates a trajectory whose curvature exceeds that of the arc of a circle.
Data presentation and statistical analysis.
All data are presented as mean ± SEM of n determinations. Multivariate test for difference in means (MANOVA) was used to compare displacement in X-, Y-, and Z-axes and kinematic variables. To analyze differences in kinematic means between classes of movement, one-way ANOVA followed by Tukey's test were performed. Pearson correlation (r) was used to assess the relationship between kinematic variables. Reproducibility of movements (i.e., spatial endpoint coordinates) during different stimulations at the same site was tested by calculating the coefficient of variation (defined as standard deviation/mean ratio). Multivariate discriminant analysis was used to analyze the displacement in X-, Y-, and Z-axes and kinematic variables to classify movements in predefined classes. This method for analyzing series biomechanical data enabled us to determine the class of movement based on a set of variables known as predictors or input variables. The measure of confidence for the corrected classification and the measure of the predicted error rate for each classification were defined by the following: proportion correct = number of correctly classified samples/total number of samples; error rate = number of rejected samples/total number of samples. Physical 3D space evaluation of limb movement direction was performed using the spherical coordinate system (Fig. 1C), a coordinate system for 3D space where the position of a point is specified by three numbers: (1) rho, the distance (in mm) of a point P from the origin O (in the present data, rho defined the limb movement vector length of a value >0); (2) phi, the angle (in degrees) between the X-axis and OPI (i.e., the radius between the projection of P onto the XY plane and the origin), considering counterclockwise the positive direction (phi is between 0 and ±180°); and (3) theta, the angle (in degrees) between the z-axis and OP (theta is between 0 and 180°). All individual displacements in X-, Y-, and Z-axis were also plotted in 2D space to evaluate their spatial dispersions. To characterize the spatial distribution of all movements in the motor cortex across animals, a 2D distribution of movement-responsive sites at coordinate relative to the bregma was generated. Each movement-related site was taken to represent a 0.25 mm2 square of cortical surface (0.50 × 0.50 mm), and 100% probability in a given site was achieved when a movement was observed at that site in all animals. All statistical procedures were performed by using Minitab 15 (Minitab) and MATLAB (MathWorks) software. Values of p < 0.05 were considered statistically significant.
Results
General observations
Altogether, 339 sites were stimulated in M1 of one hemisphere of seven rats. Forty-one percent of these sites were not considered for analysis because stimulation did not evoke markers displacement or because the X-, Y-, and Z-axis displacement was <4 mm for both wrist and digit markers (see Materials and Methods). Usually, these sites were located on the edges of the forelimb region since nonforelimb movements—namely vibrissa, neck, hindlimb, or mouth movements—were simultaneously observed. In all animals, forelimb movements contralateral to the stimulated hemisphere were elicited since bilateral movements were occasionally evoked and ipsilateral movements were not. Because the mean threshold current able to evoke movements was 46.5 ± 2.3 μA, to facilitate movement characterization without altering quality all stimulations were performed at 100 μA. Elicited movements proved repeatable between trials, and their features remained nearly constant over the time required to characterize each cortical site. Forelimb movements were characterized by movement of one or both markers. Overall, the limb movement (wrist marker) was evoked in 38.0% of the sites, paw movement (digit marker) in 11.5%, and the limb-paw movement combination (wrist and digit markers) in the remaining 50.5% of the sites. Complex movements were found in the caudal as well as in the rostral forelimb area (Neafsey et al., 1986).
Limb movement classification
Long-duration ICMS elicited limb movement in 177 of 200 forelimb sites. Evoked movements were divided into classes according to the direction of limb movement (Fig. 2A). Since a vertical component (Z-axis value ≥4 mm; see Materials and Methods) was found in all evoked movements, movements were classified according to the maximal displacement on the X- or Y-axis (Table 1). The repertoire of limb movements evoked by prolonged stimulus trains included the following: (1) abduction (ABD), where the limb was raised and brought outwards from the midline (maximal displacement on Y-axis: positive, 55.4%); (2) adduction (ADD): the limb was raised and brought toward the midline (maximal displacement on Y-axis: negative, 10.1%); (3) extension (EXT): the limb was raised and brought forward (maximal displacement on x-axis; positive, 19.8%); (4) retraction (RTR): the limb was raised and brought backward (maximal displacement on x-axis; negative, 1.7%); (5) elevation (ELV): the limb was raised without shifting in another direction (maximal displacement on z-axis; positive and X and Y axes <4 mm, 13.0%). Multivariate discriminant analysis demonstrated that we achieved a high correct classification rate (predictors, X-, Y-, and Z-axes values vs movement class; 88.1%, 156 of 177 movements, p < 0.0001) and also revealed that the 11.9% false alarm rate was largely due to some ABDs (11 of 98) and EXTs (6 of 35) that the classifier recognized as ELVs. When all individual displacements were plotted in 2D space, movement classes were highlighted as a cluster of points in the scatter plot of maximal displacement X vs Y (Fig. 2B; proportion correct, 0.85). Conversely, clusters of points were not clearly separated in the scatter plots of maximal displacement X versus Z (Fig. 2C; proportion correct, 0.60) and Y versus Z (Fig. 2D; proportion correct, 0.65).
Figure 2.

Limb movement classification according to video recording and to maximum displacement. A, Sequences of pictures taken from video recordings when limb movement was elicited. In each sequence, the picture on the left shows the position of the limb at the beginning of the movement (0 ms); in others the position of the limb is represented in steps of 180 ms. See Table 1 for movement classes. B–D, Scatter plots displaying maximal displacement in X-, Y-, and Z-axes for limb movements for all animals. Individual data were represented by a symbol in 2D space, where axes represent the variables (A, X vs Y; B, X vs Z; C, Y vs. Z). The plot in B visualized the class of movements as a cluster of points highlighted by the confidence ellipsoids (95% confidence limits). See Table 1 for classes of limb movement.
Table 1.
Mean scores (SEM) of maximum displacement (in mm) in X-, Y- and Z-axes of limb and paw movement
| Class | X (mm) | Y (mm) | Z (mm) |
|---|---|---|---|
| Limb | |||
| ABD n = 98 | 5.53 ± 0.83 | 21.72 ± 0.82 | 22.99 ± 1.14 |
| ADD n = 18 | −2.40 ± 1.65 | −10.29 ± 1.42 | 7.61 ± 1.95 |
| EXT n = 35 | 19.33 ± 1.45 | 7.92 ± 0.96 | 14.61 ± 1.50 |
| RTR n = 3 | −10.13 ± 1.67 | 7.26 ± 0.98 | 17.01 ± 3.28 |
| ELV n = 23 | 0.76 ± 0.34 | 3.08 ± 0.26 | 10.17 ± 0.50 |
| Paw | |||
| OPN n = 82 | 9.90 ± 0.38 | 4.75 ± 0.31 | 9.35 ± 0.25 |
| CLO n = 7 | −12.97 ± 0.38 | 6.90 ± 0.91 | 10.46 ± 1.18 |
| OCS n = 12 | |||
| opening | 9.49 ± 1.01 | 3.32 ± 0.65 | 9.80 ± 0.51 |
| closing | −6.45 ± 0.88 | −2.38 ± 0.60 | −9.93 ± 0.47 |
| SUP n = 23 | 2.75 ± 0.82 | −2.10 ± 1.00 | 4.06 ± 0.18 |
Limb classes of movement: ABD, Abduction; ADD, adduction; EXT, extension; RTR, retraction; ELV, elevation. Paw classes of movement: OPN, opening; CLO, closure; OCS, opening/closure sequence (divided into opening phase and closing phase); SUP, supination; n, number of sites for each class.
Limb movement kinematics
To assess differences in kinematic features between classes, kinematic variables were calculated during the limb movement (Fig. 3A–F). ANOVA, performed on latency (F(4,177) = 5.06, p = 0.001) and on duration values (F(4,177) = 3.78, p = 0.006), revealed significant differences between classes. Post hoc analysis demonstrates that ABD had a significantly shorter latency (Fig. 3A) and longer duration (Fig. 3B) when compared to ADD. No major differences were observed among classes in terms of maximal velocity (Fig. 3C; F(4,177) = 2.21, p = 0.07). Contrarily, ANOVA, performed on mean velocity values (F(4,177) = 2.66, p = 0.035), revealed significant differences between classes. Post hoc analysis showed that EXT had a higher mean velocity when compared to ELV (Fig. 3D). Moreover, EXT showed twice the number of peaks (3.97 ± 0.33) than any of the other classes (F(4,177) = 11.74, p < 0.0001). ANOVA, performed on trajectory values (F(4,177) = 13.10, p < 0.0001), revealed that different classes have different trajectory lengths. In particular, ABD and EXT had longer trajectories than the other classes (Fig. 3E), since the EXT trajectory was significantly longer than that ABD. Similarly, ANOVA, performed on vector values (F(4,177) = 26.72, p < 0.0001), revealed that different classes had different vector lengths. ABD had the greatest vector length of all the classes (Fig. 3F), with EXT and RTR as well as ADD and ELV presenting equal length.
Figure 3.

Kinematic variables calculated from the wrist marker during the limb movement. Each histogram shows a kinematic variable (A, Latency; B, duration; C, maximal velocity; D, mean velocity, E, trajectory; F: vector) versus classes of movement (see Table 1). Data are means ± SEM. of n determinations per class; *p < 0.05; **p < 0.01, different from other.
The correlation analysis was used to describe the relationship between different kinematic variables presented in Figure 3. Correlations between duration and trajectory (r = 0.18, p = 0.010) and vector (r = 0.27, p < 0.0001) were positive. Conversely, correlations between latency and duration (r = −0.23, p = 0.002) and vector (r = −0.41, p < 0.0001) were negative. In addition, there was a positive correlation between trajectory and the kinematic variables of velocity (maximal velocity: r = 0.40, p < 0.0001; mean velocity: r = 0.57, p < 0.0001) and peak velocity (r = 0.58, p < 0.0001).
As regards straightness, all trajectories were curved (path index, >1), and in 67.1% the curvature was greater than that of a circle (path index, >1.57). These trajectories exhibited a general C- or S-shape, while less frequently it had a coil shape (Fig. 4). Notably, the coil-shaped trajectory was found in only 25.7% of EXTs. In agreement with this finding, EXT has a path index = 3.72, significantly greater than that of other movements (F(4,177) = 9.89, p < 0.0001). Finally, the low coefficient of variation (0.17 ± 0.12, range: 0.01–0.32) indicated that, at each recorded site, trajectory was consistent between trials.
Figure 4.

Three-dimensional representation of trajectories with path indices >1.57 and different shapes. A, C-shaped; B, S-shaped; C, coil-like-shaped. All trajectories began at 0,0,0. Note that the scales are not equivalent on each axis; it improves the legibility of the graph but decreases the curvature impression (Z-axis has been less expanded).
Map of limb spatial locations
The most consistent feature of stimulation-evoked movements was limb displacement toward a region of peripersonal space. For each stimulation site, the degree of spatial convergence between trials has been expressed by calculating the coefficient of variation of the endpoint coordinates (see Materials and Methods), which proved that stimulation at each site caused convergence of the limb toward a target location (mean, 0.02 ± 0.02; range, 0.00–0.04). To study the endpoint distributions of the limb movement in peripersonal space, the endpoint of stimulation-evoked movements was visualized in each animal (Fig. 5A, two examples). These distributions showed that in each animal there was a clearly clustered arrangement of endpoints according to the different movement classes. To better characterize the movement target locations in space, we defined the 3D distribution of endpoints in each animal. As shown in the example (Fig. 5B), stimulation caused the limb to converge from the initial position versus a different region of space depending on the class of movement. To characterize the endpoints' spatial distribution across animals, we defined the movement endpoints in a 3D spherical coordinate system. In this system, each movement vector was made to origin from the intersection of axes while its length (rho, in mm), with the two angles (theta and phi, in degrees), defined the endpoint's final position (Fig. 1C). Since ELVs were carried out vertically upward along the Z-axis (i.e., maximal displacement in X- and Y-axes, <4 mm), they were not considered for this computation. Multivariate discriminant analysis confirmed the convergence for each class of movement toward a region of space in three Cartesian dimensions (predictors: rho, theta, and phi values vs movement class; 89.0%, 137 of 154 movements; p < 0.0001). This convergence can be evidenced in the phi versus theta (Fig. 6A; proportion correct, 0.68) and phi versus rho (Fig. 6B; proportion correct, 0.75) scatter plots, although it is not clearly represented in the theta versus rho plot (Fig. 6C; proportion correct, 0.52). These results showed that similar spatial endpoint mapping was a consistent feature of limb movement in all animals and suggested that the spatial map of limb movement was strongly related to the Y-axis component of the movement in the three Cartesian dimensions.
Figure 5.

A, Representative spatial distribution of the limb endpoints in two animals. Schemes of the lateral (left) and frontal (right) views of the rat are drawn from a video frame with the limb in starting position. The filled gray circles represent the wrist marker placed at the intersection of the Cartesian axes; other symbols represent the final endpoint positions of the stimulation-evoked limb movements. EXT and ELV endpoints are visualized in the lateral scheme (maximal displacement in X vs Z), and ABD and ADD endpoints are visualized in the frontal scheme (maximal displacement in Y vs Z). B, Representative 3D plot of final limb endpoint locations evoked in one animal. Classes of movement were symbol coded while small full dots were the starting points. Final endpoint locations were different for each class of movement. Note that in this panel, scales are different for each axis to improve legibility.
Figure 6.

A–C, Two-dimensional scatter plot of spherical coordinates showing the movement endpoint locations across animals. Since ELV was only vertically upward on the Z-axis (maximal displacement in X- and Y-axes, <4 mm), it was not displayed in these plots. Individual data were represented by a symbol in 2D space, where axes represent the variables (A, phi vs theta; B, phi vs rho; C, theta vs rho). Plots A and B visualized the movement endpoints as a cluster of points highlighted by the confidence ellipsoids (95% confidence limits).
Paw movement classification
Long-duration ICMS elicited paw movements in 124 of 200 forelimb sites. As can be seen from the video sequences (Fig. 7A) and maximal displacement values (Table 1), paw movements included the following: (1) paw opening (OPN; positive X-axis value, 66.13%); (2) paw closure (CLO; negative X-axis value; 5.64%); (3) paw opening/closure sequence (OCS; positive X-axis followed by negative X-axis values, 9.68%); (4) paw supination (SUP; positive Z-axis value, 18.55%). Video camera analysis revealed that OPN, CLO, and OCS are characterized by simultaneous contraction of the digits, while SUP showed external rotation of the wrist without movement of the fingers. Multivariate discriminant analysis demonstrates that a high correct classification rate was achieved (predictors: X-, Y-, and Z-axes values vs movement class, 73.8%, 137 of 154 movements; p < 0.0001), showing that false alarms (26.2% of movements) were largely due to low discrimination between OPN and the OCS opening phase (classification rate: 67.1% and 58.3%, respectively). On the other hand, multivariate discriminant analysis demonstrates a 100% correct classification rate for CLO and the OCS closing phase. As in the limb analysis, all individual displacements were plotted in 2D space, evidencing that movement classes were clustered in the maximal displacement scatter plots for X versus Y (Fig. 7B) and X versus Z (Fig. 7C), while movement classes were not clearly separated in the scatter plot Y versus Z (Fig. 7D). Notably, in all three scatter plots the points relative to OPN and OCS opening phases overlapped. Moreover, considering a single stimulation, OPN, CLO, and SUP appeared as a single movement, with OCS being characterized by repetitive sequences (5.03 ± 0.50) of the opening and closing phases. Thus, these values strengthen the hypothesis that OPN, CLO, OCS, and SUP can be considered different classes of paw movement.
Figure 7.

Paw movement classification according to video recording and to maximum displacement. A, Sequences of pictures taken from a video recording when paw movement was elicited. In each sequence, the picture on the left shows the position of the paw at the beginning of the movement (0 ms); in other pictures, the position of the paw is represented in steps of 180 ms. See Table 1 for movement classes. B–D, Scatter plots displaying maximal displacement in X-, Y-, and Z-axes for all of the digit marker movements for different animals. Individual data were represented by a point in 2D space where axes represent the variables (B, X vs Y; C, X vs Z; D, Y vs Z). Worthy of note is the overlapping of the OPN and OCS opening phase points in all three plots and the clustering of CLO and OCS closing phase points in B and C.
Paw movement kinematics
To assess differences in kinematic features between classes, kinematic variables were calculated during paw movement (Fig. 8A–D). No major differences in latency (F(3,124) = 0.92, p = 0.43) were observed between the different classes (Fig. 8A). Contrarily, ANOVA, performed on the duration values (F(3,124) = 13.83, p < 0.0001), showed significant differences between classes (Fig. 8B), with OCS having a longer duration than other classes. ANOVA on maximal velocity values (F(3,124) = 12.01, p < 0.0001) revealed strong differences for a single movement, with SUP having a smaller maximal velocity than all other classes (Fig. 8C). Similarly, ANOVA on mean velocity values (F(3,124) = 2.66, p = 0.035) revealed significant differences between classes. Both CLO and OCS were characterized by a higher mean velocity than the other classes (Fig. 8D), with SUP showing the slowest movement. Finally, ANOVA performed on the number of peaks (F(3,124) = 118.99, p < 0.0001) found that OCS had a higher (5.58 ± 0.48) number of peaks than the other movement classes, and its peak velocity appeared at the opening phase of the movement.
Figure 8.

Kinematic variables calculated from the digit marker during the paw movement. Each histogram shows a kinematic variable (A, Latency; B, duration; C, maximal velocity; D, mean velocity) versus classes of movement (see Table 1). Data are means ± SEM of n determinations per class. *p < 0.05; **p < 0.01, different from other.
Motor cortex topography of limb and paw movement
To characterize the spatial distribution of movement classes in M1 across animals, a 2D frequency bregma-relative distribution of limb and paw sites was generated (Fig. 9) in which cumulative sites were coded according to their rates. In accordance with this arrangement, we found the topography of limb-responsive sites (Fig. 9, left column) to be consistent, with ABD clustered at coordinates corresponding the caudal forelimb region, ADD at coordinates corresponding to the rostral forelimb region, EXT at coordinates corresponding to the rostral forelimb region, and the anterior part of the caudal forelimb region and RTR at coordinates corresponding at the posterior border of the caudal forelimb motor region. Unlike other sites, ELV sites were scattered throughout the forelimb motor region and showed no a clear topography. Likewise, the distribution of paw-responsive sites also showed a consistent topography (Fig. 9, right column). OPN was elicited in that portion of the forelimb region where stimulation most often elicited ABD, while CLO and OCS were elicited where stimulation most often elicited ADD or EXT. Finally, SUP was elicited in a more lateral portion of the forelimb region where limb movement was less commonly elicited by electrical stimulation.
Figure 9.
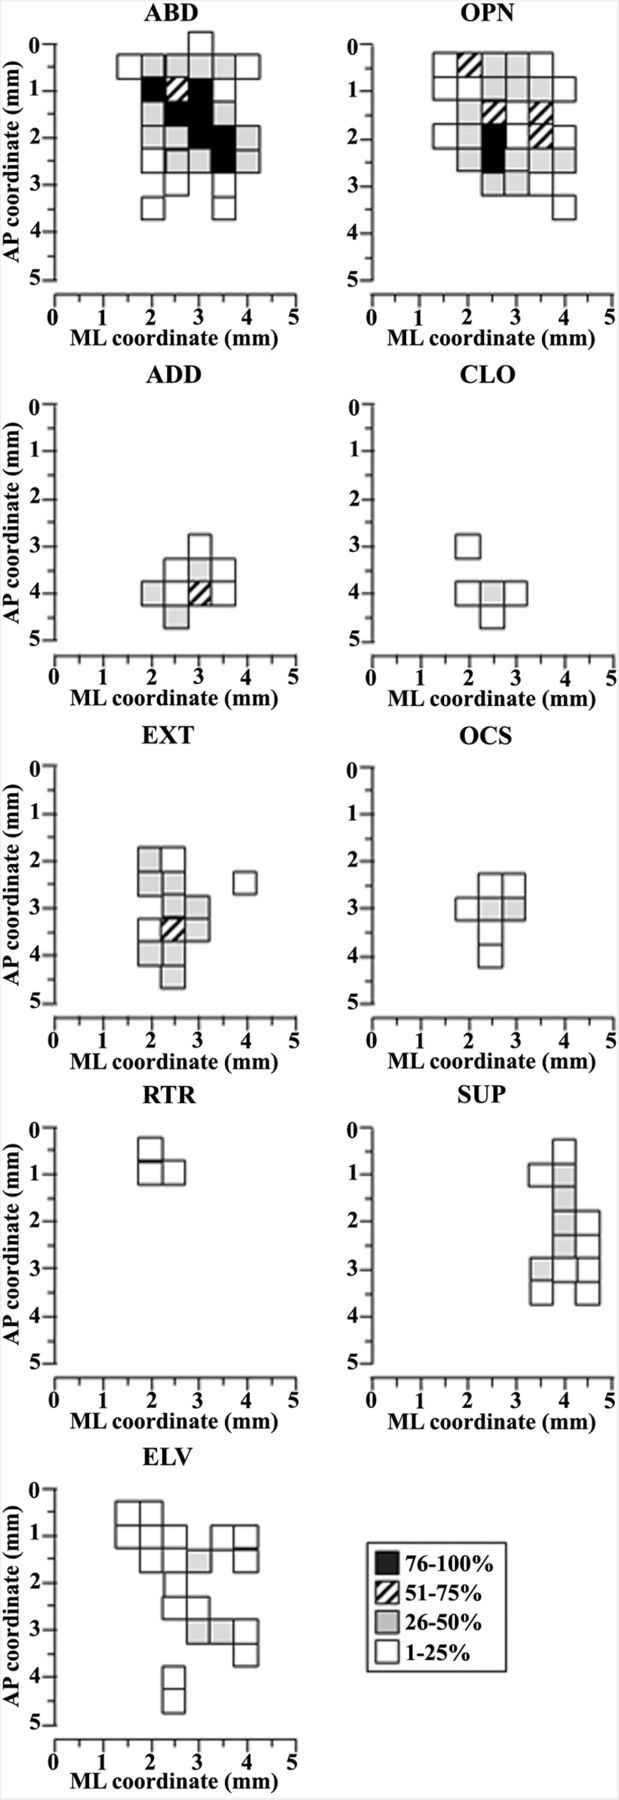
Description of limb and paw movements according to the distribution of sites across the cortical surface. Surface plots show the frequency distribution of sites at each coordinate relative to the bregma. Interpenetration distances were 500 μm. The microelectrode was sequentially introduced to a depth of 1500 μm, and movements were evoked with stimulation intensity of 100 μA. In this M1 mapping scheme, the frontal pole was at the bottom and 0 corresponded to the bregma; numbers indicated rostral or caudal distance from the bregma or lateral distance from the midline (ML). The frequency movement at each site is coded by different gray levels. One hundred percent probability is achieved when a movement at that site was observed in all seven animals. Left column, Limb movement classes, animal n = 7, sites n = 177. Right column, Paw movement classes, animal n = 7, sites n = 124.
Examination of M1 maps (Fig. 10A,B, two examples) revealed that combinations of limb and paw movements accounted for half of all forelimb-related sites (101 of 200 sites). Considering combined sites, OPN was associated with ABD (63.4%), EXT (18.3%) or ELV (18.3%), CLO with ADD (100%), and OCS with EXT (100%), while SUP was elicited as a non-combined movement. In the ABD-OPN combination we found that ABD latency was significantly shorter that in OPN (24.04 vs 29.62 ms; F(1,103) = 7.75, p = 0.006). In other limb–paw movement combinations, the latency value was equal in both the limb and paw components, thus demonstrating that in these movements the motions at the involved joints began simultaneously.
Figure 10.

A, B, Representative arrangement of limb and paw movement sites across the cortical surface in two animals. Absence of any symbol indicates that penetration was not performed due to the presence of a large vessel. Non-forelimb movement observed simultaneously with forelimb movements was not shown. See Tab. 1 for movement classes. C, D, Topographic arrangement of stimulation effects in the same animals shown above, where sites are symbol coded according to the ethological category of movement evoked. Sites where stimulation failed to produce paw movement were excluded. In the schemes, the frontal pole was at the bottom and 0 corresponded to the bregma; numbers indicated rostral or caudal distance from the bregma or lateral distance from the midline.
Motor cortex representation of ethological categories of movement
It has been proposed that long stimulus trains may be more effective than shorter bursts at producing ethologically relevant movements (Graziano et al., 2005; Stepniewska et al., 2005). Stimulation using prolonged stimulus trains evoked movements involving both forelimb and forepaw that resembled those included in the rat's natural motor behavior. Overall, four categories of complex movements resembling behavioral repertoire can be identified (Fig. 10C-D). The first category is the reach–shaping movement. At many cortical sites stimulation drove the paw outward to a location in perisomatic space, laterally or in front of the chest (ABD or EXT and ELV, respectively) and evoked opening of the paw (OPN). The limb and paw movements occurred simultaneously in a smooth coordinated fashion resembling an apparent paw shaping time-synchronized with the reaching, like reaching to grasp an object. When it was evoked on the most medially located sites of the forelimb motor cortex, this movement was associated with ipsilateral whisker retraction. The second category is reach-grasp sequence. At some sites stimulation drove the paw in front of the chest (EXT), and a repetitive sequence of opening/closing of the paw (OCS) was time-synchronized with the acceleration-deceleration phase of the reaching. These movements resembled reaching to grasp sequence. The third category is the bring-to-body movement. For some cortical sites, stimulation evoked movements that combined the forelimb motion toward the body (ADD) and paw closure (CLO). Sometimes (28.6%) these movements were accompanied by a time-synchronized opening of the mouth. These movement components occurred in coordinated fashion resembling the rat's voluntary bringing-to the mouth movements. The fourth category is the hold-like movement. In other cortical sites the stimulation turned the wrist and forearm (SUP) to orient the palm toward the midline or the face. Subjectively, this movement resembled holding an object with the paw, as though the rat was eating a piece of food. We found that these different categories of movement tended to be evoked from different zones of the forelimb motor cortex. As shown in Figure 10, the results varied somewhat across cases, but the same general pattern was always apparent. The bring-to-body movement and reach–grasp sequence were consistently evoked when sites in the rostral forelimb region were stimulated; conversely, reach-shaping movement was consistently evoked when caudal forelimb region was stimulated. In five of seven animals, two clusters of reach-shaping sites could be observed, and these were separated by sites where limb movement was not associated with paw opening. Finally, the hold-like movement was clustered in the most lateral part of the forelimb motor cortex.
Discussion
For the first time, forelimb movements evoked by long-duration ICMS in the rat's M1 were described in terms of 3D displacement and kinematic variables. Data made it possible to define five classes of limb movements (ABD, ADD, EXT, RTR, ELV) and four classes of paw movements (OPN, CLO, OCS, SUP). In ∼50% of the sites, ICMS evoked coordinated limb-paw movements resembling those that are part of a rat's natural motor behavior. We identified four categories of these movements: reach-shaping, reach-grasp sequence, bring-to-body, and hold-like movement.
Long-duration ICMS evokes coordinated movement
In the ketamine-anesthetized animals, reflexes and reciprocal inhibition between antagonistic muscles were manifest (Capaday et al., 1998; Schneider et al., 2001). Furthermore, a comparable pattern of cortical stimulation and inhibition was observed during ICMS in both ketamine-anesthetized and awake rats (Butovas and Schwarz, 2003). Thus, we characterized how activation of corticospinal inputs to the spinal cord, activated from separate motor cortex sites, produced patterns of motor output. In rats, the C4 and C8 spinal segment contains motor neurons controlling proximal and distal musculature, respectively (McKenna et al., 2000). In M1, both C4- and C8-projecting neurons are distributed throughout the forelimb region, describing an interspersed network that does not collateralize across the C4 and C8 spinal segments (Wang et al., 2011). This network of C4–C8 neurons in M1 could explain the finding that, in 50% of the sites, ICMS activated both proximal and distal forelimb musculature and that these sites were distributed throughout the forelimb region. As in other similar results (Graziano et al., 2002a; Stepniewska et al., 2005 and Stepniewska et al., 2009, Harrison et al., 2012; Ramanathan et al., 2006), long-duration ICMS never evoked twisted or unnatural patterns of movement. However, because animals were under anesthesia and restrained in the stereotaxic apparatus, subtle patterns of muscle activity or other components of movement might have been missed.
Movement classes and their kinematics
According to the direction of limb displacement, we define five classes of limb movements (ABD, ADD, EXT, RTR, ELV). The ABD movement was found to be the largest movement represented and this was followed, in order, by EXT, ELV, ADD, and RTR. The video recordings and kinematics demonstrated four classes of paw movements (OPN, CLO, OCS, SUP). We included SUP under paw movement because the wrist rotation was better defined by the digit marker kinematics. OPN movement was found to be the largest movement represented followed by SUP, CLO, and OCS. The movement started 24–31 ms after the onset of stimulation and typically continued to the end, or slightly past or before the end, of 500-ms train of pulses. The displacement toward the resting position and outlasting the stimulus was not considered because it was not possible to distinguish the extent to which the return component was due to a specific activation or a gravity-induced passive biomechanical movement. The poststimulus inhibition (Chung and Ferster, 1998; Butovas and Schwarz, 2003) could explain the passive forelimb displacement toward the resting position. Kinematics showed different temporal and spatial organizations between classes of movement. The longer duration of ABD was mainly due to a longer effective trajectory formation, temporally as well as spatially, with a longer displacement vector than any of the other classes of movement. Conversely, the shorter duration of ADD was mainly due to a longer latency and to a less effective trajectory formation. The trajectory was the longest in the EXT, where it was also more segmented and less straight than the other movement classes. The faster velocity of the EXT was mainly due to a greater number of peaks in comparison to the other movement classes. From kinematics it can be seen that OPN, CLO, and SUP showed equal duration. Kinematics showed that the OCS was evoked in a repetitive fashion and that each peak velocity corresponded to a forward reaching of the limb in the paw opening phase. OPN appeared to be slower than CLO, and SUP proved much slower than movements involving the fingers.
Topographic organization of forelimb motor cortex
A spatial segregation of different classes of limb and paw movements in the forelimb M1 was found. These classes of movements formed a map with different classes associated to different regions of cortex (see Results). The parcellation of motor cortex into functionally distinct zones are likely the product of both their intracortical circuits (Jacobs and Donoghue, 1991; Rouiller et al., 1993) and their corticofugal pathways (Haiss and Schwarz, 2005; Brown and Hestrin, 2009; Rathelot and Strick, 2009). Previous studies (Matyas et al., 2010, Harrison et al., 2012) demonstrated that distinct cortical movement representations persisted after the pharmacological disruption of intracortical synaptic transmission, suggesting that the corticofugal projections play a key role in shaping movement representations. However, we did not find a clear topography for ELV movements in all rats. One possibility was that in ELVs the displacement in X- and Y-axes was below the cutoff of 4 mm. Another possibility is that the ELV movements could be the result of cortical output combination toward opposite directions (Ethier et al., 2006). Overall, these findings suggest that only a limited number of output patterns to various sets of limb and paw muscles were represented in M1.
Stimulation of forelimb motor cortex drives limb movements to distinct positions in space
The most consistent feature of the evoked movement was that the limb movements were arranged across the forelimb M1 according to the location in space to which the movement was directed. Stimulation in the posterior part of the forelimb region commonly drove the limb into the lateral space, as in the case of limb-to-whiskers or limb-to-ear movements. Stimulation in the anterior part of the forelimb region commonly drove the limb into the anterior space, as in the case of limb in front of face or toward the body. We found that the height of the limb movement (i.e., the Z-axis component of limb movement) was not relevant in defining the map across forelimb cortex. To explain this, one possibility is that the resting position for each forelimb may have emphasized the vertical component in evoked limb movement. Otherwise, the topographic arrangement by limb position may indicate that the vertical component in limb movement is less important in normal behavior. The mapping of limb location across forelimb region in rat matched previous results in monkey motor cortex (Graziano et al., 2002a); however, this result was unexpected because the use of forelimb in manipulative actions in rats within its immediate body sphere is much more limited than that of primates. In manipulative actions within their immediate body sphere, isolated forelimb movements are used together with head, tongue, or whisker movements. Thus, forelimb could be used to explore that part of the space around the mouth not covered by explorative movements of whiskers (Brecht et al., 1997; Hartmann, 2011).
Ethological interpretation of the movement patterns
The most consistent feature of limb and paw movements was their combination in specific patterns of four ethological categories of movements. This repertoire of ethological movements was more restricted than that observed in primates (Graziano et al., 2002a; Stepniewska et al., 2009; Gharbawie et al., 2011), in part reflecting the more limited forelimb movement repertoire of the rat. However, the ICMS-evoked repertoire in the rat seems to be richer than those found in mice (Harrison et al., 2012). We can speculate that the cortical zones—where the four patterns of forelimb movements were represented—emphasize particular ethological function. The larger forelimb area where reach-shaping movement was represented may play a role in monitoring objects near the body encoding the preshaping of the paw as an object is reached (Sacrey et al., 2009). This part of the cortex could be involved in grooming and self-cleaning behavior (Casarrubea et al., 2010), skilled reaching (Whishaw et al., 2008; Schwarz et al., 2010), or defensive reaction (Cooke and Graziano, 2004). In the present experiments we did not observe defensive-like or aggressive movements as described in primates (Graziano et al., 2002a; Graziano et al., 2002b; Graziano et al., 2005;). However, the facial movement forming part of the aggressive reactions are not normally evoked in anesthetized rats (Haiss and Schwarz, 2005). The rostral part of the forelimb area—where reach-grasp sequence and bring-to-body movement were represented—may be the equivalent of the ventral premotor area in monkeys (Gentilucci et al., 1988; Rizzolatti et al., 1988; Graziano et al., 2002a; Graziano et al., 2002b; Graziano et al., 2005; Gharbawie et al., 2011). Finally, the hold-like movement may play a role when the rat sustains an object while grasping and eating it with its mouth. A more precise understanding on the nature of ICMS-evoked complex forelimb movement in relation to natural behavior may emerge when the motor area is stimulated in awake, freely moving rats.
Footnotes
This work was supported by a local grant from the University of Ferrara. We are really grateful to Luciano Fadiga and Laila Craighero for having made available to us the Qualisys-Motion Capture System. We also thank Emma Maggiolini for comments on the manuscript.
References
- Adamovich SV, Archambault PS, Ghafouri M, Levin MF, Poizner H, Feldman AG. Hand trajectory invariance in reaching movements involving the trunk. Exp Brain Res. 2001;138:288–303. doi: 10.1007/s002210100694. [DOI] [PubMed] [Google Scholar]
- Archambault P, Pigeon P, Feldman AG, Levin MF. Recruitment and sequencing of different degrees of freedom during pointing movements involving the trunk in healthy and hemiparetic subjects. Exp Brain Res. 1999;126:55–67. doi: 10.1007/s002210050716. [DOI] [PubMed] [Google Scholar]
- Asanuma H, Arnold A, Zarzecki P. Further study on the excitation of pyramidal tract cells by intracortical microstimulation. Exp Brain Res. 1976;26:443–461. doi: 10.1007/BF00238820. [DOI] [PubMed] [Google Scholar]
- Brecht M, Preilowski B, Merzenich MM. Functional architecture of the mystacial vibrissae. Behav Brain Res. 1997;84:81–97. doi: 10.1016/s0166-4328(97)83328-1. [DOI] [PubMed] [Google Scholar]
- Brown SP, Hestrin S. Intracortical circuits of pyramidal neurons reflect their long-range axonal targets. Nature. 2009;457:1133–1136. doi: 10.1038/nature07658. [DOI] [PMC free article] [PubMed] [Google Scholar]
- Butovas S, Schwarz C. Spatiotemporal effects of microstimulation in rat neocortex: a parametric study using multielectrode recordings. J Neurophysiol. 2003;90:3024–3039. doi: 10.1152/jn.00245.2003. [DOI] [PubMed] [Google Scholar]
- Capaday C, Devanne H, Bertrand L, Lavoie BA. Intracortical connections between motor cortical zones controlling antagonistic muscles in the cat: a combined anatomical and physiological study. Exp Brain Res. 1998;120:223–232. doi: 10.1007/s002210050396. [DOI] [PubMed] [Google Scholar]
- Casarrubea M, Sorbera F, Magnusson M, Crescimanno G. Temporal patterns analysis of rat behavior in hole-board. Behav Brain Res. 2010;208:124–131. doi: 10.1016/j.bbr.2009.11.013. [DOI] [PubMed] [Google Scholar]
- Chung S, Ferster D. Strength and orientation tuning of the thalamic input to simple cells revealed by electrically evoked cortical suppression. Neuron. 1998;20:1177–1189. doi: 10.1016/s0896-6273(00)80498-5. [DOI] [PubMed] [Google Scholar]
- Cooke DF, Graziano MS. Sensorimotor integration in the precentral gyrus: polysensory neurons and defensive movements. J Neurophysiol. 2004;91:1648–1660. doi: 10.1152/jn.00955.2003. [DOI] [PubMed] [Google Scholar]
- Donoghue JP, Wise SP. The motor cortex of the rat: cytoarchitecture and microstimulation mapping. J Comp Neurol. 1982;212:76–88. doi: 10.1002/cne.902120106. [DOI] [PubMed] [Google Scholar]
- Ethier C, Brizzi L, Darling WG, Capaday C. Linear summation of cat motor cortex outputs. J Neurosci. 2006;26:5574–5581. doi: 10.1523/JNEUROSCI.5332-05.2006. [DOI] [PMC free article] [PubMed] [Google Scholar]
- Franchi G. Reorganization of vibrissal motor representation following severing and repair of the facial nerve in adult rats. Exp Brain Res. 2000;131:33–43. doi: 10.1007/s002219900297. [DOI] [PubMed] [Google Scholar]
- Gentilucci M, Fogassi L, Luppino G, Matelli M, Camarda R, Rizzolatti G. Functional organization of inferior area 6 in the macaque monkey. I. Somatotopy and the control of proximal movements. Exp Brain Res. 1988;71:475–490. doi: 10.1007/BF00248741. [DOI] [PubMed] [Google Scholar]
- Gharbawie OA, Stepniewska I, Qi H, Kaas JH. Multiple parietal-frontal pathways mediate grasping in macaque monkeys. J Neurosci. 2011;31:11660–11677. doi: 10.1523/JNEUROSCI.1777-11.2011. [DOI] [PMC free article] [PubMed] [Google Scholar]
- Graziano MS, Taylor CS, Moore T. Complex movements evoked by microstimulation of precentral cortex. Neuron. 2002a;34:841–851. doi: 10.1016/s0896-6273(02)00698-0. [DOI] [PubMed] [Google Scholar]
- Graziano MS, Taylor CS, Moore T, Cooke DF. The cortical control of movement revisited. Neuron. 2002b;36:349–362. doi: 10.1016/s0896-6273(02)01003-6. [DOI] [PubMed] [Google Scholar]
- Graziano MS, Aflalo TN, Cooke DF. Arm movements evoked by electrical stimulation in the motor cortex of monkeys. J Neurophysiol. 2005;94:4209–4923. doi: 10.1152/jn.01303.2004. [DOI] [PubMed] [Google Scholar]
- Haiss F, Schwarz C. Spatial segregation of different modes of movement control in the whisker representation of rat primary motor cortex. J Neurosci. 2005;25:1579–1587. doi: 10.1523/JNEUROSCI.3760-04.2005. [DOI] [PMC free article] [PubMed] [Google Scholar]
- Harrison TC, Ayling OG, Murphy TH. Distinct cortical circuit mechanisms for complex forelimb movement and motor map topography. Neuron. 2012;74:397–409. doi: 10.1016/j.neuron.2012.02.028. [DOI] [PubMed] [Google Scholar]
- Hartmann MJ. A night in the life of a rat: vibrissal mechanics and tactile exploration. Ann N Y Acad Sci. 2011;1225:110–118. doi: 10.1111/j.1749-6632.2011.06007.x. [DOI] [PubMed] [Google Scholar]
- Jacobs KM, Donoghue JP. Reshaping the cortical motor map by unmasking latent intracortical connections. Science. 1991;251:944–947. doi: 10.1126/science.2000496. [DOI] [PubMed] [Google Scholar]
- Küper M, Brandauer B, Thürling M, Schoch B, Gizewski ER, Timmann D, Hermsdörfer J. Impaired prehension is associated with lesions of the superior and inferior hand representation within the human cerebellum. J Neurophysiol. 2011;105:2018–2029. doi: 10.1152/jn.00834.2010. [DOI] [PubMed] [Google Scholar]
- Matyas F, Sreenivasan V, Marbach F, Wacongne C, Barsy B, Mateo C, Aronoff R, Petersen CC. Motor control by sensory cortex. Science. 2010;330:1240–1243. doi: 10.1126/science.1195797. [DOI] [PubMed] [Google Scholar]
- McKenna JE, Prusky GT, Whishaw IQ. Cervical motoneuron topography reflects the proximodistal organization of muscles and movements of the rat forelimb: a retrograde carbocyanine dye analysis. J Comp Neurol. 2000;419:286–296. doi: 10.1002/(sici)1096-9861(20000410)419:3<286::aid-cne2>3.0.co;2-3. [DOI] [PubMed] [Google Scholar]
- Neafsey EJ, Bold EL, Haas G, Hurley-Gius KM, Quirk G, Sievert CF, Terreberry RR. The organization of the rat motor cortex: a microstimulation mapping study. Brain Res. 1986;396:77–96. doi: 10.1016/s0006-8993(86)80191-3. [DOI] [PubMed] [Google Scholar]
- Ramanathan D, Conner JM, Tuszynski MH. A form of motor cortical plasticity that correlates with recovery of function after brain injury. Proc Natl Acad Sci U S A. 2006;103:11370–11375. doi: 10.1073/pnas.0601065103. [DOI] [PMC free article] [PubMed] [Google Scholar]
- Rathelot JA, Strick PL. Subdivisions of primary motor cortex based on cortico-motoneuronal cells. Proc Natl Acad Sci U S A. 2009;106:918–923. doi: 10.1073/pnas.0808362106. [DOI] [PMC free article] [PubMed] [Google Scholar]
- Rizzolatti G, Gentilucci M, Camarda R, Gallese V, Luppino G, Matelli M, Fogassi L. Functional organization of inferior area 6 in the macaque monkey. II. Area F5 and the control of distal movements. Exp Brain Res. 1988;71:491–507. doi: 10.1007/BF00248742. [DOI] [PubMed] [Google Scholar]
- Rouiller EM, Moret V, Liang F. Comparison of the connectional properties of the two forelimb areas of the rat sensorimotor cortex: support for the presence of a premotor or supplementary motor cortical area. Somatosens Mot Res. 1993;10:269–289. doi: 10.3109/08990229309028837. [DOI] [PubMed] [Google Scholar]
- Sacrey LA, Alaverdashvili M, Whishaw IQ. Similar hand shaping in reaching-for-food (skilled reaching) in rats and humans provides evidence of homology in release, collection, and manipulation movements. Behav Brain Res. 2009;204:153–161. doi: 10.1016/j.bbr.2009.05.035. [DOI] [PubMed] [Google Scholar]
- Schieber MH. Constraints on somatotopic organization in the primary motor cortex. J Neurophysiol. 2001;86:2125–2143. doi: 10.1152/jn.2001.86.5.2125. [DOI] [PubMed] [Google Scholar]
- Schneider D, Schneider L, Claussen CF, Kolchev C. Cortical representation of the vestibular system as evidenced by brain electrical activity mapping of vestibular late evoked potentials. Ear Nose Throat J. 2001;80:251–252. 255–258, 260. [PubMed] [Google Scholar]
- Schwarz C, Hentschke H, Butovas S, Haiss F, Stüttgen MC, Gerdjikov TV, Bergner CG, Waiblinger C. The head-fixed behaving rat–procedures and pitfalls. Somatosens Mot Res. 2010;27:131–148. doi: 10.3109/08990220.2010.513111. [DOI] [PMC free article] [PubMed] [Google Scholar]
- Stepniewska I, Fang PC, Kaas JH. Microstimulation reveals specialized subregions for different complex movements in posterior parietal cortex of prosimian galagos. Proc Natl Acad Sci U S A. 2005;102:4878–4883. doi: 10.1073/pnas.0501048102. [DOI] [PMC free article] [PubMed] [Google Scholar]
- Stepniewska I, Fang PC, Kaas JH. Organization of the posterior parietal cortex in galagos: I. Functional zones identified by microstimulation. J Comp Neurol. 2009;517:765–782. doi: 10.1002/cne.22181. [DOI] [PMC free article] [PubMed] [Google Scholar]
- Stepniewska I, Friedman RM, Gharbawie OA, Cerkevich CM, Roe AW, Kaas JH. Optical imaging in galagos reveals parietal-frontal circuits underlying motor behavior. Proc Natl Acad Sci U S A. 2011;108:725–732. doi: 10.1073/pnas.1109925108. [DOI] [PMC free article] [PubMed] [Google Scholar]
- Viaro R, Morari M, Franchi G. Progressive motor cortex functional reorganization following 6-hydroxydopamine lesioning in rats. J Neurosci. 2011;31:4544–4554. doi: 10.1523/JNEUROSCI.5394-10.2011. [DOI] [PMC free article] [PubMed] [Google Scholar]
- Wang L, Conner JM, Rickert J, Tuszynski MH. Structural plasticity within highly specific neuronal populations identifies a unique parcellation of motor learning in the adult brain. Proc Natl Acad Sci U S A. 2011;108:2545–2550. doi: 10.1073/pnas.1014335108. [DOI] [PMC free article] [PubMed] [Google Scholar]
- Whishaw IQ, Coles BL. Varieties of paw and digit movement during spontaneous food handling in rats: postures, bimanual coordination, preferences, and the effect of forelimb cortex lesions. Behav Brain Res. 1996;77:135–148. doi: 10.1016/0166-4328(95)00209-x. [DOI] [PubMed] [Google Scholar]
- Whishaw IQ, Whishaw P, Gorny B. The structure of skilled forelimb reaching in the rat: a movement rating scale. J Vis Exp. 2008;18:816. doi: 10.3791/816. [DOI] [PMC free article] [PubMed] [Google Scholar]