

Abstract
In their natural environment, animals face complex and highly dynamic olfactory input. Thus vertebrates as well as invertebrates require fast and reliable processing of olfactory information. Parallel processing has been shown to improve processing speed and power in other sensory systems and is characterized by extraction of different stimulus parameters along parallel sensory information streams. Honeybees possess an elaborate olfactory system with unique neuronal architecture: a dual olfactory pathway comprising a medial projection-neuron (PN) antennal lobe (AL) protocerebral output tract (m-APT) and a lateral PN AL output tract (l-APT) connecting the olfactory lobes with higher-order brain centers. We asked whether this neuronal architecture serves parallel processing and employed a novel technique for simultaneous multiunit recordings from both tracts. The results revealed response profiles from a high number of PNs of both tracts to floral, pheromonal, and biologically relevant odor mixtures tested over multiple trials. PNs from both tracts responded to all tested odors, but with different characteristics indicating parallel processing of similar odors. Both PN tracts were activated by widely overlapping response profiles, which is a requirement for parallel processing. The l-APT PNs had broad response profiles suggesting generalized coding properties, whereas the responses of m-APT PNs were comparatively weaker and less frequent, indicating higher odor specificity. Comparison of response latencies within and across tracts revealed odor-dependent latencies. We suggest that parallel processing via the honeybee dual olfactory pathway provides enhanced odor processing capabilities serving sophisticated odor perception and olfactory demands associated with a complex olfactory world of this social insect.
Introduction
Olfaction is of paramount importance for most animal species. Insects evolved sophisticated olfactory systems for communication, orientation, nest-mate recognition, and predator avoidance (Hansson and Stensmyr, 2011; Martin et al., 2011). For olfactory processing, nervous systems are confronted with an enormous chemical coding space (Guerrieri et al., 2005; Schmuker and Schneider, 2007), but also face the need to process dynamic sensory input fast and efficiently (Geffen et al., 2009; Nawrot, 2012). Sensory processing along parallel pathways supports this task (Nassi and Callaway, 2009). Compared with knowledge on parallel processing in other sensory modalities (auditory, visual, somatosensory), parallel processing in olfactory systems is far from being understood (Galizia and Rössler, 2010).
In insects, olfactory receptor neuron (ORN) axons transfer input from antennal sensilla to glomeruli, spheroidal neuropil units in the antennal lobe (AL), the analog to the vertebrate olfactory bulb (OB) (Hildebrand and Shepherd, 1997; Kay and Stopfer, 2006). After AL processing (Martin et al., 2011; Wilson, 2011), odor information is transferred via projection (output) neurons (PNs) as spatiotemporal response patterns (Sachse and Galizia, 2002; Wilson and Laurent, 2005; Krofczik et al., 2008; Arenas et al., 2009) to higher brain centers in the mushroom bodies (MBs) and lateral horn (LH) (Mobbs, 1982). Hymenoptera (ants, bees, wasps) possess a unique dual olfactory pathway (Abel et al., 2001; Kirschner et al., 2006; Zube et al., 2008; Galizia and Rössler, 2010; Rössler and Zube, 2011; Nishikawa et al., 2012) with a medial AL protocerebral tract (m-APT) and a lateral AL protocerebral tract (l-APT). Both tracts comprise axons from ∼920 uniglomerular PNs (∼410 m-APT PNs and ∼510 l-APT PNs) (Rybak, 2012). M-APT PNs connect glomeruli in the lower AL hemilobe with the MB and the LH, whereas l-APT PNs connect glomeruli in the upper AL hemilobe in reverse order with the LH and MB.
This dual pathway represents a favorable system to address fundamental questions in parallel olfactory processing. It is still unclear whether the tracts code odors in a “dual segregated” fashion (different odors in different tracts), like pheromonal and general-odor subsystems in moths (Martin et al., 2011) or flies (Schlief and Wilson, 2007), or in a “dual parallel” fashion (similar input, differential feature extraction) (Galizia and Rössler, 2010). Recent calcium-imaging studies support the idea that the two AL subsystems receive similar sensory input (Carcaud et al., 2012; Galizia et al., 2012). Independent (sequential) recordings in different individuals (electrophysiology, calcium imaging) indicate that m-APT and l-APT PNs may differ in physiological properties (Abel et al., 2001; Müller et al., 2002; Krofczik et al., 2008; Yamagata et al., 2009). However, simultaneous PN recordings from both tracts with high temporal precision are still lacking.
We used thin-wire multielectrodes for simultaneous double-tract recordings to obtain response profiles from many uniglomerular PNs over multiple trials to floral, pheromonal, and social odors. The results show highly overlapping odor specificity, but distinct differences in response properties between m-APT and l-APT PNs, which strongly supports parallel odor processing. Consistent odor-dependent response latencies of PNs within and across tracts support the idea of temporal coding of odor identity via PNs of both tracts.
Materials and Methods
Experimental animals and preparation.
Foragers of the European honeybee Apis mellifera (females) were caught in the morning from a feeder filled with saccharose solution (Apiinvert, 50%) and anesthetized on ice. The legs were cut above the coxae. Bees were fixed in custom-made Plexiglas holders using dental wax (surgident periphery wax, Heraeus Kulzer) and fed with saccharose solution ad libitum.
Antennae were gently fixed at the pedicellus with dental wax. We dissected the brain by cutting open the head capsule between the compound eyes, the ocelli, and the antennal sockets. To diminish movements, mandible-muscle apodemes were severed, and the ventrodorsal abdomen and wings were gently coated with liquid dental wax. Glands and trachea were moved aside, and the neurolemma was removed at the insertion site before electrode placement. Two Ag-wires (150 μm diameter, AGT05100, WPI) served as reference electrode and for M17 proboscis muscle recordings, which is involved in proboscis extension (Rehder, 1987). We inserted the M17 recording electrode between the central ocellus and the compound eye. The reference electrode was introduced in the ipsilateral complex eye. For the AL output tract recordings, electrodes were inserted from anterior, dorsally to the AL, using prominent landmarks. We placed the m-APT electrode between the AL and the medial lobe of the MB using the vertical MB lobe, pharynx, and the AL as landmarks (Fig. 1). We inserted the l-APT recording electrode into the lateral-caudal protocerebrum between the AL and LH, at the position where the l-APT exits the AL (Fig. 1; also Kirschner et al., 2006, Fig. 1, locations 3, 4). Following electrode placement, the brain was either covered with two-component low-viscosity silicone (Kwik-Sil, WPI) or left untreated.
Figure 1.

Simultaneous dual-tract olfactory PN recordings using thin-wire electrodes. A, Schematic overview of the recording position in uniglomerular PN pathways of the honeybee. The AL is innervated by axonal olfactory receptor neuron tracts (T1–T4) that segregate in glomeruli of the dorsal (magenta) and ventral (green) AL hemilobes. After preprocessing in the AL, two protocerebral tracts (the m-APT and l-APT), connect glomeruli in the two hemilobes of the AL with the mushroom bodies (MB) and lateral horn (LH) in opposite order. Wire electrodes (each shaft comprising 3 copper wires, each 15 μm in diameter; see B, inset, arrows) were used to record PNs from the m-APT and l-APT. B, Staining of electrode insertion sites (green) and anterograde staining of the l-APT and m-APT (magenta). C, Reconstructions of electrode positions (either by fluorescent staining or identification of electrode tracks in the tissue) and APTs proved that on the m-APT side, the electrode was close to the m-APT, above the branching point of the mediolateral APT (ml-APT). On the l-APT side, the electrode was positioned in the lateral-caudal protocerebrum between vertical lobe and the AL (Kirschner et al., 2006, Fig. 1, positions 3 and 4). m, medial; l, lateral; c, caudal; r, rostral. Scale bars: B, C, 100 μm; B, inset, 25 μm.
Odor stimulation.
Odors were delivered by an olfactometer providing a laminar airstream using a 1 cm outer diameter glass tube placed 1 cm in front of the bee's antennae. The olfactometer was supplied by two independent analog flow controllers (2–65-B and P-067, Brooks Instruments) that delivered moist air through a charcoal filter (AK 02/05, UltraFilter; 0.5 l/min air flow each). We applied a constant air stream to adapt tactile sensillae. Odor delivery into this constant air stream was controlled by a solenoid valve (LFAA1201618H, Lee) and bypassed through 10 ml glass vials (CZT) that contained the test odors, dissolved either in 100 μl of paraffin oil (Sigma-Aldrich), in pure water, or presented as solid objects.
For the first group of bees, we used 12 different odors, including five pheromones plus control (pure solvent) (Table 1). As general odors, we used limonene, hexanal, 1-pentanol, 1-octanol, 2-octanone, and two floral bouquets, clove oil and orange oil, as well as citral and geranylic acid as pheromones from the Nassanoff gland (Shearer and Boch, 1966; Pickett et al., 1980), isoamylacetat (IAA) and 1-hexanol as alarm pheromone components of the Koschevnikov gland (Boch et al., 1962; Collins and Blum, 1983), and 2-heptanone as an alarm pheromone from the mandibular glands (Shearer and Boch, 1965) (all purchased from Sigma-Aldrich). For a recent review on pheromones, see Sandoz et al. (2007). For the second group of bees, we used five odors from the bees' natural environment for stimulation: 200 mg of cleaned beeswax, 200 mg of used and mixed beeswax from several hives, 200 mg of abandoned brood combs, 200 mg of honey diluted in 2 ml of water, and 3 freshly killed bees. To provide temperature conditions that match conditions in the hive, we stimulated at 32–33°C (Seeley, 1985; Tautz et al., 2003) by placing glass vials in a copper mesh, which we heated by a Peltier element (Conrad Electronics). We delivered all odors at a concentration of 1:100 and for 500 ms. For the first group of bees, odors were delivered in three pulses of 500 ms each with 500 ms intervals, repeated for 20 trials with 20 s interval. For the second group of bees, odors were delivered as a single pulse repeated for 10 trials with 20 s interval.
Table 1.
Tested odors with their specifications group in respect to the tested bee groups
| Bee group | Odor | Abbreviation | Concentration | Floral | Pheromonal | Natural mix | Chemical abstracts service (CAS) number | PubChem compound identification (CID) number |
|---|---|---|---|---|---|---|---|---|
| 1 | Control air | ctr-Air | 1 | |||||
| 1 | Control oil | ctr-Oil | 1 | 8012-95-1 | ||||
| 1 | Citral | 1:100 | x | x | 5392-40-5 | 638011 | ||
| 1 | Hexanal | 1:100 | x | 66-25-1 | 6184 | |||
| 1 | Geranylic acid | ger-acid | 1:100 | x | x | 459-80-3 | 9989 | |
| 1 | Isoamylacetate | IAA | 1:100 | x | x | 123-92-2 | 31276 | |
| 1 | (+) Limonene | lim | 1:100 | x | 5989-27-5 | 440917 | ||
| 1 | Clove oil | 1:100 | x | x | 8000-34-8 | 12658395 | ||
| 1 | Orange oil | 1:100 | x | x | 8008-57-9 | |||
| 1 | 1-Pentanol | 1-pent-ol | 1:100 | x | 71-41-0 | 6276 | ||
| 1 | 1-Hexanol | 1-hex-ol | 1:100 | x | 111-27-3 | 8103 | ||
| 1 | 1-Octanol | 1-oct-ol | 1:100 | x | 111-87-5 | 957 | ||
| 1 | 2-Heptanone | 2-hept-ne | 1:100 | x | 110-43-0 | 8051 | ||
| 1 | 2-Octanone | 2-oct-ne | 1:100 | x | 111-13-7 | 8093 | ||
| 2 | Control H2O | 1 | ||||||
| 2 | Control air | ctr-Air | 1 | |||||
| 2 | Clean beeswax | wax clean | 200 mg | x | 8012-89-3 | |||
| 2 | Beeswax mix | wax mix | 200 mg | x | ||||
| 2 | Brood combs | 200 mg | x | |||||
| 2 | Honey in water | 1:100 | x | |||||
| 2 | Freshly killed bees | 3 Bees | x |
The odor abbreviations and their assignment into floral, pheromonal, or naturally occurring odors are shown for two groups of bees, together with available CAS and CID numbers [bee group 1: n = 14; l-APT, 59 PNs; m-APT 63 PNs; bee group 2: n = 4 (n = 3 for freshly killed bees); l-APT, 9 (6) PNs; m-APT 9 (7) PNs].
Electrophysiology and recording setup
Multiunit recordings.
We placed the Plexiglas holder with a mounted bee inside a small copper cube (12 × 12 × 12 cm copper-plate cube) situated within a custom-made Faraday cage on an air-cushioned laboratory table (Spindler & Hoyer). Air exhaust was provided by the building's ventilation system. We adapted electrode fabrication from Okada et al. (1999, 2007) and Strube-Bloss et al. (2011). Each electrode shank consisted of three copper wires (polyurethane-coated copper wire with 15 μm diameter; Elektrisola) glued together with melted dental wax (diameter, <50 μm; Fig. 2B, inset). For double recordings, both electrodes were connected to a switchable headstage (SH16, Tucker-Davis Technologies) and fixed on micromanipulators (Leitz). The Ag-wires (diameter, 150 μm; AGT05100, WPI) were connected to the headstage and served as reference and M17 recording electrode. The headstage output was fed into a custom-designed connection module (INT-03M, NPI). The headstage input module was connected to a custom-made amplifier system consisting of 16 custom-designed low noise differential amplifier modules (DPA-2FL, NPI). We differentially amplified 5000× and bandpass filtered (300–8000 Hz) recordings from all channels to the reference electrode. The recorded and amplified signals were conveyed to synchronous data acquisition cards (NI 6123, NI 6143, National Instruments) with a sampling rate of 31,250 Hz and 16-bit resolution for each channel. We stored data via a self-written data-acquisition software (LabVIEW v6.8, National Instruments). The software enabled monitoring of each channel with amplification, offset settings, single-channel magnification view, and online power-spectrum analysis. Furthermore, it allowed an electrode-wise, user-defined online cross differentiation of each recording channel. Software-based online cross differentiation enabled focal recording of the extracellular area between the electrode tips and thus elimination of noise and interference from muscle potentials or unrelated neuronal activity (comparable to the analog differentiation of the recorded channels from Strube-Bloss et al., 2011; Fig. 1B). Since recording with two electrode shafts could produce shaft-specific bias, we recorded both tracts alternated with one or the other shaft, and observed no bias of any of the electrode shafts in pretests.
Figure 2.

Spike-sorting of extracellular multielectrode recordings. A, Three-pulse odor stimulation (illustrated as 3 squares, Stim) with honey in water (1:100) at 32–33°C elicit neuronal responses recorded from the l-APT and m-APT with three wire electrodes in each case, two of them shown as differential (pairwise subtracted) channels as the uppermost or lowermost two traces, respectively. Odor-elicited responses are shown for the second (left) and ninth trial (right) of a 20-trial recording as mean spike frequency for each tract (MF respectively for each tract; time constant, 301 ms). B, High magnification of spike shapes of four sorted units color coded below one of the data channels. Thresholds for template-matched spike sorting are illustrated as dotted lines: mean ± 3-fold SD of recordings during spontaneous activity (template-matched spike-sorting; window width, 1–1.4 ms). C, The sorted units depicted as overlay show differing spike shapes that cluster distinctly after principal component analysis (shown in D). D, The clustered units are surrounded by 3.5 times the Mahalanobis distance (a multidimensional version of SD) and demonstrate almost no overlay. E, Interspike interval histogram for each sorted unit reveals different spike time regimes.
Electroantennogram recordings and analyses.
For electroantennogram (EAG) measurements, we recorded the ipsilateral antenna differentially at the tip with low-resistance (<0.5 MΩ) borosilicate electrodes (1B100F-3, WPI) pulled with a horizontal filament puller (DMZ Universal Puller) and filled with 0.5 m KCl solution. A tungsten electrode was inserted as reference below the scapus of the ipsilateral antenna. We 10× amplified signals using an intracellular amplifier (Model 1600, A-M Systems) and fed the signal in the amplifier setup to be further amplified (100×) and bandpass filtered (0.1–100 Hz). EAG signals were acquired with the same recording setup as mentioned above. As tracts were recorded, activity of the proboscis extension muscle M17 was monitored to check the reliability of odor delivery and possible influences of muscle potentials to the tract recordings (100× amplification; 1–100 Hz bandpass filtered). Recording duration of each stimulation trial was 7 s, with 2 s prestimulus and 2 or 4.5 s poststimulus onset. Data were imported in Spike2 software (v7.04, Cambridge Electronic Design) for offline spike sorting and cluster cutting. We measured the onset of odor response in the ORNs by EAG recordings in five bees, similar to a recent study (Meyer and Galizia, 2012). EAGs were captured with the complete odor panel (Table 1), filtered offline with the smooth algorithm in Spike2 (time constant, 32 μs) and averaged over six trials. Onset of odor response was defined as the time point of the steepest negative slope of the potential drop.
Postrecording visualization of electrode and tract positions.
For visualization of electrode tracks in penetrated brain tissue, electrodes were dipped in fluorescent dye (Alexa 568 hydrazide; A-10437, Invitrogen) before the recordings. After successful experiments, brains were rinsed with fresh bee Ringer's solution (37 mm NaCl, 2.7 mm KCl, 8 mm Na2HPO4, 1.4 mm KH2PO4, pH 7.2), glands and trachea were removed, and crystals of MicroRuby (tetramethylrhodamin dextran, Invitrogen) were inserted in the recorded AL to trace the m-APT and l-APT (Zube et al., 2008; Rössler and Zube, 2011). After 30–45 min, brains were dissected and immediately rinsed in 4% formaldehyde in 0.1 m PBS overnight at 4°C. Following two rinses in 0.1 m PBS for 10 min, the brains were washed (3×, 20 min each step) in 0.1 m PBS with 0.2% Triton X-100 (1:250), and incubated thereafter in 0.5% Lucifer yellow in 0.1 m PBS overnight at 4°C. After washing three times (10 min each) in 0.1 m PBS, brains were dehydrated in an ascending alcohol series (30%, 50%, 70%, 90%, 95%, and 3× 100% ethanol) and finally transferred in methylsalicylate (Sigma-Aldrich). We viewed brains as whole-mount preparations with a confocal laser scanning microscope (TCS SP2 AOBS, Leica). For image acquisition, an Harmonic Compound Plan Apochromat (10 × 0.4 NA immersion) objective was used, and optical sections were taken every 2–5 μm. Finally, we 3D-reconstructed brain neuropils and electrodes (Amira 5.2.0, Mercury Computer Systems; Fig. 1C).
Offline spike sorting.
Multielectrode recordings allow simultaneous acquisition of multiple neurons at high temporal resolution (Gray et al., 1995). The method benefits from recording neuronal activity with more than one electrode to improve spike sorting (Lewicki, 1998; Gold et al., 2006). Spike sorting is often subject to potential misclassification (Harris et al., 2000; Joshua et al., 2007; Quiroga, 2012). Therefore, we took special care in this task. For spike sorting, we used a well established commercial software (Spike 2, v7.4, Cambridge Electronic Design) that has been used successfully in several other studies (Brierley et al., 2003; Hoare et al., 2008; Strube-Bloss et al., 2011, 2012; Payton et al., 2012). We preprocessed each channel using the implemented “smooth” algorithm, which finite impulse response filters the input with a time constant of 80 μs (comparable to a low-pass filter of 6250 Hz) and “DC-remove” with a time constant of 3.2 ms leading to offset adjustment (comparable to a high-pass filter of 312.5 Hz). For spike sorting, we used either two or three recorded channels. If neuronal signals on all three recorded channels demonstrated adequate signals with good signal-to-noise ratios (SNRs), we copied one channel and all conjoined channels were analyzed as a tetrode. If only two channels with good SNRs were available, we analyzed these as stereotrodes. For semiautomated template-matched spike sorting, we set the amplitude threshold to ±3 SDs of the mean signal amplitude of the recording over at least 1 min spontaneous neuronal activity recorded previous to the test trials (Fig. 2B). For semiautomated template formation, we set the time window to −0.4 ms before and 1 ms after either positive or negative peak amplitude. After template formation, we clustered and sorted units by applying the Spike2 built-in clustering dialogues. First principal component analyses with components based on waveforms separated the units (Fig. 2C). Additional features extracted, such as slope of spikes, amplitude, and peak area, helped to further classify the data. After cluster analysis, we analyzed interval histograms of each single unit and compared them (Fig. 2C,D) to prevent hum interferences or false-positive sorting. Successful dual-tract recordings are characterized by good SNRs and acceptable spike sorting (Fig. 2).
We excluded units that did not respond to any of the tested odors or that showed technically induced (e.g., influence from power supply, artifacts coming from solenoid valves) response characteristics (45 l-APT and 29 m-APT units). In the following, we use the term PN for classified unit activity. We are well aware that units may not necessarily equate to a single neuron in all cases.
Data analyses.
As a first quality control, we performed analyses of single PNs with Spike2 (v7.4, Cambridge Electronic Design). We automated final analyses of the complete population in Matlab (v2009b, The MathWorks), including different functions from the FIND toolbox Version 1.1 (Meier et al., 2008).
Identification of odor-response profiles in PNs.
Each PN was classified in a fully automated fashion as being responsive or nonresponsive to each test odor. Briefly, we tested over repeated odor stimulations whether the mean firing rate was different between prestimulus and peristimulus intervals. In a pretest, we identified responses from mean trials to a given odor. If a response was indicated here, the procedure was repeated on single trial level to verify the odor response. If at least half of all single trials showed stimulus-correlated modulation, the PN was classified as responsive to the given stimulus. Trials without any response were excluded from further analysis.
In detail, we proceeded in the following way:
To detect responses from mean trials, we resampled to bins of 1 ms, averaged, and generated a representative, natural spike train of a single PN in response to one odor.
To estimate the rate function of this representative trial, we convoluted with a symmetric smoothing filter (Savitzky and Golay, 1964, polynomial order 0, 300 ms width).
Baseline firing rate was estimated over an interval of 600 ms before stimulus onset.
Responses were screened within a time window between 0 and 600 ms poststimulus onset.
Neuronal activity was defined as a response if it was different ±2 SDs from baseline over at least 50 ms duration. Positive deviations above threshold correspond to excitations. Negative deviations correspond to inhibitions. If a response was indicated in the averaged trial, we repeated the same procedure, but this time on the basis of genuine single-trial spike trains. During experiments, we experienced some PNs that responded to a single odor in some, but not all, trials. To take all response characteristics of PNs into account, we determined a response threshold as follows: if a response occurred in at least half of all single trials, we accepted the odor as a potent stimulus for this PN. For all odors tested, average responses to 14.1 ± 2.5 trials of the l-APT and 13.5 ± 3.1 trials of the m-APT out of 20 stimulus repetitions were beyond a 50% threshold. All data were additionally calculated with 25 and 75% threshold criteria, which did not qualitatively change the results regarding latency, lifetime sparseness (LS), and recruitment rates.
Estimation of latencies and rate functions.
Analyses of latencies and rates were restricted to PNs that were excited by odor stimulation. Latency and rate changes evoked by different stimuli may be described on different levels:
On the level of a single PN responding to a given stimulus (PN latency/rate) in repeated trials
On the level of an odor to which a group of neurons each responds with their individual latency (odor latency/rate)
On the level of each tract where different odors elicited activity in a population of PNs (tract latency/rate)
We estimated rates and latencies throughout each level with the same method based on the derivative of the trial-aligned firing rate (Meier et al., 2008). This method has been repeatedly used in related studies (Krofczik et al., 2008; Meyer and Galizia, 2012). It processes data in three successive steps:
It estimates the derivative of input spike trains by convolution with an asymmetric Savitzky–Golay filter (polynomial order 1, width 300 ms; Welch windowed).
It aligns spike trains by maximizing the average pairwise cross correlation (Nawrot et al., 2003). The estimated time-shifts correspond to each trial's relative latency. Their SD σ gives a measure for the across-trial latency variability.
It estimates the absolute latency of the input data by merging aligned spike trains and again convolving with the same asymmetric Savitzky–Golay filter. We defined latency as that point in time where the slope of the firing rate was steepest, which is the first derivative's maximum. To estimate the average rate function of the input data, the merged spike train is normalized by the number of contributing trials and convolved by a symmetric smoothing filter (see Response detection).
For a simplified description of rate changes, we calculated three descriptive values: baseline firing rate, maximum rate increase, and average evoked rate, being the averaged spike rate during the stimulation period. Baseline firing rate was defined as the mean rate within 500 ms before stimulus onset. Maximum rate is the peak rate from which baseline is subtracted. Finally, evoked rate was defined as the mean rate within a response window from 0 to 600 ms poststimulus onset from which baseline was subtracted.
We applied this method sequentially to each of the levels defined above.
On the PN level, single-trial spike trains of a given PN responding to a single odor were aligned and merged. Based on the merged spike train, we estimated the PN′s rate function and its (absolute) latency. These measures describe a PN′s response to one single type of stimulus. The SD across time shifts as produced by the alignment procedure describes the variation between single trials, which is the relative PN latency.
On the odor level, we aligned averaged spike trains from different PNs assessed at the PN level analysis. By aligning and merging these average trials from PNs that responded to a given odor, we could estimate an odor-specific rate function and absolute latency. Here, the SD across time shifts, measured in the alignment procedure, describes the variation between single PNs responsive to the same odor, which is relative odor latency.
On the tract level, latency and rate illustrate the representative activity across different odors elicited in a population of PNs belonging to the same tract. To estimate tract rate and absolute latency, we aligned and merged the averaged odor spike trains assessed in the odor-level analysis. Thus, time shifts derived from the alignment procedure correspond to differences between odor stimulations within a PN population in one tract. Their SD is a measure for the relative tract latency.
Tuning measures.
Tuning measurements were performed according to recent publications (Krofczik et al., 2008; Strube-Bloss et al., 2011; Nawrot, 2012). For each single unit, we computed the lifetime sparseness (LS) as follows:
 |
where N = 12 denotes the number of tested odors and rj is the PN′s response rate to stimulus j computed as the trial-averaged mean firing rate within the response interval (100 ms, 600 ms) after stimulus onset, minus the trial-averaged mean baseline rate within the 500 ms interval before stimulus onset. Sparsely responding PNs show clear responses only for a small subset of all stimuli, while the majority of the stimuli evoke no or only very weak responses (Vinje and Gallant, 2000; Willmore and Tolhurst, 2001). LS has been repeatedly used to quantify the response sparseness of neurons in the insect olfactory pathway (Perez-Orive et al., 2002; Wilson et al., 2004; Strube-Bloss et al., 2011).
To evaluate tuning strength of single PNs according to their latency, we computed the signal-to-noise ratio (SNR) (Mehring et al., 2003) as follows: SNR = σsignal2/σnoise2 on the level of evaluated latencies (see above). σsignal2 denotes the variance of the trial-averaged latency deviation, calculated across each of the individual stimuli. σnoise2 denotes the variance across all single trial latencies, after subtraction of the stimulus-specific latency and thus quantifies the trial-by-trial variability of the PN′s response latency. This constitutes the noise. We then computed the SNRempiric by dividing σsignal2/σnoise2. For further details see Strube-Bloss et al. (2011).
Statistical analyses.
Data underwent statistical analyses (Statistica v10, StatSoft) first by testing for normal distribution. In case of normal distribution we used parametric t test to compare two independent groups (l-APT and m-APT PN responses). In cases where data were not normally distributed, nonparametric tests were used (Wilcoxon rank-sum tests). For comparison of PNs within the same tract, response changes to different odors were again tested for normal distribution. In case of normal distribution, single-factor ANOVA was used and nonparametric Wilcoxon ANOVA for not normally distributed data. For comparison of binary values across tracts, χ2 test was used. In cases of comparison of several independent binary values (recruitment rates to different odors within tracts) a nonparametric ANOVA based on binary data was used (Cochran's Q test). For correlations we used the Kendall rank correlation coefficient.
Results
We obtained simultaneous multiunit recordings from the m-APT and l-APT in a total of 14 bees and acquired a large dataset of PNs (63 m-APT PNs, 59 l-APT PNs, 260 odor trials per PN) in response to floral and pheromonal odor stimulations with 20 trials per stimulus. Recordings from four bees (9 m-APT PNs, 9 l-APT PNs, 70 odor trials per PN) were analyzed for their responses to social odors over 10 trials. The first group of odors and the associated responses were selected to facilitate comparison with results from earlier intracellular recordings (Sun et al., 1993; Abel et al., 2001; Müller et al., 2002; Krofczik et al., 2008) and calcium-imaging studies (Joerges et al., 1997; Sachse et al., 1999; Sandoz et al., 2003; Guerrieri et al., 2005; Szyszka et al., 2008; Deisig et al., 2010; Galizia et al., 2012). The second group of odors originates from the bees' hive environment. These biologically relevant odors were chosen to analyze whether a wide range of odor categories are represented along both tracts or whether APTs are odor-specific with respect to the possible value of an odor.
Postrecording verification of electrode and tract positions
We tracked the electrode depth using the micromanipulator positions (m-APT, 177 ± 25 μm; l-APT, 306 ± 19 μm). Recorded depths were in accordance with the relative location of the APTs caudal to the AL (Brandt et al., 2005; Kirschner et al., 2006). Additionally, we established a novel double-labeling technique to verify the electrodes' recording positions in relation to the m-APT and l-APT after successful dual-tract recordings (Fig. 1B). The fluorescent dye, applied to the electrodes, penetrated the surrounding tissue, and the APTs were anterogradely labeled with another dye after successful recordings. Double staining was confirmed in whole-mount preparations using confocal image stacks and 3D Amira reconstructions (n = 9; Fig. 1C).
Odor-response profiles of individual PNs
First, we analyzed odor-response profiles (tuning curves) of individual APT PNs. Visual inspection of PNs' activity already indicated that within one bee, a single l-APT PN (Fig. 3A, raster plot) is responsive to a wide range of the tested odors, whereas a simultaneously recorded single m-APT PN was activated by comparatively few odors (Fig. 3A). We quantified PN response profiles by calculating the odor-evoked spike rate (average PN spike rate during odor stimulation above background) in response to 12 different floral and pheromonal odors (Table 1, Fig. 3B). Four representative examples of single PNs from each tract confirm the finding of the raster plot that l-APT PNs respond broadly to many odors and m-APT PNs are activated by fewer odors (Fig. 3B). We computed the LS for each single PN based on its response profile. This measure is designed to quantify stimulus specificity of individual neurons (Willmore and Tolhurst, 2001; see Materials and Methods) and enables comparison across different neuronal populations. This analysis, again, supports the idea that m-APT PNs have a higher odor-specificity compared with l-APT PNs (Fig. 3C) (l-APT, 0.42 ± 0.21; m-APT, 0.60 ± 0.24; t test, p < 0.001). Although individual m-APT PNs have comparably high odor specificity, m-APT PNs on the population level cover the whole odor spectrum, similar to the population of l-APT PNs (Fig. 3B).
Figure 3.

Odor-response profiles indicate higher odor-specificity for m-APT PNs compared with l-APT PNs. A, Raster plots of two simultaneously recorded PNs from the l-APT and m-APT of one bee stimulated with 12 different odors indicating higher odor-specificity in the m-APT PN compared with the l-APT PN, which responds to more odors. The first 5 of 20 trials are depicted together with odor name and its respective odor identification (ID) number. Stimulus duration of 500 ms is indicated as gray box. B, Odor-response profiles of four representative PNs from the l-APT (green) and m-APT (purple). The upper first row illustrates the response profiles of the l-APT and m-APT PN from the raster in A (bee #14). The second row depicts the response profile of l-APT and m-APT PNs simultaneously recorded in another bee (#8). Normalized evoked response strength is given as normalized spike rates during stimulus duration (500 ms) above background in response to 12 different odors (filled bars) and one control (empty bar). Single PN lifetime sparseness (LS) is shown in insets together with PN identity. Above-threshold firing-response levels are indicated by white dots for l-APT and black dots for m-APT. Odor ID numbers are indicated and correspond to the odors shown in A. C, LS data collected from all recorded PNs from the l-APT (green) and m-APT (purple) illustrated as box plot (left) and histogram (right). LS data of all PNs indicate that the m-APT PNs have significantly higher odor-specificity compared with l-APT PNs (l-APT, 0.42 ± 0.21; m-APT, 0.60 ± 0.24; t test, p < 0.001; box plot settings: line indicates median, box indicates first and third quartiles, whisker indicates 10th and 90th quartiles).
Odor-specific PN recruitment
Odor-specificity of m-APT PNs was significantly higher than that of l-APT PNs. This suggests that a given odor stimulus may activate more l-APT PNs than m-APT PNs. This expectation was confirmed qualitatively by raster plots from all recorded APT PNs of all tested bees stimulated with one odor (Fig. 4A), which illustrates higher numbers of activated l-APT PNs compared with less activated m-APT PNs. We counted all PNs excited by the tested odors and found a significantly higher proportion of activated l-APT PNs than m-APT PNs (l-APT, 51.0 ± 7.9%; m-APT, 34.0 ± 8.4%; χ2, p = 0.0011) (Fig. 4B, dashed lines). Such proportions of responsive versus nonresponsive PNs in the population of all PNs are well suited to maximize the local computation of odors in the AL, as was discussed previously (Nawrot, 2012). Odors that elicited responses in large numbers of l-APT PNs also activated larger numbers of m-APT PNs (Kendall's tau, 0.59; p = 0.007). In both tracts, 1-octanole and 2-octanone activated the highest number of PNs followed in decreasing order by 1-hexanol and 1-pentanol in the l-APT and by hexanal and 1-hexanol in the m-APT. Interestingly, within both tracts the odor-dependent recruitment rates were significantly different between odors (Cochran's Q test; l-APT, p < 0.040; m-APT, p < 0.007). These analyses match the findings of odor-specific activation of glomerular activation patterns as observed in calcium-imaging studies (Joerges et al., 1997; Sachse et al., 1999; Galizia and Menzel, 2001; Szyszka et al., 2005; Fernandez et al., 2009; Carcaud et al., 2012). On average, a single m-APT PN is activated by approximately one-third of the test odors. In contrast, a single l-APT PN on average responds to approximately half of the 12 test odors (l-APT, 6.4 ± 3.3; m-APT, 4.1 ± 2.8; t test, p < 0.001; Table 2, Fig. 4C).
Figure 4.
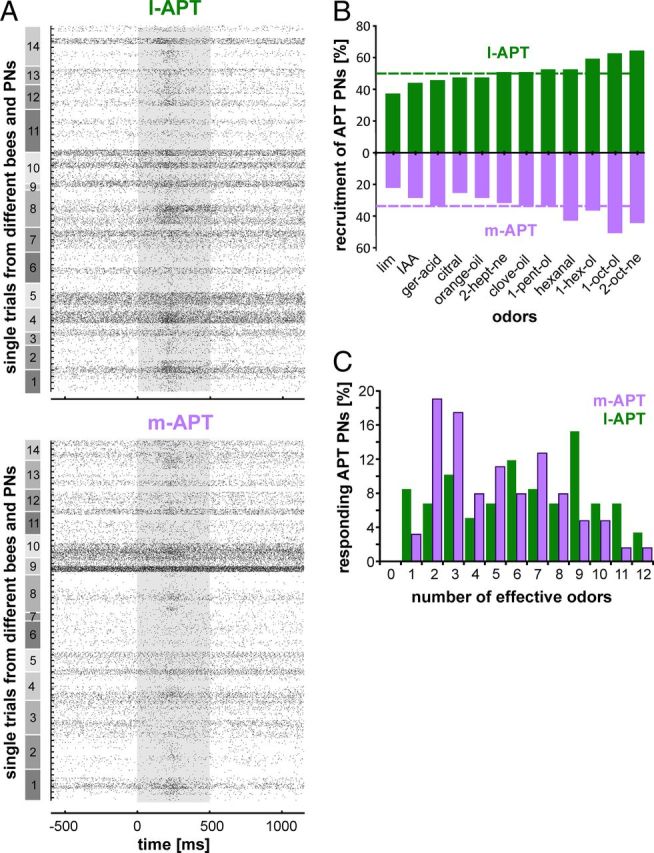
Odor-response spectra of l-APT and m-APT populations. A, Global firing pattern of all simultaneously recorded m-APT and l-APT PNs from 14 bees. All PN responses recorded from the l-APT and m-APT (59 PNs in l-APT; 63 PNs in m-APT), which were stimulated with a 500 ms pulse of 1-octanol (1:100 in paraffin oil; stimulus is indicated as gray box). The responses are sorted along both tracts by the same sequence of bees (numbers on gray boxes to the left) with the first 5 of 20 tested trials illustrated as raster plots. B, Recruitment rates (percentage of odor-activated PNs per odor) are depicted tract-wise (l-APT, green; m-APT, purple) in response to 12 odors. Profiles correlate significantly (Kendall's tau, 0.59; p = 0.007). Mean recruitment rates are indicated as dashed line. C, Higher odor-specificity in the m-APT is indicated by the proportion of effective odors per APT PN (12 odors tested; l-APT, green bars, 6.4 ± 3.3 odors per PN; m-APT, purple bars, 4.1 ± 2.8 odors; t test, p < 0.001).
Table 2.
Response latencies of single APT PNs
| Bee group | Odor | l-APT |
m-APT |
m − l | ||||
|---|---|---|---|---|---|---|---|---|
| n | Latency (ms) | SD (ms) | n | Latency (ms) | SD (ms) | |||
| 1 | All | 357 | 169.7 | 76.0 | 254 | 183.8 | 78.6 | 14.1 |
| 1 | Isoamylacetate | 25 | 157.1 | 59.4 | 17 | 133.2 | 66.8 | −23.9 |
| 1 | Citral | 27 | 212.6 | 124.5 | 16 | 191.9 | 109.3 | −20.7 |
| 1 | Orange oil | 28 | 153.0 | 59.6 | 18 | 141.4 | 56.5 | −11.6 |
| 1 | Clove oil | 30 | 201.2 | 89.5 | 21 | 194.3 | 75.0 | −6.9 |
| 1 | 1-Pentanol | 31 | 167.3 | 95.0 | 21 | 174.4 | 58.3 | 7.1 |
| 1 | 2-Heptanone | 30 | 164.9 | 66.2 | 20 | 173.6 | 79.1 | 8.7 |
| 1 | (+) Limonene | 20 | 192.9 | 60.4 | 13 | 205.2 | 107.2 | 12.3 |
| 1 | Geranylic acid | 26 | 191.7 | 66.7 | 21 | 211.4 | 82.2 | 19.7 |
| 1 | 1-Hexanol | 35 | 152.2 | 62.5 | 23 | 183.9 | 78.0 | 31.7 |
| 1 | Hexanal | 31 | 163.7 | 39.6 | 26 | 195.5 | 84.7 | 31.8 |
| 1 | 1-Octanol | 37 | 143.4 | 55.7 | 31 | 184.4 | 53.6 | 41.0 |
| 1 | 2-Octanone | 37 | 160.1 | 70.0 | 27 | 201.5 | 80.9 | 41.4 |
| 2 | All | 19 | 164.5 | 49.4 | 27 | 186.3 | 63.8 | 21.8 |
| 2 | Bees | 4 | 164.8 | 31.3 | 5 | 152.2 | 48.6 | −19.1 |
| 2 | Honey | 5 | 175.6 | 63.0 | 7 | 188.1 | 53.3 | 12.5 |
| 2 | Wax mix | 4 | 162.0 | 49.2 | 6 | 192.0 | 89.3 | 30.0 |
| 2 | Wax clean | 2 | 149.0 | 42.0 | 6 | 189.2 | 56.4 | 40.2 |
| 2 | Brood comb | 4 | 164.5 | 60.0 | 3 | 210.0 | 71.5 | 45.5 |
The response latencies of APT PNs are shown partitioned into tested bee groups. Response latencies with SD are plotted odor-wise for the number of responding PNs (n) and the latency differences of m-APT versus l-APT (m − l).
Comparison with previous studies
By counting the number of odors that activate PNs, our study conclusively confirms findings of previous studies, namely the higher odor-specificity of m-APT PNs compared with the odor-generalization properties in l-APT PNs. Previous studies are based on low numbers of sequentially, intracellularly recorded neurons. In the study of Müller et al. (2002), only 35% of m-APT PNs responded to 5–8 different odors used (13 of 37 m-APT PNs), whereas approximately 73% of l-APT PNs responded (11 of 15 l-APT PNs). In contrast, a more recent study of 23 m-APT PNs and 7 l-APT PNs stimulated with on average three different odors found similar activation rates in both the l-APT PNs (56% activated) and the m-APT PNs (65% activated; Krofczik et al., 2008).
Response latencies in individual PNs
It has been suggested recently that odors may be encoded by response latencies (in vertebrates: Junek et al., 2010; Smear et al., 2011; in insects: Müller et al., 2002; Krofczik et al., 2008; Kuebler et al., 2011). We address the question of whether latency may indicate odor identity. Previous findings in the honeybee indicate that single APT PNs vary in response latencies (Müller et al., 2002; Krofczik et al., 2008). We measured odor-response onsets in antennal ORNs by EAG recordings and found on average 99 ms delay between stimulus onset in the olfactometer (valve-switching) and onset of EAG responses. This setup-specific odor transmission delay was subtracted from all latency measurements in PN recordings. To exclude the possibility that vapor pressure or water solubility affects odor-response latencies, we correlated these parameters with the response onset of EAGs. No correlation was found for either vapor pressure (r2 = 0.095, p = 0.308) or water solubility (r2 = 0.085, p = 0.358) for the odors used. Within single APT PNs, we found different response latencies across different odor stimulations. Across different APT PNs within one tract, we also found different response latencies in response to the same odor (Fig. 5A). To be a reliable source of information, response latencies to different odors would need to exceed intertrial latency variations to the same odors. To quantify the reliability of a latency code, we calculated the latency-based SNR, with the additional requirement that SNR surpass unity (Fig. 5B, SNR). We found SNRs exceeding unity in one-fourth of the l-APT PNs (12 of 48 PNs) and in approximately one-third of all m-APT PNs (14 of 38 PNs; Fig. 5B). On average, the SNRs across the entire l-APT and m-APT PN populations neither differ between tracts (Wilcoxon rank-sum test, p = 0.28) nor do they exceed unity.
Figure 5.

Response latencies of single PNs differ for different odors, PNs, and tracts and support a latency code along the l-APT and m-APT. A, Response latency of five representative APT PNs from either the l-APT or m-APT are shown for different odors (PNs correspond to those shown in Fig. 3B plus an additional one). The first two PNs of the l-APT and m-APT pair are from the same bee (#14, #8). Note that individual PNs did not respond to all odors. B, Distribution of the SNR indicating the variation of latencies between odors relative to the variation across trials of identical stimuli. C, Box plots and histogram of tract-wise odor-dependent latencies show that l-APT PNs respond faster compared with m-APT PNs (l-APT, 169.7 ± 76.0 ms; m-APT, 183.8 ± 78.6 ms; t test, **p < 0.01; in B and C, box line, median; box, first to third quartiles; whisker, ±1.5× box ± box; outliers above whisker).
On the individual PN level, we asked whether the response latencies are odor-specific and found 8 out of 12 tested odors eliciting faster responses in l-APT PNs, whereas two pheromonal odors, IAA and 2-heptanone, and two natural odor bouquets elicited faster responses in the m-APT than in the l-APT (Table 2). Across all individual APT PN response latencies (Fig. 5C), we found a general latency difference between tracts: on average, l-APT PNs respond approximately 14 ms earlier compared with m-APT PNs (l-APT, 169.7 ± 76.0 ms; m-APT, 183.8 ± 78.6 ms; t test, p < 0.01; Table 2).
Population responses of l-APT and m-APT PNs
To address coding at the PN population level as has been done in calcium-imaging studies (e.g., Sachse and Galizia, 2002), we calculated rate functions: averaged firing rate profiles over time. Instead of looking at individual rate functions based on odor-evoked trial-averaged and aligned single PN responses as shown above, we averaged and aligned all odor-evoked PN responses and condensed them in odor-dependent rate functions (Figs. 6, 7) (method after Krofczik et al., 2008; Strube-Bloss et al., 2011; Meyer and Galizia, 2012; Nawrot, 2012). The alignment process revealed precisely time-matched rate functions, which benefits population latency measurements.
Figure 6.

PN population response characteristic of the m-APT and l-APT. A, Raster plots illustrate spike patterns of l-APT and m-APT PNs stimulated with a 500 ms odor pulse (gray box; 2-octanone; 1:100). The responses are aligned to their average peak-response for latency measurements and sorted in the same sequence for the different bees (numbers on the left side). The responses are averaged and shown tract-wise as spike-rate response profile (l-APT, green; m-APT, magenta). Response latency was adjusted to the ORN response determined by the odor onset in EAG measurements (lowest trace; EAG with SD is shown) averaged over six trials. The population response latency is indicated by vertical lines. The respective latency deviation is shown as light-colored boxes (l-APT, green; m-APT, magenta). Raster shows only the first 5 of 20 odor-stimulation trials. B, Population response profiles illustrated as rate functions over time calculated from the PNs (responses to 2-octanone shown in A) in response to 11 different odorants (Table 1). The respective latency deviations are shown as light-colored boxes. In most cases, response latency deviations in population responses are largely overlapping, supporting potential coincidence activation of postsynaptic neurons. C, Population response profiles of all l-APT and m-APT PNs averaged over all tested odors (Table 1), illustrated as rate functions over time. Over all tested odors, the l-APT responded faster and comparably stronger than the m-APT.
Figure 7.

APT PN responses to biologically relevant odor mixtures. A, As an example, raster plots illustrate spike patterns of beyond-threshold responses in APT PNs (l-APT, upper plot; m-APT, lower plot) from four bees (500 ms stimulus duration, gray bars; wax mix at 32–33°C; see Materials and Methods for details). Responses are aligned to the average peak-response and sorted for the different bees (gray boxes to the left; only the first 5 of 10 trials are shown). Bottom plot, Averaged spike frequency profiles of l-APT and m-APT PNs (l-APT, green; m-APT, purple) illustrate population response to the beeswax mixture. Population response latencies are calculated via the n-shift algorithm and indicated as latency deviation in light-colored boxes (l-APT, green; m-APT, purple). B, Population response profiles illustrated as rate functions over time (calculated as in A) to four natural odor mixtures (clean beeswax, freshly killed bees, brood combs, honey solved in water, and two controls: air and water) heated to 33°C to meet natural hive conditions. Strong phasic population responses in both APTs with almost similar odor onsets are visible. Notice only three bees were recorded in response to freshly killed bees.
Population rate codes
For each test odor, we averaged all odor responses separately for both tracts (Fig. 6). This analysis revealed phasic-tonic response characteristics in both the l-APT and m-APT PNs with mostly strong phasic responses to the odor onset and subsequent weak tonic firing patterns over the time of odor stimulation. Our results indicate that the l-APT tends to have slightly higher background activity [median, first and third quartile: l-APT, 7.5 Hz (2.8–20.4 Hz); m-APT, 6.4 Hz (1.8–16.2 Hz); Wilcoxon rank-sum test; Fig. 4A], which is comparable to previous intracellular recordings of PNs (12 Hz, Sun et al., 1993; 11 Hz in m-APT and 3.5 Hz in l-APT, Müller et al., 2002; 7–12 Hz in both tracts, Krofczik et al., 2008; with slightly higher rates in l-APT PNs, M. Nawrot, personal communication). Odor-evoked peak rate across all responsive l-APT PNs was on average 24.6 Hz, approximately one-third higher compared with the responsive m-APT PNs with 16.2 Hz [median: l-APT, 16.4 Hz (3.5–107.9 Hz); m-APT, 13.7 Hz (2.2–62.4 Hz); Wilcoxon rank-sum test, p < 0.001].
We plotted the rate functions of l-APT and m-APT PNs in response to 12 different odors (Fig. 6A,B). The rate functions in response to different odors show surprisingly high similarities across both tracts with some odors resulting in longer transient from phasic to tonic than others (e.g., Fig. 6B, IAA). In some cases, we found off responses (citral), an observation that matches data from previous intracellular recordings remarkably well (compare Abel et al., 2001, Fig. 3; or Müller et al., 2002, Fig. 5). For the vast majority of odor responses, l-APT PNs were activated stronger compared with m-APT PNs. However, one-third of all tested odors elicited similar action potential (AP) rates in both tracts, indicating that the recorded differences are not due to a generally lower responsiveness of m-APT PNs. To further ask whether odor-evoked AP rates are different between different odors tested, we normalized the responses. This revealed that l-APT as well as m-APT PNs encode odors by AP rates (Kruskal–Wallis ANOVA: l-APT, p < 0.001; m-APT, p < 0.01).
Population response latencies
Because some APT PNs showed odor-dependent differences in response latencies (Fig. 5A,B), we analyzed response latencies at the population level (Fig. 6). To reduce interindividual latency variations, we used an alignment algorithm of odor response in time (Nawrot et al., 2003) (see Materials and Methods). Comparison of the population response latencies with those of individual APT PNs (previous section) confirmed that l-APT PNs responded on average ∼13 ms faster than m-APT PNs, although for each tested odor we found overlapping latency deviations (l-APT, 164.7 ± 61.9 ms; m-APT, 177.6 ± 71.5 ms; t test, p < 0.05). The alcohols 1-pentanol and 1-octanol elicited the fastest population responses in the l-APT, whereas the pheromonal odors IAA and citral elicited the fastest population responses in the m-APT (Fig. 6). At the level of population responses, some odors generate consistent latency differences if PNs of both tracts are considered (ANOVA, p < 0.05).
Responses to biologically relevant odor mixtures
To explore whether one of the two tracts preferentially transfers information about social odors, we used natural odor mixtures with high biological relevance: a mixture of old beeswax, cleaned beeswax, abandoned brood combs, honey solved in water, and freshly killed bees (Table 1). The results clearly show that information about all natural odor mixtures is transferred in parallel along both PN tracts (Fig. 7). Population responses of l-APT and m-APT PNs (n = 4 bees; l-APT, 9 PNs; m-APT, 9 PNs; except for freshly killed bees, n = 3 bees; l-APT, 6 PNs; m-APT, 7 PNs) reached comparable AP rates in both tracts (Fig. 7A,B). The odor mixtures evoked similar rate functions in PNs of both tracts (Fig. 7B). The high AP rate in response to the natural odor mixtures probably is due to a higher vapor pressure of the tested odors (Carcaud et al., 2012). The insignificant difference in AP rate between tracts might be due to the small sample size (median: l-APT, 23.8 Hz (4.8–76.2 Hz); m-APT, 24.4 Hz (13.9–42.7 Hz); Wilcoxon rank-sum test, p = 0.86).
The highest AP rates in both tracts were elicited in response to freshly killed bees [median: l-APT, 22.2 Hz (7.9–65.4 Hz); m-APT, 24.4 Hz (14.0–24.4 Hz)] suggesting a high sensitivity or high concentration of the related odors (Seeley, 1982; Robinson et al., 1999; Spivak et al., 2003). To compare latency differences of single APT PNs in response to hive odors, we measured l-APT PNs activated 21.8 ms earlier compared with m-APT PNs. However, probably due to the low number of recordings, this difference was not significant (Table 2, Wilcoxon rank-sum test, p > 0.1).
Discussion
We recorded, for the first time simultaneously, odor-induced activity from PNs of two separate output pathways (l-APT and m-APT) of the primary olfactory centers in the honeybee, taking advantage of the distinct anatomy in the honeybee's olfactory pathway (Kirschner et al., 2006). The most important findings are that information about all tested odors (including natural mixtures) is transferred along both tracts, and that comparison of single PN response profiles and population responses revealed systematic differences in representations of individual odors and odor mixtures across both tracts. We conclude that this differential processing of same odors along two olfactory pathways matches the criteria of parallel processing, comparable to other sensory systems (auditory: Yu and Young, 2000; Rauschecker and Scott, 2009; visual: Livingstone and Hubel, 1988; Strausfeld et al., 2006; Paulk et al., 2008; Nassi and Callaway, 2009; somatosensory: Ahissar et al., 2000; electrosensory: Metzner and Juranek, 1997). In the visual system, for example, the magnocellular and parvocellular pathways from the lateral geniculate nucleus mediate different elemental properties of the same visual scene, such as color and spatiotemporal patterns (Livingstone and Hubel, 1988). In rodents, parallel odor processing was recently found in mitral and tufted cells targeting the olfactory tubercle and piriform cortex and showing similar odor-response magnitudes and profiles but different SNRs (Payton et al., 2012).
Segregated versus parallel coding of olfactory information
The honeybee dual olfactory pathway is anatomically separated in PNs that innervate the MBs and LH in reverse order (Mobbs, 1982; Abel et al., 2001; Kirschner et al., 2006; Zube et al., 2008; Rössler and Zube, 2011). This pattern provoked different hypotheses about the pathway's functional significance: “dual segregated” (different odors in different tracts) or “dual parallel” (similar input, differential feature extraction) (Galizia and Rössler, 2010). Two recent calcium-imaging studies indicate that sensory input to l-APT and m-APT glomeruli is remarkably redundant (Carcaud et al., 2012; Galizia et al., 2012) with only slight coding preferences for chain length and functional group or variations in response strengths between the two subsystems. Representation of colony odors in the ant AL (Brandstaetter and Kleineidam, 2011) suggests that the two subsystems either receive similar sensory input or that sensory input is locally distributed across both hemilobes. Our study strongly supports the idea that PNs of both APTs receive largely similar input, although we cannot exclude the possibility that certain odors may be transferred only via one APT, especially considering the large odor space bees are confronted with (Guerrieri et al., 2005; Haddad et al., 2008, 2010; Chen et al., 2011). Future experiments will have to expand analyses within the behaviorally relevant odor space.
Odor specificity range
The LS, the recruitment rate of PNs per odor, and the average number of odors activating PNs indicate higher odor-specificity in m-APT PNs than in l-APT PNs. This large dataset resolves differing results from previous studies (Müller et al., 2002; Krofczik et al., 2008) with intracellular recordings of low numbers of neurons and odors tested. In contrast to our finding, a sequential imaging study of PN boutons in the MB calyx (Yamagata et al., 2009) found higher odor-specificity in l-APT boutons compared with m-APT boutons. This may indicate that calcium activity in PN boutons may be influenced by MB microcircuits, in particular inhibitory feedback and neuromodulation (Grünewald, 1999a, 1999b; Ganeshina and Menzel, 2001; Yasuyama et al., 2002; Okada et al., 2007; Rybak and Menzel, 2010; Sandoz, 2011), possibly related to learning and memory (Stopfer et al., 1997; Heisenberg, 2003; Gerber and Stocker, 2007; Okada et al., 2007; Haehnel and Menzel, 2010, 2012; Gauthier and Grünewald, 2012).
Both physiological and modeling studies suggest that lateral inhibition and gain control mechanisms in the AL are mediated by different types of local interneurons (Martin et al., 2011; Wilson, 2011; Assisi et al., 2012). A recent modeling study indicates that this allows variable tuning of odor specificity and concentration dependence in honeybee PNs (Schmuker et al., 2011). Transferred to our results, the m-APT would undergo stronger lateral inhibition and gain control mechanisms compared with the more broadly tuned l-APT.
Response latency differences across tracts
In rodents, latency differences exist between parallel OB output streams [mitral (M) and tufted (T) cells] (Fukunaga et al., 2012; Igarashi et al., 2012). Higher-order olfactory parallel processing was also suggested to remain separated in humans (Frasnelli et al., 2012). Anatomically, M/T cells in rodents target different areas in the olfactory cortex, whereas both l-APT and m-APT PNs in honeybees target the MB calyces and LH. However, innervation within the MB and LH shows segregated and overlapping zones (Kirschner et al., 2006; Zube et al., 2008). Previous intracellular recordings revealed latency differences between PNs of both tracts (Müller et al., 2002). Our dataset shows a significant overall latency difference between both APTs. Is this latency difference relevant for odor coding? We hypothesize that the broadly tuned l-APT delivers fast and global information about the timing of an odor, whereas the m-APT provides more specific information about odor identity. In analogy to “what” channels (object vision) and “where” channels (spatial vision) in the inferior temporal and the posterior parietal cortex (Mishkin et al., 1983; Merigan and Maunsell, 1993; Milner and Goodale, 2008), the m-APT and l-APT system may provide “what” and “when” olfactory information.
Odor-specific response latencies
Temporal coding is discussed controversially for the vertebrate olfactory system (Bathellier et al., 2008; Junek et al., 2010; Smear et al., 2011). Spors et al. (2006) found odor-specific response latencies already at the level of OB input. In insects, temporal odor representations, such as oscillations or synchrony in PN activity, were shown in locusts and moths (Laurent, 1996; Stopfer et al., 1997; Christensen et al., 1998; Ito et al., 2009; Kazama and Wilson, 2009; Lei et al., 2009; Riffell et al., 2009; Raman et al., 2010; Assisi et al., 2011). Quantitative and qualitative analysis of single PN activity suggests that response latencies may be odor-specific (Krofczik et al., 2008, Müller et al., 2002; also, Perez-Orive et al., 2002, Fig. 1; and Wilson et al., 2004, Figs. 1, 2). The same odor stimulus can evoke neuron-specific response latencies in a PN population, suggesting that latencies are potentially used for coding odor identity (Wilson et al., 2004, Fig. 2; Namiki and Kanzaki, 2008, Fig. 2). This was proposed for olfactory processing in bees (Müller et al., 2002; Krofczik et al., 2008) and moths (Belmabrouk et al., 2011; Kuebler et al., 2011) and is supported by our study. It remains to be shown whether the brain actually uses this parameter for odor recognition. In rodents, initial evidence was found to link odor-response latency differences to behavior (Smear et al., 2011).
Are odor-specific temporal differences in both PN streams in the honeybee used to extract odor identity in higher centers? Kenyon cells (KCs) require convergent and synchronous (coincident) synaptic input to be excited (Perez-Orive et al., 2002, 2004; Demmer and Kloppenburg, 2009). Sparse coding was shown in the honeybee (Szyszka et al., 2005), locust (Perez-Orive et al., 2002; Brown et al., 2005; Broome et al., 2006; Jortner et al., 2007), moth (Ito et al., 2008), and fruit fly (Turner et al., 2008; Honegger et al., 2011) and was suggested to promote accurate information storage (Olshausen and Field, 2004). Physiological recordings and modeling studies in the locust suggest that temporal divergence in PNs is mainly based on local AL processing (Stopfer et al., 2003; Assisi et al., 2011; Assisi and Bazhenov, 2012). In the honeybee, KCs may receive input from multiple PNs. A Golgi study (Strausfeld, 2002) shows that spiny class I KCs and class II KCs have dendritic arbors that span across both m-APT and l-APT PN target regions (Kirschner et al., 2006). We found latency variances within and across tracts with sufficient temporal overlap for coincidence (Figs. 6, 7). Consequently, odor-specific combinations of temporal PN input patterns from both tracts may be transferred in a coincidence pattern of KC excitation. The enormous divergence from PN boutons to KCs provides large computational capacity (Witthöft, 1967; Schürmann, 1974; Mobbs, 1982; Strausfeld, 2002; Groh et al., 2012).
The role of the LH is much less understood in the honeybee. In the locust, Gupta and Stopfer (2012) recently categorized 10 types of LH neurons. In contrast to sparse coding and learning-dependent plasticity in KCs (Perez-Orive et al., 2002; Cassenaer and Laurent, 2007, 2012), most LH neurons were multimodal with broad odor-response profiles. In honeybees, broad-responding l-APT PNs contact the LH first, which fits into this picture. Future analyses of PN spike synchrony within and across tracts together with simultaneous recordings in MB and LH target neurons are needed to further understand the nature and significance of temporal olfactory coding.
The combined anatomical and functional properties of the honeybee dual olfactory pathway suggest that both rate and temporal coding are implemented along two parallel streams. This may represent an adaptation to serve the multitude of olfactory demands associated with the importance of a complex olfactory world for a social insect.
Footnotes
The study was supported by the Deutsche Forschungsgemeinschaft (SPP 1392, Ro1177) to W.R.; M.P.N. received financial support from the Bundesministerium für Bildung und Forschung (01GQ0941). We thank Anneke Meyer for intensive and excellent help with MatLab data analyses and numerous fruitful discussions; Martin Strube-Bloss and Randolf Menzel for technical help with electrode production; Hans-Reiner Polder (NPI Electronic) for excellent support in amplifier construction; the Hildebrand group, especially Andrew Dacks for introduction to spike sorting; and Dirk Ahrens-Lagast for bee-keeping expertise.
The authors declare no competing financial interest.
References
- Abel R, Rybak J, Menzel R. Structure and response patterns of olfactory interneurons in the honeybee, Apis mellifera. J Comp Neurol. 2001;437:363–383. doi: 10.1002/cne.1289. [DOI] [PubMed] [Google Scholar]
- Ahissar E, Sosnik R, Haidarliu S. Transformation from temporal to rate coding in a somatosensory thalamocortical pathway. Nature. 2000;406:302–306. doi: 10.1038/35018568. [DOI] [PubMed] [Google Scholar]
- Arenas A, Giurfa M, Farina WM, Sandoz JC. Early olfactory experience modifies neural activity in the antennal lobe of a social insect at the adult stage. Eur J Neurosci. 2009;30:1498–1508. doi: 10.1111/j.1460-9568.2009.06940.x. [DOI] [PubMed] [Google Scholar]
- Assisi C, Bazhenov M. Synaptic inhibition controls transient oscillatory synchronization in a model of the insect olfactory system. Front Neuroeng. 2012;5:7. doi: 10.3389/fneng.2012.00007. [DOI] [PMC free article] [PubMed] [Google Scholar]
- Assisi C, Stopfer M, Bazhenov M. Using the structure of inhibitory networks to unravel mechanisms of spatiotemporal patterning. Neuron. 2011;69:373–386. doi: 10.1016/j.neuron.2010.12.019. [DOI] [PMC free article] [PubMed] [Google Scholar]
- Assisi C, Stopfer M, Bazhenov M. Excitatory local interneurons enhance tuning of sensory information. PLoS Compu Biol. 2012;8:e1002563. doi: 10.1371/journal.pcbi.1002563. [DOI] [PMC free article] [PubMed] [Google Scholar]
- Bathellier B, Buhl DL, Accolla R, Carleton A. Dynamic ensemble odor coding in the mammalian olfactory bulb: sensory information at different timescales. Neuron. 2008;57:586–598. doi: 10.1016/j.neuron.2008.02.011. [DOI] [PubMed] [Google Scholar]
- Belmabrouk H, Nowotny T, Rospars JP, Martinez D. Interaction of cellular and network mechanisms for efficient pheromone coding in moths. Proc Natl Acad Sci U S A. 2011;108:19790–19795. doi: 10.1073/pnas.1112367108. [DOI] [PMC free article] [PubMed] [Google Scholar]
- Boch R, Shearer DA, Stone BC. Identification of iso-amyl acetate as an active component in the sting pheromone of the honey bee. Nature. 1962;195:1018–1020. doi: 10.1038/1951018b0. [DOI] [PubMed] [Google Scholar]
- Brandstaetter AS, Kleineidam CJ. Distributed representation of social odors indicates parallel processing in the antennal lobe of ants. J Neurophysiol. 2011;106:2437–2449. doi: 10.1152/jn.01106.2010. [DOI] [PubMed] [Google Scholar]
- Brandt R, Rohlfing T, Rybak J, Krofczik S, Maye A, Westerhoff M, Hege HC, Menzel R. Three-dimensional average-shape atlas of the honeybee brain and its applications. J Comp Neurol. 2005;492:1–19. doi: 10.1002/cne.20644. [DOI] [PubMed] [Google Scholar]
- Brierley MJ, Ashworth AJ, Craven TP, Woodburn M, Banks JR, Lu W, Riccardi D, Balment RJ, McCrohan CR. Electrical activity of caudal neurosecretory neurons in seawater- and freshwater-adapted flounder: responses to cholinergic agonists. J Exp Biol. 2003;206:4011–4020. doi: 10.1242/jeb.00631. [DOI] [PubMed] [Google Scholar]
- Broome BM, Jayaraman V, Laurent G. Encoding and decoding of overlapping odor sequences. Neuron. 2006;51:467–482. doi: 10.1016/j.neuron.2006.07.018. [DOI] [PubMed] [Google Scholar]
- Brown SL, Joseph J, Stopfer M. Encoding a temporally structured stimulus with a temporally structured neural representation. Nat Neurosci. 2005;8:1568–1576. doi: 10.1038/nn1559. [DOI] [PubMed] [Google Scholar]
- Carcaud J, Hill T, Giurfa M, Sandoz JC. Differential coding by two olfactory subsystems in the honeybee brain. J Neurophysiol. 2012;108:1106–1121. doi: 10.1152/jn.01034.2011. [DOI] [PubMed] [Google Scholar]
- Cassenaer S, Laurent G. Hebbian STDP in mushroom bodies facilitates the synchronous flow of olfactory information in locusts. Nature. 2007;448:709–713. doi: 10.1038/nature05973. [DOI] [PubMed] [Google Scholar]
- Cassenaer S, Laurent G. Conditional modulation of spike-timing-dependent plasticity for olfactory learning. Nature. 2012;482:47–52. doi: 10.1038/nature10776. [DOI] [PubMed] [Google Scholar]
- Chen YC, Mishra D, Schmitt L, Schmuker M, Gerber B. A behavioral odor similarity “space” in larval Drosophila. Chem Senses. 2011;36:237–249. doi: 10.1093/chemse/bjq123. [DOI] [PMC free article] [PubMed] [Google Scholar]
- Christensen TA, Waldrop BR, Hildebrand JG. Multitasking in the olfactory system: context-dependent responses to odors reveal dual GABA-regulated coding mechanisms in single olfactory projection neurons. J Neurosci. 1998;18:5999–6008. doi: 10.1523/JNEUROSCI.18-15-05999.1998. [DOI] [PMC free article] [PubMed] [Google Scholar]
- Collins AM, Blum MS. Alarm responses caused by newly identified compounds derived from the honeybee sting. J Chem Ecol. 1983;9:57–65. doi: 10.1007/BF00987770. [DOI] [PubMed] [Google Scholar]
- Deisig N, Giurfa M, Sandoz JC. Antennal lobe processing increases separability of odor mixture representations in the honeybee. J Neurophysiol. 2010;103:2185–2194. doi: 10.1152/jn.00342.2009. [DOI] [PubMed] [Google Scholar]
- Demmer H, Kloppenburg P. Intrinsic membrane properties and inhibitory synaptic input of Kenyon cells as mechanisms for sparse coding? J Neurophysiol. 2009;102:1538–1550. doi: 10.1152/jn.00183.2009. [DOI] [PubMed] [Google Scholar]
- Fernandez PC, Locatelli FF, Person-Rennell N, Deleo G, Smith BH. Associative conditioning tunes transient dynamics of early olfactory processing. J Neurosci. 2009;29:10191–10202. doi: 10.1523/JNEUROSCI.1874-09.2009. [DOI] [PMC free article] [PubMed] [Google Scholar]
- Frasnelli J, Lundström JN, Schöpf V, Negoias S, Hummel T, Lepore F. Dual processing streams in chemosensory perception. Front Hum Neurosci. 2012;6:288. doi: 10.3389/fnhum.2012.00288. [DOI] [PMC free article] [PubMed] [Google Scholar]
- Fukunaga I, Berning M, Kollo M, Schmaltz A, Schaefer AT. Two distinct channels of olfactory bulb output. Neuron. 2012;75:320–329. doi: 10.1016/j.neuron.2012.05.017. [DOI] [PubMed] [Google Scholar]
- Galizia CG, Menzel R. The role of glomeruli in the neural representation of odours: results from optical recording studies. J Insect Physiol. 2001;47:115–130. doi: 10.1016/s0022-1910(00)00106-2. [DOI] [PubMed] [Google Scholar]
- Galizia CG, Rössler W. Parallel olfactory systems in insects: anatomy and function. Annu Rev Entomol. 2010;55:399–420. doi: 10.1146/annurev-ento-112408-085442. [DOI] [PubMed] [Google Scholar]
- Galizia CG, Franke T, Menzel R, Sandoz JC. Optical imaging of concealed brain activity using a gold mirror in honeybees. J Insect Physiol. 2012;58:743–749. doi: 10.1016/j.jinsphys.2012.02.010. [DOI] [PubMed] [Google Scholar]
- Ganeshina O, Menzel R. GABA-immunoreactive neurons in the mushroom bodies of the honeybee: an electron microscopic study. J Comp Neurol. 2001;437:335–349. doi: 10.1002/cne.1287. [DOI] [PubMed] [Google Scholar]
- Gauthier M, Grünewald B. Neurotransmitter systems in the honey bee brain: functions in learning and memory. In: Galizia CG, Eisenhardt D, Giurfa M, editors. Honeybee neurobiology and behavior—a tribute to Randolf Menzel. Dordrecht, Netherlands: Springer Netherlands; 2012. pp. 155–169. [Google Scholar]
- Geffen MN, Broome BM, Laurent G, Meister M. Neural encoding of rapidly fluctuating odors. Neuron. 2009;61:570–586. doi: 10.1016/j.neuron.2009.01.021. [DOI] [PubMed] [Google Scholar]
- Gerber B, Stocker RF. The Drosophila larva as a model for studying chemosensation and chemosensory learning: a review. Chem Senses. 2007;32:65–89. doi: 10.1093/chemse/bjl030. [DOI] [PubMed] [Google Scholar]
- Gold C, Henze DA, Koch C, Buzsáki G. On the origin of the extracellular action potential waveform: A modeling study. J Neurophysiol. 2006;95:3113–3128. doi: 10.1152/jn.00979.2005. [DOI] [PubMed] [Google Scholar]
- Gray CM, Maldonado PE, Wilson M, McNaughton B. Tetrodes markedly improve the reliability and yield of multiple single-unit isolation from multi-unit recordings in cat striate cortex. J Neurosci Methods. 1995;63:43–54. doi: 10.1016/0165-0270(95)00085-2. [DOI] [PubMed] [Google Scholar]
- Groh C, Lu Z, Meinertzhagen IA, Rössler W. Age-related plasticity in the synaptic ultrastructure of neurons in the mushroom body calyx of the adult honeybee Apis mellifera. J Comp Neurol. 2012;520:3509–3527. doi: 10.1002/cne.23102. [DOI] [PubMed] [Google Scholar]
- Grünewald B. Physiological properties and response modulations of mushroom body feedback neurons during olfactory learning in the honeybee, Apis mellifera. J Comp Physiol A Neuroethol Sens Neural Behav Physiol Neuroethol Sens Neural Behav Physiol. 1999a;185:565–576. [Google Scholar]
- Grünewald B. Morphology of feedback neurons in the mushroom body of the honeybee, Apis mellifera. J Comp Neurol. 1999b;404:114–126. doi: 10.1002/(sici)1096-9861(19990201)404:1<114::aid-cne9>3.3.co;2-r. [DOI] [PubMed] [Google Scholar]
- Guerrieri F, Schubert M, Sandoz JC, Giurfa M. Perceptual and neural olfactory similarity in honeybees. PLoS Biol. 2005;3:e60. doi: 10.1371/journal.pbio.0030060. [DOI] [PMC free article] [PubMed] [Google Scholar]
- Gupta N, Stopfer M. Functional analysis of a higher olfactory center, the lateral horn. J Neurosci. 2012;32:8138–8148. doi: 10.1523/JNEUROSCI.1066-12.2012. [DOI] [PMC free article] [PubMed] [Google Scholar]
- Haddad R, Lapid H, Harel D, Sobel N. Measuring smells. Curr Opin Neurobiol. 2008;18:438–444. doi: 10.1016/j.conb.2008.09.007. [DOI] [PubMed] [Google Scholar]
- Haddad R, Weiss T, Khan R, Nadler B, Mandairon N, Bensafi M, Schneidman E, Sobel N. Global features of neural activity in the olfactory system form a parallel code that predicts olfactory behavior and perception. J Neurosci. 2010;30:9017–9026. doi: 10.1523/JNEUROSCI.0398-10.2010. [DOI] [PMC free article] [PubMed] [Google Scholar]
- Haehnel M, Menzel R. Sensory representation and learning-related plasticity in mushroom body extrinsic feedback neurons of the protocerebral tract. Front Syst Neurosci. 2010;4:161. doi: 10.3389/fnsys.2010.00161. [DOI] [PMC free article] [PubMed] [Google Scholar]
- Haehnel M, Menzel R. Long-term memory and response generalization in mushroom body extrinsic neurons in the honeybee Apis mellifera. J Exp Biol. 2012;215:559–565. doi: 10.1242/jeb.059626. [DOI] [PubMed] [Google Scholar]
- Hansson BS, Stensmyr MC. Evolution of insect olfaction. Neuron. 2011;72:698–711. doi: 10.1016/j.neuron.2011.11.003. [DOI] [PubMed] [Google Scholar]
- Harris KD, Henze DA, Csicsvari J, Hirase H, Buzsaki G, Buzsáki G. Accuracy of tetrode spike separation as determined by simultaneous intracellular and extracellular measurements. J Neurophysiol. 2000;84:401–414. doi: 10.1152/jn.2000.84.1.401. [DOI] [PubMed] [Google Scholar]
- Heisenberg M. Mushroom body memoir: from maps to models. Nat Rev Neurosci. 2003;4:266–275. doi: 10.1038/nrn1074. [DOI] [PubMed] [Google Scholar]
- Hildebrand JG, Shepherd GM. Mechanisms of olfactory discrimination: converging evidence for common principles across phyla. Annu Rev Neurosci. 1997;20:595–631. doi: 10.1146/annurev.neuro.20.1.595. [DOI] [PubMed] [Google Scholar]
- Hoare DJ, McCrohan CR, Cobb M. Precise and fuzzy coding by olfactory sensory neurons. J Neurosci. 2008;28:9710–9722. doi: 10.1523/JNEUROSCI.1955-08.2008. [DOI] [PMC free article] [PubMed] [Google Scholar]
- Honegger KS, Campbell RA, Turner GC. Cellular-resolution population imaging reveals robust sparse coding in the Drosophila mushroom body. J Neurosci. 2011;31:11772–11785. doi: 10.1523/JNEUROSCI.1099-11.2011. [DOI] [PMC free article] [PubMed] [Google Scholar]
- Igarashi KM, Ieki N, An M, Yamaguchi Y, Nagayama S, Kobayakawa K, Kobayakawa R, Tanifuji M, Sakano H, Chen WR, Mori K. Parallel mitral and tufted cell pathways route distinct odor information to different targets in the olfactory cortex. J Neurosci. 2012;32:7970–7985. doi: 10.1523/JNEUROSCI.0154-12.2012. [DOI] [PMC free article] [PubMed] [Google Scholar]
- Ito I, Ong RC, Raman B, Stopfer M. Sparse odor representation and olfactory learning. Nat Neurosci. 2008;11:1177–1184. doi: 10.1038/nn.2192. [DOI] [PMC free article] [PubMed] [Google Scholar]
- Ito I, Bazhenov M, Ong RC, Raman B, Stopfer M. Frequency transitions in odor-evoked neural oscillations. Neuron. 2009;64:692–706. doi: 10.1016/j.neuron.2009.10.004. [DOI] [PMC free article] [PubMed] [Google Scholar]
- Joerges J, Küttner A, Galizia CG, Menzel R. Representation of odours and odour mixtures visualized in the honeybee brain. Nature. 1997;387:285. [Google Scholar]
- Jortner RA, Farivar SS, Laurent G. A simple connectivity scheme for sparse coding in an olfactory system. J Neurosci. 2007;27:1659–1669. doi: 10.1523/JNEUROSCI.4171-06.2007. [DOI] [PMC free article] [PubMed] [Google Scholar]
- Joshua M, Elias S, Levine O, Bergman H. Quantifying the isolation quality of extracellularly recorded action potentials. J Neurosci Methods. 2007;163:267–282. doi: 10.1016/j.jneumeth.2007.03.012. [DOI] [PubMed] [Google Scholar]
- Junek S, Kludt E, Wolf F, Schild D. Olfactory coding with patterns of response latencies. Neuron. 2010;67:872–884. doi: 10.1016/j.neuron.2010.08.005. [DOI] [PubMed] [Google Scholar]
- Kay LM, Stopfer M. Information processing in the olfactory systems of insects and vertebrates. Semin Cell Dev Biol. 2006;17:433–442. doi: 10.1016/j.semcdb.2006.04.012. [DOI] [PubMed] [Google Scholar]
- Kazama H, Wilson RI. Origins of correlated activity in an olfactory circuit. Nat Neurosci. 2009;12:1136–1144. doi: 10.1038/nn.2376. [DOI] [PMC free article] [PubMed] [Google Scholar]
- Kirschner S, Kleineidam CJ, Zube C, Rybak J, Grünewald B, Rössler W. Dual olfactory pathway in the honeybee, Apis mellifera. J Comp Neurol. 2006;499:933–952. doi: 10.1002/cne.21158. [DOI] [PubMed] [Google Scholar]
- Krofczik S, Menzel R, Nawrot MP. Rapid odor processing in the honeybee antennal lobe network. Front Comput Neurosci. 2008;2:9. doi: 10.3389/neuro.10.009.2008. [DOI] [PMC free article] [PubMed] [Google Scholar]
- Kuebler LS, Olsson SB, Weniger R, Hansson BS. Neuronal processing of complex mixtures establishes a unique odor representation in the moth antennal lobe. Front Neural Circuits. 2011;5:7. doi: 10.3389/fncir.2011.00007. [DOI] [PMC free article] [PubMed] [Google Scholar]
- Laurent G. Dynamical representation of odors by oscillating and evolving neural assemblies. Trends Neurosci. 1996;19:489–496. doi: 10.1016/S0166-2236(96)10054-0. [DOI] [PubMed] [Google Scholar]
- Lei H, Riffell JA, Gage SL, Hildebrand JG. Contrast enhancement of stimulus intermittency in a primary olfactory network and its behavioral significance. J Biol. 2009;8:21. doi: 10.1186/jbiol120. [DOI] [PMC free article] [PubMed] [Google Scholar]
- Lewicki MS. A review of methods for spike sorting: the detection and classification of neural action potentials. Network. 1998;9:R53–R78. [PubMed] [Google Scholar]
- Livingstone M, Hubel D. Segregation of form, color, movement, and depth: anatomy, physiology, and perception. Science. 1988;240:740–749. doi: 10.1126/science.3283936. [DOI] [PubMed] [Google Scholar]
- Martin JP, Beyerlein A, Dacks AM, Reisenman CE, Riffell JA, Lei H, Hildebrand JG. The neurobiology of insect olfaction: sensory processing in a comparative context. Prog Neurobiol. 2011;95:427–447. doi: 10.1016/j.pneurobio.2011.09.007. [DOI] [PubMed] [Google Scholar]
- Mehring C, Rickert J, Vaadia E, Cardosa de Oliveira S, Aertsen A, Rotter S. Inference of hand movements from local field potentials in monkey motor cortex. Nat Neurosci. 2003;6:1253–1254. doi: 10.1038/nn1158. [DOI] [PubMed] [Google Scholar]
- Meier R, Egert U, Aertsen A, Nawrot MP. FIND—a unified framework for neural data analysis. Neural Netw. 2008;21:1085–1093. doi: 10.1016/j.neunet.2008.06.019. [DOI] [PubMed] [Google Scholar]
- Merigan WH, Maunsell JH. How parallel are the primate visual pathways? Annu Rev Neurosci. 1993;16:369–402. doi: 10.1146/annurev.ne.16.030193.002101. [DOI] [PubMed] [Google Scholar]
- Metzner W, Juranek J. A sensory brain map for each behavior? Proc Natl Acad Sci U S A. 1997;94:14798–14803. doi: 10.1073/pnas.94.26.14798. [DOI] [PMC free article] [PubMed] [Google Scholar]
- Meyer A, Galizia CG. Elemental and configural olfactory coding by antennal lobe neurons of the honeybee (Apis mellifera) J Comp Physiol A Neuroethol Sens Neural Behav Physiol Neuroethol Sens Neural Behav Physiol. 2012;198:159–171. doi: 10.1007/s00359-011-0696-8. [DOI] [PMC free article] [PubMed] [Google Scholar]
- Milner AD, Goodale MA. Two visual systems re-viewed. Neuropsychologia. 2008;46:774–785. doi: 10.1016/j.neuropsychologia.2007.10.005. [DOI] [PubMed] [Google Scholar]
- Mishkin M, Ungerleider LG, Macko KA. Object vision and spatial vision: two cortical pathways. Trends Neurosci. 1983;6:414–417. [Google Scholar]
- Mobbs P. The brain of the honeybee Apis Mellifera. I. The connections and spatial organization of the mushroom bodies. Philos Trans R Soc Lond B Biol Sci. 1982;298:309–354. [Google Scholar]
- Müller D, Abel R, Brandt R, Zöckler M, Menzel R. Differential parallel processing of olfactory information in the honeybee, Apis mellifera L. J Comp Physiol A Neuroethol Sens Neural Behav Physiol Neuroethol Sens Neural Behav Physiol. 2002;188:359–370. doi: 10.1007/s00359-002-0310-1. [DOI] [PubMed] [Google Scholar]
- Namiki S, Kanzaki R. Reconstructing the population activity of olfactory output neurons that innervate identifiable processing units. Front Neural Circuits. 2008;2:1. doi: 10.3389/neuro.04.001.2008. [DOI] [PMC free article] [PubMed] [Google Scholar]
- Nassi JJ, Callaway EM. Parallel processing strategies of the primate visual system. Nat Rev Neurosci. 2009;10:360–372. doi: 10.1038/nrn2619. [DOI] [PMC free article] [PubMed] [Google Scholar]
- Nawrot MP. Dynamics of sensory processing in the dual olfactory pathway of the honeybee. Apidologie. 2012;43:269–291. [Google Scholar]
- Nawrot MP, Aertsen A, Rotter S. Elimination of response latency variability in neuronal spike trains. Biol Cybern. 2003;88:321–334. doi: 10.1007/s00422-002-0391-5. [DOI] [PubMed] [Google Scholar]
- Nishikawa M, Watanabe H, Yokohari F. Higher brain centers for social tasks in worker ants, Camponotus japonicus. J Comp Neurol. 2012;520:1584–1598. doi: 10.1002/cne.23001. [DOI] [PubMed] [Google Scholar]
- Okada R, Ikeda J, Mizunami M. Sensory responses and movement-related activities in extrinsic neurons of the cockroach mushroom bodies. J Comp Physiol A Neuroethol Sens Neural Behav Physiol Neuroethol Sens Neural Behav Physiol. 1999;185:115–129. [Google Scholar]
- Okada R, Rybak J, Manz G, Menzel R. Learning-related plasticity in PE1 and other mushroom body-extrinsic neurons in the honeybee brain. J Neurosci. 2007;27:11736–11747. doi: 10.1523/JNEUROSCI.2216-07.2007. [DOI] [PMC free article] [PubMed] [Google Scholar]
- Olshausen BA, Field DJ. Sparse coding of sensory inputs. Curr Opin Neurobiol. 2004;14:481–487. doi: 10.1016/j.conb.2004.07.007. [DOI] [PubMed] [Google Scholar]
- Paulk AC, Phillips-Portillo J, Dacks AM, Fellous JM, Gronenberg W. The processing of color, motion, and stimulus timing are anatomically segregated in the bumblebee brain. J Neurosci. 2008;28:6319–6332. doi: 10.1523/JNEUROSCI.1196-08.2008. [DOI] [PMC free article] [PubMed] [Google Scholar]
- Payton CA, Wilson DA, Wesson DW. Parallel odor processing by two anatomically distinct olfactory bulb target structures. PloS One. 2012;7:e34926. doi: 10.1371/journal.pone.0034926. [DOI] [PMC free article] [PubMed] [Google Scholar]
- Perez-Orive J, Mazor O, Turner GC, Cassenaer S, Wilson RI, Laurent G. Oscillations and sparsening of odor representations in the mushroom body. Science. 2002;297:359–365. doi: 10.1126/science.1070502. [DOI] [PubMed] [Google Scholar]
- Perez-Orive J, Bazhenov M, Laurent G. Intrinsic and circuit properties favor coincidence detection for decoding oscillatory input. J Neurosci. 2004;24:6037–6047. doi: 10.1523/JNEUROSCI.1084-04.2004. [DOI] [PMC free article] [PubMed] [Google Scholar]
- Pickett J, Williams I, Martin A, Smith M. Nasonov pheromone of the honey bee, Apis mellifera L. (Hymenoptera: Apidae) J ChemEcol. 1980;6:425–434. doi: 10.1007/BF00987702. [DOI] [PubMed] [Google Scholar]
- Quiroga RQ. Spike sorting. Curr Biol. 2012;22:R45–R46. doi: 10.1016/j.cub.2011.11.005. [DOI] [PubMed] [Google Scholar]
- Raman B, Joseph J, Tang J, Stopfer M. Temporally diverse firing patterns in olfactory receptor neurons underlie spatiotemporal neural codes for odors. J Neurosci. 2010;30:1994–2006. doi: 10.1523/JNEUROSCI.5639-09.2010. [DOI] [PMC free article] [PubMed] [Google Scholar]
- Rauschecker JP, Scott SK. Maps and streams in the auditory cortex: nonhuman primates illuminate human speech processing. Nat Neurosci. 2009;12:718–724. doi: 10.1038/nn.2331. [DOI] [PMC free article] [PubMed] [Google Scholar]
- Rehder V. Quantification of the honeybee's proboscis reflex by electromyographic recordings. J Insect Physiol. 1987;33:501–507. [Google Scholar]
- Riffell JA, Lei H, Hildebrand JG. Neural correlates of behavior in the moth Manduca sexta in response to complex odors. Proc Natl Acad Sci U S A. 2009;106:19219–19226. doi: 10.1073/pnas.0910592106. [DOI] [PMC free article] [PubMed] [Google Scholar]
- Robinson GE, Heuser L, Le Conte Y, Lenquette F. Neurochemicals aid bee nestmate recognition. Nature. 1999;399:6–7. [Google Scholar]
- Rössler W, Zube C. Dual olfactory pathway in Hymenoptera: evolutionary insights from comparative studies. ASD. 2011;40:349–357. doi: 10.1016/j.asd.2010.12.001. [DOI] [PubMed] [Google Scholar]
- Rybak J. The digital honey bee brain atlas. In: Galizia CG, Eisenhardt D, Giurfa M, editors. Honeybee neurobiology and behavior. Dordrecht, Netherlands: Springer Netherlands; 2012. pp. 125–140. [Google Scholar]
- Rybak J, Menzel R. Mushroom body of the honeybee. In: Shepherd GM, Grillner S, editors. Handbook of brain microcircuits. New York: Oxford UP; 2010. pp. 433–438. [Google Scholar]
- Sachse S, Galizia CG. Role of inhibition for temporal and spatial odor representation in olfactory output neurons: a calcium imaging study. J Neurophysiol. 2002;87:1106–1117. doi: 10.1152/jn.00325.2001. [DOI] [PubMed] [Google Scholar]
- Sachse S, Rappert A, Galizia CG. The spatial representation of chemical structures in the antennal lobe of honeybees: steps towards the olfactory code. Eur J Neurosci. 1999;11:3970–3982. doi: 10.1046/j.1460-9568.1999.00826.x. [DOI] [PubMed] [Google Scholar]
- Sandoz JC. Behavioral and neurophysiological study of olfactory perception and learning in honeybees. Front Syst Neurosci. 2011;5:98. doi: 10.3389/fnsys.2011.00098. [DOI] [PMC free article] [PubMed] [Google Scholar]
- Sandoz JC, Galizia CG, Menzel R. Side-specific olfactory conditioning leads to more specific odor representation between sides but not within sides in the honeybee antennal lobes. Neuroscience. 2003;120:1137–1148. doi: 10.1016/s0306-4522(03)00384-1. [DOI] [PubMed] [Google Scholar]
- Sandoz JC, Deisig N, de Brito Sanchez MG, Giurfa M. Understanding the logics of pheromone processing in the honeybee brain: from labeled-lines to across-fiber patterns. Front Behav Neurosci. 2007;1:5. doi: 10.3389/neuro.08.005.2007. [DOI] [PMC free article] [PubMed] [Google Scholar]
- Savitzky A, Golay MJE. Smoothing and differentiation of data by simplified least-squares procedures. Anal Chem. 1964;36:1627–1639. [Google Scholar]
- Schlief ML, Wilson RI. Olfactory processing and behavior downstream from highly selective receptor neurons. Nat Neurosci. 2007;10:623–630. doi: 10.1038/nn1881. [DOI] [PMC free article] [PubMed] [Google Scholar]
- Schmuker M, Schneider G. Processing and classification of chemical data inspired by insect olfaction. Proc Natl Acad Sci U S A. 2007;104:20285–20289. doi: 10.1073/pnas.0705683104. [DOI] [PMC free article] [PubMed] [Google Scholar]
- Schmuker M, Yamagata N, Nawrot MP, Menzel R. Parallel representation of stimulus identity and intensity in a dual pathway model inspired by the olfactory system of the honeybee. Front Neuroeng. 2011;4:17. doi: 10.3389/fneng.2011.00017. [DOI] [PMC free article] [PubMed] [Google Scholar]
- Schürmann FW. On the functional anatomy of the Corpora pedunculata in insects. Exp Brain Res. 1974;19:406–432. doi: 10.1007/BF00234464. [DOI] [PubMed] [Google Scholar]
- Seeley TD. Adaptive significance of the age polyethism schedule in honeybee colonies. Behav Ecol Socio. 1982;11:287–293. [Google Scholar]
- Seeley TD. Honeybee ecology:a study of adaptation in social life. Princeton: Princeton UP; 1985. [Google Scholar]
- Shearer DA, Boch R. 2-Heptanone in the mandibular gland secretion of the honey-bee. Nature. 1965;206:530–531. [Google Scholar]
- Shearer DA, Boch R. Citral in the Nassanoff pheromone of the honey bee. J Insect Physiol. 1966;12:1513–1521. [Google Scholar]
- Smear M, Shusterman R, O'Connor R, Bozza T, Rinberg D. Perception of sniff phase in mouse olfaction. Nature. 2011;479:397–400. doi: 10.1038/nature10521. [DOI] [PubMed] [Google Scholar]
- Spivak M, Masterman R, Ross R, Mesce KA. Hygienic behavior in the honey bee (Apis mellifera L.) and the modulatory role of octopamine. J Neurobiol. 2003;55:341–354. doi: 10.1002/neu.10219. [DOI] [PubMed] [Google Scholar]
- Spors H, Wachowiak M, Cohen LB, Friedrich RW. Temporal dynamics and latency patterns of receptor neuron input to the olfactory bulb. J Neurosci. 2006;26:1247–1259. doi: 10.1523/JNEUROSCI.3100-05.2006. [DOI] [PMC free article] [PubMed] [Google Scholar]
- Stopfer M, Bhagavan S, Smith BH, Laurent G. Impaired odour discrimination on desynchronization of odour-encoding neural assemblies. Nature. 1997;390:70–74. doi: 10.1038/36335. [DOI] [PubMed] [Google Scholar]
- Stopfer M, Jayaraman V, Laurent G. Intensity versus identity coding in an olfactory system. Neuron. 2003;39:991–1004. doi: 10.1016/j.neuron.2003.08.011. [DOI] [PubMed] [Google Scholar]
- Strausfeld NJ. Organization of the honey bee mushroom body: representation of the calyx within the vertical and gamma lobes. J Comp Neurol. 2002;450:4–33. doi: 10.1002/cne.10285. [DOI] [PubMed] [Google Scholar]
- Strausfeld NJ, Douglass JK, Campbell H, Higgins C. Parallel processing in the optic lobes of flies and the occurence of motion computing circuits. In: Warrant E, Nilsson D-E, editors. Invertebrate vision. Canbridge: Cambridge UP; 2006. p. 547. [Google Scholar]
- Strube-Bloss MF, Nawrot MP, Menzel R. Mushroom body output neurons encode odor–reward associations. J Neurosci. 2011;31:3129–3140. doi: 10.1523/JNEUROSCI.2583-10.2011. [DOI] [PMC free article] [PubMed] [Google Scholar]
- Strube-Bloss MF, Herrera-Valdez MA, Smith BH. Ensemble response in mushroom body output neurons of the honey bee outpaces spatiotemporal odor processing two synapses earlier in the antennal lobe. PloS one. 2012;7:e50322. doi: 10.1371/journal.pone.0050322. [DOI] [PMC free article] [PubMed] [Google Scholar]
- Sun X-J, Fonta C, Masson C. Odour quality processing by bee antennal lobe interneurones. Chem Senses. 1993;18:355–377. [Google Scholar]
- Szyszka P, Ditzen M, Galkin A, Galizia CG, Menzel R. Sparsening and temporal sharpening of olfactory representations in the honeybee mushroom bodies. J Neurophysiol. 2005;94:3303–3313. doi: 10.1152/jn.00397.2005. [DOI] [PubMed] [Google Scholar]
- Szyszka P, Galkin A, Menzel R. Associative and non-associative plasticity in Kenyon cells of the honeybee mushroom body. Front Syst Neurosci. 2008;2:3. doi: 10.3389/neuro.06.003.2008. [DOI] [PMC free article] [PubMed] [Google Scholar]
- Tautz J, Maier S, Groh C, Rösler W, Brockmann A. Behavioral performance in adult honey bees is influenced by the temperature experienced during their pupal development. Proc Natl Acad Sci U S A. 2003;100:7343–7347. doi: 10.1073/pnas.1232346100. [DOI] [PMC free article] [PubMed] [Google Scholar]
- Turner GC, Bazhenov M, Laurent G. Olfactory representations by Drosophila mushroom body neurons. J Neurophysiol. 2008;99:734–746. doi: 10.1152/jn.01283.2007. [DOI] [PubMed] [Google Scholar]
- Vinje WE. Sparse coding and decorrelation in primary visual cortex during natural vision. Science. 2000;287:1273–1276. doi: 10.1126/science.287.5456.1273. [DOI] [PubMed] [Google Scholar]
- Willmore B, Tolhurst DJ. Characterizing the sparseness of neural codes. Network. 2001;12:255–270. [PubMed] [Google Scholar]
- Wilson RI. Understanding the functional consequences of synaptic specialization: insight from the Drosophila antennal lobe. Curr Opin Neurobiol. 2011;21:254–260. doi: 10.1016/j.conb.2011.03.002. [DOI] [PMC free article] [PubMed] [Google Scholar]
- Wilson RI, Laurent G. Role of GABAergic inhibition in shaping odor-evoked spatiotemporal patterns in the Drosophila antennal lobe. J Neurosci. 2005;25:9069–9079. doi: 10.1523/JNEUROSCI.2070-05.2005. [DOI] [PMC free article] [PubMed] [Google Scholar]
- Wilson RI, Turner GC, Laurent G. Transformation of olfactory representations in the Drosophila antennal lobe. Science. 2004;303:366–370. doi: 10.1126/science.1090782. [DOI] [PubMed] [Google Scholar]
- Witthöft W. Absolute Anzahl und Verteilung der Zellen im Hirn der Honigbiene. Z Morphol Tiere. 1967;61:160–184. [Google Scholar]
- Yamagata N, Schmuker M, Szyszka P, Mizunami M, Menzel R. Differential odor processing in two olfactory pathways in the honeybee. Front Syst Neurosci. 2009;3:16. doi: 10.3389/neuro.06.016.2009. [DOI] [PMC free article] [PubMed] [Google Scholar]
- Yasuyama K, Meinertzhagen IA, Schürmann FW. Synaptic organization of the mushroom body calyx in Drosophila melanogaster. J Comp Neurol. 2002;445:211–226. doi: 10.1002/cne.10155. [DOI] [PubMed] [Google Scholar]
- Yu JJ, Young ED. Linear and nonlinear pathways of spectral information transmission in the cochlear nucleus. Proc Natl Acad Sci U S A. 2000;97:11780–11786. doi: 10.1073/pnas.97.22.11780. [DOI] [PMC free article] [PubMed] [Google Scholar]
- Zube C, Kleineidam CJ, Kirschner S, Neef J, Rössler W. Organization of the olfactory pathway and odor processing in the antennal lobe of the ant Camponotus floridanus. J Comp Neurol. 2008;506:425–441. doi: 10.1002/cne.21548. [DOI] [PubMed] [Google Scholar]