

Abstract
Operant conditioning is a type of associative learning involving different and complex sensorimotor and cognitive processes. Because the hippocampus has been related to some motor and cognitive functions involved in this type of learning (such as object recognition, spatial orientation, and associative learning tasks), we decided to study in behaving mice the putative changes in strength taking place at the hippocampal CA3–CA1 synapses during the acquisition and performance of an operant conditioning task. Mice were chronically implanted with stimulating electrodes in the Schaffer collaterals and with recording electrodes in the hippocampal CA1 area and trained to an operant task using a fixed-ratio (1:1) schedule. We recorded the field EPSPs (fEPSPs) evoked at the CA3–CA1 synapse during the performance of appetitive (going to the lever, lever press) and consummatory (going to the feeder, eating) behaviors. In addition, we recorded the local field potential activity of the CA1 area during similar behavioral displays. fEPSPs evoked at the CA3–CA1 synapse presented larger amplitudes for appetitive than for consummatory behaviors. This differential change in synaptic strength took place in relation to the learning process, depending mainly on the moment in which mice reached the selected criterion. Thus, selective changes in CA3–CA1 synaptic strength were dependent on both the behavior display and the learning stage. In addition, significant changes in theta band power peaks and their corresponding discrete frequencies were noticed during these behaviors across the sequence of events characterizing this type of associative learning but not during the acquisition process.
Introduction
The role of hippocampus has been mostly related to the acquisition and storage of specific associative learning procedures, such as the classical conditioning of eyelid responses (Múnera et al., 2001; Gruart et al., 2006; Weible et al., 2006; Whitlock et al., 2006), as well as to object recognition (Rossato et al., 2007; Clarke et al., 2010) and spatial orientation tasks (O'Keefe, 1976; Moser et al., 2008). Although instrumental learning involves the use of these sensorimotor and cognitive abilities (e.g., spatial orientation, object recognition, temporal association of environmental cues, etc.), there is still some controversy on the participation of the hippocampus in operant conditioning tasks (Corbit and Balleine, 2000). Nevertheless, previous studies involving chronic lesion (Schmaltz and Isaacson, 1967) and gene expression (Rapanelli et al., 2009, 2011) have pointed out the participation in rats of the hippocampus in the acquisition of instrumental conditioning tasks and in other motor and cognitive aspects related to this type of associational learning, such as food motivation (Tracy et al., 2001) and context–outcome association (Cheung and Cardinal, 2005).
It is commonly accepted that acquired learning abilities are stored in the form of functional and/or structural changes in synaptic efficiency (Hebb, 1949). In this regard, it has been shown recently that the acquisition of a classical conditioning paradigm evoked sustained changes in the strength of the hippocampal CA3–CA1 synapse (Gruart et al., 2006). For this reason, we checked here whether similar changes in strength could take place in the same hippocampal synapse during the acquisition of an instrumental conditioning task. Seminal studies performed in behaving rats have already reported changes in synaptic strength accompanying different behaviors present during the performance of an instrumental task (Leung and Vanderwolf, 1980; Buzsàki et al., 1981). However, not much information is available as to when synaptic changes take place across the acquisition process. Furthermore, changes in the spectral power of theta (3–12 Hz) oscillations in the hippocampus have also been associated with different behavioral displays during instrumental learning tasks (Vanderwolf, 1969; Whishaw and Vanderwolf, 1973; Coenen, 1975; Vinogradova, 1995; Bland and Oddie, 2001; Wyble et al., 2004; Hasselmo, 2005; Sinnamon, 2006) and with the rate of operant task acquisition (Santos et al., 2008). Therefore, we checked whether there were changes in the spectral powers and frequencies of the local field potential (LFP) recording during the performance of an instrumental task and their possible relationships with learning- and behavior-related changes in field EPSPs (fEPSPs) evoked at the CA3–CA1 synapse.
Here we attempted to determine the LFP activity and the electrophysiological changes in synaptic strength taking place at the hippocampal CA3–CA1 synapse during the acquisition and performance of an operant conditioning task, with specific attention to differences in potentiation during appetitive (going to the lever, pressing the lever) and consummatory (going to the feeder, eating the pellet) behaviors. Pyramidal CA1 neurons receive excitatory inputs from pyramidal CA3 cells across the Schaffer collateral system, which make synaptic contact on the apical dendrites of the stratum radiatum and on the basal dendrites in the stratum oriens (Storm-Mathisen and Fonnum, 1972; Hjorth-Simonsen, 1973). To determine the activity of this CA3–CA1 synapse, we apply single or paired pulses to Schaffer collaterals able of evoking fEPSPs at the CA1 area. The magnitude of these fEPSPs was representative of the functional efficacy and/or strength of this synapse. Results indicate that fEPSPs evoked at the CA3–CA1 synapse increased in strength during appetitive behaviors and decreased during consummatory ones. This differentiation took place at the peak of the acquisition process, but these changes were not related to concomitant changes in peak power spectral power and dominant frequency from collected LFP recordings.
Materials and Methods
Animals.
Experiments were performed in C57BL/6 adult (3–5 months old; 28–35 g) male mice obtained from an official supplier (University of Granada Animal House, Granada, Spain). Before surgery, animals were housed in collective cages (<10 per box) and kept on a 12 h light/dark cycle with constant ambient temperature (21 ± 1°C) and humidity (50 ± 7%). Food and water were available ad libitum. All electrophysiological and behavioral studies were performed in accordance with European Union (2003/65/CE) guidelines and Spanish (BOE 252/34367-91, 2005) regulations for the use of laboratory animals in chronic experiments. The experimental protocols were also approved by the local ethics committee of the Pablo de Olavide University (Seville, Spain).
Electrode implantation.
Animals were anesthetized with 0.8–1.5% isoflurane, supplied from a calibrated Fluotec 5 (Fluotec-Ohmeda) vaporizer, at a flow rate of 1–2 L/min oxygen (AstraZeneca) and delivered via a mouse anesthesia mask (David Kopf Instruments). Once anesthetized, animals were implanted with bipolar stimulating electrodes in the right Schaffer collateral/commissural pathway of the dorsal hippocampus (2 mm lateral and 1.5 mm posterior to bregma, and 1–1.5 mm from the brain surface; Paxinos and Franklin, 2001) and with a recording electrode at the ipsilateral CA1 pyramidal layer (1.2 mm lateral and 2.2 mm posterior to bregma, and 0.9–1.2 mm from the brain surface; Paxinos and Franklin, 2001). The final location of the recording electrode was determined by the presence of reliable monosynaptic, positive fEPSPs evoked by paired pulses (40 ms interpulse interval) presented to Schaffer collaterals (Gruart et al., 2006). Electrodes were made from 50 μm, Teflon-coated, tungsten wire (Advent Research). A bare silver wire was affixed to the bone as ground. All the implanted wires were soldered to a four-pin socket (RS Amidata) that was fixed to the skull with two small bone screws and dental cement (Fig. 1A,B). For additional details of this chronic preparation, see Gruart et al. (2006).
Figure 1.
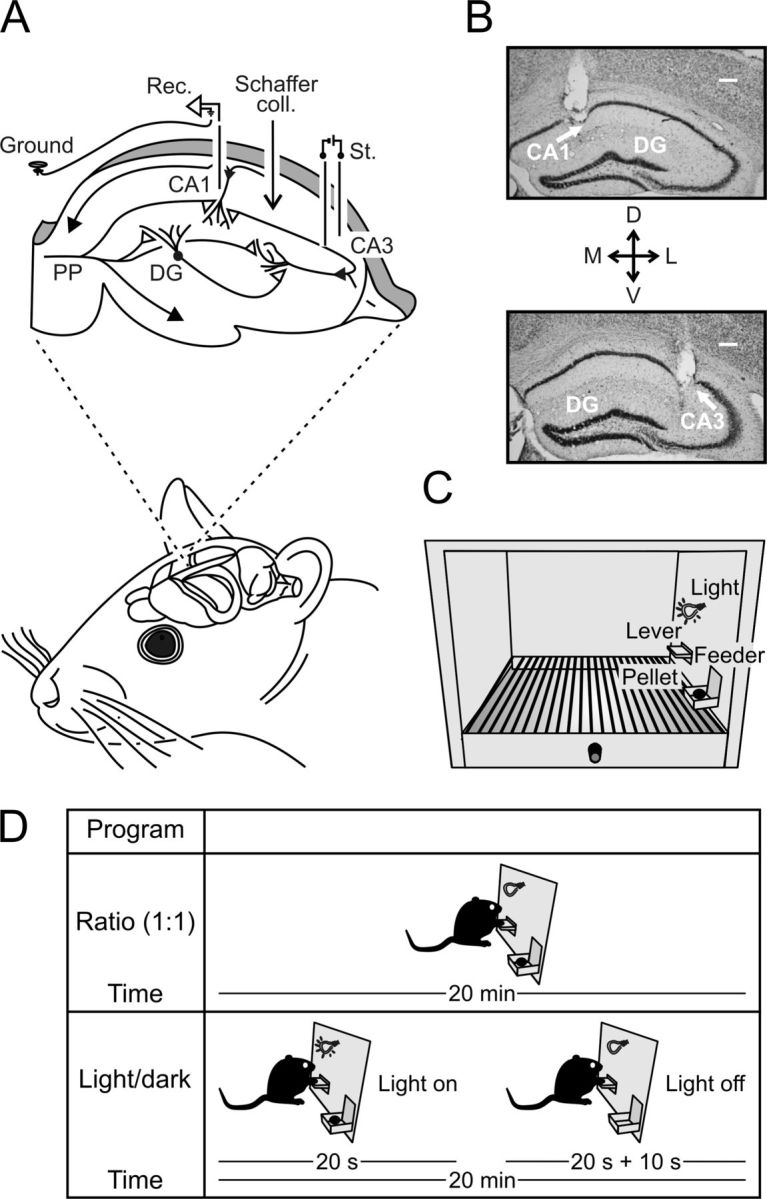
Experimental design. A, Animals were chronically implanted with bipolar stimulating electrodes in the right Schaffer collateral/commissural pathway (Schaffer coll.) and with a recording electrode (Rec.) in the ipsilateral hippocampal CA1 area. PP, Perforant pathway; St., stimulation. B, Representative photomicrographs of recording (top) and stimulating (bottom) electrodes. Scale bar, 100 μm. DG, Dentate gyrus; D, dorsal; L, lateral; M, medial; V, ventral. C, Mice were trained in a Skinner box to press a lever to obtain a food pellet with a fixed-ratio (1:1) schedule. D, Animals were trained with two programs of increasing difficulty. First, they had to acquire a fixed-ratio (1:1) schedule until obtaining, as a criterion, 20 pellets/20 min session for 2 successive days (top diagram). Afterward, animals were transferred to a light/dark paradigm (bottom diagram) in which lever presses were reinforced only when a light bulb was switched on. Lever presses performed during the dark period delayed the lighted period for up to an additional 10 s.
Operant conditioning procedures.
Training took place in a Skinner box module measuring 12.5 × 13.5 × 18.5 cm (Med Associates). The Skinner box was housed within a sound-attenuating chamber (90 × 55 × 60 cm) that was constantly illuminated (19 W lamp) and exposed to a 45 dB white noise (Cibertec). The Skinner box was equipped with a food dispenser from which pellets (MLabRodent Tablet, 20 mg; Test Diet) could be delivered by pressing a lever. When necessary, the Skinner box was provided with a small house light (3 W) mounted over the lever and/or with a Perspex wall separating the lever from the feeder. Before training, mice were handled daily for 7 d and food deprived to 75–85% of their free-feeding weight.
Following standard procedures of our laboratory described previously (Jurado-Parras et al., 2012), animals were trained to press the lever to receive pellets from the feeder using a fixed-ratio (1:1) schedule (Fig. 1D, top). Sessions lasted for 20 min. Animals were maintained on this 1:1 schedule until they reached the selected criterion—namely, until they obtained ≥20 pellets per session for two successive sessions (Madroñal et al., 2010; Jurado-Parras et al., 2012). Once criterion for the 1:1 schedule was reached, additional operant training was performed in a group of animals (n = 12) for 7 d using a light/dark protocol (Fig. 1D, bottom). In this protocol, only lever presses performed by the experimental animal during the lighted period (20 s) were reinforced with a pellet. Lever presses performed during the dark protocol (20 ± 10 s) were not reinforced. In addition, lever presses performed during the dark period restarted the dark protocol for an additional random (1–10 s) time. Other group of animals (n = 9) were overtrained with the same fixed-ratio (1:1) schedule for up to five additional sessions.
Conditioning programs, lever presses, and delivered reinforcements were monitored and recorded by a computer, using a MED-PC program (MED Associates). All operant sessions were recorded with a video-capture system (Sony HDR-SR12E) synchronized to LFP and fEPSP recordings.
Recording and stimulating procedures.
LFP and fEPSPs were recorded with Grass P511 differential amplifiers (Grass Instruments) through a high-impedance probe (2 × 10¹² Ω, 10 pF). Electrical stimuli presented to Schaffer collaterals consisted of 100 μs, square, biphasic pulses presented alone or paired (40 ms interpulse interval). Stimulus intensities ranged from 0.02 to 0.2 mA. For each animal, the stimulus intensity was set well below the threshold for evoking a population spike, usually 35% of the intensity necessary for evoking a maximum fEPSP response (Gureviciene et al., 2004; Gruart et al., 2006). In all cases, the electrical stimulation of the Schaffer collaterals was performed with time intervals ≥30 s, to avoid as much as possible interferences with slower short-term potentiation (augmentation) or depression processes (Zucker and Regehr, 2002).
Animals were presented with paired pulses at the Schaffer collaterals when performing the following behaviors during operant sessions: resting, going to the lever, pressing the lever, going to the feeder, and eating. Going to the lever and going to the feeder were determined with the help of photoelectric cells located 3 cm from the lever and the feeder or at the edge of the Perspex wall. Electrical stimulations left a marker in both the electrical recording and video-capture systems. fEPSPs evoked by stimuli not well synchronized with the aimed behavior were rejected before the quantitative analysis. LFP analyses were performed from recordings collected in the absence of Schaffer collateral stimulations.
Histology.
At the end of the experimental sessions, mice were deeply reanesthetized (sodium pentobarbital, 50 mg/kg) and perfused transcardially with saline and 4% phosphate-buffered paraformaldehyde. Their brains were removed, postfixed overnight at 4°C, and cryoprotected in 30% sucrose in PBS. Sections were obtained in a microtome (Leica) at 50 μm. Selected sections including the dorsal hippocampus were mounted on gelatinized glass slides and stained using the Nissl technique with 0.1% toluidine blue to determine the location of stimulating and recording electrodes.
Data analyses and representations.
LFP, fEPSPs, and 1 V rectangular pulses corresponding to lever presses, pellet delivery, and brain stimulation were stored digitally on a computer through an analog-to-digital converter (CED 1401 Plus; Cambridge Electronics Design). Data were analyzed offline for quantification of animal performance in the Skinner box, LFP, and fEPSPs with the Spike 2 (Cambridge Electronics Design) program and the video-capture system. The slope of evoked fEPSPs was computed as the first derivative (millivolts per seconds) of fEPSP recordings (in millivolts). Three to five successive fEPSPs were averaged, and the mean value of the slope during the rise-time period (i.e., the period of the slope between the initial 10% and the final 10% of the fEPSP) was determined. These computed results were processed for statistical analysis using the IBM SPSS Statistics 18.0. Unless otherwise indicated, data are always represented as the mean ± SEM.
For LFP analysis, we used data collected from sessions in which animals had already reached criterion. LFP epochs lasting 1 s each were collected during the performance of the following behaviors: (1) resting; (2) going to the lever; (3) pressing the lever; (4) going to the feeder; and (5) eating. The analytical procedures, including the frequency domain (using the fast Fourier transform) and the time–frequency (using the short-term Fourier transform) analyses of the LFP recordings, as well as the quantification and representation scripts [for raster representation and power spectral density (PSD) plots], were developed with the help of MATLAB routines (MathWorks).
The time–frequency spectrograms enabled showing the frequency band of pure LFP signal components (Priestley, 1991), because they included an estimation of the short-term, time-localized frequency content of the signals (raw LFP activity). The purpose of estimating the PSD was to detect any periodicity in the LFP data, by observing peaks of spectral power at the frequencies corresponding to these periodicities. We selected the following frequency bands: theta, 3–12 Hz (divided in two sub-bands of 3–8 and 8–12 Hz); beta, 12–30 Hz; and gamma, 30–100 Hz. The algorithm included the analysis of mean values of the spectral powers between the different frequency bands inside each epoch and the analysis of mean values of the spectral powers for the same frequency band between the different epochs. The same procedure was performed for the peak values of the spectral powers inside each frequency band.
LFP results were processed for statistical analysis using the Statistics MATLAB Toolbox (MathWorks) and the IBM SPSS Statistics 18.0. As statistical inference procedures, one-way ANOVA (estimate of variance both within groups and between groups, on the basis of one dependent measure) was used to assess the statistical significance of differences between groups (Hair et al., 1998). The corresponding statistical significance test (that is, the F[(m − 1), (m − 1) × (n − 1), (l − m)] statistics and the resulting probability p < 0.05 in which 0.05 was the maximum predetermined significance level for all the F tests) was performed, with behaviors [(1) resting; (2) going to the lever; (3) pressing the lever; (4) going to the feeder; and (5) eating] as repeated measures (Grafen and Hails, 2002). The orders m (number of behaviors), n (number of mice), and l (number of multivariate observations) and the corresponding degrees of freedom were reported accompanying the F statistic values (Sánchez-Campusano et al., 2007).
In a one-way ANOVA, we compared the means of several groups to test the hypothesis that they are all the same, against the general alternative that they are not all the same. This alternative may sometimes be too general (see an example of this situation in the study by Sánchez-Campusano et al., 2009). We might need information about which pairs of means are significantly different and which are not. A test that can provide such information is called a “multiple comparison.” Multiple comparison procedures were designed to provide an upper bound to the probability that any comparison will incorrectly be found significant (see an application of multiple comparison test in the study by Porras-García et al., 2010). In particular, this procedure was applied for both the means and the peak spectral powers and the corresponding frequency values.
Results
Mice are able to acquire different instrumental conditioning schedules
In a first series of experiments, wild-type mice were trained for the acquisition of an instrumental conditioning with a fixed-ratio (1:1) schedule, i.e., each lever press was reinforced with a food pellet (Fig. 1C,D). Training sessions were performed daily and lasted for 20 min. The criterion for proper acquisition was to press the lever a minimum of 20 times per session for two successive sessions. Animals progressively improved their performance in the Skinner box with the successive sessions (Fig. 2A). Acquired data were best fitted with sigmoid curves (r ≥ 0.98, p < 0.0001; Fig. 2B). In agreement with a previous report (Jurado-Parras et al., 2012), all the experimental animals (n = 11) acquired the operant conditioning task in a mean of 6.5 ± 0.7 (range of 4–10) sessions (Fig. 2B,C). After reaching criterion, mice performed the fixed-ratio (1:1) schedule task consistently, visiting the feeder and getting the pellet after each lever press.
Figure 2.

Acquisition of the operant conditioning task. A, Cumulative records of lever presses from a representative mouse in the Skinner box for three (S1, S3, and S7) 20 min sessions during the acquisition of the fixed-ratio (1:1) schedule task. Slashes indicate reinforcements (food pellets). Criterion level is indicated by the dotted line. B, A representation of the best sigmoid fits (r ≥ 0.974, p < 0.05) to lever presses performed by four representative mice across the 10 conditioning sessions. The dotted line indicates the criterion. The dark sigmoid line represents the mean value for n = 11 mice (r = 0.9904). C, Percentage of mice (n = 11) reaching criterion across training. D, Performance of mice (n = 12) during the light/dark test. The light/dark coefficient (y-axis) was calculated as (number of lever presses during the lighted period − number of lever presses during the dark period)/total number of lever presses. Values are mean ± SEM.
Additional animals (n = 12) that reached criterion for the 1:1 fixed-ratio schedule task in <6 d were further trained in a more complex situation. Animals were rewarded now (again in a 1:1 fixed-ratio schedule) only during the period in which a small light bulb, located over the lever, was switched on. Lighted periods lasted for 20 s and were followed by dark periods during which the animal was not rewarded. Moreover, pressing the lever during the dark period punished the animal with a delay of up to an additional 10 s in the reappearance of the lighted period (Fig. 1D, bottom). As illustrated in Figure 2D, mice acquired this complex task steadily and progressively across the seven training sessions (F(6,66,77) = 22.963; p < 0.001).
These two operant tests demonstrated reliably that mice are able to acquire operant training tasks, making them a suitable experimental model for the study of neural mechanisms underlying instrumental conditioning.
Activity-dependent changes in strength at the hippocampal CA3–CA1 synapse during the performance of the operant conditioning task
In a second set of experiments, well-trained animals (n = 9) were again placed in the Skinner box for 10 additional 20-min sessions, but this time they were connected to the stimulating and recording system (Fig. 3A). Animals were presented with pairs of pulses (40 ms interpulse intervals) in Schaffer collaterals, and the evoked fEPSPs were recorded in the ipsilateral pyramidal CA1 layer. Stimuli were presented during the performance of five selected behaviors: (1) resting in the Skinner box; (2) going to the lever (i.e., crossing the photoelectric cell located 3 cm away from the lever); (3) pressing the lever; (4) going to the feeder (i.e., crossing the photoelectric cell located 3 cm away from the feeder); or (5) eating the rewarded pellet.
Figure 3.
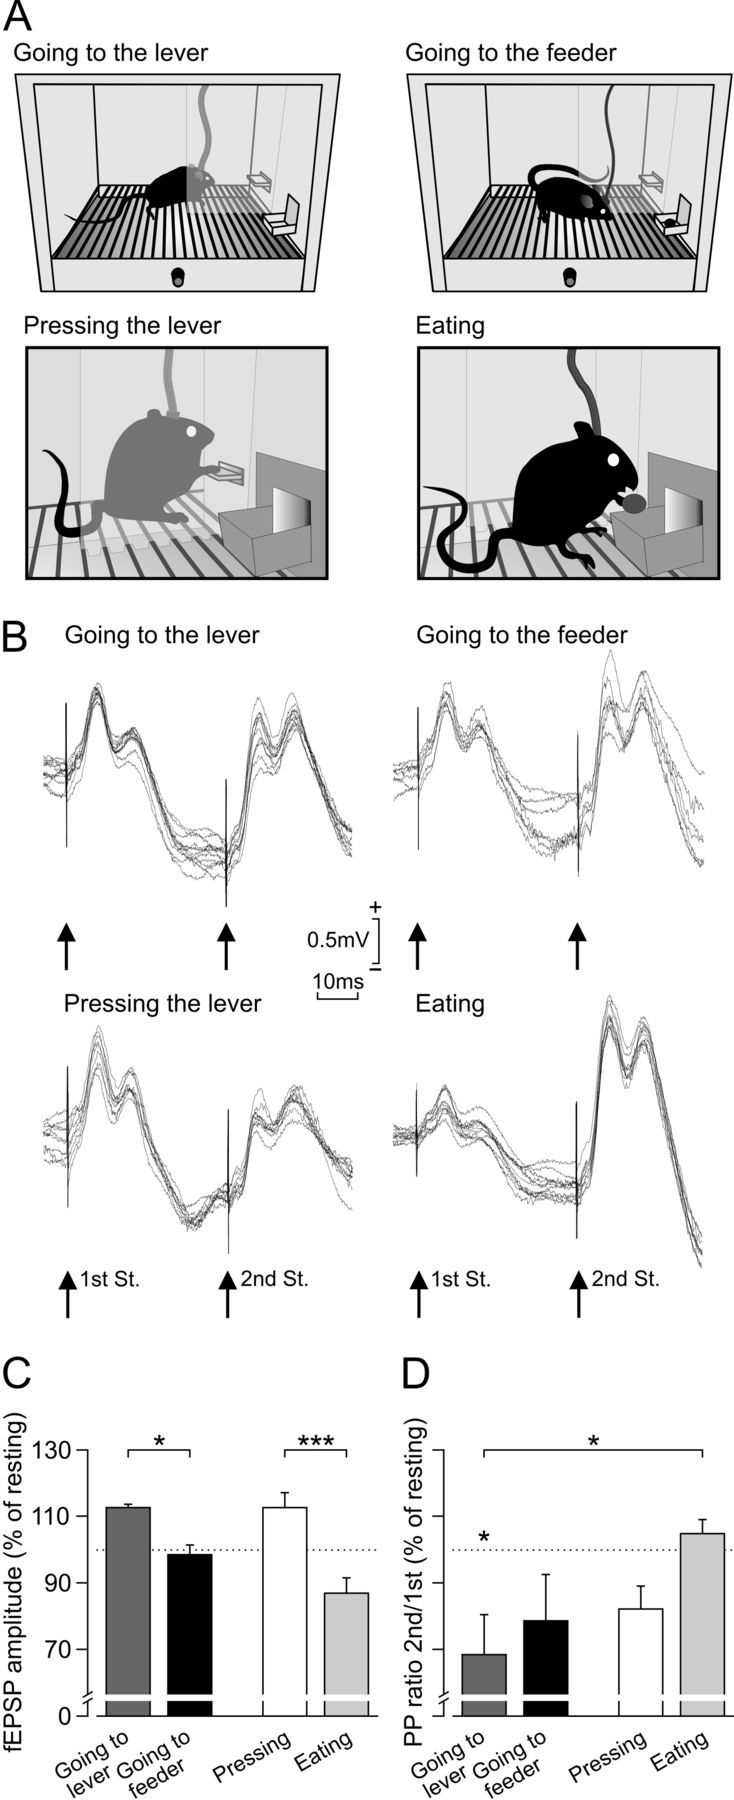
Activity-dependent changes in strength at the hippocampal CA3–CA1 synapse during performance of the operant conditioning task. A, Experimental design. After reaching criterion for a fixed-ratio (1:1) schedule, selected animals (n = 8) were retrained in the same Skinner box, in which a Perspex wall separating the lever from the feeder was included. In this situation, animals were stimulated at the CA3–CA1 synapse when approaching the lever or the feeder (see Materials and Methods), when going around the Perspex wall to approach either the lever or the feeder (2 top diagrams), and when pressing the lever or eating the pellet (2 bottom diagrams). B, Superimposed (n = 10) fEPSPs evoked in the hippocampal CA1 area of a representative animal by paired pulses (40 ms interpulse interval) presented to the ipsilateral Schaffer collaterals during four different behaviors: (1) going to the lever; (2) going to the feeder; (3) pressing the lever; and (4) eating. St., Stimulation. C, D, Relative amplitude of fEPSPs evoked by the first (C) and second (D) of two pulses (40 ms interpulse interval) presented at the CA3–CA1 synapse during four different behaviors: (1) going to the lever; (2) going to the feeder; (3) pressing the lever; and (4) eating. As baseline (100%) values, we used fEPSP amplitudes collected during resting behavior (dotted line in C and D). Significant are indicated. *p < 0.05; ***p < 0.001.
As illustrated in Figure 3B–D, the amplitude of fEPSPs evoked at the CA3–CA1 synapse during typical appetitive (going to the lever, pressing the lever) and consummatory (going to the feeder, eating a pellet) behaviors presented different values. Assigning a value of 100% to the amplitude of fEPSPs evoked during resting (Fig. 3C, dotted line), it can be seen that fEPSPs evoked by the first pulse when going to the lever were significantly larger (112.6 ± 1.3%) than those evoked during going to the feeder (98.5 ± 3.0%) (F(1,7,14) = 17.979, p < 0.001; Fig. 3C). Furthermore, fEPSPs evoked by the first pulse when pressing the lever were significantly larger (112.8 ± 4.7%) than those evoked during eating the pellet (90.0 ± 2.8%) (F(1,8,16) = 17.168, p < 0.001; Fig. 3B). In contrast, fEPSPs evoked by the second pulse presented to Schaffer collaterals were smaller in amplitude when the animal was going to the lever than when it was going to feeder (Fig. 3B).
It has been shown that changes in the paired-pulse ratio (second/first × 100) are indicative of changes in synaptic strength taking place at presynaptic sites (Zucker and Regehr, 2002; Madroñal et al., 2009). In this regard, the paired-pulse ratio computed during resting was not significantly (F(4,28,35) = 3.071, p = 0.028; Fig. 3B,D) different from those evoked when going to the feeder, pressing, or eating, but there were significant different between resting and going to the lever (p = 0.048). In addition, there were significant (p = 0.024) differences in the paired-pulse ratio between going to the lever and eating. These results suggest the involvement of short-term plastic synaptic mechanisms in the changes in fEPSP amplitudes observed for appetitive versus consummatory behaviors.
For comparative purposes, we designed a new recording situation in which animals (n = 8) were stimulated in the same box situation but when attempting to perform two opposite (i.e., appetitive vs consummatory) behaviors. For this, the animal was stimulated at the CA3–CA1 synapse when going around a Perspex wall to either press the lever or collect the rewarded pellet (Fig. 3A, two top panels). Here again, the amplitude of fEPSPs evoked when going to the lever were significantly (p = 0.028, Student's t test) larger (115 ± 5 vs 102 ± 2.5) than those evoked when going to the feeder.
In summary, hippocampal synapses are modulated in their strength as a function of the ongoing behavior. Specifically, appetitive behaviors increase their strength and consummatory behaviors decrease them.
Evolution of fEPSPs evoked at the CA3–CA1 synapse during four selected behaviors across the acquisition of an instrumental conditioning
To determine at what moment the selective change in strength of hippocampal synapses corresponding to appetitive versus consummatory behaviors appears, we repeated the instrumental conditioning task with a fixed-ratio (1:1) schedule in 10 additional animals (Fig. 1D, top). However, this time, animals were stimulated at the CA3–CA1 synapse from the first operant conditioning session until criterion was reached (i.e., two successive sessions with a minimum of 20 lever presses per session). In this case, the collected data were arranged with respect to the first session in which the selected criterion was reached by each animal (Fig. 4A). In this way, we cancel out the observed differences in the acquisition process (Fig. 2B,C), allowing a more coherent processing of data corresponding to fEPSPs evoked at the CA3–CA1 synapse during the different selected behaviors: (1) resting; (2) going to the lever; (3) pressing the lever; (4) going to the feeder; and (5) eating.
Figure 4.

Evolution of fEPSPs evoked at the CA3–CA1 synapse during four selected behaviors across the acquisition of the fixed-ratio (1:1) schedule. A, Acquisition curves collected from mice (n = 10) (Fig. 2B) were readjusted with respect to the first day that each animal reached the selected criterion (dotted line). For analysis, we quantified the amplitudes of fEPSPs evoked at the CA3–CA1 synapse during the performance of the five selected behaviors (resting, going to the lever, pressing the lever, going to the feeder, and eating) for three sessions [before reaching criterion (−1), at criterion (0), and after reaching criterion (1)] and for n ≥ 6 animals. B, Changes in the amplitude of fEPSPs (white dots) evoked at the CA3–CA1 synapse during resting across sessions adjusted with respect to criterion. fEPSP amplitudes are represented with respect to baseline values (100%) collected during the first criterion day (0). Note that no significant changes (p = 0.181) were observed for this behavior across training and with respect to the session reaching criterion. Changes in the fundamental frequencies (black dots) of the power spectra for the resting behavior during the same training sessions are also illustrated. Note that no significant changes (p = 0.89) were observed. C–E, Changes in the amplitude of fEPSPs evoked at the CA3–CA1 synapse for the behaviors going to the lever (C), pressing the lever (D), and eating (E). Significant differences with respect to values collected during the criterion session (0) are indicated. *p < 0.05. F, A comparison of changes evoked in fEPSP amplitudes for an appetitive behavior (i.e., going to the lever; black dots) and a consummatory one (i.e., going to the feeder; black triangles) with respect to values collected for resting in the session during which criterion was reached (0) and sessions immediately before (−1) and after (1). Note that, after criterion, there was a tendency for significant changes (♦p < 0.101) between going to the lever and going to the feeder. G, Same as in F but comparing pressing the lever (white dots) with eating (gray dots;♦p < 0.052). Thus, diamonds indicate that the observations were not statistically different but tended to it. H, I, Evolution of the fundamental frequency of the power spectra for going to the lever (H), pressing the lever (I), and eating (J) across sessions with respect to criterion. Note that no significant changes in the dominant frequency of the power spectra were observed across learning. K, A comparison of changes evoked in fundamental frequencies for an appetitive behavior (i.e., going to the lever) and a consummatory one (i.e., going to the feeder) with respect to values estimated for resting in the session during which criterion was reached (0) and sessions immediately before (−1) and after (1). L, Same than in K but comparing pressing the lever with eating. Again, no significant differences were observed between the fundamental frequencies of LFP recorded at the CA1 area across learning for the two mentioned behaviors.
As shown in Figure 4A, operant data (lever presses) collected from all the animals, and arranged with respect to the first day on which criterion was reached, easily fitted a sigmoid curve (r = 0.9797, p > 0.0001). We assigned a value of 0 to the session in which criterion was reached, giving negative values to sessions preceding it (−4 to −1) and a positive value (1) to the session following it. In this situation, we could follow changes in the amplitude of hippocampal CA3–CA1 fEPSPs evoked during the performance of the five selected behaviors. As a control, we checked the evolution of fEPSPs evoked during resting, taking as a value of 100% the fEPSP amplitudes collected during session 0. As illustrated in Figure 4B, no significant (F(5,45,38) = 1.624, p = 0.181) changes were observed in the amplitude of fEPSPs evoked during resting across the successive training sessions. In contrast, there was a significant (F(2,8,12) = 1.761, p = 0.034) increase in fEPSP amplitude when comparing data collected for going to the lever during (0) and after (1) the criterion day (Fig. 4C). Changes were still more evident (F(2,6,9) = 6.559, p ≤ 0.031) when considering fEPSP amplitudes collected during sessions −1, 0, and 1 when animals were pressing the lever (Fig. 4D), i.e., at the moment of maximum slope of the sigmoid curve representing the acquisition process. fEPSPs evoked during eating did not present any significant (F(2,16,18) = 0.250, p = 0.782) change in amplitude when values collected during session 0 were taken as a (100%) reference (Fig. 4E).
The above results indicate that fEPSPs evoked when going to the lever and when pressing it changed significantly in amplitude around the first day on which criterion was reached, whereas fEPSPs evoked during eating did not present any significant change during this time window, namely, hippocampal changes in synaptic strength were larger at the moment of maximum slope in the acquisition sigmoid curve, with no apparent relationship with consummatory behaviors. However, these sessions (1, 0, and −1) were also the ones when there was a separation in the amplitudes of evoked fEPSPs, when comparing going to the lever with going to the feeder (Fig. 4F) and pressing the lever with eating (Fig. 4G) behaviors. Indeed, the amplitude of fEPSPs evoked during going to the lever and going to the feeder (Fig. 4F) and pressing the lever and eating (Fig. 4G) presented a tendency to became different (p < 0.101 and p < 0.052) during session 1, taking the value of fEPSPs collected for resting during the same session as baseline (100%).
On the whole, it can be proposed that the hippocampus presents a significant increase in synaptic strength in the cognitive processes related to the acquisition of this operant task, which decreases during the subsequent consummatory behaviors accompanying the corresponding reinforcements.
Hippocampal LFP activity corresponding to different behaviors performed during instrumental conditioning
As a complement to the above experiment, we also analyzed the electrocortical activity of the hippocampal CA1 area for different behaviors performed during instrumental conditioning. Recordings were performed in the absence of electrical stimulation of Schaffer collaterals in overtrained (n = 7) animals. LFP epochs (each lasting 1 s) were collected during the performance of the following behaviors: (1) resting; (2) going to the lever; (3) pressing the lever; (4) going to the feeder; and (5) eating. In Figure 5A are represented the averaged (n = 20 times) power spectra of the raw LFP activity recorded during these five behaviors. These power spectra presented significant differences (p < 0.0001) in the peak spectral powers (in percentage) and in their corresponding frequency values (in hertz). Minimum values for frequency and spectral power corresponded to eating, whereas maximum values corresponded to going to the feeder. An additional multiple comparison analysis showed that three behaviors (going to the lever, pressing, and going to the feeder) presented peak spectral powers significantly (F(4,24,170) = 30.3684, p < 0.001) different from those shown by resting. In contrast, eating presented a peak spectral power not statistically different (p = 0.053) from resting (resting, 37.87 ± 1.84%; eating, 30.44 ± 1.76%; Fig. 5B, top set of histograms). In addition, and according to the frequency values observed (Fig. 5B, bottom set of histograms), only one of the behaviors (eating, 6.71 ± 0.37 Hz) presented a significantly (F(4,24,170) = 21.6542, p < 0.001) different dominant frequency from the behavior used as control (resting, 9.03 ± 0.32 Hz).
Figure 5.
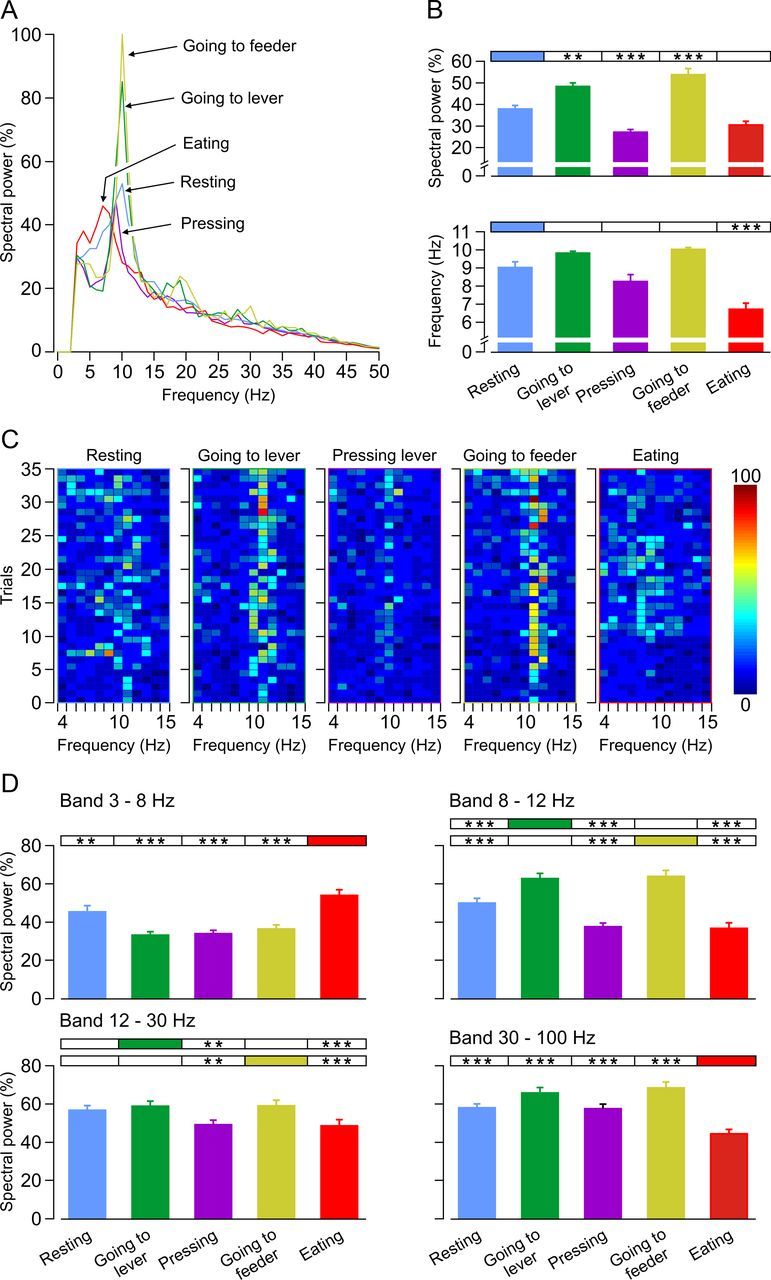
Frequency-domain representation of LFP activity for different behaviors performed in the Skinner box during operant conditioning. A, Power spectra of the raw LFP activity recorded during the following behaviors: (1) resting (blue); (2) going to the lever (green); (3) pressing the lever (purple); (4) going to the feeder (yellow); and (5) eating (red). The five illustrated power spectra presented significant differences (p < 0.0001) for the peak spectral powers (in percentage) and for the corresponding frequency values (in hertz). Note that the minimum value of frequency and spectral power corresponded to eating and the maximum value to going to the feeder. B, According to the multiple comparison analysis, three behaviors (going to the lever, pressing the lever, and going to the feeder) presented peak spectral powers significantly different (p < 0.001) from those for resting behavior. Eating was not statistically different (p = 0.053) from resting (resting, 37.87 ± 1.84%; eating, 30.44 ± 1.76%). However, according to the frequency values, only one of the behaviors (eating, 6.71 ± 0.37 Hz) presented a significantly different dominant frequency (p < 0.001) from the control behavior (resting, 9.03 ± 0.32 Hz). C, Color raster displays of the power spectra (spectral power, in percentage, see the color bar; and frequency, in hertz, see x-axis) across 35 trials (see y-axis) of LFP activities for five different behaviors. Spectral powers presented predominant bands (the high color intensity in the raster representations) in the frequency range of 6–12 Hz. Spectral powers were normalized according to their maximum inter-behavior value. D, Spectral power of the LFP recorded during the five mentioned behaviors for the following selected bands of frequencies: low theta (3–8 Hz), high theta (8–12 Hz), beta (12–30 Hz), and gamma (30–100 Hz). The maximum value of spectral power in the low theta band was presented during eating (F(4,24,170) = 15.954, p < 0.001). In contrast, in the high theta band (8–12 Hz), maximum values of spectral power were presented during going to the lever and going to the feeder, reaching values significantly different (F(4,24,170) = 32.876, p < 0.001) from those collected during the other behaviors. Observed differences for the spectral power peaks in the beta [going to the lever and going to the feeder in relation to pressing (p < 0.01) and eating (p < 0.001)] and gamma [eating in relation to the other four behaviors (p < 0.001)] bands are also indicated. **p < 0.01; ***p < 0.001.
Data shown in Figure 5C are also represented in color raster displays of the power spectra (spectral power, in percentage, see the color bar; and frequency, in hertz, on the x-axis) across 35 trials (i.e., repetitions of the same behavior, on the y-axis) of LFP activities for the five selected behaviors (Fig. 5C). Spectral powers presented predominant bands (the high color intensity in the raster representations) in the frequency range of 6–12 Hz. Taking the results together, it can be noticed that two behaviors (going to the lever and going to the feeder) presented the largest spectral power at a higher frequency, whereas two other behaviors (pressing the lever and eating) presented the largest spectral power at a lower frequency.
To describe the above results with a larger detail, in Figure 5D, we analyzed the spectral power of the LFP recorded during these five behaviors for the following selected bands: low theta (3–8 Hz), high theta (8–12 Hz), beta (12–30 Hz), and gamma (30–100 Hz). The maximum value of spectral power in the low theta band was presented during eating (54.76 ± 3.08%, F(4,24,170) = 15.954, p < 0.001). In contrast, in the high theta band (8–12 Hz) maximum values of spectral power were presented when going to the lever (63.99 ± 2.62%) and going to the feeder (65.57 ± 2.74%), reaching values significantly different (F(4,24,170) = 32.876, p < 0.001) from those collected during the other behaviors. Going to the lever and going to the feeder behaviors also presented significantly larger spectral values of spectral power in the beta band when compared with values presented during pressing the lever (p < 0.01) and eating (p < 0.001) behaviors. Finally, eating presented significantly (p < 0.001) lower values of spectral power in the gamma band than the other four behaviors.
We performed a detailed analysis of LFP changes observed across a complete sequence of behaviors related to the operant sequence of events, namely, going to the lever, pressing the lever, going to the feeder, and eating the rewarded pellet. In Figure 6A is illustrated an LFP recording representative of this behavioral sequence, as well as the time–frequency representation corresponding to this LFP activity. A dominant spectral power corresponding to the theta band of frequencies can be seen across the entire (16 s) time window.
Figure 6.
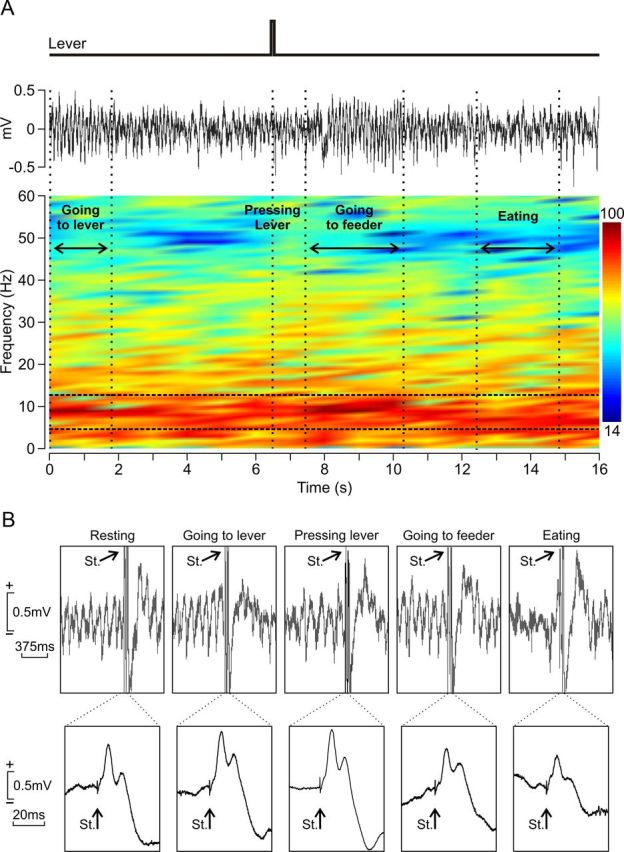
Dynamic changes in LFP activity for different behaviors performed during operant conditioning tasks. A, From top to bottom are illustrated a rectangular pulse indicating the moment when the animal pressed the lever and the LFP activity corresponding to the same time window. Time–frequency representation of this LFP activity is illustrated below. Note a dominant spectral power (in percentage, see the color bar) for the theta band of frequencies (in hertz, see y-axis) for the entire time window (in seconds, see x-axis). Horizontal dashed white lines enclose the 4–12 Hz frequency range (i.e., the theta band), and vertical dashed white lines indicate the different successive behaviors: (1) going to the lever; (2) pressing the lever; (3) going to the feeder; and (4) eating. Note that the spectral power of the theta band reached maximum values when the mouse was going to press the lever and when going to the feeder and a minimum value when the animal was eating. B, Examples of LFP recordings collected from the same animal during the performance of the same set of behaviors, including the presentation of a single stimulus (St.) to the CA3–CA1 synapse. Note that the fEPSP evoked by the single pulse presented to Schaffer collaterals reached maximum values when the mouse was going to press the lever and when pressing the lever and a minimum value when the animal was eating. At the bottom are shown these same fEPSPs averaged (n = 5 times), amplified, and with a larger time base.
Considerable changes in the spectral power of dominant frequencies were observed across the complete behavioral sequence. For example, the spectral power of the theta band reached maximum values when the animal was going to press the lever and when going to the feeder, and a minimum value when the animal was eating (Fig. 6A, raster color display). As illustrated in Figure 6B, fEPSPs evoked at the CA3–CA1 synapse in the same animal and during similar behavioral sequences also presented significant changes. Thus, it can be seen that fEPSPs evoked during going to the lever versus going to the feeder or pressing the lever versus eating (Fig. 3).
Finally, PSD plots for the LFP activity during the five time sequences of behaviors illustrated in Figure 7A–E indicated that pressing and eating behaviors presented peak values in the low theta band (7.34 ± 0.30 and 6.38 ± 0.25 Hz, respectively), whereas going to the lever and going to the feeder behaviors reached maximum PSD values in the high theta band (8.75 ± 0.09 and 8.89 ± 0.16 Hz, respectively). For resting epoch, the mean value of the fundamental frequency was 8.14 ± 0.27 Hz, with a range from 7.87 to 8.41 Hz, i.e., values of frequency that were alternating between low and high theta bands. Finally, Figure 7F illustrates the evolution of mean frequency values for the fundamental spectral powers across the indicated operant conditioning sessions in relation to the mean values of the frequencies during an overtrained session of the experimental mice. As shown, no significant changes in the evolution of mean frequency values across the five overtrained sessions were observed for any of the five behaviors included in the present study.
Figure 7.
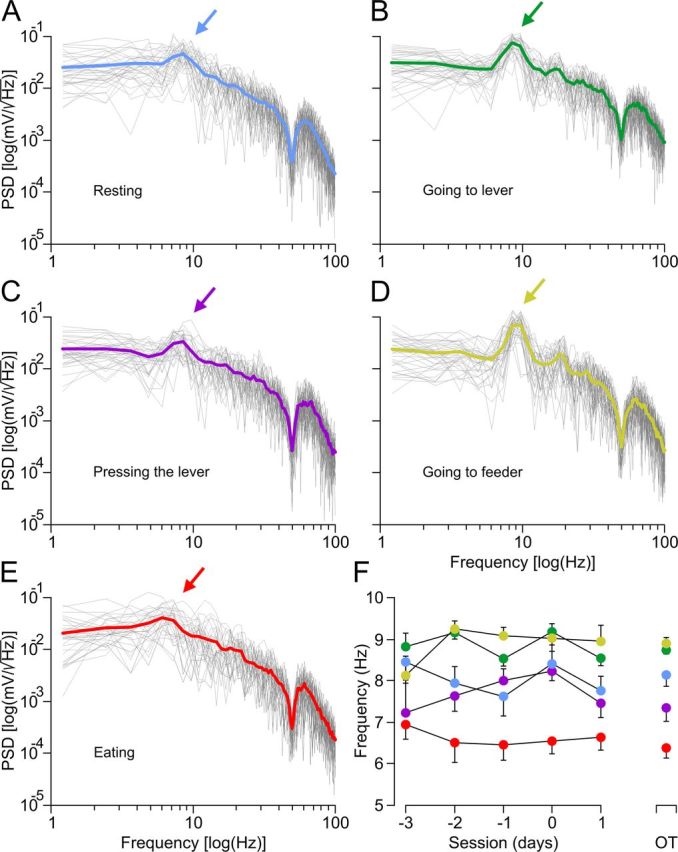
Differences in the PSD of LFP recorded in the hippocampal CA1 area during the performance of five different behaviors in an operant conditioning task. A–E, PSD plots for the LFP activity during the five time sequences of behaviors (resting in A; going to lever in B; pressing in C; going to feeder in D; and eating in E) in overtrained mice. The color arrows (from blue in A to red in E) indicate the fundamental components of the spectra [PSD peaks, in log(mV/ ), see y-axis; and their corresponding frequencies, in log (hertz), see x-axis] for the five behaviors. The mean value of the represented traces is indicated by the colored thick line. The PSD allowed us to determine the periodicity of LFP data by observing the spectral power peak at the frequency corresponding to that periodicity (i.e., the theta band rhythms for the peaks in A–E, see color arrows). F, Evolutions of the mean frequency values for the fundamental spectral powers across the indicated operant conditioning sessions (from −3 to 1 d) in relation to the mean values of the frequencies during an overtrained (OT) session of the experimental animals. Although for all behaviors in overtrained mice the discrete PSDs presented peak values in the theta band, there were significant (p ≤ 0.05) differences among the corresponding frequency values. Thus, eating presented the lower-frequency values (6.38 ± 0.25 Hz), whereas going to the lever (8.75 ± 0.09 Hz) and going to the feeder (8.89 ± 0.16 Hz) presented the largest ones.
It should be remembered here that, as shown in Figures 4, B and H–L, and 7F, no significant changes in the fundamental frequency of the power spectra were observed during the acquisition process, namely, the reported changes in CA3–CA1 synaptic strength took place without a noticeable change in the dominant frequency recorded at the pyramidal CA1 layer for each of the five selected behaviors.
In summary, a detailed analysis of LFP activities recorded in the pyramidal CA1 layer during performance of an operant conditioning further supports a selective modulation of hippocampal activities during locomotor versus stationary behavioral activities independently from the learning stage of the experimental animal.
Discussion
General findings and comments
Results presented here indicate that hippocampal circuits modulate their synaptic strength in relation to ongoing relevant behaviors (going to the lever and pressing the lever versus going to the feeder and eating the pellet) during the performance of instrumental conditioning tasks. These activity-dependent changes in synaptic strength were not necessarily related to spatial constrains (O'Keefe, 1976; Moser et al., 2008) but aimed at behavior (i.e., appetitive vs consummatory; Figs. 3, 4; Tracy et al., 2001). In addition, the LFP recorded in the hippocampal pyramidal CA1 area was modulated in both spectral power and dominant frequency depending on the performed activity. Thus, behaviors involving coordinated motor activities (going to the lever, going to the feeder) increased both the spectral power and the dominant frequency within the theta band, whereas static behaviors (pressing the lever, eating the pellet) decreased them (Wyble et al., 2004; Sinnamon, 2006; Figs. 5–7). The synaptic strength of the hippocampal CA3–CA1 synapse can be specifically modified by the cognitive value of the ongoing behavior (performing an appetitive behavior, such as pressing the lever, versus performing a consummatory behavior as eating the pellet) even if both behaviors involve movement and a definite increase in CA1 spectral power and dominant theta frequency. This interesting finding seems to disagree with previous reports in which synaptic increases in strength were accepted rather as taking place in parallel with a decrease in spectral power (Leung, 1980; Wyble et al., 2000; Manns et al., 2007; Schall et al., 2008).
Mechanisms underlying the changes in synaptic strength for selective behaviors during instrumental learning
Studies of operant conditioning using electrolytic (Schmaltz and Isaacson, 1967; Corbit and Balleine, 2000) or excitotoxic (Corbit et al., 2002) lesions concluded that the retrohippocampus (i.e., entorhinal efferents), but not the hippocampus, is involved in the ability of rats to encode the contingency between actions and their consequences. Other authors have proposed that the hippocampus is preferentially involved in food-related behaviors, such as in the learned inhibition of appetitive behaviors (Tracy et al., 2001) and/or in the formation of context–outcome associations (Cheung and Cardinal, 2005). Instead of using lesion studies, we examined here the electrophysiological changes that take place during the acquisition and the performance of an instrumental task in behaving mice. It is generally assumed that synaptic plasticity in the hippocampus is a phenomenon related to learning and memory (Bliss and Collingridge, 1993; Citri and Malenka, 2008; Neves et al., 2008). Interestingly, our findings suggest that there are no long-lasting synaptic plastic changes at the hippocampal CA3–CA1 synapse during the acquisition of the operant conditioning task, because fEPSPs recorded during the resting behavior did not change accordingly with learning. Apparently, the changes in synaptic strength were restricted rather to the performance of selective behaviors. Thus, in this type of associative learning the hippocampus seems to act in a different manner, such as during the classical conditioning of the nictitating membrane/eyelid responses (Múnera et al., 2001; Gruart et al. 2006; Weible et al., 2006). In addition, the efficacy of the synaptic transmission is modified for selected appetitive and consummatory behaviors during a short time window in trained mice. This facilitation (or disfacilitation) of synaptic strength can perhaps be considered a particular type of short-term synaptic plasticity. There are numerous forms of short-term synaptic plasticity, lasting from a few milliseconds to several minutes (Zucker and Regehr, 2002). This type of plasticity is thought to play an important role in short-term adaptations to sensory inputs, transient changes in behavioral states, and short-lasting forms of memory (Citri and Malenka, 2008). Additional support for this proposal is that, as illustrated in Figure 3, there are some indications that (e.g., because of the differential effects evoked by the paired pulses for appetitive and consummatory behaviors) presynaptic changes could be taking place in the observed changes in synaptic strength (Zucker and Regehr, 2002; Volianskis and Jensen, 2003; Lauri et al., 2007; Madroñal et al., 2009).
Changes in hippocampal LFP activity during instrumental learning
The reported changes in synaptic facilitation or disfacilitation during operant conditioning were accompanied by changes in LFP activity recorded in the hippocampal CA1 area. Up to six prominent LFP patterns have been identified in the hippocampus of the freely moving rodent (mostly rats): four rhythmical (theta, beta, gamma, and ripple waves) and two nonrhythmical (large irregular activity and small irregular-amplitude activity) (Whishaw and Vanderwolf, 1973; Segal, 1978; Leung, 1980; Manns et al., 2007; Santos et al., 2008; Schall et al., 2008). Hippocampal theta rhythms are more evident during voluntary behaviors and translational movements, such as walking, running, jumping, rearing, swimming, digging, manipulation of objects with forelimbs, isolated movements of head or one limb, and shifts of posture (Whishaw and Vanderwolf, 1973; Segal, 1978; Leung, 1980; Wyble et al., 2004; Manns et al., 2007). This theta rhythm is generally absent during more-automatic behaviors, including licking, biting, chewing, tooth chattering, vocalization, shivering, face washing, scratching, pelvic thrusting, defecating, urinating, ejaculating, and piloerection (Whishaw and Vanderwolf, 1973; Segal, 1978; Leung, 1980; Sinnamon, 2006; Manns et al., 2007). Our results in mice are in agreement with those of these studies. Indeed, we show that when mice are going to press the lever or going to the feeder, the spectral power for the high theta rhythm is more prominent than when the animal is eating or pressing the lever. A still-open question is the correlation between these behaviors and the recorded LFP profiles (Hasselmo, 2005; Cruikshank et al., 2012). As proposed by Vinogradova (1995), theta rhythmic activities may represent a sort of temporal window, allowing periods during which excitatory influences are increased and inhibitory processes are minimal, and preventing periods when transmission of the input signals to pyramidal cells is rather limited. Thus, the theta rhythm may be regarded as a mechanism of selective attention, a prerequisite of memory trace formation (Lynch et al., 1988; Cahusac et al., 1991). In our case, the epochs with maximum theta spectral power and frequency were those when the animal was going to the lever and going to the feeder. In both situations, the animal had to be focused on the ongoing behaviors (either going to press the lever to obtain food or going to the feeder to collect the pellet), it being necessary that no stimulus could interfere with the ongoing events. The reported drop in theta band spectral power during food consumption is indicative of a state of hypervigilance to any possible sensory input for purposes of detecting nearby predators (Wyble et al., 2004). In accordance with this proposal, the present results indicate that, when mice are eating pellets, there is a drop in the high theta band spectral power frequency.
Furthermore, we show here the relationships between the changes in efficacy at the CA3–CA1 synapse in relation to both behavioral displays and LFP recordings. Several early studies reported changes in synaptic efficacy during instrumental learning. In general, those reports indicated that the evoked population spike in CA1 neurons after the stimulation of Schaffer collaterals was smaller during behaviors associated with increased theta power than during those associated with nonrhythmical states (Segal, 1978; Leung, 1980; Herreras et al., 1988). However, other early studies reported opposite results, i.e., the amplitude of the CA1 population spike evoked by the stimulation of the commissural pathway was maximum during running and smallest during drinking (Buzsàki et al., 1981). The present results are more in agreement with this latter report, that is, when theta band spectral power and frequency reached higher values, fEPSPs evoked in the CA1 by the stimulation of ipsilateral Schaffer collaterals presented larger amplitudes when going to the lever than fEPSPs recorded when there was a drop in theta band spectral power and dominant frequency, such as during the eating behavior.
According to the present results (Figs. 4B,H–L, 7F) no significant changes in the dominant frequency were observed accompanying the reported changes in synaptic strength during the acquisition of the operant conditioning task. In this regard, an increase in the spectral power of the theta band during the acquisition of a spatial task has been reported (Landfield et al., 1972), a fact not confirmed by others (Masuoka et al., 2006). Nevertheless, those analyses were performed without taking into account the specific behavior been performed during LFP recordings. Santos et al. (2008) reported an increase in the mean theta rhythm during immobility periods correlating with the acquisition rate of an operant task in behaving rats, a fact not confirmed here with the specific PSD calculated for five different behaviors.
In conclusion, here we show that, although the hippocampus seems not to participate in the acquisition of the operant conditioning task, it still plays an active role during the performance of involved behavioral stages, mainly when animals are overtrained and/or reach an appropriate understanding of the involved contextual circumstances. In this regard, it has been reported recently that the dorsal hippocampus conveys relevant information to the ventral tegmental area concerning the context as a whole, enabling a rapid activation of dopaminergic neurons to promote salience attribution to the conditioned contexts (Luo et al., 2011).
Footnotes
This study was supported by Spanish Ministry of Economy and Competitiveness Grants BFU2011-29089 and BFU2011-29286 and Junta de Andalucía Grants BIO122, CVI 2487, and P07-CVI-02686 (A.G. and J.M.D.-.G.) and the Madri.B Project (N.P.C., F.d.-P.). The research leading to these results also received funding from the European Community Seventh Framework Program (FP7/2007-2013) under Grant 201714 (DEVANX). We thank José Antonio Santos for his help in the experimental setup, Noelia García for her help with animal handling and training, and Roger Churchill for his help in manuscript editing.
References
- Bland BH, Oddie SD. Theta band oscillation and synchrony in the hippocampal formation and associated structures: the case for its role in sensorimotor integration. Behav Brain Res. 2001;127:119–136. doi: 10.1016/s0166-4328(01)00358-8. [DOI] [PubMed] [Google Scholar]
- Bliss TV, Collingridge GL. A synaptic model of memory: long-term potentiation in the hippocampus. Nature. 1993;361:31–39. doi: 10.1038/361031a0. [DOI] [PubMed] [Google Scholar]
- Buzsàki G, Grastyàn E, Czopf J, Kellènyi L, Prohaska O. Changes in neuronal transmission in the rat hippocampus during behavior. Brain Res. 1981;225:235–247. doi: 10.1016/0006-8993(81)90833-7. [DOI] [PubMed] [Google Scholar]
- Cahusac PM, Rolls ET, Marriott FH. Potentiation of neuronal responses to natural visual input paired with postsynaptic activation in the hippocampus of the awake monkey. Neurosci Lett. 1991;124:39–43. doi: 10.1016/0304-3940(91)90817-d. [DOI] [PubMed] [Google Scholar]
- Cheung TH, Cardinal RN. Hippocampal lesions facilitate instrumental learning with delayed reinforcement but induce impulsive choice in rats. BMC Neurosci. 2005;6:36. doi: 10.1186/1471-2202-6-36. [DOI] [PMC free article] [PubMed] [Google Scholar]
- Citri A, Malenka RC. Synaptic plasticity: multiple forms, functions, and mechanisms. Neuropsychopharmacol. 2008;33:18–41. doi: 10.1038/sj.npp.1301559. [DOI] [PubMed] [Google Scholar]
- Clarke JR, Cammarota M, Gruart A, Izquierdo I, Delgado-García JM. Plastic modifications induced by object recognition memory processing. Proc Natl Acad Sci U S A. 2010;107:2652–2657. doi: 10.1073/pnas.0915059107. [DOI] [PMC free article] [PubMed] [Google Scholar]
- Coenen AM. Frequency analysis of rat hippocampal electrical activity. Physiol Behav. 1975;14:391–394. doi: 10.1016/0031-9384(75)90053-0. [DOI] [PubMed] [Google Scholar]
- Corbit LH, Balleine BW. The role of the hippocampus in instrumental conditioning. J Neurosci. 2000;20:4233–4239. doi: 10.1523/JNEUROSCI.20-11-04233.2000. [DOI] [PMC free article] [PubMed] [Google Scholar]
- Corbit LH, Ostlund SB, Balleine BW. Sensitivity to instrumental contingency degradation is mediated by the entorhinal cortex and its efferents via the dorsal hippocampus. J Neurosci. 2002;22:10976–10984. doi: 10.1523/JNEUROSCI.22-24-10976.2002. [DOI] [PMC free article] [PubMed] [Google Scholar]
- Cruikshank LC, Singhal A, Hueppelsheuser M, Caplan JB. Theta oscillations reflect a putative neural mechanism for human sensorimotor integration. J Neurophysiol. 2012;107:65–77. doi: 10.1152/jn.00893.2010. [DOI] [PubMed] [Google Scholar]
- Grafen A, Hails R. Modern statistics for the life sciences. New York: Oxford UP; 2002. [Google Scholar]
- Gruart A, Muñoz MD, Delgado-García JM. Involvement of the CA3–CA1 synapse in the acquisition of associative learning in behaving mice. J Neurosci. 2006;26:1077–1087. doi: 10.1523/JNEUROSCI.2834-05.2006. [DOI] [PMC free article] [PubMed] [Google Scholar]
- Gureviciene I, Ikonen S, Gurevicius K, Sarkaki A, van Groen T, Pussinen R, Ylinen A, Tanila H. Normal induction but accelerated decay of LTP in APP + PS1 transgenic mice. Neurobiol Dis. 2004;15:188–195. doi: 10.1016/j.nbd.2003.11.011. [DOI] [PubMed] [Google Scholar]
- Hair JF, Anderson RE, Tatham RL, Black WC. Multivariate data analysis. Upper Saddle River, NJ: Prentice Hall; 1998. [Google Scholar]
- Hasselmo ME. What is the function of hippocampal theta rhythm?—linking behavioral data to phasic properties of field potential and unit recording data. Hippocampus. 2005;15:936–949. doi: 10.1002/hipo.20116. [DOI] [PubMed] [Google Scholar]
- Hebb DO. The organization of behavior. New York: Wiley; 1949. [Google Scholar]
- Herreras O, Solís JM, Muñoz MD, Martín del Río R, Lerma J. Sensory modulation of hippocampal transmission. I. Opposite effects on CA1 and dentate gyrus synapsis. Brain Res. 1988;461:290–302. doi: 10.1016/0006-8993(88)90259-4. [DOI] [PubMed] [Google Scholar]
- Hjorth-Simonsen A. Some intrinsic connections of the hippocampus in the rat: an experimental analysis. J Comp Neurol. 1973;147:145–161. doi: 10.1002/cne.901470202. [DOI] [PubMed] [Google Scholar]
- Jurado-Parras MT, Gruart A, Delgado-García JM. Observational learning in mice can be prevented by medial prefrontal cortex stimulation and enhanced by nucleus accumbens stimulation. Learn Mem. 2012;19:99–106. doi: 10.1101/lm.024760.111. [DOI] [PubMed] [Google Scholar]
- Landfield PW, McGaugh JL, Tusa RJ. Theta rhythm: a temporal correlate of memory storage processes in the rat. Science. 1972;175:87–89. doi: 10.1126/science.175.4017.87. [DOI] [PubMed] [Google Scholar]
- Lauri SE, Palmer M, Segerstrale M, Vesikansa A, Taira T, Collingridge GL. Presynaptic mechanisms involved in the expression of STP and LTP at CA1 synapses in the hippocampus. Neuropharmacology. 2007;52:1–11. doi: 10.1016/j.neuropharm.2006.06.017. [DOI] [PubMed] [Google Scholar]
- Leung LS. Behavior-dependent evoked potentials in the hippocampal CA1 region of the rat. I. Correlation with behavior and LFP. Brain Res. 1980;198:95–117. doi: 10.1016/0006-8993(80)90347-9. [DOI] [PubMed] [Google Scholar]
- Leung LS, Vanderwolf CH. Behavior-dependent evoked potentials in the hippocampal CA1 region of the rat. II. Effect of eserine, atropine, ether and pentobarbital. Brain Res. 1980;198:119–133. doi: 10.1016/0006-8993(80)90348-0. [DOI] [PubMed] [Google Scholar]
- Luo AH, Tahsili-Fahadan P, Wise RA, Lupica CR, Aston-Jones G. Linking contest with reward: a functional circuit from hippocampal CA3 to ventral tegmental area. Science. 2011;333:353–357. doi: 10.1126/science.1204622. [DOI] [PMC free article] [PubMed] [Google Scholar]
- Lynch G, Granger H, Larson J. Neural models of plasticity. San Diego: Academic; 1988. Some possible functions of simple cortical networks suggested by computer modeling; pp. 329–362. [Google Scholar]
- Madroñal N, Gruart A, Delgado-García JM. Differing presynaptic contributions to LTP and associative learning in behaving mice. Front Behav Neurosci. 2009;3:7. doi: 10.3389/neuro.08.007.2009. [DOI] [PMC free article] [PubMed] [Google Scholar]
- Madroñal N, López-Aracil C, Rangel A, del Río JA, Delgado-García JM, Gruart A. Effects of enriched physical and social environments on motor performance, associative learning, and hippocampal neurogenesis in mice. PLoS One. 2010;5:e11130. doi: 10.1371/journal.pone.0011130. [DOI] [PMC free article] [PubMed] [Google Scholar]
- Manns JR, Zilli EA, Ong KC, Hasselmo ME, Eichenbaum H. Hippocampal CA1 spiking during encoding and retrieval: relation to theta phase. Neurobiol Learn Mem. 2007;87:9–20. doi: 10.1016/j.nlm.2006.05.007. [DOI] [PubMed] [Google Scholar]
- Masuoka T, Fujii Y, Kamei C. Participation of the hippocampal theta rhythm in memory formation for an eight-arm radial maze task in rats. Brain Res. 2006;1103:159–163. doi: 10.1016/j.brainres.2006.04.003. [DOI] [PubMed] [Google Scholar]
- Moser EI, Kropff E, Moser MB. Place cells, grid cells, and the brain's spatial representation system. Rev Neurosci. 2008;31:69–89. doi: 10.1146/annurev.neuro.31.061307.090723. [DOI] [PubMed] [Google Scholar]
- Múnera A, Gruart A, Muñoz MD, Fernández-Mas R, Delgado-García JM. Hippocampal pyramidal cell activity encodes conditioned stimulus predictive value during classical conditioning in alert cats. J Neurophysiol. 2001;86:2571–2582. doi: 10.1152/jn.2001.86.5.2571. [DOI] [PubMed] [Google Scholar]
- Neves G, Cooke SF, Bliss TV. Synaptic plasticity, memory and the hippocampus: a neural network approach to causality. Nat Rev Neurosci. 2008;9:65–75. doi: 10.1038/nrn2303. [DOI] [PubMed] [Google Scholar]
- O'Keefe J. Place units in the hippocampus of the freely moving rat. Exp Neurol. 1976;51:78–109. doi: 10.1016/0014-4886(76)90055-8. [DOI] [PubMed] [Google Scholar]
- Paxinos G, Franklin KB. The mouse brain in stereotaxic coordinates. London: Academic; 2001. [Google Scholar]
- Porras-García E, Sánchez-Campusano R, Martínez-Vargas D, Domínguez-del-Toro E, Cendelín J, Vozeh F, Delgado-García JM. Behavioral characteristics, associative learning capabilities, and dynamic association mapping in an animal model of cerebellar degeneration. J Neurophysiol. 2010;104:346–365. doi: 10.1152/jn.00180.2010. [DOI] [PubMed] [Google Scholar]
- Priestley MB. Spectral analysis and time series. London: Academic; 1991. [Google Scholar]
- Rapanelli M, Frick LR, Zanutto BS. Differential gene expression in the rat hippocampus during learning of an operant conditioning task. Neuroscience. 2009;163:1031–1038. doi: 10.1016/j.neuroscience.2009.07.037. [DOI] [PubMed] [Google Scholar]
- Rapanelli M, Frick LR, Zanutto BS. Learning an operant conditioning task differentially induces gliogenesis in the medial prefrontal cortex and neurogenesis in the hippocampus. PLoS One. 2011;6:e14713. doi: 10.1371/journal.pone.0014713. [DOI] [PMC free article] [PubMed] [Google Scholar]
- Rossato JI, Bevilaqua LR, Myskiw JC, Medina JH, Izquierdo I, Cammarota M. On the role of hippocampal protein synthesis in the consolidation and reconsolidation of object recognition memory. Learn Mem. 2007;14:36–46. doi: 10.1101/lm.422607. [DOI] [PMC free article] [PubMed] [Google Scholar]
- Sánchez-Campusano R, Gruart A, Delgado-García JM. The cerebellar interpositus nucleus and the dynamic control of learned motor responses. J Neurosci. 2007;27:6620–6632. doi: 10.1523/JNEUROSCI.0488-07.2007. [DOI] [PMC free article] [PubMed] [Google Scholar]
- Sánchez-Campusano R, Gruart A, Delgado-García JM. Dynamic associations in the cerebellar-motoneuron network during motor learning. J Neurosci. 2009;29:10750–10763. doi: 10.1523/JNEUROSCI.2178-09.2009. [DOI] [PMC free article] [PubMed] [Google Scholar]
- Santos LM, Dzirasa K, Kubo R, Silva MT, Ribeiro S, Sameshima K, Valle AC, Timo-Iaria C. Baseline hippocampal theta oscillation speeds correlate with rate of operant task acquisition. Behav Brain Res. 2008;190:152–155. doi: 10.1016/j.bbr.2008.02.032. [DOI] [PubMed] [Google Scholar]
- Schall KP, Kerber J, Dickson CT. Rhythmic constraints on hippocampal processing: state and phase-related fluctuations of synaptic excitability during theta and the slow oscillation. J Neurophysiol. 2008;99:888–899. doi: 10.1152/jn.00915.2007. [DOI] [PubMed] [Google Scholar]
- Schmaltz LW, Isaacson RL. Effect of bilateral hippocampal destruction on the acquisition and extinction of an operant response. Physiol Behav. 1967;2:291–298. doi: 10.1016/0031-9384(72)90228-4. [DOI] [PubMed] [Google Scholar]
- Segal M. A correlation between hippocampal responses to interhemispheric stimulation, hippocampal slow rhythmic activity and behaviour. Electroencephalogr Clin Neurophysiol. 1978;45:409–411. doi: 10.1016/0013-4694(78)90192-x. [DOI] [PubMed] [Google Scholar]
- Sinnamon HM. Decline in hippocampal theta activity during cessation of locomotor approach sequences: amplitude leads frequency and relates to instrumental behavior. Neuroscience. 2006;140:779–790. doi: 10.1016/j.neuroscience.2006.02.058. [DOI] [PubMed] [Google Scholar]
- Storm-Mathisen J, Fonnum F. Localization of transmitter candidates in the hippocampal region. Prog Brain Res. 1972;36:41–58. doi: 10.1016/S0079-6123(08)62507-8. [DOI] [PubMed] [Google Scholar]
- Tracy AL, Jarrard LE, Davidson TL. The hippocampus and motivation revisited: appetite and activity. Behav Brain Res. 2001;127:13–23. doi: 10.1016/s0166-4328(01)00364-3. [DOI] [PubMed] [Google Scholar]
- Vanderwolf CH. Hippocampal electrical activity and voluntary movement in the rat. Electroencephalogr Clin Neurophysiol. 1969;26:407–418. doi: 10.1016/0013-4694(69)90092-3. [DOI] [PubMed] [Google Scholar]
- Vinogradova OS. Expression, control, and probable functional significance of the neuronal theta-rhythm. Prog Neurobiol. 1995;45:523–583. doi: 10.1016/0301-0082(94)00051-i. [DOI] [PubMed] [Google Scholar]
- Volianskis A, Jensen MS. Transient and sustained types of long-term potentiation at the CA1 area of the rat hippocampus. J Physiol. 2003;550:459–492. doi: 10.1113/jphysiol.2003.044214. [DOI] [PMC free article] [PubMed] [Google Scholar]
- Weible AP, O'Reilly JA, Weiss C, Disterhoft JF. Comparisons of dorsal and ventral hippocampus cornu ammonis region 1 pyramidal neuron activity during trace eye-blink conditioning in the rabbit. Neuroscience. 2006;141:1123–1137. doi: 10.1016/j.neuroscience.2006.04.065. [DOI] [PubMed] [Google Scholar]
- Whishaw IQ, Vanderwolf CH. Hippocampal LFP and behavior: changes in amplitude and frequency of RSA (theta rhythm) associated with spontaneous and learned movement patterns in rats and cats. Behav Biol. 1973;8:461–484. doi: 10.1016/s0091-6773(73)80041-0. [DOI] [PubMed] [Google Scholar]
- Whitlock JR, Heynen AJ, Shuler MG, Bear MF. Learning induces long-term potentiation in the hippocampus. Science. 2006;313:1093–1097. doi: 10.1126/science.1128134. [DOI] [PubMed] [Google Scholar]
- Wyble BP, Linster C, Hasselmo ME. Size of CA1-evoked synaptic potentials is related to theta rhythm phase in rat hippocampus. J Neurophysiol. 2000;83:2138–2144. doi: 10.1152/jn.2000.83.4.2138. [DOI] [PubMed] [Google Scholar]
- Wyble BP, Hyman JM, Rossi CA, Hasselmo ME. Analysis of theta power in hippocampal LFP during bar pressing and running behavior in rats during distinct behavioral contexts. Hippocampus. 2004;14:662–674. doi: 10.1002/hipo.20012. [DOI] [PubMed] [Google Scholar]
- Zucker RS, Regehr WG. Short-term synaptic plasticity. Annu Rev Physiol. 2002;64:355–405. doi: 10.1146/annurev.physiol.64.092501.114547. [DOI] [PubMed] [Google Scholar]