Abstract
To elucidate the mechanism of deep brain stimulation (DBS) targeting the internal segment of the globus pallidus (GPi), neuronal activity of the GPi and the external segment of the globus pallidus (GPe) was examined during local electrical microstimulation in normal awake monkeys. Single-pulse stimulation of the GPi evoked brief inhibition in neighboring GPi neurons, which was mediated by GABAA receptors. High-frequency stimulation of the GPi completely inhibited spontaneous firings of GPi neurons by activation of GABAA and GABAB receptors. Local single-pulse stimulation directly excited some GPi neurons. Such directly evoked responses were also inhibited by high-frequency stimulation through GABAA receptors. In contrast to the GPi, single-pulse and high-frequency stimulation of the GPe induced complex responses composed of GABAergic inhibition and glutamatergic excitation in neighboring GPe neurons. Cortically evoked triphasic responses of GPi neurons were completely inhibited during high-frequency GPi stimulation. These findings suggest that GPi-DBS dissociates inputs and outputs in the GPi by intense GABAergic inhibition and disrupts information flow through the GPi.
Introduction
Applying high-frequency electrical stimulation to subcortical structures, known as deep brain stimulation (DBS), has been accepted as a successful surgical therapy for a variety of neurological diseases, especially movement disorders (Wichmann and DeLong, 2006; Vitek, 2008). DBS targeting the subthalamic nucleus (STN) and the internal segment of the globus pallidus (GPi) has been largely used for treatment of Parkinson's disease (Limousin et al., 1995; Obeso et al., 2001). GPi-DBS has marked effects on improvement of dystonic symptoms (Coubes et al., 2004; Vidailhet et al., 2007; Ostrem and Starr, 2008). Despite the successful use of DBS, the exact mechanism of the effectiveness of DBS remains unclear and is still under debate: does DBS inhibit or excite local neuronal elements?
Since DBS gives rise to similar effects to those of lesions, it was originally considered to inhibit local neuronal elements. Actually, GPi recording during human stereotactic surgery (Dostrovsky et al., 2000; Wu et al., 2001; Lafreniere-Roula et al., 2010) and that in the parkinsonian monkey (Boraud et al., 1996) showed that GPi-DBS inhibited local neuronal firings. Similarly, STN-DBS induced inhibition in neighboring STN neurons (Filali et al., 2004) and reduced activity of the GPi and substantia nigra pars reticulata (SNr) (Benazzouz et al., 1995; Maltête et al., 2007). On the other hand, other reports suggested that DBS excited local neuronal elements: STN-DBS increased activity of GPi neurons through the excitatory STN-GPi projections (Hashimoto et al., 2003; Galati et al., 2006; Reese et al., 2011); GPi-DBS reduced activity of thalamic neurons through the inhibitory GPi-thalamic projections (Anderson et al., 2003; Pralong et al., 2003; Montgomery, 2006). Other reports indicated complex responses: GPi-DBS induced excitatory and inhibitory multiphase responses in GPi neurons and changed their firing patterns (Bar-Gad et al., 2004; McCairn and Turner, 2009; Leblois et al., 2010).
In the present study, to elucidate the mechanisms of GPi-DBS, a pair of recording and stimulating electrodes was inserted into the GPi of normal monkeys, and responses of GPi neurons to single-pulse and repetitive high-frequency local GPi microstimulation were analyzed in awake states. Activity of the external segment of the globus pallidus (GPe) neurons in response to local GPe stimulation was also examined for comparison. To analyze the responses, receptor blockers were applied in the vicinity of recorded neurons. Finally, motor cortical stimulation was applied simultaneously with GPi-DBS. Motor cortical stimulation induces triphasic responses composed of early excitation followed by inhibition and late excitation in the GPi. Early excitation is mediated by the cortico-STN-GPi hyperdirect pathway, whereas inhibition and late excitation are mediated by the cortico-striato-GPi direct and cortico-striato-GPe-STN-GPi indirect pathways, respectively (Nambu et al., 2000, 2002b; Tachibana et al., 2008). During voluntary movements, neuronal signals originating in the cortex are considered to be transmitted through these pathways, reach the GPi, and control movements (Mink, 1996; Nambu et al., 2002b). Thus, cortically evoked responses can give us clues to understand how GPi-DBS interferes with the information flow through the cortico-basal ganglia pathways. Based on these electrophysiological findings, we will discuss the mechanism of GPi-DBS.
Materials and Methods
Four monkeys (three Japanese and one Rhesus) of either sex, weighing 6.5–8.5 kg were used. The experimental protocols were approved by the Institutional Animal Care and Use Committee of National Institutes of Natural Sciences, and all experiments were conducted according to the guidelines of the National Institutes of Health Guide for the Care and Use of Laboratory Animals. Before experiments, the monkeys were trained daily to sit in a monkey chair quietly.
Surgery.
Under general anesthesia with ketamine hydrochloride (5–8 mg/kg body weight, i.m.), xylazine hydrochloride (0.5–1 mg/kg, i.m.), and sodium pentobarbital (25 mg/kg, i.v.), the monkeys received a surgical operation to fix their heads painlessly in a stereotaxic frame attached to a monkey chair (Nambu et al., 2000, 2002a). Screws and pipes made of polyether ether ketone, which are compatible with magnetic resonance imaging, were used. All surgical procedures were performed under aseptic conditions, and arterial oxygen saturation and heart rate were continuously monitored. Ketamine hydrochloride and xylazine hydrochloride were additionally administered, when necessary. Antibiotics and analgesics (ketoprofen) were injected (i.m.) after surgery.
Two to three days after the first surgery, the skull over the primary motor cortex (M1) and the supplementary motor area (SMA) was removed under light anesthesia with ketamine hydrochloride (5–8 mg/kg, i.m.) and xylazine hydrochloride (0.5–1 mg/kg, i.m.). The forelimb regions of the M1 and SMA were identified by electrophysiological methods (Nambu et al., 2000, 2002a). According to this mapping, three pairs of bipolar stimulating electrodes made of a 125-μm-diameter Teflon-coated stainless wire were implanted chronically into the M1 and SMA: two pairs into the forelimb region of the M1 and one pair into the forelimb region of the SMA. Exposed areas were covered with acrylic resin, with the exception of the orofacial area of the M1 (10–15 mm in diameter), which was left uncovered for access to the GPi and GPe ipsilateral to the M1 and SMA. A rectangular plastic chamber covering the hole was fixed with acrylic resin.
Recording of pallidal neuronal activity during local microstimulation.
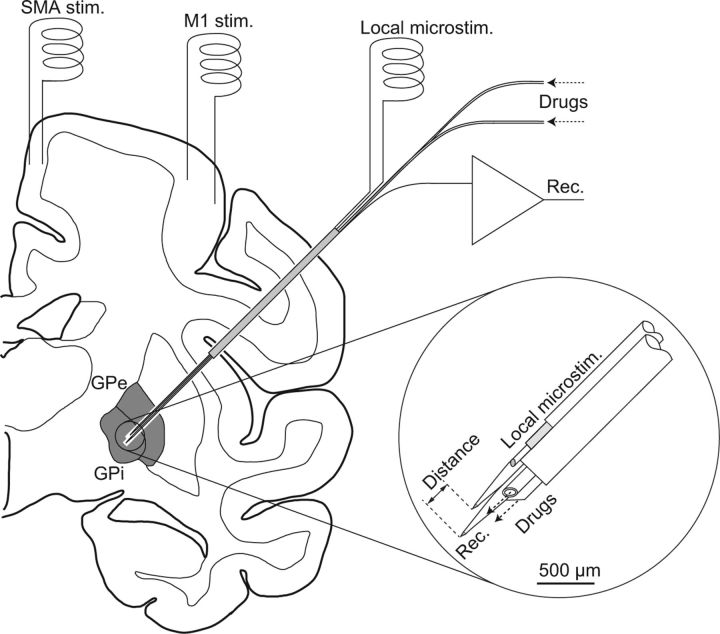
Three to four days after implantation of the stimulating electrodes, neuronal recording in the awake states was started. During the experimental session, the body weight and food intake of the monkeys were monitored daily. A glass-coated Elgiloy-alloy microelectrode (0.8–1.5 MΩ at 1 kHz) was used for single-unit recording of GPi and GPe neurons. A bipolar stimulating microelectrode consisting of a glass-coated Elgiloy-alloy microelectrode and a 50-μm-diameter Teflon-coated tungsten wire (California Fine Wire Company), which was glued to the surface of the Elgiloy-alloy electrode (intertip distance, 0.5 mm; 0.2–0.5 MΩ at 1 kHz), was used for local microstimulation (Fig. 1, inset). For longer repetitive stimulation, a low-impedance (5–8 kΩ at 1 kHz) electrode consisting of two 76-μm-diameter Teflon-coated platinum wires (Nilaco) with 0.5-mm-length bare tips, which was glued to the inside of a 25-gauge stainless steel tube (intertip distance, 0.8 mm), was used for local bipolar stimulation in some neurons. The recording and stimulating electrodes were held inside an 18-gauge guide tube by a multielectrode hydraulic microdrive system (MO-98D, Narishige Scientific Instrument). A small incision in the dura mater was made with local application of lidocaine. The recording and stimulating electrodes together with the guide tube were inserted obliquely (45° from vertical in the frontal plane) into the brain (Fig. 1). The position of each electrode was controlled individually by hydraulic microdrives. The distance between the recording and stimulating electrodes was calculated as the difference in the depth along the track of the electrodes (Fig. 1, inset).
Figure 1.
Schematic drawing of the experimental setup. Bipolar stimulating electrodes were implanted chronically into the forelimb regions of the primary motor cortex (M1) and supplementary motor area (SMA). Recording and stimulating electrodes were inserted together obliquely (45° from vertical) into the internal (GPi) and external (GPe) segments of the globus pallidus through a guide tube. The recording electrode consisted of a glass-coated Elgiloy-alloy microelectrode and two silica tubes for drug delivery (inset). The stimulating electrode for local bipolar microstimulation consisted of a glass-coated Elgiloy-alloy microelectrode and a Teflon-coated tungsten wire.
Signals from the recording and stimulating electrodes were amplified (×5000) and filtered (200–5000 Hz). Waveforms of the action potentials were continuously monitored with an oscilloscope. The GPi and GPe were identified by the depth profile of the electrode penetrations and their sustained spontaneous firing. Unit activity was isolated and converted to digital pulses using a homemade time-amplitude window discriminator. The digital pulses sampled at 2 kHz and the analog waveforms sampled at 20–50 kHz were stored on a computer for off-line analysis. Single-pulse (monophasic, 300 μs pulse width, 10–90 μA strength) and repetitive (monophasic, 300 μs pulse width, 10–90 μA strength, 20–100 Hz, 10 pulses) local microstimulations were applied through the bipolar stimulating electrodes every 1.4 s, and neuronal responses of GPi/GPe neurons were examined. Other parameters, such as shorter pulse width (50–200 μs), higher stimulus frequency (130–160 Hz), and longer pulse train (50–200 pulses and continuous), were also used in some neurons. The local stimulation produced artifacts, which consist of a saturation period of the amplifier and a large deflection of the baseline, and last for 1.5–3 ms. To examine short-latency responses during the artifacts, the analog waveforms with lower gain (×1000) and a lower cutoff frequency (15–5000 Hz) were sampled at 50 kHz and stored in some neurons. Responses to the bipolar cortical stimulation (monophasic single-pulse, 300 μs pulse width, 0.5–0.6 mA strength) through the electrodes implanted in the M1 and SMA were also examined.
Drug injection in the vicinity of recorded pallidal neurons.
For single-unit recording of GPi/GPe neurons in combination with local application of drugs, an electrode assembly consisting of a glass-coated Elgiloy-alloy microelectrode for unit recording and two silica tubes for drug delivery was inserted instead of a simple Elgiloy-alloy recording microelectrode (Kita et al., 2004; Tachibana et al., 2008) (Fig. 1, inset). The following drugs were dissolved in saline and injected (total volume of 0.2–0.6 μl of each drug, at a rate of 0.03 μl/min): (1) a mixture of (±)-3-(2-carboxypiperazin-4-yl)propyl-1-phosphonic acid (CPP, the NMDA receptor antagonist, 1–2 mm; Sigma) and 1,2,3,4-tetrahydro-6-nitro-2,3-dioxo-benzo[f]quinoxaline-7-sulfonamide disodium (NBQX, the AMPA/kainate receptor antagonist, 1–2 mm; Sigma); (2) gabazine (the GABAA receptor antagonist, 1–2 mm; Sigma); (3) [3-[[(3,4-dichlorophenyl)methyl]amino]propyl] (diethoxymethyl) phosphinic acid (CGP52432, the GABAB receptor antagonist, 0.5–1.0 mm; Tocris Bioscience). Spontaneous discharges and responses to the local GPi/GPe microstimulation before and after drug injection were examined. Intrapallidal injection of saline alone altered neither the spontaneous firing nor response patterns to the local stimulation. Our previous study showed that the effective radius of the drugs was estimated to be <1 mm, and that these drugs effectively blocked the corresponding receptors (Kita et al., 2004, 2006; Tachibana et al., 2008). The experiment of drug injection was performed once per recording day.
Data analysis.
Spontaneous discharge rates were calculated from continuous digitized recordings for 50 s. Responses of GPi/GPe neurons evoked by the local microstimulation were examined by the following methods: (1) Stimulus artifacts were removed by the template subtraction method (Wichmann, 2000; Hashimoto et al., 2002). A template of artifacts is constructed by averaging traces including artifacts at stimulus onset. Then, the artifact template was subtracted from the individual traces. However, constant-latency responses, such as directly evoked spikes, become a part of the artifact template in this procedure and may be overlooked. Thus, (2) raw traces with lower gain (×1000) and a lower cutoff frequency (15–5000 Hz) were carefully analyzed. (3) Peristimulus time histograms (PSTHs; bin width of 1.0 ms) were constructed for 100 stimulus trials from digitized recordings. The mean ± SD values of the discharge rate during the 100-ms period preceding onset of stimulation were calculated for each PSTH and considered as the baseline discharge rate. Changes in neuronal activity in response to stimulation (i.e., excitation and inhibition) were judged significant if the discharge rate during at least two consecutive bins (2 ms) reached a significance level of p < 0.05 (one-tailed t test) (Nambu et al., 2000; Chiken et al., 2008; Tachibana et al., 2008). The latency of each response was defined as the time at which the first bin exceeded this level. The responses were judged to end when two consecutive bins fell below the significance level. The end point was determined as the time at which the last bin exceeded this level. As the response patterns evoked by single-pulse microstimulation were simple, their amplitude was defined as the number of spikes during the significant response minus that of the baseline discharge in the 100-trial PSTH (i.e., the area of the response). If no significant changes were found, the amplitude was set to be zero. The post-train responses, which outlasted the end of repetitive stimulus period, were evaluated by the same method. On the other hand, repetitive stimulation evoked complex responses composed of excitation and inhibition. Their amplitude was defined as the difference between the mean discharge rate during repetitive stimulation and the baseline discharge rate. With both methods, positive and negative mean excitatory and inhibitory responses, respectively. Responses to cortical stimulation were also examined by the similar methods.
Histology.
In the final experiment, several sites of neuronal recordings were marked by passing a cathodal direct current (20 μA for 30 s) through the recording electrode. The monkeys were anesthetized deeply with sodium pentobarbital (50 mg/kg, i.v.) and perfused transcardially with 0.1 m PBS (pH 7.3) followed by 10% formalin in 0.1 m phosphate buffer, the same buffer containing 10% sucrose, and then 30% sucrose. The brains were removed immediately and saturated with the same buffer containing 30% sucrose. They were cut into frontal 60-μm-thick sections on a freezing microtome. The sections were mounted onto gelatin-coated glass slides, stained with 0.7% neutral red, dehydrated, and coverslipped. The sections were observed under a light microscope, and the recording sites were reconstructed according to the lesions made by current injection and traces of electrode tracks. The sites of stimulation in the M1 and SMA were also examined histologically.
Results
Responses of GPi neurons evoked by local stimulation
Responses to local GPi single-pulse stimulation were examined in 48 GPi neurons (spontaneous discharge rate, 68.0 ± 31.4 Hz, mean ± SD) as shown in Figure 2. Stimulus artifacts consisting of a saturation period and a baseline deflection lasted for 1.5–3 ms and hindered detection of spikes for the period (Fig. 2A1, top). After removing the stimulus artifacts by the template subtraction method (Fig. 2A1, bottom), the dead time was reduced to 0.5 ± 0.4 ms, which is comparable to those reported previously in the GPi/GPe and STN (Bar-Gad et al., 2004; Meissner et al., 2005), and traces could be examined immediately after the short saturation period. Local single-pulse stimulation (up to 90 μA) inhibited spontaneous discharges of 46 GPi neurons (96%) for 4–95 ms at short latencies (2.8 ± 1.1 ms, Fig. 2A). Among 46 GPi neurons, six neurons (13%) exhibited short-latency (1.6 ± 0.6 ms) weak excitation preceding the inhibition (Fig. 2B), and two neurons (4%) showed weak excitation after the inhibition (data not shown). The duration of inhibition was increased with increasing stimulus intensity as exemplified in Figure 2A2, A3 (28.9 ± 15.9 ms at 30 μA; 40.7 ± 14.0 ms at 50 μA; n = 7; p < 0.05, paired t test). The relationship between the duration of inhibition, the stimulus intensity, and the distance between the stimulating electrode and the recorded neuron is shown in Figure 2C. The duration of inhibition was decreased with increasing the distance. Stimulation evoked inhibition in neurons located 800 μm away from the stimulating site.
Figure 2.
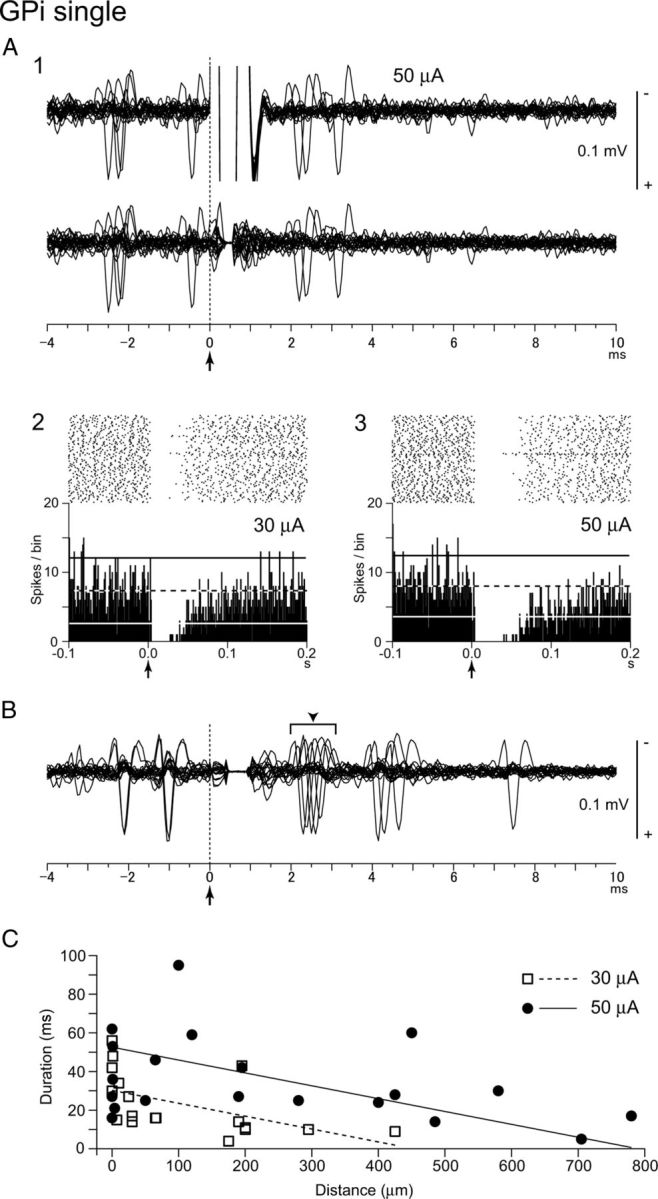
Responses of GPi neurons to local GPi single-pulse microstimulation. A1, Raw traces of a GPi neuron before (top) and after (bottom) removing the stimulus artifacts by the template subtraction method. Local stimulation (50 μA) was delivered at time 0 (arrow with dotted line). Twenty consecutive traces were superimposed. Spontaneous discharges were inhibited by the stimulation. A2, A3, Raster and PSTHs (100 trials; bin width, 1 ms) recorded from the same neuron to local stimulation of 30 μA (A2) and 50 μA (A3). Local stimulation was delivered at time 0 (arrows). The mean firing rate and statistical levels of p < 0.05 (one-tailed t test) are indicated in PSTHs by a black and white dashed line (mean), a black solid line (upper limit), and a white solid line (lower limit), respectively. B, Responses of another GPi neuron. Local stimulation (30 μA) was delivered at time 0 (arrow with dotted line). The neuron exhibited weak excitation (arrowhead) preceding the inhibition. C, Durations of inhibition of GPi neurons evoked by local single-pulse stimulation of 30 μA (n = 18) and 50 μA (n = 20) are plotted against the distances between the recording and stimulating electrodes. Liner regression lines for 30 and 50 μA stimulation were calculated.
In 42 neurons among 46 GPi neurons, responses to local GPi repetitive stimulation were also examined. Local repetitive stimulation of GPi inhibited neuronal activity of all the GPi neurons examined, as shown in Figure 3. Stimulation at a low frequency of 20 Hz evoked discrete inhibition corresponding to each stimulus (Fig. 3A). When the frequency of stimulation was increased to 50 and 100 Hz, each inhibition fused together, and neuronal firings were completely inhibited during stimulation (Fig. 3B,C). Such total inhibition at 100 Hz was observed in 32 GPi neurons (76%). The inhibition outlasted the stimulus period after the end of stimulation in all the GPi neurons examined (Fig. 3B2,C2). The duration of the post-train inhibition was 77.2 ± 61.2 ms at 100 Hz and sometimes >100 ms. In the recovery phase from inhibition, synchronized activation of GPi neurons was observed in some cases (Fig. 3B2,C2). In two GPi neurons, stimulation at 20 Hz evoked mixed responses composed of inhibition and excitation, whereas stimulation at 50 and 100 Hz evoked only inhibition.
Figure 3.
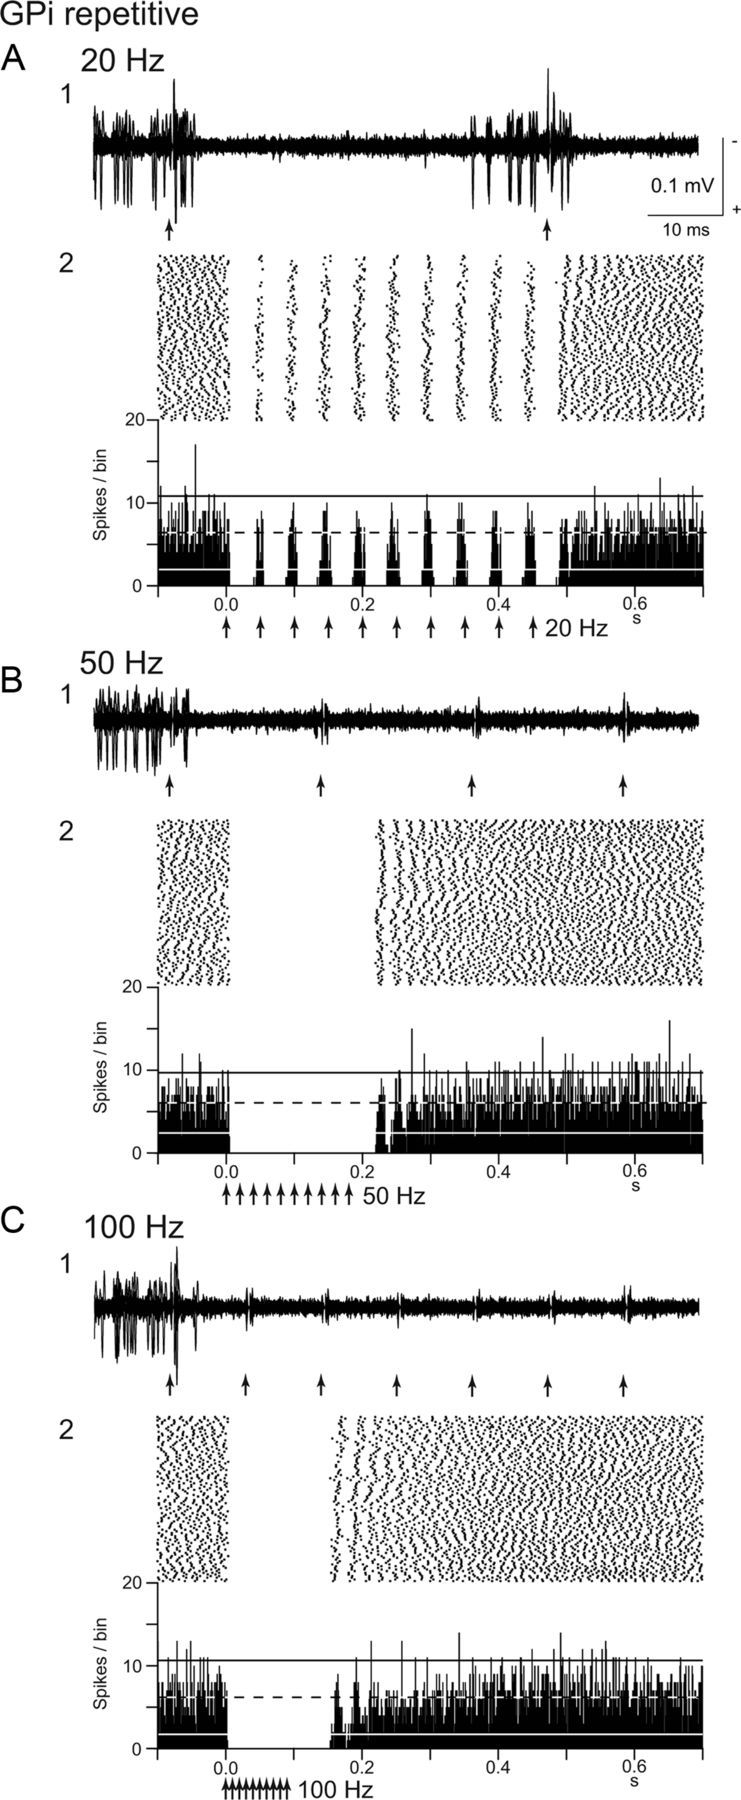
Responses of a GPi neuron to local GPi repetitive microstimulation. A–C, Repetitive stimulation (30 μA, 10 pulses) at 20 Hz (A), 50 Hz (B), and 100 Hz (C) was applied. Raw traces of spike discharges (1) and raster and PSTHs (2) are shown. Arrows indicate the timing of local stimulation. Each inhibition evoked by local stimulation fused together when stimulation was applied at 50 and 100 Hz. Calibration in A1 is applicable to B1 and C1.
The stimulation parameters used above are slightly different from those in human DBS. GPi-DBS for parkinsonian patients uses continuous repetitive stimulation with shorter pulse width (60–90 μs or more), higher stimulus frequency (130–185 Hz), and constant voltage (1–3.6 V or more) through large electrode areas. Thus, effects of other stimulus parameters were examined in five GPi neurons (Fig. 4A). Shorter pulse width (50–200 μs; Fig. 4A1,A2), higher stimulus frequency (130–160 Hz; Fig. 4A3,A4), and longer pulse train (50–200 pulses; Fig. 4A5,A6) also effectively inhibited neuronal discharges during the stimulation. Comparing the duration of the post-train inhibition, longer pulse width and higher stimulus frequency were effective to inhibit neuronal discharges. On the other hand, longer pulse train (>200 pulses) induced shorter post-train inhibition (Fig. 4A5,A6), suggesting receptor desensitization and/or transmitter depletion. Constant voltage stimulation and continuous repetitive stimulation were also applied through low-impedance stimulating electrodes (see Materials and Methods, Recording of pallidal neuronal activity during local microstimulation) in six GPi neurons (Fig. 4B,C). Repetitive constant voltage stimulation effectively inhibited neuronal discharges (Fig. 4B). Longer (75 s) continuous repetitive stimulation almost completely inhibited the neuronal discharges (Fig. 4C). The constant voltage stimulation through low-impedance electrodes produced larger artifacts and longer dead time (1.1 ± 0.2 ms after the template subtraction); thus, the stimulating microelectrode was usually used for local stimulation in the present study.
Figure 4.
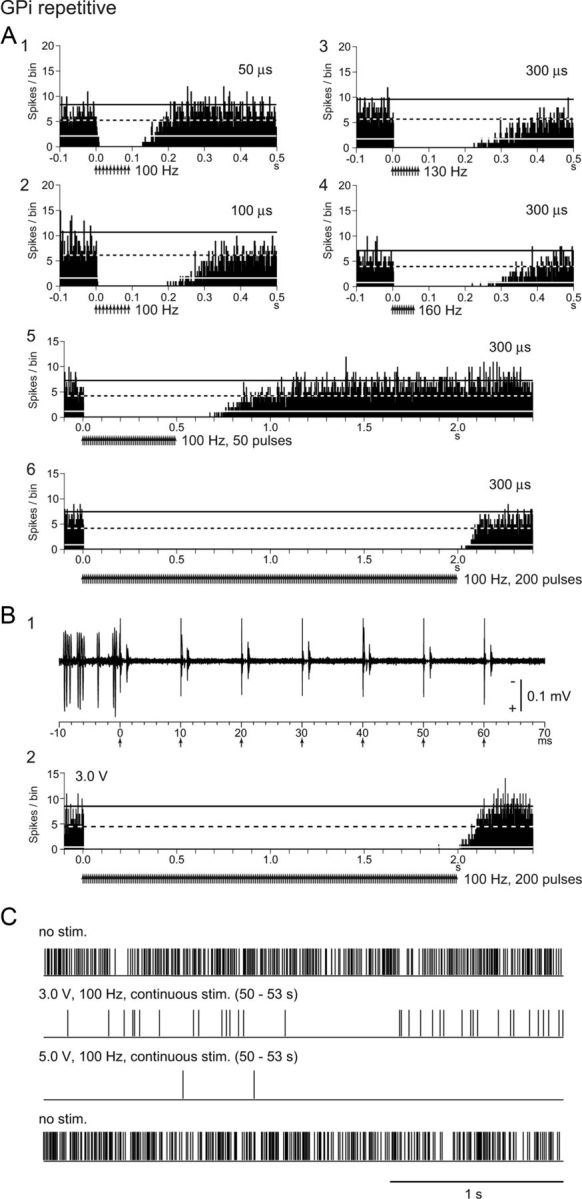
Responses of GPi neurons to local GPi repetitive stimulation. A, PSTHs of a GPi neuron showing responses to repetitive microstimulation. Stimulation of 70 μA, 50 μs pulse width, 100 Hz, 10 pulses (A1), 70 μA, 100 μs pulse width, 100 Hz, 10 pulses (A2), 50 μA, 300 μs pulse width, 130 Hz, 10 pulses (A3), 50 μA, 300 μs pulse width, 160 Hz, 10 pulses (A4), 50 μA, 300 μs pulse width, 100 Hz, 50 pulses (A5), and 50 μA, 300 μs pulse width, 100 Hz, 200 pulses (A6) was applied. B, Raw traces (B1) and PSTH (B2) of another GPi neuron showing responses to repetitive stimulation (3.0 V, 300 μs pulse width, 100 Hz, 200 pulses) through low-impedance electrodes. Neuronal discharges were completely inhibited during the stimulation. C, Neuronal discharges of the same neuron during continuous stimulation for 75 s (300 μs pulse width, 100 Hz, 7500 pulses) through low-impedance electrodes. Neuronal discharges are shown as digital signals. Spontaneous discharges (top trace) were largely inhibited during stimulation of 3.0 V (second trace). After the end of 3.0 V continuous stimulation, spontaneous discharges were recovered (data not shown). Stimulation of 5.0 V inhibited spontaneous activity more effectively (third trace). After the 5.0 V stimulation, spontaneous discharges were recovered (bottom trace).
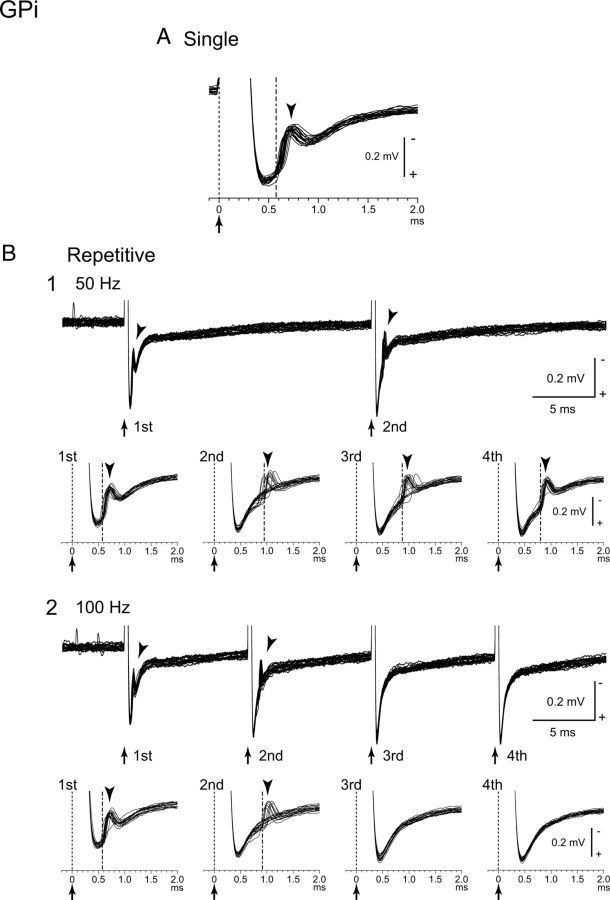
To detect short- and constant-latency responses, neuronal activity of 21 GPi neurons was recorded with lower gain and a lower cutoff frequency (Fig. 5). In this recording condition, the dead time at 50 μA stimulation was 0.18 ± 0.07 ms (n = 21). Local GPi single-pulse stimulation evoked a spike at a short and constant latency (0.53 ± 0.18 ms) in 8 GPi neurons (38%, Fig. 5A), which was followed by inhibition. The features indicate that the spikes were generated not synaptically but directly. Local repetitive stimulation at a low frequency of 20 Hz successfully evoked spikes corresponding to each stimulus (data not shown). When the frequency of stimulation was increased to 50 Hz, the spike latencies, spike jitter, and failure rates of spike generation were increased (Fig. 5B1). Stimulation at 100 Hz finally inhibited spike generation (Fig. 5B2, third and fourth stimuli).
Figure 5.
Directly evoked spikes of a GPi neuron to local GPi microstimulation. Raw traces recorded with lower gain and a lower cutoff frequency are shown. A, Responses to local single-pulse stimulation. Twenty consecutive traces were superimposed. Stimulation was delivered at time 0 (arrow with dotted line). Stimulation (30 μA) evoked spikes (arrowhead) at a short and constant latency (alternate long and short dashed line). B, Responses to local repetitive stimulation (30 μA, 10 pulses) at 50 Hz (B1) and 100 Hz (B2). Traces with long (top) and short (bottom) time scales are shown. Arrows with dotted lines indicate the timing of local stimulation (time 0 in the bottom traces). Arrowheads indicate evoked spikes. Local repetitive stimulation increased the spike latencies, spike jitter, and failure rates of spike generation (B1, second, third, and fourth stimuli; B2, second stimulus) and finally failed to evoke spikes (B2, third and fourth stimuli).
Responses of GPe neurons evoked by local stimulation
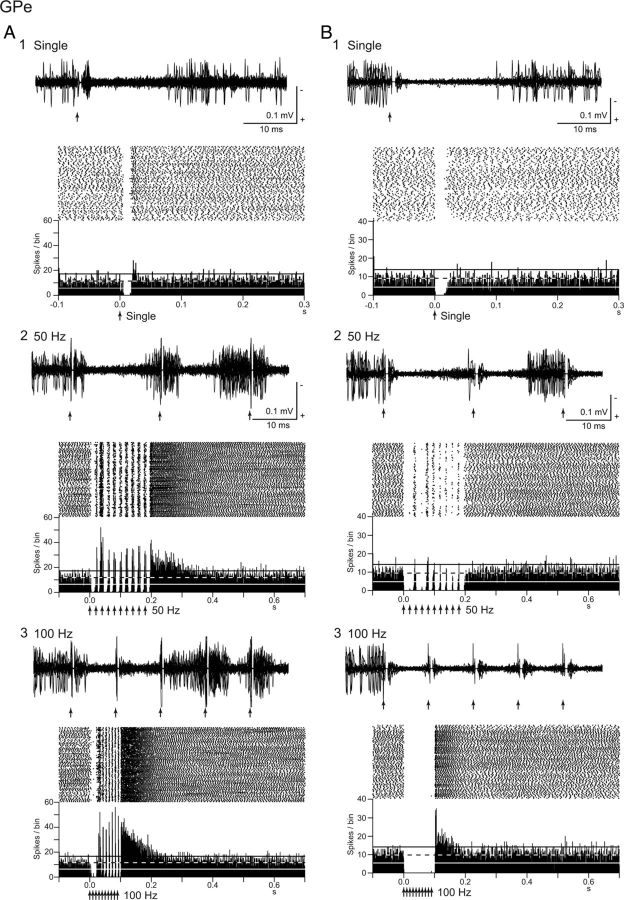
Responses of 51 GPe neurons (spontaneous discharge rate, 73.2 ± 33.4 Hz) to local GPe single-pulse stimulation were examined (Fig. 6) and compared with those of GPi neurons. Local single-pulse stimulation induced biphasic responses composed of inhibition (duration at 30 μA, 12.1 ± 6.5 ms) and subsequent excitation (duration at 30 μA, 24.5 ± 6.5 ms) in 20 GPe neurons (39%; Fig. 6A1) or monophasic inhibition (duration at 30 μA, 18.8 ± 9.9 ms) in 31 GPe neurons (61%; Fig. 6B1). The firing rate of the GPe neurons exhibiting a biphasic response (81 ± 33 Hz) was slightly higher than that of the GPe neurons exhibiting monophasic inhibition (68 ± 34 Hz), but there was no significant difference.
Figure 6.
Responses of GPe neurons to local GPe microstimulation. A, B, Raw traces, raster, and PSTHs of two GPe neurons showing response to single-pulse stimulation (30 μA) (1) and repetitive stimulation (30 μA, 10 pulses) at 50 Hz (2) and 100 Hz (3). A, A GPe neuron exhibiting a biphasic response composed of inhibition and subsequent excitation to local single-pulse stimulation (A1) and mixed responses composed of inhibition and excitation to local repetitive stimulation (A2, A3). B, Another GPe neuron exhibiting inhibition to local single-pulse stimulation (B1), mixed responses composed of inhibition and weak excitation to local 50 Hz stimulation (B2), and complete inhibition and post-train excitation to local 100 Hz stimulation (B3). Calibration in A2 and B2 is applicable to A3 and B3, respectively.
Local repetitive stimulation was applied to 15 GPe neurons exhibiting a biphasic response and 27 GPe neurons exhibiting monophasic inhibition to local single-pulse stimulation. Most of the GPe neurons (64%, 12 of 15 with a biphasic response and 15 of 27 with monophasic inhibition to local single-pulse stimulation) exhibited mixed responses composed of inhibition and excitation during repetitive stimulation (Fig. 6A2,A3). In more than half of them (56%, 15 of 27), excitation outlasted the termination of the stimulation at 100 Hz stimulation (Fig. 6A3). Such post-train excitation sometimes lasted for > 100 ms (22%, 6 GPe neurons). Other GPe neurons (36%, 3 of 15 with a biphasic response and 12 of 27 with monophasic inhibition to local single-pulse stimulation) exhibited mainly inhibition during repetitive stimulation (inhibition and weak excitation in Fig. 6B2 and complete inhibition in Fig. 6B3). Local repetitive stimulation at 100 Hz completely inhibited neuronal firings during stimulation in 11 of such 15 GPe neurons (73%) as observed in GPi neurons; however, it also induced post-train excitation (60%, 9 of 15; Fig. 6B3).
Effects of local drug injection on locally evoked responses
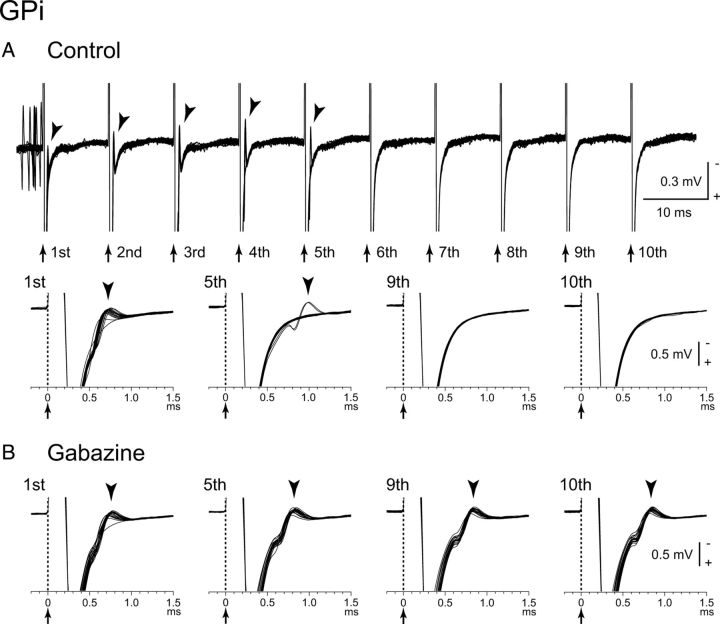
To elucidate the mechanism of inhibition evoked by local stimulation, gabazine was applied in the vicinity of 10 GPi neurons, and the inhibitory inputs to GPi neurons mediated by the GABAA receptors were blocked (Fig. 7). Gabazine injection regularized and increased the spontaneous firing rates of the GPi neurons (from 76.5 ± 30.7 to 96.6 ± 29.3 Hz, n = 10; p < 0.01, paired t test with Bonferroni correction) as reported previously (Tachibana et al., 2008). Gabazine injection abolished (9 of 10) or markedly decreased (1 of 10) inhibition evoked by single-pulse stimulation (from −258.7 ± 185.4 to −2.8 ± 8.9 spikes; n = 10; p < 0.01; Fig. 7A1,B1). Inhibition during repetitive stimulation of 10–50 μA at 100 Hz also disappeared in most neurons (9 of 10) and markedly decreased in the other neuron (1 of 10) after gabazine injection, and excitation appeared in all cases (from −74.1 ± 35.5 to 56.5 ± 55.5 Hz; n = 10; p < 0.01; Fig. 7A2,B2). These results suggest that inhibition evoked by single-pulse and repetitive stimulation is mediated by the GABAA receptors. However, when stimulus intensity was increased to 50–90 μA, inhibition beginning at the latter half of stimulation appeared (Fig. 7B3). Such strong repetitive stimulation also induced post-train excitation and inhibition (Fig. 7B3). Effects of local gabazine injection on the directly evoked spikes were also examined in four GPi neurons (Fig. 8). Although stimulation evoked spikes directly, repetitive high-frequency (100 Hz) stimulation failed to evoke spikes (Fig. 8A). After gabazine injection, failure rate was decreased, and each stimulus successfully evoked spikes in all cases (Fig. 8B), suggesting that direct excitation was suppressed by GABAA receptor-mediated inhibition during high-frequency stimulation.
Figure 7.
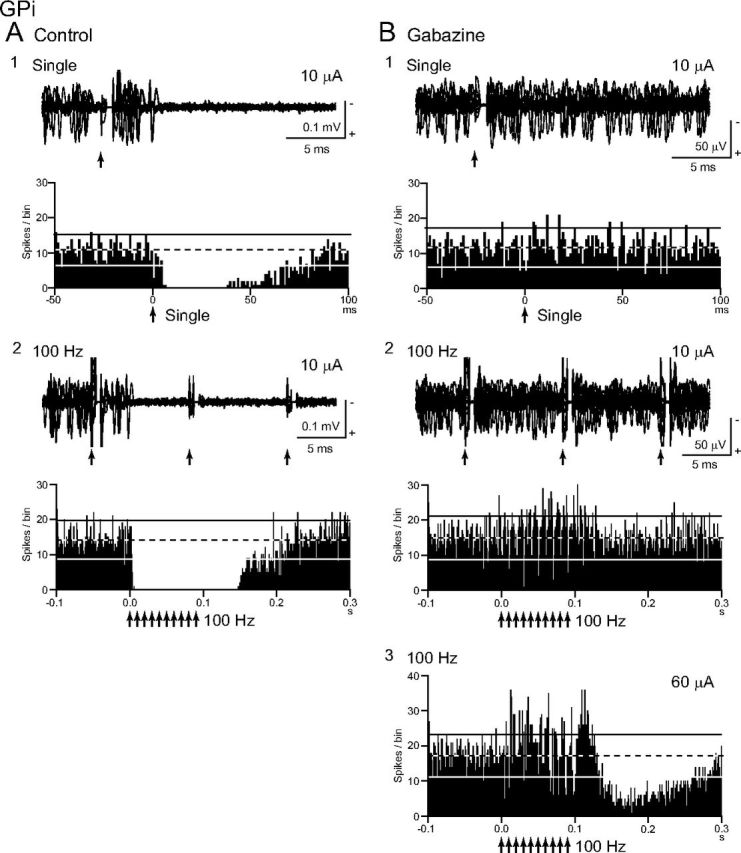
Effects of local gabazine (GABAA receptor antagonist) injection in the vicinity of the recorded GPi neuron on responses evoked by local GPi microstimulation. A, Raw traces and PSTHs to local single-pulse stimulation (10 μA) (A1) and repetitive stimulation (10 μA, 100 Hz, 10 pulses) (A2) under control conditions. B, Raw traces and PSTHs after gabazine injection. Gabazine injection abolished inhibition to single-pulse stimulation (10 μA) (B1) and replaced inhibition to repetitive stimulation (10 μA, 100 Hz, 10 pulses) with excitation (B2). Stronger repetitive stimulation (60 μA, 100 Hz, 10 pulses) evoked inhibition, beginning at the latter half of the stimulation, and post-train excitation and inhibition (B3).
Figure 8.
Effects of local gabazine injection on directly evoked spikes of a GPi neuron. A, Raw traces to local repetitive stimulation (40 μA, 100 Hz, 10 pulses) with long (top) and short (bottom) time scales under control conditions. Twenty consecutive traces were superimposed. Arrows with dotted lines indicate the timing of local stimulation (time 0 in the bottom traces). Arrowheads indicate directly evoked spikes. Repetitive high-frequency stimulation failed to evoke spikes (from sixth to 10th stimuli). B, Raw traces after local gabazine injection. Gabazine injection decreased failure rate, and each stimulus successfully evoked spikes (fifth, ninth, and 10th stimuli).
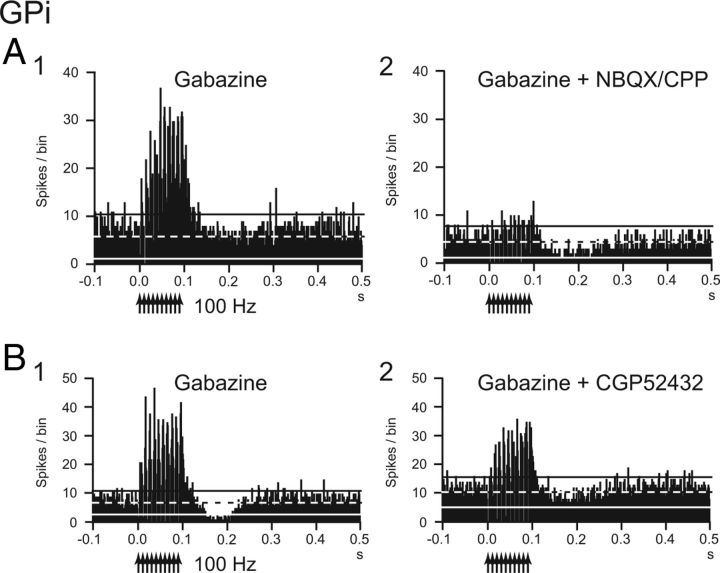
To examine the origin of the excitation that appeared after gabazine injection, a mixture of NBQX and CPP was additionally injected in the vicinity of four GPi neurons and glutamatergic inputs through ionotropic glutamate receptors (i.e., AMPA/kainate and NMDA receptors) were blocked (Fig. 9A). Additional injection of NBQX/CPP reduced the spontaneous firing rate (from 88.5 ± 4.6 to 53.9 ± 18.1 Hz, n = 4; p < 0.05), and the excitation during high-frequency stimulation was blocked in two cases and markedly decreased in the other cases (from 58.8 ± 48.7 to −12.0 ± 19.6 Hz; n = 4; p < 0.05; Fig. 9A1,A2). These results suggest that the excitation that appears after gabazine injection is mediated by ionotropic glutamate receptors. Finally, to elucidate the origin of the post-train inhibition that remained after gabazine injection, CGP52432 was additionally injected in the vicinity of two GPi neurons, and inhibitory inputs through GABAB receptors were blocked. Injection of CGP52432 abolished the remaining inhibition (from −418.1 and −415.7 to 0 spikes; n = 2; Fig. 9B1,B2), suggesting that the remaining inhibition is mediated by GABAB receptors.
Figure 9.
Effects of additional local injection of NBQX/CPP (ionotropic glutamate receptor antagonist) and CGP52432 (GABAB receptor antagonist) after local gabazine injection on evoked responses of GPi neurons. A, PSTHs of a GPi neuron showing responses to local GPi repetitive stimulation (50 μA, 100 Hz, 10 pulses) before (B1) and after (A2) NBQX/CPP injection. NBQX/CPP injection strongly diminished excitation that appeared after gabazine injection. B, PSTHs of another GPi neuron showing responses to local repetitive stimulation (50 μA, 100 Hz, 10 pulses) before (B1) and after (B2) CGP52432 injection. CGP52432 injection diminished the post-train inhibition that remained after gabazine injection.
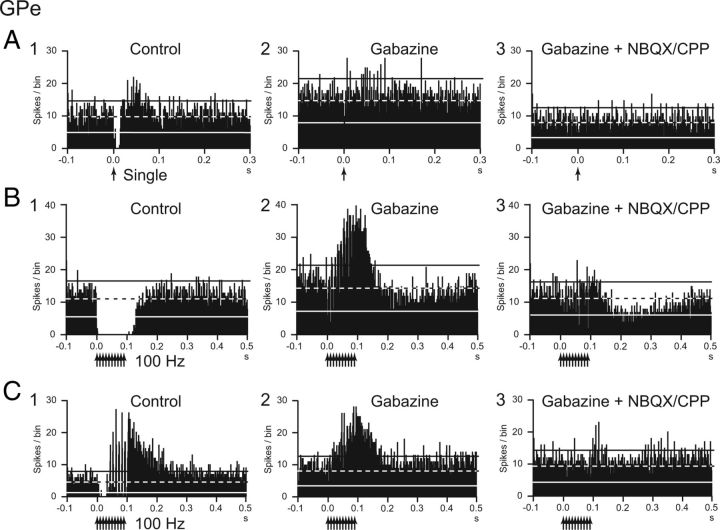
Similarly, drug effects were examined in nine GPe neurons (Fig. 10). Gabazine injection increased the spontaneous firing rate (from 71.5 ± 25.3 to 112.4 ± 28.0 Hz; n = 9; p < 0.01) and the regularity of the firing of the GPe neurons as reported previously (Kita et al., 2004). The inhibition evoked by single-pulse stimulation was totally (7 of 9) or mostly (2 of 9) abolished (−215.1 ± 227.2 to −9.8 ± 19.5 spikes; n = 9; p < 0.05; Fig. 10A1,A2). Inhibition (Fig. 10B1) and mixed responses composed of inhibition and excitation (Fig. 10C1) evoked by high-frequency stimulation were replaced by excitation (Fig. 10B2,C2) in all cases (from −69.2 ± 41.0 to 64.9 ± 38.0 Hz; n = 9; p < 0.05). The excitation was strongly attenuated by additional local injection of NBQX/CPP in all cases (to 14.6 ± 36.0 Hz; n = 6; p < 0.05; Fig. 10B3,C3).
Figure 10.
Effects of local injection of gabazine and NBQX/CPP on evoked responses of GPe neurons. A, B, PSTHs of a GPe neuron showing responses to local GPe single-pulse stimulation (30 μA) (A) and repetitive stimulation (30 μA, 100 Hz, 10 pulses) (B) under control conditions (A1, B1), after gabazine injection (A2, B2), and after additional NBQX/CPP injection (A3, B3). The inhibition evoked by single-pulse and repetitive stimulation was abolished after gabazine injection (A2, B2), and excitation to the repetitive stimulation appeared (B2). The excitation diminished after additional NBQX/CPP injection (B3). C, PSTHs of another GPe neuron showing responses to local GPe repetitive stimulation (30 μA, 100 Hz, 10 pulses). Complex responses composed of inhibition and excitation were evoked by repetitive stimulation (C1). Inhibition was replaced with excitation after gabazine injection (C2). Additional NBQX/CPP injection diminished the excitation (C3).
Effects of local high-frequency stimulation on cortically evoked responses of GPi neurons
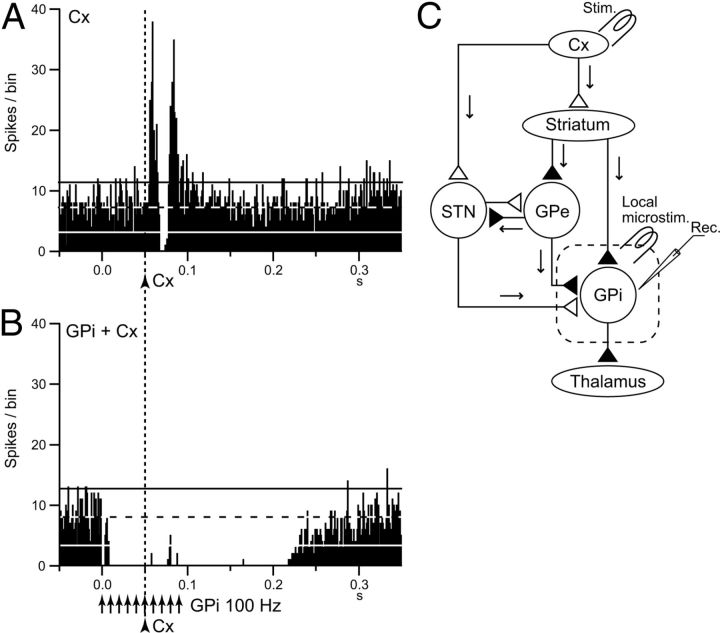
Among 48 GPi neurons examined, 26 neurons (54%) responded to cortical stimulation in the forelimb regions of the M1 and/or SMA and were considered to be located in the forelimb region of the motor territory. Cortical stimulation induced distinct triphasic responses composed of early excitation followed by inhibition and late excitation (Fig. 11A) as reported previously (Nambu et al., 1990, 2000; Yoshida et al., 1993; Tachibana et al., 2008). Each component of the response is mediated by the cortico-STN-GPi hyperdirect, cortico-striato-GPi direct, and cortico-striato-GPe-STN-GPi indirect pathways, respectively (Nambu et al., 2000, 2002b; Tachibana et al., 2008) (Fig. 11C). To examine effects of local high-frequency stimulation on the cortically evoked responses, cortical stimulation was applied during local high-frequency stimulation in 12 GPi neurons. The cortically evoked responses were completely abolished during repetitive high-frequency stimulation in all cases (Fig. 11B). These results indicate that high-frequency GPi stimulation inhibits cortically induced responses, as well as spontaneous activity.
Figure 11.
Effects of local GPi high-frequency stimulation on cortically evoked responses of a GPi neuron. A, PSTHs (100 trials) in response to the single-pulse stimulation (0.5 mA, arrowhead with dotted line) of the primary motor cortex (Cx). B, PSTHs in response to Cx stimulation (arrowhead with dotted line) during local GPi high-frequency stimulation (30 μA, 100 Hz, 10 pulses, arrows). Cortical stimulation was applied 50 ms after the initiation of local high-frequency stimulation. The cortically evoked responses were entirely inhibited during high-frequency stimulation. C, Schematic diagram showing recording and stimulating sites in the cortico-basal ganglia circuitry. White and black triangles represent glutamatergic excitatory and GABAergic inhibitory terminals. STN, Subthalamic nucleus.
Locations of recorded GPi/GPe neurons
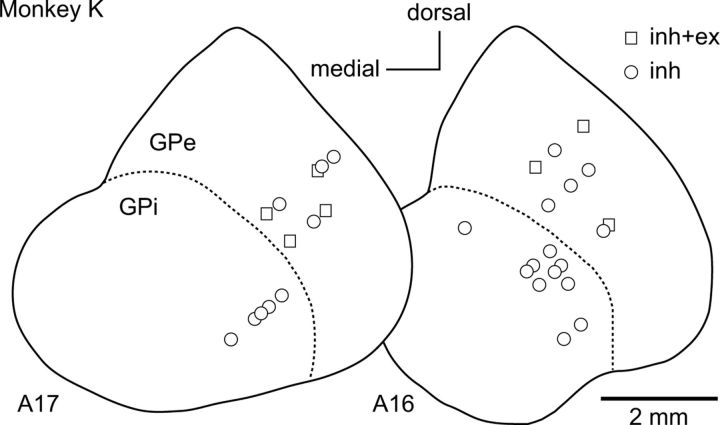
Locations of recorded GPi/GPe neurons in one of the monkeys used in the present study are exemplified in Figure 12. GPi/GPe neurons are plotted using different symbols based on response patterns to local repetitive high-frequency (100 Hz) stimulation. GPi neurons exhibited inhibition, whereas GPe neurons exhibited inhibition or mixed responses composed of inhibition and excitation.
Figure 12.
Distribution of recorded GPi/GPe neurons in a monkey. Locations of GPi/GPe neurons are indicated by different symbols based on response patterns evoked by local repetitive high-frequency stimulation in frontal sections. The distance of the sections from the auditory meatus is shown in millimeters beneath each section. inh, Inhibition; inh+ex, mixed responses composed of inhibition and excitation.
Discussion
The present study examined neuronal activity of GPi/GPe neurons in response to local stimulation in normal awake monkeys to elucidate the mechanism of GPi-DBS. High-frequency stimulation of the GPi completely inhibited spontaneous firings of GPi neurons by activation of GABAA and GABAB receptors. This inhibition was strong enough to suppress directly evoked spikes and cortically evoked triphasic responses of GPi neurons. These results suggest that GPi-DBS induces GABAergic inhibition and disrupts information flow through the GPi.
Local stimulation changes pallidal activity through GABAergic and glutamatergic neurotransmission
Local single-pulse stimulation in the GPi evoked short-latency inhibition in the neighboring (<800 μm) GPi neurons, whereas repetitive high-frequency stimulation completely inhibited spontaneous discharges (Figs. 2, 3). Inhibition of spontaneous discharges during GPi-DBS has been observed in human parkinsonian patients (Dostrovsky et al., 2000; Wu et al., 2001; Lafreniere-Roula et al., 2010) and monkeys (Boraud et al., 1996). The present study suggests that inhibition evoked by single-pulse stimulation is mediated by the GABAA receptors and that inhibition by repetitive stimulation is mediated by both the GABAA and GABAB receptors (Figs. 7, 9). The GPi receives inhibitory GABAergic inputs from the striatum and GPe, as well as excitatory glutamatergic inputs from the STN (Smith et al., 1994; Shink and Smith, 1995). As afferent axons can be easily excited by local stimulation (Jankowska et al., 1975), it is likely that local single-pulse GPi stimulation activates GABAergic axon terminals from the striatum and/or GPe and evokes GABA release. Released GABA binds to postsynaptic GABAA receptors. Repetitive stimulation released enough GABA to activate postsynaptic GABAB receptors and accumulated GABA spills out of synapses and binds to extrasynaptic GABAB receptors (Charara et al., 2005). The glutamatergic axon terminals from the STN are also expected to be activated by local GPi stimulation. Actually, excitation evoked by repetitive stimulation emerged after local gabazine injection, and it was mostly abolished by NBQX/CPP (Figs. 7, 9). The glutamatergic excitation may be overwhelmed by GABAergic inhibition because GABAergic inputs are dominant (Shink and Smith, 1995). Another possibility is that glutamate release from STN terminals is blocked by activation of presynaptic GABAB receptors (Charara et al., 2005; Kaneda and Kita, 2005). To the contrary, other studies showed that GPi-DBS induced multiphasic responses consisting of excitation and inhibition (Bar-Gad et al., 2004; McCairn and Turner, 2009; Leblois et al., 2010). Continuous repetitive stimulation may elicit receptor desensitization and/or transmitter depletion (Fig. 4) and cannot effectively excite or inhibit postsynaptic neurons, resulting in multiphasic responses of excitation and inhibition.
On the other hand, a large number of GPe neurons exhibited complex responses to local stimulation: biphasic responses composed of inhibition followed by excitation were evoked by single-pulse stimulation, and responses including both excitation and inhibition were induced during repetitive stimulation (Figs. 6, 10). Bar-Gad et al. (2004) reported similar multiphasic responses in GPe/GPi neurons of parkinsonian monkeys. The GPe receives excitatory glutamatergic inputs from the STN and inhibitory GABAergic inputs from the striatum and GPe itself (Smith et al., 1994; Shink and Smith, 1995). Therefore, local stimulation probably activates both the GABAergic and glutamatergic axon terminals. Indeed, local injection of gabazine abolished the inhibition, whereas local injection of NBQX/CPP abolished the excitation (Fig. 10). The difference in response to local stimulation between the GPi and GPe neurons is possibly the result of the difference in the balance of GABAergic and glutamatergic inputs. Shink and Smith (1995) reported that the density of GPe terminals on GPi neurons is higher than those on GPe neurons. Another explanation may be excitation through GPe-STN-GPe reciprocal connections: local GPe stimulation inhibits GPe activity and causes disinhibition of excitatory STN-GPe pathways. Contrast effects by GPi and GPe stimulation suggest that effects of local stimulation strongly depend on the composition of the afferent axon terminals. Observing the responses evoked by local stimulation can help to differentiate between the GPi and the GPe during stereotactic surgery. GPi- and GPe-DBS exert different effects on improvement of parkinsonian symptoms (Yelnik et al., 2000, Vitek et al., 2004), which might be explained by the different effects of stimulation.
Direct excitation evoked by local stimulation
It is reasonable that local stimulation excites local neuronal elements. Actually, local stimulation of the GPi evoked spikes at a short and constant latency in the present study (Fig. 5). Constant-latency excitation evoked by local stimulation was observed in GPi (Johnson and McIntyre, 2008; McCairn and Turner, 2009) and STN (Moran et al., 2011) neurons. Previous studies also showed that high-frequency stimulation excited local neuronal elements: GPi-DBS reduced thalamic activity through inhibitory GPi-thalamic projections in monkeys (Anderson et al., 2003) and dystonia patients (Pralong et al., 2003; Montgomery, 2006); STN-DBS increased GPi activity through excitatory STN-GPi projections (Hashimoto et al., 2003; Galati et al., 2006; Reese et al., 2011). Microdialysis studies showed that STN-DBS increased both glutamate and GABA levels in the SNr of normal rats (Windels et al., 2000; see also Windels et al., 2005). However, in the present study, high-frequency stimulation suppressed direct excitation of the GPi through strong GABAergic inhibition (Figs. 5, 8). The modeling study indicated that suprathreshold stimulation suppressed intrinsic firings in the soma but generated efferent outputs at the stimulus frequency in the axon (McIntyre et al., 2004). It is likely that the efferent axons are still excited and provide inhibitory inputs to the thalamus (Anderson et al., 2003).
High-frequency GPi stimulation disrupts information flow through the GPi
The striatum and STN are input stations of the basal ganglia and receive inputs from a wide area of the cerebral cortex (Mink, 1996; Nambu et al., 2002b). The information is processed through the hyperdirect, direct, and indirect pathways and reaches the GPi. GPi activity finally contributes to thalamic and cortical activity and plays a key role in controlling voluntary movements (Mink, 1996; Nambu et al., 2002b). Abnormal bursting and oscillatory GPi activity was observed in Parkinson's disease and dystonia (Wichmann et al., 1994; Starr et al., 2005; Chiken et al., 2008; Nishibayashi et al., 2011; Tachibana et al., 2011). Moreover, abnormal GPi activity patterns were evoked by cortical stimulation in these disorders (Chiken et al., 2008; Kita and Kita, 2011; Nishibayashi et al., 2011). Such abnormal GPi activity may cause symptoms of movement disorders. The present study revealed that high-frequency GPi stimulation completely inhibited the cortically evoked responses (Fig. 11), as well as the spontaneous discharges of GPi neurons by activation of GABAA and GABAB receptors. These observations suggest an alternative view on the mechanism of DBS: GPi-DBS dissociates inputs and outputs in the GPi by intense GABAergic inhibition and disrupts information flow of abnormal GPi activity to the thalamus and motor cortex. In fact, GPi-DBS triggered by motor cortical activity with delay effectively ameliorates parkinsonian symptoms (Rosin et al., 2011): such GPi-DBS specifically blocks neurotransmission of abnormal neuronal activity originated in the motor cortex.
A similar mechanism was also suggested in disrupting corticocortical signal propagation by high-frequency thalamic stimulation (Logothetis et al., 2010). This mechanism may explain the paradox that GPi-DBS produces similar therapeutic effects to lesions of the GPi: both GPi-DBS and GPi lesion interrupt information flow through the GPi. This mechanism may also be applicable to STN-DBS because STN-DBS induced inhibition in STN neurons of human parkinsonian patients (Filali et al., 2004) and interrupted cortico-basal ganglia neurotransmission through the STN in rodents (Maurice et al., 2003). However, a recent study using optogenetics indicated that selective stimulation of cortico-STN axons in the STN improved symptoms of parkinsonian rodents (Gradinaru et al., 2009). Effects of STN-DBS on STN neurons should be further studied using similar methods in the present study.
Difference between human DBS and high-frequency stimulation in the present study
The stimulation parameters mostly used in the present study are slightly different from those in human DBS. GPi-DBS for parkinsonian patients uses continuous repetitive stimulation with shorter pulse width (60–90 μs or more), higher frequency (130–185 Hz), and constant voltage (1–3.6 V or more). Stimulating electrodes in humans (four cylindrical electrodes separated by 1.5 or 0.5 mm; electrode length, 1.5 mm; diameter, 1.27 mm) have longer interelectrode distances (2.0–9.0 mm) and a larger electrode area (6.0 mm2). These parameters are suitable for stimulating axons rather than somata (McIntyre and Grill, 1999). Thus, the above discussions that local stimulation excites afferent axons may be applicable to human GPi-DBS. Actually, repetitive stimulation using different parameters invariably produced inhibition in the GPi (Fig. 4). High-frequency stimulation through macroelectrodes and microelectrodes induced similar inhibition in human parkinsonian patients (Filali et al., 2004). In addition, normal monkeys were used in the present study. GABAA receptor binding and mRNA expression were increased in the GPi and SNr in parkinsonian patients and animals (Galvan and Wichmann, 2007), suggesting that inhibitory effects by released GABA in parkinsonian GPi are stronger than those in normal GPi. Actually, high-frequency GPi stimulation in human parkinsonian patients exhibited strong continuous inhibition (Dostrovsky et al., 2000; Lafreniere-Roula et al., 2010). Thus, the suggested mechanism that released GABA from afferent terminals inhibits GPi activity is applicable to human GPi-DBS.
Footnotes
This work was supported by a Grant-in-Aid for Scientific Research (A) (21240039) from the Ministry of Education, Culture, Sports, Science and Technology (MEXT) of Japan (A.N.). Part of this study is the result of “Brain Machine Interface Development” performed under the Strategic Research Program for Brain Sciences by the MEXT. Two Japanese monkeys used in the present study were provided through National BioResource Project “Japanese Monkeys” of the MEXT. We thank Kana Miyamoto, Shigeki Sato, and Michio Mitsui for technical assistance.
The authors declare no competing financial interests.
References
- Anderson ME, Postupna N, Ruffo M. Effects of high-frequency stimulation in the internal globus pallidus on the activity of thalamic neurons in the awake monkey. J Neurophysiol. 2003;89:1150–1160. doi: 10.1152/jn.00475.2002. [DOI] [PubMed] [Google Scholar]
- Bar-Gad I, Elias S, Vaadia E, Bergman H. Complex locking rather than complete cessation of neuronal activity in the globus pallidus of a 1-methyl-4-phenyl-1,2,3,6-tetrahydropyridine-treated primate in response to pallidal microstimulation. J Neurosci. 2004;24:7410–7419. doi: 10.1523/JNEUROSCI.1691-04.2004. [DOI] [PMC free article] [PubMed] [Google Scholar]
- Benazzouz A, Piallat B, Pollak P, Benabid AL. Responses of substantia nigra pars reticulata and globus pallidus complex to high frequency stimulation of the subthalamic nucleus in rats: electrophysiological data. Neurosci Lett. 1995;189:77–80. doi: 10.1016/0304-3940(95)11455-6. [DOI] [PubMed] [Google Scholar]
- Boraud T, Bezard E, Bioulac B, Gross C. High frequency stimulation of the internal Globus Pallidus (GPi) simultaneously improves parkinsonian symptoms and reduces the firing frequency of GPi neurons in the MPTP-treated monkey. Neurosci Lett. 1996;215:17–20. doi: 10.1016/s0304-3940(96)12943-8. [DOI] [PubMed] [Google Scholar]
- Charara A, Pare JF, Levey AI, Smith Y. Synaptic and extrasynaptic GABA-A and GABA-B receptors in the globus pallidus: an electron microscopic immunogold analysis in monkeys. Neuroscience. 2005;131:917–933. doi: 10.1016/j.neuroscience.2004.12.004. [DOI] [PubMed] [Google Scholar]
- Chiken S, Shashidharan P, Nambu A. Cortically evoked long-lasting inhibition of pallidal neurons in a transgenic mouse model of dystonia. J Neurosci. 2008;28:13967–13977. doi: 10.1523/JNEUROSCI.3834-08.2008. [DOI] [PMC free article] [PubMed] [Google Scholar]
- Coubes P, Cif L, El Fertit H, Hemm S, Vayssiere N, Serrat S, Picot MC, Tuffery S, Claustres M, Echenne B, Frerebeau P. Electrical stimulation of the globus pallidus internus in patients with primary generalized dystonia: long-term results. J Neurosurg. 2004;101:189–194. doi: 10.3171/jns.2004.101.2.0189. [DOI] [PubMed] [Google Scholar]
- Dostrovsky JO, Levy R, Wu JP, Hutchison WD, Tasker RR, Lozano AM. Microstimulation-induced inhibition of neuronal firing in human globus pallidus. J Neurophysiol. 2000;84:570–574. doi: 10.1152/jn.2000.84.1.570. [DOI] [PubMed] [Google Scholar]
- Filali M, Hutchison WD, Palter VN, Lozano AM, Dostrovsky JO. Stimulation-induced inhibition of neuronal firing in human subthalamic nucleus. Exp Brain Res. 2004;156:274–281. doi: 10.1007/s00221-003-1784-y. [DOI] [PubMed] [Google Scholar]
- Galati S, Mazzone P, Fedele E, Pisani A, Peppe A, Pierantozzi M, Brusa L, Tropepi D, Moschella V, Raiteri M, Stanzione P, Bernardi G, Stefani A. Biochemical and electrophysiological changes of substantia nigra pars reticulata driven by subthalamic stimulation in patients with Parkinson's disease. Eur J Neurosci. 2006;23:2923–2928. doi: 10.1111/j.1460-9568.2006.04816.x. [DOI] [PubMed] [Google Scholar]
- Galvan A, Wichmann T. GABAergic circuits in the basal ganglia and movement disorders. Prog Brain Res. 2007;160:287–312. doi: 10.1016/S0079-6123(06)60017-4. [DOI] [PubMed] [Google Scholar]
- Gradinaru V, Mogri M, Thompson KR, Henderson JM, Deisseroth K. Optical deconstruction of parkinsonian neural circuitry. Science. 2009;324:354–359. doi: 10.1126/science.1167093. [DOI] [PMC free article] [PubMed] [Google Scholar]
- Hashimoto T, Elder CM, Vitek JL. A template subtraction method for stimulus artifact removal in high-frequency deep brain stimulation. J Neurosci Methods. 2002;113:181–186. doi: 10.1016/s0165-0270(01)00491-5. [DOI] [PubMed] [Google Scholar]
- Hashimoto T, Elder CM, Okun MS, Patrick SK, Vitek JL. Stimulation of the subthalamic nucleus changes the firing pattern of pallidal neurons. J Neurosci. 2003;23:1916–1923. doi: 10.1523/JNEUROSCI.23-05-01916.2003. [DOI] [PMC free article] [PubMed] [Google Scholar]
- Jankowska E, Padel Y, Tanaka R. The mode of activation of pyramidal tract cells by intracortical stimuli. J Physiol. 1975;249:617–636. doi: 10.1113/jphysiol.1975.sp011034. [DOI] [PMC free article] [PubMed] [Google Scholar]
- Johnson MD, McIntyre CC. Quantifying the neural elements activated and inhibited by globus pallidus deep brain stimulation. J Neurophysiol. 2008;100:2549–2563. doi: 10.1152/jn.90372.2008. [DOI] [PMC free article] [PubMed] [Google Scholar]
- Kaneda K, Kita H. Synaptically released GABA activates both pre- and postsynaptic GABAB receptors in the rat globus pallidus. J Neurophysiol. 2005;94:1104–1114. doi: 10.1152/jn.00255.2005. [DOI] [PubMed] [Google Scholar]
- Kita H, Kita T. Cortical stimulation evokes abnormal responses in the dopamine-depleted rat basal ganglia. J Neurosci. 2011;31:10311–10322. doi: 10.1523/JNEUROSCI.0915-11.2011. [DOI] [PMC free article] [PubMed] [Google Scholar]
- Kita H, Nambu A, Kaneda K, Tachibana Y, Takada M. Role of ionotropic glutamatergic and GABAergic inputs on the firing activity of neurons in the external pallidum in awake monkeys. J Neurophysiol. 2004;92:3069–3084. doi: 10.1152/jn.00346.2004. [DOI] [PubMed] [Google Scholar]
- Kita H, Chiken S, Tachibana Y, Nambu A. Origins of GABAA and GABAB receptor-mediated responses of globus pallidus induced after stimulation of the putamen in the monkey. J Neurosci. 2006;26:6554–6562. doi: 10.1523/JNEUROSCI.1543-06.2006. [DOI] [PMC free article] [PubMed] [Google Scholar]
- Lafreniere-Roula M, Kim E, Hutchison WD, Lozano AM, Hodaie M, Dostrovsky JO. High-frequency microstimulation in human globus pallidus and substantia nigra. Exp Brain Res. 2010;205:251–261. doi: 10.1007/s00221-010-2362-8. [DOI] [PubMed] [Google Scholar]
- Leblois A, Reese R, Labarre D, Hamann M, Richter A, Boraud T, Meissner WG. Deep brain stimulation changes basal ganglia output nuclei firing pattern in the dystonic hamster. Neurobiol Dis. 2010;38:288–298. doi: 10.1016/j.nbd.2010.01.020. [DOI] [PubMed] [Google Scholar]
- Limousin P, Pollak P, Benazzouz A, Hoffmann D, Le Bas JF, Broussolle E, Perret JE, Benabid AL. Effect of parkinsonian signs and symptoms of bilateral subthalamic nucleus stimulation. Lancet. 1995;345:91–95. doi: 10.1016/s0140-6736(95)90062-4. [DOI] [PubMed] [Google Scholar]
- Logothetis NK, Augath M, Murayama Y, Rauch A, Sultan F, Goense J, Oeltermann A, Merkle H. The effects of electrical microstimulation on cortical signal propagation. Nat Neurosci. 2010;13:1283–1291. doi: 10.1038/nn.2631. [DOI] [PubMed] [Google Scholar]
- Maltête D, Jodoin N, Karachi C, Houeto JL, Navarro S, Cornu P, Agid Y, Welter ML. Subthalamic stimulation and neuronal activity in the substantia nigra in Parkinson's disease. J Neurophysiol. 2007;97:4017–4022. doi: 10.1152/jn.01104.2006. [DOI] [PubMed] [Google Scholar]
- Maurice N, Thierry AM, Glowinski J, Deniau JM. Spontaneous and evoked activity of substantia nigra pars reticulata neurons during high-frequency stimulation of the subthalamic nucleus. J Neurosci. 2003;23:9929–9936. doi: 10.1523/JNEUROSCI.23-30-09929.2003. [DOI] [PMC free article] [PubMed] [Google Scholar]
- McCairn KW, Turner RS. Deep brain stimulation of the globus pallidus internus in the parkinsonian primate: local entrainment and suppression of low-frequency oscillations. J Neurophysiol. 2009;101:1941–1960. doi: 10.1152/jn.91092.2008. [DOI] [PMC free article] [PubMed] [Google Scholar]
- McIntyre CC, Grill WM. Excitation of central nervous system neurons by nonuniform electric fields. Biophys J. 1999;76:878–888. doi: 10.1016/S0006-3495(99)77251-6. [DOI] [PMC free article] [PubMed] [Google Scholar]
- McIntyre CC, Savasta M, Walter BL, Vitek JL. How does deep brain stimulation work? Present understanding and future questions. J Clin Neurophysiol. 2004;21:40–50. doi: 10.1097/00004691-200401000-00006. [DOI] [PubMed] [Google Scholar]
- Meissner W, Leblois A, Hansel D, Bioulac B, Gross CE, Benazzouz A, Boraud T. Subthalamic high frequency stimulation resets subthalamic firing and reduces abnormal oscillations. Brain. 2005;128:2372–2382. doi: 10.1093/brain/awh616. [DOI] [PubMed] [Google Scholar]
- Mink JW. The basal ganglia: focused selection and inhibition of competing motor programs. Prog Neurobiol. 1996;50:381–425. doi: 10.1016/s0301-0082(96)00042-1. [DOI] [PubMed] [Google Scholar]
- Montgomery EB., Jr Effects of GPi stimulation on human thalamic neuronal activity. Clin Neurophysiol. 2006;117:2691–2702. doi: 10.1016/j.clinph.2006.08.011. [DOI] [PubMed] [Google Scholar]
- Moran A, Stein E, Tischler H, Belelovsky K, Bar-Gad I. Dynamic stereotypic responses of basal ganglia neurons to subthalamic nucleus high-frequency stimulation in the parkinsonian primate. Front Syst Neurosci. 2011;5:21. doi: 10.3389/fnsys.2011.00021. [DOI] [PMC free article] [PubMed] [Google Scholar]
- Nambu A, Yoshida S, Jinnai K. Discharge patterns of pallidal neurons with input from various cortical areas during movement in the monkey. Brain Res. 1990;519:183–191. doi: 10.1016/0006-8993(90)90076-n. [DOI] [PubMed] [Google Scholar]
- Nambu A, Tokuno H, Hamada I, Kita H, Imanishi M, Akazawa T, Ikeuchi Y, Hasegawa N. Excitatory cortical inputs to pallidal neurons via the subthalamic nucleus in the monkey. J Neurophysiol. 2000;84:289–300. doi: 10.1152/jn.2000.84.1.289. [DOI] [PubMed] [Google Scholar]
- Nambu A, Kaneda K, Tokuno H, Takada M. Organization of corticostriatal motor inputs in monkey putamen. J Neurophysiol. 2002a;88:1830–1842. doi: 10.1152/jn.2002.88.4.1830. [DOI] [PubMed] [Google Scholar]
- Nambu A, Tokuno H, Takada M. Functional significance of the cortico-subthalamo-pallidal ‘hyperdirect’ pathway. Neurosci Res. 2002b;43:111–117. doi: 10.1016/s0168-0102(02)00027-5. [DOI] [PubMed] [Google Scholar]
- Nishibayashi H, Ogura M, Kakishita K, Tanaka S, Tachibana Y, Nambu A, Kita H, Itakura T. Cortically evoked responses of human pallidal neurons recorded during stereotactic neurosurgery. Mov Disord. 2011;26:469–476. doi: 10.1002/mds.23502. [DOI] [PubMed] [Google Scholar]
- Obeso JA, Olanow CW, Rodriguez-Oroz MC, Krack P, Kumar R, Lang AE The Deep-Brain Stimulation for Parkinson's Disease Study Group. Deep-brain stimulation of the subthalamic nucleus or the pars interna of the globus pallidus in Parkinson's disease. N Engl J Med. 2001;345:956–963. doi: 10.1056/NEJMoa000827. [DOI] [PubMed] [Google Scholar]
- Ostrem JL, Starr PA. Treatment of dystonia with deep brain stimulation. Neurotherapeutics. 2008;5:320–330. doi: 10.1016/j.nurt.2008.01.002. [DOI] [PMC free article] [PubMed] [Google Scholar]
- Pralong E, Debatisse D, Maeder M, Vingerhoets F, Ghika J, Villemure JG. Effect of deep brain stimulation of GPI on neuronal activity of the thalamic nucleus ventralis oralis in a dystonic patient. Neurophysiol Clin. 2003;33:169–173. doi: 10.1016/j.neucli.2003.07.001. [DOI] [PubMed] [Google Scholar]
- Reese R, Leblois A, Steigerwald F, Pötter-Nerger M, Herzog J, Mehdorn HM, Deuschl G, Meissner WG, Volkmann J. Subthalamic deep brain stimulation increases pallidal firing rate and regularity. Exp Neurol. 2011;229:517–521. doi: 10.1016/j.expneurol.2011.01.020. [DOI] [PubMed] [Google Scholar]
- Rosin B, Slovik M, Mitelman R, Rivlin-Etzion M, Haber SN, Israel Z, Vaadia E, Bergman H. Closed-loop deep brain stimulation is superior in ameliorating parkinsonism. Neuron. 2011;72:370–384. doi: 10.1016/j.neuron.2011.08.023. [DOI] [PubMed] [Google Scholar]
- Shink E, Smith Y. Differential synaptic innervation of neurons in the internal and external segments of the globus pallidus by the GABA- and glutamate-containing terminals in the squirrel monkey. J Comp Neurol. 1995;358:119–141. doi: 10.1002/cne.903580108. [DOI] [PubMed] [Google Scholar]
- Smith Y, Wichmann T, DeLong MR. Synaptic innervation of neurones in the internal pallidal segment by the subthalamic nucleus and the external pallidum in monkeys. J Comp Neurol. 1994;343:297–318. doi: 10.1002/cne.903430209. [DOI] [PubMed] [Google Scholar]
- Starr PA, Rau GM, Davis V, Marks WJ, Jr, Ostrem JL, Simmons D, Lindsey N, Turner RS. Spontaneous pallidal neuronal activity in human dystonia: comparison with Parkinson's disease and normal macaque. J Neurophysiol. 2005;93:3165–3176. doi: 10.1152/jn.00971.2004. [DOI] [PubMed] [Google Scholar]
- Tachibana Y, Kita H, Chiken S, Takada M, Nambu A. Motor cortical control of internal pallidal activity through glutamatergic and GABAergic inputs in awake monkeys. Eur J Neurosci. 2008;27:238–253. doi: 10.1111/j.1460-9568.2007.05990.x. [DOI] [PubMed] [Google Scholar]
- Tachibana Y, Iwamuro H, Kita H, Takada M, Nambu A. Subthalamo-pallidal interactions underlying parkinsonian neuronal oscillations in the primate basal ganglia. Eur J Neurosci. 2011;34:1470–1484. doi: 10.1111/j.1460-9568.2011.07865.x. [DOI] [PubMed] [Google Scholar]
- Vidailhet M, Vercueil L, Houeto JL, Krystkowiak P, Lagrange C, Yelnik J, Bardinet E, Benabid AL, Navarro S, Dormont D, Grand S, Blond S, Ardouin C, Pillon B, Dujardin K, Hahn-Barma V, Agid Y, Destée A, Pollak P French SPIDY Study Group. Bilateral, pallidal, deep-brain stimulation in primary generalised dystonia: a prospective 3 year follow-up study. Lancet Neurol. 2007;6:223–229. doi: 10.1016/S1474-4422(07)70035-2. [DOI] [PubMed] [Google Scholar]
- Vitek JL. Deep brain stimulation: how does it work? Cleve Clin J Med 75;suppl. 2008;2:S59–S65. doi: 10.3949/ccjm.75.suppl_2.s59. [DOI] [PubMed] [Google Scholar]
- Vitek JL, Hashimoto T, Peoples J, DeLong MR, Bakay RA. Acute stimulation in the external segment of the globus pallidus improves parkinsonian motor signs. Mov Disord. 2004;19:907–915. doi: 10.1002/mds.20137. [DOI] [PubMed] [Google Scholar]
- Wichmann T. A digital averaging method for removal of stimulus artifacts in neurophysiologic experiments. J Neurosci Methods. 2000;98:57–62. doi: 10.1016/s0165-0270(00)00190-4. [DOI] [PubMed] [Google Scholar]
- Wichmann T, DeLong MR. Deep brain stimulation for neurologic and neuropsychiatric disorders. Neuron. 2006;52:197–204. doi: 10.1016/j.neuron.2006.09.022. [DOI] [PubMed] [Google Scholar]
- Wichmann T, Bergman H, DeLong MR. The primate subthalamic nucleus. III. Changes in motor behavior and neuronal activity in the internal pallidum induced by subthalamic inactivation in the MPTP model of parkinsonism. J Neurophysiol. 1994;72:521–530. doi: 10.1152/jn.1994.72.2.521. [DOI] [PubMed] [Google Scholar]
- Windels F, Bruet N, Poupard A, Urbain N, Chouvet G, Feuerstein C, Savasta M. Effects of high frequency stimulation of subthalamic nucleus on extracellular glutamate and GABA in substantia nigra and globus pallidus in the normal rat. Eur J Neurosci. 2000;12:4141–4146. doi: 10.1046/j.1460-9568.2000.00296.x. [DOI] [PubMed] [Google Scholar]
- Windels F, Carcenac C, Poupard A, Savasta M. Pallidal origin of GABA release within the substantia nigra pars reticulata during high-frequency stimulation of the subthalamic nucleus. J Neurosci. 2005;25:5079–5086. doi: 10.1523/JNEUROSCI.0360-05.2005. [DOI] [PMC free article] [PubMed] [Google Scholar]
- Wu YR, Levy R, Ashby P, Tasker RR, Dostrovsky JO. Does stimulation of the GPi control dyskinesia by activating inhibitory axons? Mov Disord. 2001;16:208–216. doi: 10.1002/mds.1046. [DOI] [PubMed] [Google Scholar]
- Yelnik J, Damier P, Bejjani BP, François C, Gervais D, Dormont D, Arnulf I, Bonnet AM, Cornu P, Pidoux B, Agid Y. Functional mapping of the human globus pallidus: contrasting effect of stimulation in the internal and external pallidum in Parkinson's disease. Neuroscience. 2000;101:77–87. doi: 10.1016/s0306-4522(00)00364-x. [DOI] [PubMed] [Google Scholar]
- Yoshida S, Nambu A, Jinnai K. The distribution of the globus pallidus neurons with input from various cortical areas in the monkey. Brain Res. 1993;611:170–174. doi: 10.1016/0006-8993(93)91791-p. [DOI] [PubMed] [Google Scholar]


