

Abstract
An important component of chronic neurodegenerative diseases is the generation of an innate inflammatory response within the CNS. Microglial and astroglial cells play a key role in the development and maintenance of this inflammatory response, showing enhanced proliferation and activation. We studied the time course and regulation of microglial proliferation, using a mouse model of prion disease. Our results show that the proliferation of resident microglial cells accounts for the expansion of the population during the development of the disease. We identify the pathway regulated by the activation of CSF1R and the transcription factors PU.1 and C/EBPα as the molecular regulators of the proliferative response, correlating with the chronic human neurodegenerative conditions variant Creutzfeldt-Jakob disease and Alzheimer's disease. We show that targeting the activity of CSF1R inhibits microglial proliferation and slows neuronal damage and disease progression. Our results demonstrate that microglial proliferation is a major component in the evolution of chronic neurodegeneration, with direct implications for understanding the contribution of the CNS innate immune response to disease progression.
Introduction
Determining the relative contribution of proliferation and activation of microglial cells is essential for understanding the outcome of CNS pathologies (Jensen et al., 1994; Ponomarev et al., 2005). Whether microglial cells are locally renewed or are generated from bone-marrow-derived progenitors (BMPs) is a controversial issue. Several studies point to in situ microglial proliferation as the major mechanism regulating microglial turnover, with little or no contribution of circulating progenitors (Lawson et al., 1992; Prinz and Mildner, 2011). Microglia can be maintained and function independently of BMPs in health (Ginhoux et al., 2010; Schulz et al., 2012) and in disease, as evidenced using experimental models of demyelination, neurodegeneration, or axotomy (Ajami et al., 2007; Mildner et al., 2007, 2011). Therefore, analyzing the degree of microglial proliferation under pathological conditions is critical for understanding how the innate inflammatory response contributes to disease onset and progression.
Prion disease experimental models present protein misfolding and progressive neuronal degeneration, common to several neurodegenerative diseases (Ransohoff and Perry, 2009). In prion disease, microglial activation and the cytokine profile are similar to that observed in models of Alzheimer disease (AD), with low levels of inflammatory cytokines but high levels of TGFβ and PGE2 (Perry et al., 2002; Cunningham et al., 2003). Moreover, microglia in prion disease are primed by the ongoing pathology, with an enhanced responsiveness to systemic inflammation (Perry et al., 2007). Previous studies in prion disease suggested that microglia arose from BMPs, as evidenced by the use of bone-marrow chimeras (Priller et al., 2006). Given recent evidence reporting side effects of whole-body irradiation (Prinz and Mildner, 2011), microglial proliferation during the progression of prion disease needs to be evaluated.
Signals produced during chronic neurodegeneration are candidates to trigger microglial proliferation. Endogenous brain growth factors, like macrophage colony-stimulating factor (CSF1), promote microglial proliferation (Yamamoto et al., 2010) through the CSF1 receptor (CSF1R) (Raivich et al., 1998). CSF1 is also upregulated in microglia in a model of AD (Murphy et al., 2000). Furthermore, a novel cytokine, interleukin-34 (IL34), also activates CSF1R, driving in vitro proliferation of macrophages and microglia (Wei et al., 2010; Mizuno et al., 2011) and defining aspects of microglial development (Wang et al., 2012). At the transcriptional level, the C/EBPα-PU.1 pathway is a candidate for the regulation of microglial proliferation, regulating the expression of CSF1R (Zhang et al., 1994). PU.1 regulates macrophage biology and granulopoiesis, and is expressed in microglia (Walton et al., 2000), being upregulated after brain injury (Ponomarev et al., 2011). C/EBPα has been shown to activate the transcription of PU.1 in monocytes, regulating their differentiation (Cai et al., 2008) and proliferation (Celada et al., 1996) through CSF1.
Thus, understanding the factors that regulate microglial proliferation during chronic neurodegeneration has yet to be studied. We provide evidence for a key role of activation of the CSF1R-PU.1-C/EBPα axis in the control of microglial proliferation during chronic neurodegeneration. Also, modulating this pathway, we identify the contribution of microglial proliferation to the progression of prion disease, opening a new window to potentially beneficial therapeutic approaches.
Materials and Methods
Experimental models of prion disease
Female C57BL/6J (Harlan) and c-fms-EGFP (Sasmono et al., 2003) (macgreen) mice were bred and maintained in local facilities. Mice expressing EGFP under the promoter of c-fms (CSF1R) are characterized by the expression of green fluorescence in microglial cells. Mice were housed in groups of 4–10, under a 12 h light/12 h dark cycle at 21°C, with food and water ad libitum. To induce prion disease, mice were anesthetized with a ketamine/rompun mixture (85 and 13 mg/kg), and 1 μl of either ME7-derived (ME7 animals) or 22L-derived (22L animals) brain homogenate (10% w/v) or normal brain homogenate (NBH animals) was injected stereotaxically and bilaterally at the coordinates from bregma: anteroposterior, −2.0 mm; lateral, −1.7 mm; depth, 1.6 mm. When required, mice received intraperitoneal BrdU (7.5 mg/ml, 0.1 ml/10 g weight in sterile saline; Sigma-Aldrich) for the 4 d before the end of the experiment. All procedures were performed in accordance with U.K. Home Office licensing.
Clinical samples of variant Creutzfeldt–Jakob disease and AD
Human brain autopsy tissue samples (paraffin-embedded, formalin-fixed, 96% formic acid-treated, 6 μm sections) from the National CJD Surveillance Unit Brain Bank (Edinburg, UK) were obtained from cases of variant Creutzfeldt–Jakob disease (vCJD; 5 females and 5 males, age 20–34 years), AD (5 females and 5 males, age 58–76 years), or the corresponding age-matched controls (vCJD controls: 5 females and 5 males, age 20–35 years; AD controls: 4 females and 5 males, age 58–79 years) in whom consent for use of autopsy tissues for research had been obtained. All cases fulfilled the criteria for the pathological diagnosis of vCJD or AD. None of the cases had any of the known mutations of the PrP gene or family history of prion disease, and there was no evidence of the common types of iatrogenic etiology. Ethical permission for research on autopsy materials stored in the National CJD Surveillance Unit was obtained from Lothian Region Ethics Committee.
Gain/loss of activity of CSF1R
For loss of function experiments, NBH (control) and ME7 (prion) macgreen mice were treated at 12 weeks postinjection with a CSFR1 blocking antibody (1 μg; LEAF Purified anti-mouse CD115, n = 4; Biolegend) (MacDonald et al., 2010) or an isotype control antibody (Rat IgG; 1 μg, n = 4) by stereotactic injection in the dorsal hippocampus (CA1 field; anteroposterior, −2.0 mm; lateral, −1.7 mm; depth, 1.6 mm) with a Hamilton syringe. Mice received five injections of intraperitoneal BrdU (7.5 mg/ml, 0.1 ml/10 g weight in sterile saline) before the end of the experiment (+1 week).
Similarly, for gain of function experiments, NBH (control) and ME7 (prion) macgreen mice were treated at 12 weeks postinjection with 50 ng of recombinant murine CSF1 (n = 4; Merck Chemicals), murine IL34 (n = 4; R&D Systems), or saline (vehicle; n = 4) by stereotactic injection in the dorsal hippocampus (CA1 field; anteroposterior, −2.0 mm; lateral, −1.7 mm; depth, 1.6 mm) with a Hamilton syringe. Mice received five injections of intraperitoneal BrdU (7.5 mg/ml, 0.1 ml/10 g weight in sterile saline) before the end of the experiment (+1 week).
Inhibition of the tyrosine kinase activity of CSF1R was achieved by the administration of GW2580, as previously described (Conway et al., 2005; Crespo et al., 2011). GW2580 (LC Laboratories) was suspended in 0.5% hydroxypropylmethylcellulose and 0.1% Tween 80 and was dosed orally at 0.2 ml per mouse (75 mg/kg) daily for 4 consecutive weeks (from 14th to 18th week postinjection) to ME7 mice (ME7 + GW2580; n = 8) using the vehicle as control (ME7 + vehicle; n = 8) and comparing to NBH mice (n = 8). Mice behavior and weight was monitored during the experiment. Mice received two daily injections of intraperitoneal BrdU (7.5 mg/ml, 0.1 ml/10 g weight in sterile saline) before the end of the experiment (18th week). A subgroup of mice was maintained to complete the behavioral analysis and to study the effect of the treatments over the survival time (terminal disease as assessed by a loss of 15% body weight).
Inhibition of proliferation by cytosine arabinoside
NBH (control) and ME7 (prion) mice were treated with 2% cytosine arabinoside (AraC; n = 4; Sigma-Aldrich), a dose previously used in the literature and extensively reported to have no detrimental effects on nondividing cells (Doetsch et al., 1999). We used sterile saline (n = 4) as vehicle, and the treatments were performed for 1 month (from 12th to 16th week postinfection), using an intraventricular brain infusion kit (anteroposterior, 0.0 mm; lateral, −1.0 mm; Alzet) coupled to an osmotic minipump (model 1004, flow 0.11 μl/h; Alzet). Mice received two daily injections of intraperitoneal BrdU (7.5 mg/ml, 0.1 ml/10 g weight in sterile saline) before the end of the experiment (16th week). The pump weight, measured before and after the experiment, and the placement of the intraventricular cannula were checked to ensure correct delivery of the treatments.
Behavioral tests
From the eighth week postinjection, mice treated with ME7 + vehicle (n = 8), ME7 + GW2580 (n = 8), or NBH (n = 8) were tested weekly on behavioral tasks previously demonstrated to detect the onset of behavioral dysfunction (Boche et al., 2006): open-field locomotor activity, burrowing activity, motor performance on horizontal bar, and glucose consumption.
Open-field locomotor activity.
The open-field tests were performed using activity monitor software (Med Associated). The mice were placed in individual cages of 27 × 27 × 0.3 cm for a period of 3 min to further analyze the total distance traveled (cm) and the number of rears (vertical counts), using the average speed as an internal control of the mouse motor abilities, during the test period (3 min).
Burrowing.
Plastic cylinders, 20 cm long and 6.8 cm in diameter, were filled with 190 g of normal diet food pellets and placed in individual mouse cages. Mice were placed individually in the cages for 2 h and overnight, and the remaining pellets were weighed at the end of each session and the amount displaced (“burrowed”) was calculated. The mice were then returned to their home cage.
Glucose consumption.
Glucose consumption for individual mice was measured at the same time as the burrowing. The water bottles were removed and refilled with a 5% glucose solution (d(+)-glucose; BDH Laboratory Supplies) and weighed. The following morning, the bottles were reweighed, and the amount drunk was calculated.
Horizontal bar motor test.
The test was performed in a 38-cm-long metal bar with a diameter of 0.2 cm that was supported by wooden struts to a height of 49 cm over a padded bench surface. Mice were held by the tail and allowed to grip the center of the bar with their front paws only. The tail was rapidly released and time taken to fall off (60 s) or to reach one of the wooden supports (contact with forepaw; max. 60 s) was recorded.
Body weight and late-stage clinical signs of disease.
Body weights of all mice were monitored on a weekly basis from 8 weeks postinjection. Terminal disease was defined as a humane end-point of a loss of ≥15% body weight and/or the development of severe clinical signs; at this point, animals were killed.
Immunohistochemistry
Coronal hippocampal sections were cut from formalin-fixed, paraffin-embedded, or paraformaldehyde-fixed frozen brains. Mice perfusion, tissue processing, and immunohistochemical analysis were performed as previously described (Gómez-Nicola et al., 2008). After processing the paraffin-embedded sections for dewaxing and antigen retrieval (citrate buffer, 5 min boil, 3 min stand, 5 min boil) the sections were treated successively with 1% methanol/30%H2O2 and 5% normal serum/0.1% BSA to block endogenous peroxidase and nonspecific binding, respectively. After repeated rinses with PBS + Tween 20 (PBST; 0.1% v/v), they were incubated overnight at 4°C with the correspondent primary antibodies: goat anti-Iba1 (Abcam), rat anti-CD11b (AbD Serotec), chicken anti-GFP (Abcam), mouse anti-GFAP (Millipore), mouse anti-NeuN (Millipore), mouse anti-BrdU (Developmental Studies Hybridoma Bank), rat anti-BrdU (Santa Cruz Biotechnology), rabbit anti-proliferating cell nuclear antigen (anti-PCNA; Abcam), rabbit anti-phospho-histone H3 (Cell Signaling Technology), rabbit anti-Ki67 (Abcam), goat anti-IL34 (Santa Cruz Biotechnology), goat anti-C/EBPa (Santa Cruz Biotechnology), rabbit anti-PU.1 (Santa Cruz Biotechnology), hamster anti-CD11c (in house), rat anti-MHCII (eBioscience), rabbit anti-IL1b (Peprotech), and rabbit anti-cleaved caspase-3 (Millipore). Following primary antibody incubation, the sections were washed with PBST and incubated with the appropriate biotinylated secondary antibody (Vector Labs), and/or with the appropriate Alexa 405-, 488-, or 594-conjugated secondary antibody or streptavidin (Invitrogen). For light microscopy, the sections were washed and incubated with Vectastain ABC complex (Vector Labs) and visualized using diaminobenzidine (DAB) precipitation. Sections for light microscopy were counterstained with hematoxylin and mounted with DePeX and visualized in Leica CTR 5000 microscope, coupled to a Leica DFC300FX microscope camera. After immunofluorescence labeling, nuclei were visualized by Hoechst staining and the sections were mounted with Mowiol/DABCO (Sigma-Aldrich) mixture. The sections were visualized on a Leica TCS-SP5 confocal system, coupled to a Leica CTR6500 microscope.
The general immunohistochemistry protocol was modified for the detection of BrdU, as previously described (Gómez-Nicola et al., 2011). Briefly, sections were subjected to antigen retrieval with citrate buffer and DNA denaturation with 2N HCl (30 min, 37°C), followed by blocking and incubation of the primary and secondary antibodies for the general protocol. Detection of BrdU in macgreen mice sections was combined with the antibody-based detection of EGFP to recover the loss of fluorescence generated by the BrdU detection protocol.
Detection of the PrPSc protein was performed following the previously described protocol (citrate buffer + 2N HCl) using a mouse anti-PrP primary antibody [mouse anti-PrP (Prionics)] and detecting the signal with DAB.
The protocol used for immunohistochemistry on human sections was a modification of the general protocol, with antigen unveiling in citrate buffer being performed for 25 min. When fluorescent detection was performed, an additional incubation in 0.1% Sudan Black in 70% EtOH for 10 min was added to reduce autofluorescence just before the incubation with the secondary fluorescently labeled antibodies.
Detection of neuronal degeneration was performed using the staining with Fluoro Jade C (Merck Millipore), according to the manufacturer instructions. Briefly, sections were incubated in 0.06% potassium permanganate for 10 min, followed by two washes in H2O. Then, sections were incubated for 10 min in a solution of 0.0001% Fluoro Jade C dye dissolved in 0.1% acetic acid, followed by washing in H2O, drying, clearing with xylene, and mounting with DePeX.
Quantification and image analysis
The quantification of antigen-positive cells (i.e., Iba1+) in the specific areas (n = 4 fields/mouse, n = 4–8 mice/group) was performed after DAB immunohistochemistry. The number of double-positive cells (i.e., GFP+BrdU+) in the specific area (n = 4 fields/mouse, n = 4–8 mice/group) was performed after double immunofluorescence. Data were represented as number of positive cells per square millimeter. Quantification of the number of PrPSc plaques was performed after PrP-specific immunohistochemistry in the CA1 layer of the hippocampus (plaques/mm2; n = 4 fields/mouse, n = 4 mice/group). The quantification of antigen-positive cells (i.e., IL34+) in human brains was performed in the white or gray matter of the temporal cortex after DAB immunohistochemistry (n = 10 fields/brain, n = 9–10 brains/group). The quantification of Fluoro Jade C-positive neurons was performed in the CA1 layer of the hippocampus (neurons/section; n = 4 sections/mouse, n = 4 mice/group). All quantifications were performed with the help of the ImageJ image analysis software.
Analysis of gene expression by RT-PCR
NBH or ME7 fresh frozen brain sections were cut with a cryostat, then the CA1 area of the hippocampus and the dorsal thalamic region were dissected under a dissecting microscope. Alternatively, samples of the hippocampus or the thalamus were obtained from fresh brains (experiment GW2580) by dissection under a microscope. Samples were homogenized in Trizol reagent (Invitrogen), following the manufacturer instructions to isolate RNA, as previously described (Gómez-Nicola et al., 2011). The isolated RNA was quantified (Nanodrop; Thermo Scientific) and retrotranscribed to cDNA with a RT Precision Nanoscript kit (Primer-Design) after checking its integrity by electrophoresis in a 2% agarose gel. cDNA libraries were analyzed by RT-PCR using the Precision 2X qPCR Mastermix (Primer-Design) and the custom designed gene-specific primers (Sigma-Aldrich): csf1 [NM_007778.4; forward (FW), agtattgccaaggaggtgtcag; reverse (RV), atctggcatgaagtctccattt), il34 (NM_001135100.1; FW, ctttgggaaacgagaatttggaga; RV, gcaatcctgtagttgatggggaag), Csf1r (NM_001037859.2; FW, gcagtaccaccatccacttgta; RV, gtgagacactgtccttcagtgc), pu.1 (NM_011355.1; FW, cagaagggcaaccgcaagaa; RV, gccgctgaactggtaggtga), c/ebpa (NM_007678.3; FW, agcttacaacaggccaggtttc; RV, cggctggcgacatacagtac), gata1 (NM_008089.1, FW, tcagcaaacgggcaggcacc; RV, ctccgctggcattcctccgc), cyclin D1 (NM_007631.2; FW, ggctcctctcatggcgctgc; RV, gtggcatgcacaacaggccg), cyclin D2 (NM_009829; FW, tcgatgggctgcgttgcgtt; RV, gggagcctgcgtcaaagggg), il1b (NM_008361.3; FW, cagacccaccctgca; RV, accgtttttccatcttcttct), il6 (NM_031168.1; FW, tccagaaaccgctatgaagttc; RV, caccagcatcagtcccaaga), mhcII (NM_010378.2; FW, agctctgattctgggggtcctcg; RV, ataaacgccgtctgtgactgact), arg1 (NM_007482.3; FW, agcactgaggaaagctggtc; RV, cagaccgtgggttcttcaca), and ym1 (NM_009892; FW, agctctccagaagcaatcct; RV, ctgtccttagcccaactggt). The amplification of DNA was detected by SYBR green fluorescence. Quality of the primers and the PCR were evaluated by electrophoresis in a 1.5% agarose gel, checking the PCR product size. Data were analyzed using the ΔΔCt method with Primer Opticon 3 software, using GAPDH (NM_008084.2; FW, tgaacgggaagctcactgg, RV, tccaccaccctgttgctgta) as a housekeeping gene.
Statistical analysis
Data were expressed as mean ± SEM and analyzed with the Prism 5 software package (GraphPad Software). For all datasets, normality and homoscedasticity assumptions were reached, validating the application of the one- or two-way ANOVA, followed by the Tukey post hoc test for multiple comparisons. Survival curves were analyzed with Mantel–Cox test for Kaplan–Meir curves. PrPSc and Fluoro Jade C stainings were analyzed with a two-tailed t test. Differences were considered significant for p < 0.05.
Results
Time course of microglial proliferation during prion disease
The pathological course of prion disease is characterized by a progressive expansion of the microglial population (Iba1+ cells; Fig. 1A) when compared with the control (NBH). Increased microglial density is present but varies across different regions such as the hippocampus (CA1) and the thalamus (TH), the later showing the biggest increase in cell numbers (Fig. 1A). In contrast, the number of astrocytes (GFAP+ cells) remains unchanged in CA1 until the late stage of the disease (20 weeks), with the thalamus showing an early expansion of the astrocytic population (Fig. 1B). These changes are also present in another model of murine prion disease, the 22L model, with minor differences in the overall cells numbers between ME7 and 22L models (Table 1).
Figure 1.

Temporal and regional distribution of microglial proliferation during prion disease. A, B, Immunohistochemical analysis of the expression of Iba1 (microglia, A) and GFAP (astrocytes, B) in the CA1 region of the hippocampus (see representative images) and the thalamus of prion-diseased (ME7) and control (NBH) mice. Quantified data expressed as mean ± SEM of the number of Iba1+ (A) or GFAP+ (B) cells per square millimeter. C, D, Immunohistochemical analysis of the expression of PCNA (A) and pHH3 (B) in the CA1 region of the hippocampus (see representative images) and the thalamus of prion disease (ME7) and control (NBH) mice. Quantified data expressed as the mean ± SEM of the number of PCNA+ (A) or pHH3+ (B) cells per square millimeter. E, Analysis of proliferative microglia (white arrowheads) by double immunofluorescence for BrDU (red) and GFP (microglia, green) in the hippocampus (CA1; representative image) and thalamus of prion (ME7) or control (NBH) mice. Quantified data expressed as mean ± SEM of the number of BrDU+GFP+ cells per square millimeter. *p < 0.05, **p < 0.01, ***p < 0.001. Data were analyzed with a two-way ANOVA and a post hoc Tukey test (n = 6). A–D, Nuclei are stained with H/E (blue). E, Fluorescent sections evaluated with confocal microscopy. Scale bars: A–D (in A, C), 100 μm; A–D, insets (in A, C) 50 μm; E, 20 μm.
Table 1.
Expression of markers of glial cells and proliferation in the 22L and the ME7 models of prion disease
| NBH |
ME7 |
22L |
||||
|---|---|---|---|---|---|---|
| CA1 | TH | CA1 | TH | CA1 | TH | |
| Iba1 | 63.31 ± 12.43 | 64.57 ± 9.39 | 240.66 ± 22.13*** | 328.15 ± 34.94*** | 228.30 ± 22.63** | 282.71 ± 14.31** |
| GFAP | 387.94 ± 21.03 | 19.21 ± 4.64 | 409.45 ± 22.44 | 448.31 ± 26.58*** | 362.81 ± 55.37 | 529.76 ± 26.50*** |
| PCNA | 13.04 ± 1.06 | 18.30 ± 5.61 | 83.54 ± 13.66* | 126.96 ± 29.07* | 41.21 ± 3.26* | 164.94 ± 36.44** |
| pHH3 | 3.08 ± 0.51 | 1.70 ± 0.40 | 16.23 ± 2.36** | 17.74 ± 3.66* | 14.70 ± 3.12* | 13.93 ± 1.57* |
Immunohistochemical analysis of the expression of Iba1 (microglia), GFAP (astrocytes), PCNA (proliferation), and pHH3 (proliferation) in the CA1 region of the hippocampus and the thalamus of prion disease (ME7, 22L) and control (NBH) mice. Quantification data expressed as mean ± SEM of the number of positive cells per square millimeter.
*p < 0.05,
**p < 0.01,
***p < 0.001. Data were analyzed with a two-way ANOVA and a post hoc Tukey test.
The analysis of the expression of PCNA and phospho-histone-H3 (pHH3), markers of proliferating cells, showed a significant increase in the number of proliferating cells in prion-diseased mice compared with the NBH controls (Fig. 1C,D). The increase in proliferation is also observed in the 22L model of prion disease (Table 1).
Moreover, the analysis of the incorporation of BrdU in microglial cells (GFP+) showed an increased proliferative activity of the microglial population from early stages of prion disease compared with the NBH controls (Fig. 1E). The regional and temporal distribution of BrdU+ microglial cells (Fig. 1E) correlates well with that observed for the proliferative markers PCNA and pHH3 (Fig. 1C,D) and the microglial marker Iba1 (Fig. 1A), supporting the idea of the expansion of the microglial population as the main cell type proliferating during prion disease. This idea is supported by the fact that the BrdU+/GFP− population (proliferating nonmicroglial cells) represents a maximum of 5.2 ± 1.3% of the total BrDU+ positive cells (ME7, 20 weeks).
These results show a time-dependent resident microglial proliferative response during the course of prion disease, generating the expansion of the cell population.
Signals regulating microglial proliferation during prion disease
Once local proliferation was established as the main driving force responsible for expanding the microglial population during prion disease (Fig. 1), we analyzed the expression and localization of the components of the CSF1R signaling pathway (Fig. 2). The mRNA expression of CSF1R and CSF1 is progressively increased during prion disease compared with the NBH controls (Fig. 2A). In contrast, the mRNA expression of IL34, an alternative ligand for CSF1R, is upregulated in prion mice at 12 weeks after inoculation, but returns to basal levels at 20 weeks (Fig. 2A). The time course of the mRNA expression of IL34 correlated with the protein expression, as evidenced by its detection by immunohistochemistry (Fig. 2B,C). IL34 was found to be expressed in GFAP+ astrocytes, in close contact with GFP+/IL34-negative microglial cells (Fig. 2D). IL34 staining was abolished by preincubation of the antibody with IL34 peptide.
Figure 2.

Temporal and regional distribution of the regulators of microglial proliferation during prion disease. A, Analysis of the expression of mRNA of CSF1, IL34, and CSF1R in the hippocampus (CA1) and thalamus of prion disease (ME7) and control (NBH) mice. Expression of CSF1, IL34, and CSF1R is represented as mean ± SEM and indicated as relative expression levels using the 2ΔΔCt method. B, C, F–H, Immunohistochemical analysis of the expression of IL34 (B, C), PU.1 (F, G), and C/EBPa (F, H) in the CA1 region of the hippocampus (see representative images) and the thalamus of prion disease (ME7) and control (NBH) mice. Quantified data expressed as mean ± SEM of the number of IL34+, PU.1+, or C/EBP+ cells per square millimeter. D, Analysis of the expression of IL34 in glial cells by triple immunofluorescence for IL34 (red), GFP (microglia, green), and GFAP (astrocytes, blue) in the hippocampus (CA1) of prion disease mice (ME7). E, Analysis of the expression of mRNA of PU.1, GATA1, and C/EBPa in the hippocampus (CA1) and thalamus of prion disease (ME7) and control (NBH) mice. Expression of PU.1, GATA1, and C/EBPa is represented as mean ± SEM and indicated as relative expression levels using the 2ΔΔCt method. I, Analysis of the expression of PU.1 or C/EBPa (red) in microglial cells (GFP, green) by double immunofluorescence in the hippocampus (CA1) of prion disease mice (ME7). *p < 0.05, **p < 0.01, ***p < 0.001, ****p < 0.0001. Data were analyzed with a two-way ANOVA and a post hoc Tukey test (n = 6). C, G, H, Nuclei are stained with H/E (blue). I, Nuclei are stained with Hoechst (blue). D, I, Fluorescent sections evaluated with confocal microscopy. Scale bars: C, G, H, 100 μm; insets, 50 μm; D, I, 50 μm.
The observed time course of the expansion of the microglial population (Fig. 1) correlated with the expression of the transcription factor PU.1, which is upregulated during the development of the prion disease at the mRNA level (Fig. 2E) and detected by immunohistochemistry (Fig. 2F,G). The increase of PU.1+ cells was comparable in the different regions analyzed (CA1 and TH, Fig. 2F,G; CA3, corpus callosum, data not shown), with some minor differences in the overall number of positive cells. The transcription factor C/EBPα was also upregulated during the course of the prion disease at the mRNA level (Fig. 2E) and detected by immunohistochemistry (Fig. 2F,H). The expression of C/EBPα was similar in CA1 and TH (Fig. 2E,F,H), appearing unchanged in other regions analyzed, like corpus callosum (data not shown). Both PU.1 and C/EBPα are expressed in GFP+ microglial cells in prion-diseased brains, as evidenced by confocal microscopy (Fig. 2I). The expression of GATA1, a known negative regulator of PU.1 (Zhang et al., 1999), in prion-diseased brains was not significantly different from that observed in NBH controls (Fig. 2E).
Altogether, these results point to the signaling through the CSF1R and the activation of PU.1 and C/EBPα as the mitogenic pathways driving the proliferation of microglial cells during chronic neurodegeneration.
Signaling through CSF1R controls microglial proliferation
The temporal and regional expression of CSF1, IL34, and CSF1R during prion disease highlighted the potential importance of this system in regulating microglial proliferation. Thus, we analyzed the function of these molecules using gain and loss of activity experiments (Fig. 3).
Figure 3.

Signaling through the CSF1R controls microglial proliferation during chronic neurodegeneration. A, B, Effect of the administration of a CSF1R blocking antibody (CSF1R Ab) on microglial proliferation (A, right). A, Immunofluorescent analysis of the binding of CSF1R Ab (red) to microglial cells (GFP+, green), expressing low (white arrowheads) or high (empty arrowheads) levels of CSF1R (GFP) in the hippocampus of prion disease mice (ME7). B, Analysis of microglial proliferation by double immunofluorescence for BrDU (red) and GFP (microglia, green) in the hippocampus of prion (ME7, representative images) or control (NBH) mice treated with CSF1R Ab or an isotype control antibody (CTL). Quantified data expressed as mean ± SEM of the number of BrDU+GFP+ (proliferative microglia) or GFP+ (total microglia) cells per square millimeter. C, Immunofluorescent analysis of the expression of activated (cleaved) caspase-3 (red) in microglial cells (GFP+, green, white arrowheads) or nonmicroglial cells (empty arrowheads) in the hippocampus of prion disease mice (ME7). D, Effect of the administration of CSF1 or IL34 on microglial proliferation during prion disease (C, right). Analysis of microglial proliferation by double immunofluorescence for BrDU (red) and GFP (microglia, green) in the hippocampus of prion (ME7) mice treated with CSF1, IL34, or saline (control, Sal). Quantified data expressed as mean ± SEM of the number of BrDU+GFP+ (proliferative microglia) or GFP+ (total microglia) cells per square millimeter. *p < 0.05, **p < 0.01, ***p < 0.001. Data were analyzed with a one- (B) or two-way (D) ANOVA and a post hoc Tukey test (n = 4). A–D, Fluorescent sections evaluated with confocal microscopy. Scale bars: A, 20 μm; B–D, 50 μm.
To investigate the relevance of CSF1R in controlling microglial proliferation, we inhibited its activity by the intrahippocampal administration of a blocking antibody (CSF1R Ab), followed by sequential administration of BrDU (Fig. 3), using a control isotype-matched antibody as an internal control. The CSF1R Ab efficiently binds to GFP+ microglial cells, as detected by immunohistochemistry (Fig. 3A). Moreover, high levels of antibody binding to the microglial cell inversely correlated with the levels of expression of GFP, highlighting the effective inhibitory activity over the CSF1R activation (Fig. 3A). The administration of CSF1R Ab blocked microglial proliferation in the hippocampus in both ME7 mice and in NBH controls, as evidenced by the reduced levels of incorporation of BrDU in microglial cells (GFP+) compared with the hippocampi injected with a control antibody (Fig. 3B). Blocking the CSF1R reduced the expansion of the microglial population in prion mice without affecting their morphological activation status (Fig. 3B). The administration of the CSF1R blocking antibody did not cause a significant increase in the apoptosis (cleaved-caspase-3+) of microglial cells (GFP+) (Fig. 3C). We found that caspase-3+/GFP+ microglia represented 2.4 ± 0.6% of the population in ME7 hippocampi treated with CSF1R blocking antibody, not differing from the 1.8 ± 0.5% found in hippocampi treated with the control antibody. This indicates that a change in proliferation alone, as a consequence of blocking CSFR1, is sufficient to account for the change in density of GFP+ microglia.
We studied the mitogenic activity of CSF1 and IL34 in prion-diseased mice (Fig. 3D). We administered 50 ng of CSF1, IL34 or vehicle [saline (SAL)] into the hippocampi of prion-diseased mice, followed by the sequential administration of BrDU (Fig. 3D). The basal degree of proliferation (+SAL) was increased by the administration of either CSF1 or IL34, with a greater promitogenic effect of the latter (Fig. 3D). We found a significantly higher number of proliferating microglial cells (BrDU+GFP+), and total microglial cells (GFP+) in the hippocampi of prion mice administered with CSF1 or IL34 compared with the saline controls (Fig. 3D).
These experiments support the prominent role of signaling through CSF1R by CSF1 or IL34 as the main driver of microglial proliferation during the course of prion disease.
The inhibition of microglial mitosis alters the inflammatory activation state
Given the proliferative potential of the resident microglial cells, we investigated the relevance of microglial proliferation for the progression of the disease by using a sustained intracranial delivery of AraC as an antimitotic agent (Fig. 4).
Figure 4.
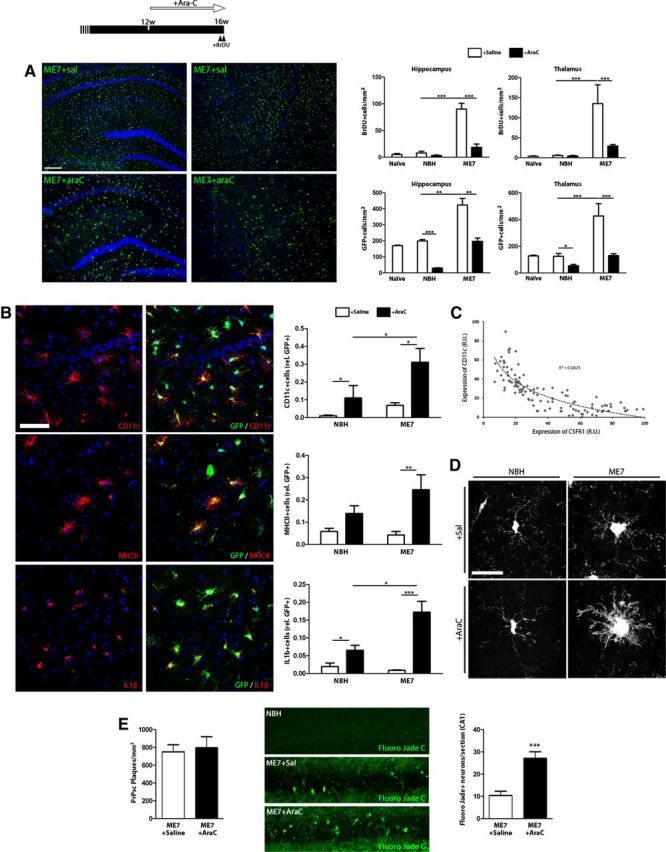
Blockade of mitosis alters the inflammatory phenotype of microglial cells during chronic neurodegeneration. A–E, Effect of the administration of an inhibitor of mitosis (AraC) on the progression of microglial proliferation and neuropathology during prion disease (top). A, Analysis of microglial proliferation by immunohistochemistry for BrDU and GFP (microglia, green, representative images) in the hippocampus and thalamus of prion (ME7, representative images) or control (NBH) mice, treated with AraC or vehicle (saline, Sal), compared with naive mice. Quantified data expressed as mean ± SEM of the number of BrDU+ or GFP+ cells per square millimeter. B, Effect of AraC on the expression of inflammatory markers in microglial cells, analyzed by double immunofluorescence for CD11c, MHCII, or IL1b (red), and GFP (green, microglia), on the hippocampus of prion (ME7) or control (NBH) mice. Quantified data expressed as mean ± SEM of the ratio of CD11c+, MHCII+ or IL1b+ versus the total number of GFP+ microglial cells. C, Correlation of the expression of CD11c and GFP (CSF1R) in single microglial cells in the hippocampus of prion disease mice, measured as relative intensity. D, Effect of AraC or saline (vehicle) on the morphology of GFP+ microglial cells of the hippocampus of prion (ME7) or control (NBH) mice. E, Effect of AraC or saline (vehicle) on the deposition of PrPSc (PrPSc+ plaques, left) and the degeneration of neurons (Fluoro Jade C-positive neurons, green, representative images, right) in the CA1 layer of the hippocampus of prion mice (ME7). Quantified data expressed as mean ± SEM of number of PrPSc+ plaques per square millimeter or Fluoro Jade C+ neurons in CA1. *p < 0.05, **p < 0.01, ***p < 0.001. Data were analyzed with a two-way ANOVA and a post hoc Tukey test (n = 4). A, B, Nuclei are stained with Hoechst (blue). A–C, Fluorescent sections evaluated with confocal microscopy. D, 2D projections of 3D stacks under confocal microscopy. Scale bars: A, 200 μm; B, E, 20 μm; D, 10 μm.
The intracerebral administration of AraC with mini-osmotic pumps caused a significant decrease in cell proliferation in prion-diseased mice compared with saline-treated mice or NBH controls, evidenced by the reduced incorporation of BrDU (Fig. 4A). In parallel, the total number of microglial cells (GFP+) decreased upon treatment with AraC, stopping the expansion observed in saline-treated ME7 mice and keeping the population at control levels (Fig. 4A). We observed a homogeneous effect of the AraC across different regions, such as the hippocampus and the thalamus (Fig. 4A). A conspicuous side effect of the inhibition of microglial mitosis with AraC was a shift in the phenotypic activation of the microglia of prion mice, with an increase in the cell body size and thickness of the processes (Fig. 4D). Moreover, as a result of the AraC treatment, microglial cells (GFP+) in prion mice increased the expression of CD11c, MHCII, and IL1β compared with saline-treated mice (Fig. 4B). Also, at the single-cell level, we observed an inverse correlation of the expression of the CSF1R (GFP+) with the expression of CD11c, a marker associated with antigen-presenting cells (Fig. 4C). As a consequence of the development of a proinflammatory phenotype, blocking of microglial proliferation with AraC had a detrimental neuropathological effect (Fig. 4E). Although the misfolding and deposition of PrPsc was not affected (Fig. 4E, left), AraC caused increased neurodegeneration in ME7 mice, as evidenced by staining with Fluoro Jade C in CA1 (Fig. 4E). We found no Fluoro Jade C+ cells in AraC-treated NBH controls, evidencing the lack of toxicity of the treatment at this concentration (data not shown). Together, these results suggest that a general inhibition of mitosis in the presence of the major mitogens CSF1 and IL34 has a dramatic impact on the phenotype of microglial cells, shifting them to an M1-like antigen-presenting phenotype and accelerating neuronal degeneration.
The selective inhibition of CSF1R activity blocks microglial proliferation and delays the pathological course of prion disease
Based on the observed dependence on CSF1R of microglial proliferation, we evaluated the activity of GW2580, a selective inhibitor of the CSF1R tyrosine kinase activity (Conway et al., 2005; Crespo et al., 2011) to identify the specific contribution of the expansion of the microglial population to the progression of the disease.
The administration of GW2580 caused a significant reduction in microglial proliferation in prion-diseased mice, revealed by a decrease in the number of CD11b+ and BrDU+ cells in the hippocampus, compared with the effect of the vehicle (Fig. 5A). We also found a downregulation of the microglial mitogenic effectors CSF1R, PU.1, and C/EBPα in response to treatment with GW2580 in ME7 mice, associated with a decreased expression of the CSF1R downstream regulators of the cell cycle (Yamamoto et al., 2012), cyclins D1 and D2 (Fig. 5B). GW2580 caused the reduction of the expression of IL1β and IL6, cytokines characteristic of the M1 inflammatory phenotype, and the marker of antigen presentation MHCII (Fig. 5C), opposing the previously observed adverse effects of the inhibition of mitosis with AraC (Fig. 4). Complementarily, GW2580 increased the expression of ARG1 and YM1, markers characteristic of an M2 inflammatory phenotype (Fig. 5C). Also, blocking microglial proliferation in prion disease had beneficial effects over the progression of the neuropathology, evidenced as a decreased number of degenerating neurons (Fluoro Jade C+) in the hippocampus (CA1) upon treatment with GW2580 (Fig. 5D). These results were comparable to those found in the thalamus, where decreased microglial proliferation was also observed, accompanied by a decreased expression of CSF1R, PU.1, C/EBPα, cyclin D1, cyclin D2, IL1β, IL6, and MHCII; and an increased expression of ARG1 and YM1 in response to GW2580 (data not shown).
Figure 5.

Effect of the inhibition of CSF1R on microglial proliferation, inflammatory activation, and neuronal degeneration during prion disease. Effect of the inhibition of the signaling of CSF1R by GW2580 on microglial proliferation (A, B), inflammatory activation (C), and neuropathology (D) of prion disease mice (ME7+GW2580) compared with control (NBH) or prion mice treated with vehicle (ME7+vehicle). A, Analysis of microglial proliferation by immunohistochemistry for CD11b (microglia, red, representative images) and BrDU in the hippocampus of prion disease treated with GW2580 (ME7+GW2580) or vehicle (ME7+Vehicle) and control (NBH) mice. Quantified data expressed as mean±SEM of the number of CD11b+ or BrDU+ cells/mm2. B, C, Analysis of the expression of mRNA of CSF1R, PU.1, C/EBPa, cyclin D1, and cyclin D2 (B) and IL1b, IL6, MHCII, ARG1, and YM1 (C) in the hippocampus (CA1) of prion disease treated with GW2580 (ME7+GW2580) or vehicle (ME7+Vehicle) and control (NBH) mice. B, C, mRNA expression is represented as mean ± SEM and indicated as relative expression levels using the 2ΔΔCt method. D, Effect of GW2580 or vehicle on the degeneration of neurons (Fluoro Jade C-positive neurons, green) in the CA1 layer of the hippocampus of prion (ME7) or control (NBH) mice. Quantified data expressed as mean ± SEM of number of Fluoro Jade C+ neurons in CA1. *p < 0.05, **p < 0.01, ***p < 0.001. Data were analyzed with a one-way ANOVA and a post hoc Tukey test (B, C) or a two-tailed t test (A, D), n = 4. Scale bars: 20 μm.
Treatment with GW2580 arrested the normal decay in burrowing behavior observed from the 14th week in prion mice, maintaining the levels close to those observed in NBH controls (2 and 24 h; Fig. 6A). Similarly, treatment with GW2580 prevented the decay in glucose consumption observed in vehicle-treated prion mice (Fig. 6B). Treatment with GW2580 also delayed the loss of strength and motor coordination observed in vehicle-treated prion mice, as observed by the performance on horizontal bar (Fig. 6C). Similarly, the behavioral course of prion disease is characterized by a phase of hyperactivity, observed in vehicle-treated mice and identified by an increase in the distance traveled and a decrease in the rears in the open field (Fig. 6D). Treatment with GW2580 prevented prion mice from developing the hyperactive behavioral deficit (Fig. 6D). In line with the delay of onset of the behavioral deficits, treatment with GW2580 caused a significant extension of the survival of prion-diseased mice an average of 26.5 d (Fig. 6E).
Figure 6.
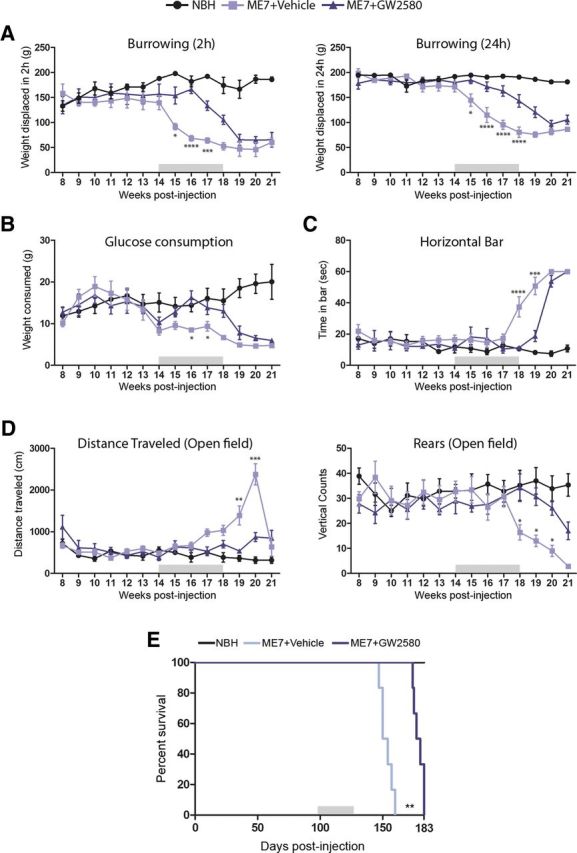
Effect of the inhibition of microglial proliferation over the progression of prion disease. Effect of the inhibition of the signaling of CSF1R by GW2580 on the behavioral performance (A–D) and survival (E) of prion disease mice (ME7+GW2580) compared with control (NBH) or prion mice treated with vehicle (ME7+vehicle). A, Effect of the different treatments on the burrowing behavior, measured as weight displaced (in grams) off the tube in 2 or 24 h. B, Effect of the different treatments on the glucose consumption, measured as weight consumed (in grams) of 5% glucose in water. C, Effect of the different treatments on the motor performance, measured as time spent (in seconds) on the horizontal bar test. D, Effect of the different treatments on the locomotor activity, measured as distance traveled (cm) and number of rears (vertical counts) in the open field test. E, Effect of the different treatments on the survival, analyzed in a Kaplan–Meier curve. *p < 0.05, **p < 0.01, ***p < 0.001, ****p < 0.0001. Data were analyzed with a two-way ANOVA and a post hoc Tukey test (A–D) or with the comparison of the survival curves with a Mantel-Cox test (E); n = 8.
These results show a clear beneficial effect of GW2580 in slowing the progression of the chronic neurodegeneration, highlighting the detrimental contribution of microglial cells to the progression of prion disease.
The microglial proliferation regulatory system is active in human vCJD and AD
The experimental models of murine prion disease provided significant insights about the dynamics and regulation of microglial proliferation during chronic neurodegeneration. However, we were interested to learn whether the system we have described is active in other neurodegenerative conditions; we thus analyzed the regional expression of the main components of the pathway in brain samples of patients of vCJD and AD.
The expression of IL34 is significantly upregulated in the white matter in both vCJD and AD brains compared with the corresponding age-matched controls (Fig. 7A,D). Although we found increased numbers of IL34+ cells in the gray matter of vCJD and AD brains, this difference was not statistically significant in a two-way ANOVA test (Fig. 7D). IL34 was shown to be expressed in GFAP+ reactive astrocytes of vCJD or AD brains, as evidenced by confocal microscopy (Fig. 7H). The expression of PU.1 and C/EBPα was found to be significantly upregulated in vCJD and AD brains, both in the white and gray matter, compared with the corresponding age-matched controls (Fig. 7B,C,E,F). Moreover, we found evidence of microglial proliferation in the temporal cortex of vCJD or AD brains, as shown the colocalization of Ki67 (marker of proliferation) in Iba1+ cells (microglia; Fig. 7G). We found no statistically significant differences in the levels of IL34, PU.1, or C/EBPα between the vCJD and AD brains that were analyzed.
Figure 7.

Expression of the microglial proliferation regulatory proteins in variant Creutzfeldt–Jakob disease and Alzheimer disease. A–C, Immunohistochemical analysis of the expression of IL34 (A), PU.1 (B), and C/EBPa (C) in the white and gray matter of the temporal cortex of vCJD and AD brains compared with age-matched controls (CTL; representative images). Quantification data expressed as mean ± SEM of the number of IL34+ (D), PU.1+ (E), or C/EBPa+ (F) cells per square millimeters. G, H, Immunohistochemical analysis of the expression of Ki67 (marker of proliferation, G) in microglial cells (Iba1+, G) and IL34 (H) in astrocytes (GFAP+, H) in the temporal cortex of vCJD brains. A–C, Nuclei are stained with H/E (blue). G, H, Fluorescent sections evaluated with confocal microscopy. *p < 0.05, **p < 0.01, ****p < 0.0001, expressed versus the correspondent age-matched control. Data were analyzed with a two-way ANOVA and a post hoc Tukey test (n = 9–10). Scale bars: A–C, G, H (in A, G, H), 100 μm.
Together, these results highlight the signaling through CSF1R and the activation of the transcription factors PU.1 and C/EBPα in two different conditions of human neurodegeneration, vCJD and AD.
Discussion
The results reported here represent the first evidence of the regulation of microglial proliferation during the progression of chronic neurodegeneration. We show that the resident microglial population is expanded during the pathological course of prion disease and that they contribute to disease progression.
The expansion of the microglial population is a hallmark of the progression of diverse neuropathologies. Here, we show that there is a dramatic increase in the number of microglial cells during the development of prion disease. Our results are in line with previous studies supporting the hypothesis of local proliferation of resident microglial cells as the major mechanism for population expansion (Ajami et al., 2007; Mildner et al., 2007, 2011). The recent studies highlight the need to use noninvasive or minimally invasive tools to study the recruitment and/or differentiation of circulating progenitors to the brain. A previous study reported recruitment of peripheral BMPs in prion disease (Priller et al., 2006), although the use of irradiation protocols would compound the interpretations about the origin of the microglial expansion, as the recruitment of BMPs to sites of neurodegeneration is rare in conditions where there is no experimental alteration of the system (Mildner et al., 2011; Prinz and Mildner, 2011). Therefore, we conclude now that local proliferation sustains the expansion of the microglial population during prion disease.
During prion disease, microglia have a cytokine profile that resembles that found in models of Alzheimer's or Parkinson's disease, with modest or little contribution of proinflammatory cytokines to the microglial activated phenotype (Perry et al., 2007). Recent reports, using ablation of proliferating CD11b+ cells, suggest a neutral or benign role of microglia during neurodegenerative diseases (Gowing et al., 2008; Grathwohl et al., 2009). However, alternative approaches are needed to suppress microglial proliferation, as the transgenic depletion of microglia in these models could interfere with the normal development of the disease due to an incomplete depletion (Audet et al., 2012) or the generation of a response to massive microglial apoptosis. The use of nonselective antiproliferative agents, like AraC, arrested the microglial expansion but caused a shift to a proinflammatory, antigen-presenting phenotype as a side effect. In the AraC-treated ME7 mice, we can observe two microglial phenotypes: one characterized by high expression of CSFR1 and another, dendritic cell-like, with high expression of MHCII, IL1β, and CD11c. A similar change in response to AraC has been recently described in a model of amyotrophic lateral sclerosis, supporting our findings and highlighting the negative side effects of AraC in neurodegenerative conditions (Audet et al., 2012), correlating with the observed effect of AraC in accelerating the neurodegeneration. Alternatively, the use of genetic manipulation of the components of the CSF1R mitogenic pathway could be of help to study microglial proliferation in disease. However, the critical role of the CSF1R-PU.1-C/EBPα system for the development of the hematopoietic system impacts on the application of knock-out strategies. Mutations in both CSF1R and IL34 do not provide viable mice, while mutations of CSF1 (op/op mice) results in viable mice with numerous developmental abnormalities (for review see Hume and MacDonald, 2012). PU.1−/− mice do not survive longer than 20 d, showing multiple hematopoietic abnormalities (McKercher et al., 1996). C/EBPα−/− mice do not survive longer than 8 h after birth, due to severe hypoglycemia (Wang et al., 1995). Targeting the pathways specifically activated in proliferating microglia provides the opportunity to study the temporal course of the pathology in the presence of a nearly normal density of microglia. Using GW2580 to selectively inhibit the CSF1R tyrosine kinase activity (Conway et al., 2005), we blocked the expansion of the microglial population and identified the harmful contribution of the microglial population to the development of the disease. We found that treatment with GW2580 over the course of prion disease led to significant reduction of neuronal degeneration, reflected in an improvement in the behavioral performance and survival. These results correlate with previous findings reporting a beneficial effect of GW2580 in the treatment of an experimental model of multiple sclerosis (Crespo et al., 2011) and provide a potent tool to target the innate immune response during chronic neurodegeneration.
We identified the system of CSF1R and its mitogens, CSF1 and IL34, as the main drivers of microglial proliferation during chronic neurodegeneration. Although this system was previously related to the control of in vivo microglial proliferation (Kondo et al., 2007), no previous study reported on these effects during chronic neurodegeneration. Inhibition of the activity of CSF1R with a blocking antibody was effective in controlling the expansion of the microglial population, as previously described for other macrophage populations (MacDonald et al., 2010). The activation of the cell cycle in microglia is dependent on CSF1R through the downstream activation of cyclin D (Yamamoto et al., 2012), a feature also observed in our model. The autocrine production of CSF1 has been previously reported to have a role in the control of microglial proliferation (Raivich et al., 1994; Yamamoto et al., 2010). However, the present results are the first evidence of the expression and activity of IL34 in the brain as part of a glial cross-regulatory system. A recent report suggests that IL34 can also be present in neurons, at least at the gene expression level (Wang et al., 2012). Our results suggest a model of microglial proliferation being controlled by the paracrine production of IL34 coming from astrocytes at early stages of the disease to be further maintained by the autocrine production of CSF1 in microglial cells. This bivalent regulation of microglial proliferation also appears to have a prominent role in human AD and vCJD. We found increased IL34-expressing astrocytes in the white matter of the temporal cortex of AD and vCJD brains, suggesting an IL34-dependent regulation of microglial proliferation in the white matter, while an autocrine system could be active in the gray matter. Although these results define new signals and mechanisms regulating microglial proliferation, we still need to identify which stimuli drive the production of IL34 in astrocytes, as this is likely a key initial step defining the progression of the glial reaction in neuropathology.
An important finding reported in this work is the role of the transcription factors PU.1 and C/EBPα in the regulation of the microglial proliferation. Both PU.1 and C/EBPα regulate microglial proliferation during the development of prion disease and appear upregulated in human vCJD and AD, correlating with previous findings using expression profiling of incipient AD (Blalock et al., 2004). Little is known about the role of PU.1 in microglial biology, although some reports highlight the potential roles of this transcription factor as a regulator of microglial physiology (Walton et al., 2000). PU.1 is a master regulator of myeloid differentiation and induces the expression of CD45, CD11b, F4/80, and MHC class II as well as regulating cell proliferation by upregulating the CSF1R (Celada et al., 1996; Nishiyama et al., 2004). Moreover, a regulatory network has been recently described in microglia, involving the control by miRNA124 of the activity of C/EBPα and its downstream regulator PU.1 (Ponomarev et al., 2011). The temporal dynamics and levels of expression of PU.1 and C/EBPα in prion disease support the model of a cooperative effect in the control of microglial proliferation (Ponomarev et al., 2011), with PU.1 acting as a final effector hub, due to the transcriptional control of C/EBPα over the PU.1 promoter (Yeamans et al., 2007; Cai et al., 2008). Our results support the key role of PU.1 and C/EBPα in controlling the microglial population expansion and define a useful target for therapeutic interventions controlling microglial population dynamics.
We propose that microglial priming stems from the activation of the CSF1R. It has been suggested that macrophage inflammation can be viewed as a state of “CSF1-resistance,” as continued activation of this mitogenic pathway maintains cells in an M2-like phenotype (Hamilton, 2008). The M2-like phenotype of prion-diseased microglia, characterized by high expression of TGFβ (Boche et al., 2006) and active proliferation, can be switched to an M1 phenotype upon systemic stimulation with LPS, accelerating disease as a consequence of a priming effect (Perry et al., 2002, 2007). Changes in the local microenvironment, like focal cell death or peripheral inflammation, can drive a profound change in the phenotype of these primed microglia, arresting proliferation through the activation of TLR4 and inhibition of the PU.1-C/EBPα system (Ejarque-Ortiz et al., 2007; Tusell et al., 2009) and generating a tissue-damaging proinflammatory phenotype. The observed inverse correlation of the expression of CSF1R and CD11c supports the theory of the proliferative and proinflammatory phenotypes in microglial cells being mutually exclusive, with a prominent role of the CSF1R-C/EBPα-PU.1 system.
To conclude, we describe the temporal and spatial dynamics of microglial proliferation during chronic neurodegeneration, with the activation of CSF1R and the transcription factors PU.1 and C/EBPα as the key actors of the regulatory network. We show that microglia proliferation is driven by CSF1 and IL34 and demonstrated that arresting microglial proliferation during neurodegeneration significantly delays progression of the disease, indicating an overall harmful contribution by the microglial cells, and a route to further delaying disease progression.
Footnotes
This work was supported by the European Union Seventh Framework Programme under Grant Agreement IEF273243, by a postdoctoral fellowship of the Ministerio de Education (Spain), and by a pilot grant of Alzheimer Research UK. We thank David Hume (The Roslin Institute, University of Edinburgh, UK) for providing the c-fms-EGFP mice and Mike Broome for technical assistance. We thank the National CJD Surveillance Unit Brain Bank (Edinburg, UK) for the provision of human samples.
The authors declare no competing financial interests.
References
- Ajami B, Bennett JL, Krieger C, Tetzlaff W, Rossi FM. Local self-renewal can sustain CNS microglia maintenance and function throughout adult life. Nat Neurosci. 2007;10:1538–1543. doi: 10.1038/nn2014. [DOI] [PubMed] [Google Scholar]
- Audet JN, Gowing G, Paradis R, Soucy G, Julien JP. Ablation of proliferating cells in the CNS exacerbates motor neuron disease caused by mutant superoxide dismutase. PloS One. 2012;7:e34932. doi: 10.1371/journal.pone.0034932. [DOI] [PMC free article] [PubMed] [Google Scholar]
- Blalock EM, Geddes JW, Chen KC, Porter NM, Markesbery WR, Landfield PW. Incipient Alzheimer's disease: microarray correlation analyses reveal major transcriptional and tumor suppressor responses. Proc Natl Acad Sci U S A. 2004;101:2173–2178. doi: 10.1073/pnas.0308512100. [DOI] [PMC free article] [PubMed] [Google Scholar]
- Boche D, Cunningham C, Docagne F, Scott H, Perry VH. TGFbeta1 regulates the inflammatory response during chronic neurodegeneration. Neurobiol Dis. 2006;22:638–650. doi: 10.1016/j.nbd.2006.01.004. [DOI] [PubMed] [Google Scholar]
- Cai DH, Wang D, Keefer J, Yeamans C, Hensley K, Friedman AD. C/EBP alpha:AP-1 leucine zipper heterodimers bind novel DNA elements, activate the PU.1 promoter and direct monocyte lineage commitment more potently than C/EBP alpha homodimers or AP-1. Oncogene. 2008;27:2772–2779. doi: 10.1038/sj.onc.1210940. [DOI] [PMC free article] [PubMed] [Google Scholar]
- Celada A, Borràs FE, Soler C, Lloberas J, Klemsz M, van Beveren C, McKercher S, Maki RA. The transcription factor PU. 1 is involved in macrophage proliferation. J Exp Med. 1996;184:61–69. doi: 10.1084/jem.184.1.61. [DOI] [PMC free article] [PubMed] [Google Scholar]
- Conway JG, McDonald B, Parham J, Keith B, Rusnak DW, Shaw E, Jansen M, Lin P, Payne A, Crosby RM, Johnson JH, Frick L, Lin MH, Depee S, Tadepalli S, Votta B, James I, Fuller K, Chambers TJ, Kull FC, et al. Inhibition of colony-stimulating-factor-1 signaling in vivo with the orally bioavailable cFMS kinase inhibitor GW2580. Proc Natl Acad Sci U S A. 2005;102:16078–16083. doi: 10.1073/pnas.0502000102. [DOI] [PMC free article] [PubMed] [Google Scholar]
- Crespo O, Kang SC, Daneman R, Lindstrom TM, Ho PP, Sobel RA, Steinman L, Robinson WH. Tyrosine kinase inhibitors ameliorate autoimmune encephalomyelitis in a mouse model of multiple sclerosis. J Clin Immunol. 2011;31:1010–1020. doi: 10.1007/s10875-011-9579-6. [DOI] [PMC free article] [PubMed] [Google Scholar]
- Cunningham C, Deacon R, Wells H, Boche D, Waters S, Diniz CP, Scott H, Rawlins JN, Perry VH. Synaptic changes characterize early behavioural signs in the ME7 model of murine prion disease. Eur J Neurosci. 2003;17:2147–2155. doi: 10.1046/j.1460-9568.2003.02662.x. [DOI] [PubMed] [Google Scholar]
- Doetsch F, García-Verdugo JM, Alvarez-Buylla A. Regeneration of a germinal layer in the adult mammalian brain. Proc Natl Acad Sci U S A. 1999;96:11619–11624. doi: 10.1073/pnas.96.20.11619. [DOI] [PMC free article] [PubMed] [Google Scholar]
- Ejarque-Ortiz A, Tusell JM, Serratosa J, Saura J. CCAAT/enhancer binding protein-alpha is down-regulated by toll-like receptor agonists in microglial cells. J Neurosci Res. 2007;85:985–993. doi: 10.1002/jnr.21195. [DOI] [PubMed] [Google Scholar]
- Ginhoux F, Greter M, Leboeuf M, Nandi S, See P, Gokhan S, Mehler MF, Conway SJ, Ng LG, Stanley ER, Samokhvalov IM, Merad M. Fate mapping analysis reveals that adult microglia derive from primitive macrophages. Science. 2010;330:841–845. doi: 10.1126/science.1194637. [DOI] [PMC free article] [PubMed] [Google Scholar]
- Gómez-Nicola D, Valle-Argos B, Pita-Thomas DW, Nieto-Sampedro M. Interleukin 15 expression in the CNS: blockade of its activity prevents glial activation after an inflammatory injury. Glia. 2008;56:494–505. doi: 10.1002/glia.20628. [DOI] [PubMed] [Google Scholar]
- Gómez-Nicola D, Valle-Argos B, Pallas-Bazarra N, Nieto-Sampedro M. Interleukin-15 regulates proliferation and self-renewal of adult neural stem cells. Mol Biol Cell. 2011;22:1960–1970. doi: 10.1091/mbc.E11-01-0053. [DOI] [PMC free article] [PubMed] [Google Scholar]
- Gowing G, Philips T, Van Wijmeersch B, Audet JN, Dewil M, Van Den Bosch L, Billiau AD, Robberecht W, Julien JP. Ablation of proliferating microglia does not affect motor neuron degeneration in amyotrophic lateral sclerosis caused by mutant superoxide dismutase. J Neurosci. 2008;28:10234–10244. doi: 10.1523/JNEUROSCI.3494-08.2008. [DOI] [PMC free article] [PubMed] [Google Scholar]
- Grathwohl SA, Kälin RE, Bolmont T, Prokop S, Winkelmann G, Kaeser SA, Odenthal J, Radde R, Eldh T, Gandy S, Aguzzi A, Staufenbiel M, Mathews PM, Wolburg H, Heppner FL, Jucker M. Formation and maintenance of Alzheimer's disease beta-amyloid plaques in the absence of microglia. Nat Neurosci. 2009;12:1361–1363. doi: 10.1038/nn.2432. [DOI] [PMC free article] [PubMed] [Google Scholar]
- Hamilton JA. Colony-stimulating factors in inflammation and autoimmunity. Nat Rev Immunol. 2008;8:533–544. doi: 10.1038/nri2356. [DOI] [PubMed] [Google Scholar]
- Hume DA, MacDonald KP. Therapeutic applications of macrophage colony-stimulating factor-1 (CSF-1) and antagonists of CSF-1 receptor (CSF-1R) signaling. Blood. 2012;119:1810–1820. doi: 10.1182/blood-2011-09-379214. [DOI] [PubMed] [Google Scholar]
- Jensen MB, González B, Castellano B, Zimmer J. Microglial and astroglial reactions to anterograde axonal degeneration: a histochemical and immunocytochemical study of the adult rat fascia dentata after entorhinal perforant path lesions. Exp Brain Res. 1994;98:245–260. doi: 10.1007/BF00228413. [DOI] [PubMed] [Google Scholar]
- Kondo Y, Lemere CA, Seabrook TJ. Osteopetrotic (op/op) mice have reduced microglia, no Abeta deposition, and no changes in dopaminergic neurons. J Neuroinflammation. 2007;4:31. doi: 10.1186/1742-2094-4-31. [DOI] [PMC free article] [PubMed] [Google Scholar]
- Lawson LJ, Perry VH, Gordon S. Turnover of resident microglia in the normal adult mouse brain. Neuroscience. 1992;48:405–415. doi: 10.1016/0306-4522(92)90500-2. [DOI] [PubMed] [Google Scholar]
- MacDonald KP, Palmer JS, Cronau S, Seppanen E, Olver S, Raffelt NC, Kuns R, Pettit AR, Clouston A, Wainwright B, Branstetter D, Smith J, Paxton RJ, Cerretti DP, Bonham L, Hill GR, Hume DA. An antibody against the colony-stimulating factor 1 receptor depletes the resident subset of monocytes and tissue- and tumor-associated macrophages but does not inhibit inflammation. Blood. 2010;116:3955–3963. doi: 10.1182/blood-2010-02-266296. [DOI] [PubMed] [Google Scholar]
- McKercher SR, Torbett BE, Anderson KL, Henkel GW, Vestal DJ, Baribault H, Klemsz M, Feeney AJ, Wu GE, Paige CJ, Maki RA. Targeted disruption of the PU. 1 gene results in multiple hematopoietic abnormalities. EMBO J. 1996;15:5647–5658. [PMC free article] [PubMed] [Google Scholar]
- Mildner A, Schmidt H, Nitsche M, Merkler D, Hanisch UK, Mack M, Heikenwalder M, Brück W, Priller J, Prinz M. Microglia in the adult brain arise from ly-6ChiCCR2+ monocytes only under defined host conditions. Nat Neurosci. 2007;10:1544–1553. doi: 10.1038/nn2015. [DOI] [PubMed] [Google Scholar]
- Mildner A, Schlevogt B, Kierdorf K, Böttcher C, Erny D, Kummer MP, Quinn M, Brück W, Bechmann I, Heneka MT, Priller J, Prinz M. Distinct and non-redundant roles of microglia and myeloid subsets in mouse models of Alzheimer's disease. J Neurosci. 2011;31:11159–11171. doi: 10.1523/JNEUROSCI.6209-10.2011. [DOI] [PMC free article] [PubMed] [Google Scholar]
- Mizuno T, Doi Y, Mizoguchi H, Jin S, Noda M, Sonobe Y, Takeuchi H, Suzumura A. Interleukin-34 selectively enhances the neuroprotective effects of microglia to attenuate oligomeric amyloid-beta neurotoxicity. Am J Pathol. 2011;179:2016–2027. doi: 10.1016/j.ajpath.2011.06.011. [DOI] [PMC free article] [PubMed] [Google Scholar]
- Murphy GM, Jr, Zhao F, Yang L, Cordell B. Expression of macrophage colony-stimulating factor receptor is increased in the AbetaPP(V717F) transgenic mouse model of Alzheimer's disease. Am J Pathol. 2000;157:895–904. doi: 10.1016/S0002-9440(10)64603-2. [DOI] [PMC free article] [PubMed] [Google Scholar]
- Nishiyama C, Nishiyama M, Ito T, Masaki S, Masuoka N, Yamane H, Kitamura T, Ogawa H, Okumura K. Functional analysis of PU.1 domains in monocyte-specific gene regulation. FEBS Lett. 2004;561:63–68. doi: 10.1016/S0014-5793(04)00116-4. [DOI] [PubMed] [Google Scholar]
- Perry VH, Cunningham C, Boche D. Atypical inflammation in the central nervous system in prion disease. Curr Opin Neurol. 2002;15:349–354. doi: 10.1097/00019052-200206000-00020. [DOI] [PubMed] [Google Scholar]
- Perry VH, Cunningham C, Holmes C. Systemic infections and inflammation affect chronic neurodegeneration. Nat Rev Immunol. 2007;7:161–167. doi: 10.1038/nri2015. [DOI] [PubMed] [Google Scholar]
- Ponomarev ED, Shriver LP, Maresz K, Dittel BN. Microglial cell activation and proliferation precedes the onset of CNS autoimmunity. J Neurosci Res. 2005;81:374–389. doi: 10.1002/jnr.20488. [DOI] [PubMed] [Google Scholar]
- Ponomarev ED, Veremeyko T, Barteneva N, Krichevsky AM, Weiner HL. MicroRNA-124 promotes microglia quiescence and suppresses EAE by deactivating macrophages via the C/EBP-alpha-PU. 1 pathway. Nat Med. 2011;17:64–70. doi: 10.1038/nm.2266. [DOI] [PMC free article] [PubMed] [Google Scholar]
- Priller J, Prinz M, Heikenwalder M, Zeller N, Schwarz P, Heppner FL, Aguzzi A. Early and rapid engraftment of bone marrow-derived microglia in scrapie. J Neurosci. 2006;26:11753–11762. doi: 10.1523/JNEUROSCI.2275-06.2006. [DOI] [PMC free article] [PubMed] [Google Scholar]
- Prinz M, Mildner A. Microglia in the CNS: immigrants from another world. Glia. 2011;59:177–187. doi: 10.1002/glia.21104. [DOI] [PubMed] [Google Scholar]
- Raivich G, Moreno-Flores MT, Möller JC, Kreutzberg GW. Inhibition of posttraumatic microglial proliferation in a genetic model of macrophage colony-stimulating factor deficiency in the mouse. Eur J Neurosci. 1994;6:1615–1618. doi: 10.1111/j.1460-9568.1994.tb00552.x. [DOI] [PubMed] [Google Scholar]
- Raivich G, Haas S, Werner A, Klein MA, Kloss C, Kreutzberg GW. Regulation of MCSF receptors on microglia in the normal and injured mouse central nervous system: a quantitative immunofluorescence study using confocal laser microscopy. J Comp Neurol. 1998;395:342–358. doi: 10.1002/(sici)1096-9861(19980808)395:3<342::aid-cne6>3.0.co;2-2. [DOI] [PubMed] [Google Scholar]
- Ransohoff RM, Perry VH. Microglial physiology: unique stimuli, specialized responses. Annu Rev Immunol. 2009;27:119–145. doi: 10.1146/annurev.immunol.021908.132528. [DOI] [PubMed] [Google Scholar]
- Sasmono RT, Oceandy D, Pollard JW, Tong W, Pavli P, Wainwright BJ, Ostrowski MC, Himes SR, Hume DA. A macrophage colony-stimulating factor receptor-green fluorescent protein transgene is expressed throughout the mononuclear phagocyte system of the mouse. Blood. 2003;101:1155–1163. doi: 10.1182/blood-2002-02-0569. [DOI] [PubMed] [Google Scholar]
- Schulz C, Gomez Perdiguero E, Chorro L, Szabo-Rogers H, Cagnard N, Kierdorf K, Prinz M, Wu B, Jacobsen SE, Pollard JW, Frampton J, Liu KJ, Geissmann F. A lineage of myeloid cells independent of Myb and hematopoietic stem cells. Science. 2012;336:86–90. doi: 10.1126/science.1219179. [DOI] [PubMed] [Google Scholar]
- Tusell JM, Ejarque-Ortiz A, Mancera P, Solà C, Saura J, Serratosa J. Upregulation of p21Cip1 in activated glial cells. Glia. 2009;57:524–534. doi: 10.1002/glia.20781. [DOI] [PubMed] [Google Scholar]
- Walton MR, Gibbons H, MacGibbon GA, Sirimanne E, Saura J, Gluckman PD, Dragunow M. PU. 1 expression in microglia. J Neuroimmunol. 2000;104:109–115. doi: 10.1016/s0165-5728(99)00262-3. [DOI] [PubMed] [Google Scholar]
- Wang ND, Finegold MJ, Bradley A, Ou CN, Abdelsayed SV, Wilde MD, Taylor LR, Wilson DR, Darlington GJ. Impaired energy homeostasis in C/EBP alpha knockout mice. Science. 1995;269:1108–1112. doi: 10.1126/science.7652557. [DOI] [PubMed] [Google Scholar]
- Wang Y, Szretter KJ, Vermi W, Gilfillan S, Rossini C, Cella M, Barrow AD, Diamond MS, Colonna M. IL-34 is a tissue-restricted ligand of CSF1R required for the development of Langerhans cells and microglia. Nat Immunol. 2012;13:753–760. doi: 10.1038/ni.2360. [DOI] [PMC free article] [PubMed] [Google Scholar]
- Wei S, Nandi S, Chitu V, Yeung YG, Yu W, Huang M, Williams LT, Lin H, Stanley ER. Functional overlap but differential expression of CSF-1 and IL-34 in their CSF-1 receptor-mediated regulation of myeloid cells. J Leukoc Biol. 2010;88:495–505. doi: 10.1189/jlb.1209822. [DOI] [PMC free article] [PubMed] [Google Scholar]
- Yamamoto S, Nakajima K, Kohsaka S. Macrophage-colony stimulating factor as an inducer of microglial proliferation in axotomized rat facial nucleus. J Neurochem. 2010;115:1057–1067. doi: 10.1111/j.1471-4159.2010.06996.x. [DOI] [PubMed] [Google Scholar]
- Yamamoto S, Kohsaka S, Nakajima K. Role of cell cycle-associated proteins in microglial proliferation in the axotomized rat facial nucleus. Glia. 2012;60:570–581. doi: 10.1002/glia.22291. [DOI] [PubMed] [Google Scholar]
- Yeamans C, Wang D, Paz-Priel I, Torbett BE, Tenen DG, Friedman AD. C/EBPalpha binds and activates the PU. 1 distal enhancer to induce monocyte lineage commitment. Blood. 2007;110:3136–3142. doi: 10.1182/blood-2007-03-080291. [DOI] [PMC free article] [PubMed] [Google Scholar]
- Zhang DE, Hetherington CJ, Chen HM, Tenen DG. The macrophage transcription factor PU. 1 directs tissue-specific expression of the macrophage colony-stimulating factor receptor. Mol Cell Biol. 1994;14:373–381. doi: 10.1128/mcb.14.1.373. [DOI] [PMC free article] [PubMed] [Google Scholar]
- Zhang P, Behre G, Pan J, Iwama A, Wara-Aswapati N, Radomska HS, Auron PE, Tenen DG, Sun Z. Negative cross-talk between hematopoietic regulators: GATA proteins repress PU. 1. Proc Natl Acad Sci U S A. 1999;96:8705–8710. doi: 10.1073/pnas.96.15.8705. [DOI] [PMC free article] [PubMed] [Google Scholar]