

Abstract
The possibility of inducing a suspended animation state similar to natural torpor would be greatly beneficial in medical science, since it would avoid the adverse consequence of the powerful autonomic activation evoked by external cooling. Previous attempts to systemically inhibit metabolism were successful in mice, but practically ineffective in nonhibernators. Here we show that the selective pharmacological inhibition of key neurons in the central pathways for thermoregulatory cold defense is sufficient to induce a suspended animation state, resembling natural torpor, in a nonhibernator. In rats kept at an ambient temperature of 15°C and under continuous darkness, the prolonged inhibition (6 h) of the rostral ventromedial medulla, a key area of the central nervous pathways for thermoregulatory cold defense, by means of repeated microinjections (100 nl) of the GABAA agonist muscimol (1 mm), induced the following: (1) a massive cutaneous vasodilation; (2) drastic drops in deep brain temperature (reaching a nadir of 22.44 ± 0.74°C), heart rate (from 440 ± 13 to 207 ± 12 bpm), and electroencephalography (EEG) power; (3) a modest decrease in mean arterial pressure; and (4) a progressive shift of the EEG power spectrum toward slow frequencies. After the hypothermic bout, all animals showed a massive increase in NREM sleep Delta power, similarly to that occurring in natural torpor. No behavioral abnormalities were observed in the days following the treatment. Our results strengthen the potential role of the CNS in the induction of hibernation/torpor, since CNS-driven changes in organ physiology have been shown to be sufficient to induce and maintain a suspended animation state.
Introduction
Suspended animation is a temporary and fully reversible condition characterized by hypometabolism and deep hypothermia, during which physiological functions are slowed down. In mammals, this condition spontaneously occurs under the form of torpor and hibernation, which are triggered by environmental factors (Melvin and Andrews, 2009). The cellular and molecular mechanisms of natural suspended animation are still unknown (Carey et al., 2003), but since hypothermia is preceded by a metabolic rate reduction (Heldmaier et al., 2004), it has been hypothesized that two basic players take part in inducing a reduction in metabolism: humoral factors (Andrews, 2007) and the CNS (Drew et al., 2007).
The intervention of humoral factors has recently been highlighted by the induction of a suspended animation state in mice, a species where torpor occurs naturally, by the administration of several substances interfering with cell metabolism (Scanlan et al., 2004; Blackstone et al., 2005; Gluck et al., 2006; Zhang et al., 2006). However, the translational outcomes of this approach (Lee, 2008) have been hampered, so far, by the failure to replicate these results in nonhibernators (Haouzi et al., 2008, Zhang et al., 2009). Although the intervention of the CNS in determining natural suspended animation remains largely unexplored (Drew et al., 2007), the increase in heat loss and the decrease in heat generation that follow the chemical manipulation of the central nervous pathways for thermoregulatory cold defense (Morrison and Nakamura, 2011) suggests that the reduction in metabolism may also be actively driven by the CNS.
A key area in the central nervous pathways for thermoregulatory cold defense is the rostral ventromedial medulla (RVMM), a region including the raphe pallidus (RPa) and the raphe magnus, where the putative sympathetic premotor neurons to the brown adipose tissue (BAT), the cutaneous blood vessel, and the heart are located (Cano et al., 2003). The activation of RPa neurons has been shown to promote nonshivering (Morrison et al., 1999) and shivering (Nakamura and Morrison, 2011) thermogenesis, cutaneous vasoconstriction (Blessing and Nalivaiko, 2001), and an increase in heart rate (Zaretsky et al., 2003). Also, the short-term inhibition of RVMM neurons in free-behaving rats has been shown to cause a modest hypothermia (Zaretsky et al., 2003) through an increase in cutaneous heat dissipation and, probably, through a reduction in heat produced by the BAT (Cerri et al., 2010). The aim of this study was to test the possibility of inducing a suspended animation state in the free-behaving rat by means of a prolonged blockade of the central nervous pathways for thermoregulatory cold defense, through the pharmacological inhibition of the RVMM.
By choosing a nonhibernator we aimed to explore a possible translational extension of the results in view of the hypothesis that the capacity for suspended animation may represent a common trait for mammals (Harris et al., 2004). To assess whether the effects induced by muscimol resembled those observed in natural hibernators during and/or after a torpor bout, we monitored some autonomic parameters and related indices, wake–sleep behavior, and electroencephalographic (EEG) activity.
Materials and Methods
Ethical approval.
The experiments were performed with the approval of the Comitato Etico-Scientifico dell'Università di Bologna (Ethical-Scientific Committee of the University of Bologna), in accordance with the European Union Directive (86/609/EEC) and under the supervision of the Central Veterinary Service of the University of Bologna and the National Health Authority. All efforts were made to minimize the number of animals used and their pain and distress.
Surgical procedures.
Male CD Sprague Dawley rats (n = 22; Charles River Inc) were deeply anesthetized [diazepam; (F. Hoffmann-La Roche), 5 mg/kg, i.m., followed by ketamine-HCl (Ketavet; Parke-Davis), 100 mg/kg, i.p.] and placed in a stereotaxic apparatus (David Kopf Instruments) with the incisor bar set to keep the bregma and lambda on the same horizontal plane. Animals were surgically implanted with the following: (1) electrodes for EEG and nuchal electromyographic (EMG) recording; (2) a catheter placed into the femoral artery for the telemetric recording of arterial pressure (AP) (PA-C40; DataSciences International); (3) a hypothalamic thermistor (B10KA303N; Thermometrics) mounted inside a stainless-steel needle (21 gauge) stereotaxically implanted above the left anterior hypothalamus to record the deep brain temperature (Tbrain); and (4) a microinjection guide cannula (C315G-SPC; Plastics One; internal cannula extension below guide: +3.5 mm), stereotaxically positioned to target the RVMM. Considering that a modest hypothermia was elicited by the injection of the GABAA agonist muscimol within an extended region of the RVMM (Cerri et al., 2010), the cannula was placed within the following coordinate range: −3.0 to −4.0 mm posterior to lambda, 0.0 mm lateral to the midline, −9.0 to −9.5 mm ventral to the dorsal surface of the cerebellum. Optimal cannula positioning was assessed as described below, after which the cannula was then secured to the skull with four stainless steel screws and acrylic dental resin. After surgery, animals received 20 ml/kg saline subcutaneously and 0.25 ml of an antibiotic solution (penicillin G, 37500 IU; streptomycin-sulfate, 8750 IU) intramuscularly. Animals recovered from surgery for at least 1 week, initially in their home cage and subsequently, for at least 3 d, in a Plexiglas cage with a stainless steel grid floor (wire diameter = 2 mm, interwire distance = 10 mm). The cage was positioned within a thermoregulated sound-attenuated chamber where animals were kept throughout the experiment. During recovery from surgery, animals were kept at an ambient temperature (Ta) of 24°C ± 0.5°C and under a 12 h light/dark cycle (light on at 0900, 100 lux at cage level), and had access to food and water ad libitum. The cage was also equipped with an infrared thermocamera (Thermovision A20; FLIR Systems), positioned under the stainless steel grid floor, to measure cutaneous temperature.
Cannula positioning.
In a previous study from our lab (Cerri et al., 2010) it was shown that that a single muscimol injection in either the rostral portion (localized at the level of the nucleus of the seventh cranial nerve) or the caudal portion (localized at the level of the inferior olive) of the RVMM evokes a massive cutaneous vasodilation. This suggests that a population of tonically active neurons controlling cutaneous vasomotion is distributed throughout the entire RVMM. A consolidated literature on the localization of the sympathetic premotor neurons to the BAT (Cano et al., 2003; Nakamura et al., 2004) showed a nonhomogeneous distribution of neuronal phenotypes within the RVMM, with a prevalence of glutamatergic VGLUT3 positive neurons in the rostral portion and a prevalence of serotoninergic neurons in the caudal portion of the RVMM. Since a discrimination of the role played by these two populations in inducing hypothermia was not among the aims of the present study, we targeted the central portion of the RVMM for the microinjections.
To further assess the functional activity of the cannula location site, a microinjection of muscimol (1 mm, 100 nl) was performed during surgery and the degree of tail vasodilation was monitored by infrared thermography. The target area was therefore more precisely defined in functional terms than in anatomical terms. Animals (n = 3) that did not show any response to the muscimol injection during surgery were not admitted to the experimental protocol. The injection site of these animals was also marked and histological sections of the brain were prepared as described below.
Experimental protocols.
After recovery from surgery (1 week to 10 d), starting at light onset, animals were exposed to novel ambient conditions that are known to favor the occurrence of a hypometabolic state in hibernators: Ta 15°C, constant darkness and a high-fat diet (35% fats, Mucedola). During the fourth day of exposure (Injection Day), starting at 1100 h, two groups of animals were injected with either the GABAA agonist muscimol [(the M28 (n = 7) and M37 (n = 6) group) or saline 0.9% (the Saline group (n = 6))] into the RVMM. Each animal received, starting from 11:00, a total of six injections (1/h) (see below, Microinjection procedures).
In consideration of the low Tbrain reached at the end of the injection period, a strong activation of the sympathetic nervous system was expected when the effect of the drug had worn off. An assisted rewarming strategy was used, therefore, to reduce the sympathetic activation by increasing Ta. However, to evaluate the safest strategy to assist the regaining of normothermia, two different rewarming protocols were tested. According to these, at 17:00 h, to favor the rewarming of hypothermic animals, Ta was raised for both groups (Saline and M28) and kept at 28°C for the rest of the Injection Day and for the following day (Recovery Day). A third group of animals (the M37 group) was injected with muscimol according to the previous protocol, but at the 1700 h of the Injection Day Ta was taken from 15–37°C and, then, after 1 h (the time needed for the return of Tbrain to physiological levels) it was decreased and kept at 28°C. This procedure was aimed at helping hypothermic animals to recover normothermia without any major metabolic effort. For the three groups, recordings were performed for three consecutive days: the day preceding the Injection Day (Day 1), the Injection Day (Day 2), and the Recovery Day (Day3). After Day 3, animals were hosted in the animal house under standard laboratory conditions and were inspected every day to evaluate the possible appearance of long-term post-treatment effects.
Microinjection procedures.
The microinjection apparatus was located outside the sound-attenuated recording chamber so that animals remained unaware and undisturbed by the injection procedure. All microinjection procedures were performed as follows. At 10:55, under a dim red light, a microinjecting cannula was inserted into the guide cannula (without removing the animal from its cage). The injection system consisted of a Hamilton 5 μl gastight syringe (Hamilton) positioned in an infusion pump (MA 01746; Harvard Apparatus, infusion rate 0.3 μl/min) and connected to the internal cannula through 1 m of microdialysis FEP tubing (ID 0.12 mm, OD 0.65 mm; Microbiotech/se AB). The cannula and the tube were filled with either the GABAA agonist muscimol (1 mm) dissolved in vehicle solution (saline, NaCl 0.9% w/v) or vehicle solution only, while the syringe was filled with colored mineral oil. During each injection (average duration: 30 ± 5 s), the volume of injectate (100 nl) was microscopically assessed by the movement of the oil-injectate interface over a ruler. Drugs for microinjection were obtained from Tocris Bioscience. Unless strictly necessary, the internal cannula was not extracted from the guide cannula until the end of the experiment, and it was gently removed 30 min after the last injection.
Histology.
At the end of the experiment, the injection site was marked with 80 nl of Fast Green 2% dye. Rats were anesthetized with ketamine as described above and transcardially perfused (4% 40 g/L paraformaldehyde). The brain was extracted and postfixed overnight with 4% paraformaldehyde and then cryoprotected (30% 200 g/L sucrose). The medulla was cut (60 μm) coronally on a cryostat and sections containing a dye spot were digitally photographed. Two examples of injection site are shown in Figure 1.
Figure 1.

Distribution and location of RVMM injection sites. The location of every injection site (A), marked with fast green at the end of each experimental procedure, is schematically plotted on atlas drawings (Paxinos and Watson, 2007) at four rostrocaudal levels of the RVMM. Distance from bregma is indicated in millimeters under each drawing. Example of marked sites at two different rostrocaudal level are visible in B and C. 7n, nucleus of the VII cranial nerve; IO, inferior olive; Py, pyramids; ROb, raphe obscurus; RPa, raphe pallidus.
Signal recording and data analysis.
The EEG, EMG, and Tbrain signals were recorded by means of insulated copper wires connecting the headsocket to a swivel, amplified (Grass 7P511L; Astro-Med), filtered (EEG: highpass 0.3 Hz, lowpass 30 Hz; EMG highpass 100 Hz, lowpass 1 kHz; Tbrain highpass 0.5 Hz), 12-bit digitalized (Micro MK 1401 IIl; CED; acquisition rate: EEG, 1 KHz; EMG, 1 KHz; Tbrain, 100 Hz), and acquired on a digital hard drive. AP signal was telemetrically recorded, amplified, and digitally stored on a hard drive (acquisition rate: 500 Hz). Heart rate (HR) was derived from AP peak detection. Digital images from the thermocamera were acquired at 1 frame/s and the temperature of the tail (Ttail) was determinated by analyzing the thermographic record (Thermocam Researcher; FLIR Systems). Examples of the recorded autonomic and EEG variables and infrared images are shown are shown in Figure 2.
Figure 2.

Example of the suspended animation state induced by repeated injection of muscimol in the RVMM. In an animal exposed to constant darkness at a Ta of 15°C, (A) repeated injection of muscimol in RVMM (black arrows at the top) induced a suspended animation state characterized by a reduction in deep brain temperature (Tbrain), HR, EEG voltage, and a shift of the EEG power spectrum. No major changes in AP were observed. Infrared images at the bottom show the state of cutaneous vasomotion: in the pre-injection period (B), following the first injection of muscimol in RVMM (C), and at the end of treatment (D).
Ttail was measured in the medial portion of the tail using the recorded infrared images. Heat loss index (HLI) for the M28 group was calculated according to Romanovsky et al., (2002).
EEG power spectrum was calculated from a 4 s long 1 s sliding window. EEG total power and power bands (Delta, 0.5–4.5 Hz, Theta, 5.0–9.0 Hz; Sigma, 11.0–15.0 Hz) were normalized to the mean value (100%) of the Day 1 (baseline) recording. Sleep stages were visually scored by an operator (1 s resolution), using a script developed for Spike2 (sleep score). Wake, NREM sleep, and REM sleep were scored according to standard criteria based on EEG, EMG, and Tbrain signals (Franken et al., 1991; Cerri et al., 2005). The time for the minimal duration of a wake–sleep episode was set at 4 s for Wake and 8 s for NREM sleep and REM sleep (Cerri et al., 2005).
Due to technical problem in the hypothalamic thermistor in one animal in the M28 group, Tbrain data were analyzed on six animals.
Values are reported as mean ± SEM. A two-way repeated-measures ANOVA (SPSS 19.0) was used for the statistical analysis of the results of Day 2 and, with a different time resolution, of Day 1 and Day 3. In both cases, the modified t test (t*) was used for preplanned orthogonal and for preplanned nonorthogonal contrasts (Wallenstein et al., 1980; Winer et al., 1991). In the latter, the α level was adjusted using the sequential Bonferroni method (Holm, 1979). For the analysis of Day 2, the main factors were defined as follows: (1) the factor “time” (which was considered for repeated measures) had 48 levels, corresponding to each 30 min interval of the whole 24 h period and (2) the factor “Experimental Condition” had three levels (Saline, M28, and M37). For each 30 min interval of the factor time, data were compared by means of orthogonal contrasts as follows: Saline versus [M28 + M37]; M28 versus M37. The following preplanned nonorthogonal contrasts were tested: Saline versus M28; Saline versus M37.
For the analysis of Day 1 and Day 3, the main factors were defined as follows: (1) the factor time had four levels, corresponding to the light (L) and dark (D) periods of both Day 1 and Day 3 and (2) the factor Experimental Condition had three levels (Saline, M28, and M37). For each level of the Experimental Condition factor, orthogonal contrasts were used to compare results relative to Day 1 (L + D) versus Day 3 (L + D) and, within each day, to compare L with D. The following preplanned nonorthogonal contrasts were tested: Saline versus M28; Saline versus M37; M28 versus M37. The statistical analysis of the cumulative amount of NREM sleep and REM sleep in the whole 3 d period was performed with a t test. For all comparisons, statistical significance was set at p < 0.05.
Results
Effects of RVMM inhibition on autonomic parameters and EEG total power
The effects induced by the inhibition of RVMM neurons on autonomic parameters and EEG total power are shown in Figure 3. In both the M28 and M37 groups, Tbrain dropped promptly after the first of the six muscimol injections and progressively diminished for the following 6 h, reaching a nadir of either 22.80 ± 0.77°C (M37 group) or 22.44 ± 0.74°C (M28 group). Both values were significantly different (M28: t*(705) = 25.75, p < 0.01; M37: t*(705) = 25.11, p < 0.01) from those observed within the same time window in the Saline group (37.06 ± 0.32°C). HR was also progressively reduced by muscimol injections in both the M37 group (from a baseline of 440 ± 13 bpm in the 30 min pre-injection to a nadir of 207 ± 12 bpm) and the M28 group (from a baseline of 438 ± 12 bpm to a nadir of 194 ± 12 bpm). Both values at nadir were significantly different (M28: t*(752) = 14.06, p < 0.01; M37: t*(752) = 13.12, p < 0.01) from those observed during the same time window in the Saline group (443 ± 12 bpm). Mean arterial pressure (MAP) did not appear to be substantially affected by the muscimol injections, since it diminished modestly only at the end of the 6 h injection period. This decrease reached statistical significance (t*(752) = 4.50; p < 0.01) compared with the saline group in the M28 group only. Total EEG power was significantly reduced by the injections of muscimol in both the M28 group (from 88 ± 6% in the 30 min pre-injection to a nadir of 25 ± 3%; t*(752) = 3.88, p < 0.01 vs saline in the same time window) and the M37 group (from a baseline of 83 ± 12% in the 30 min pre-injection to a nadir of 38 ± 9%; t*(752) = 4.05, p < 0.01 vs saline in the same time window).
Figure 3.
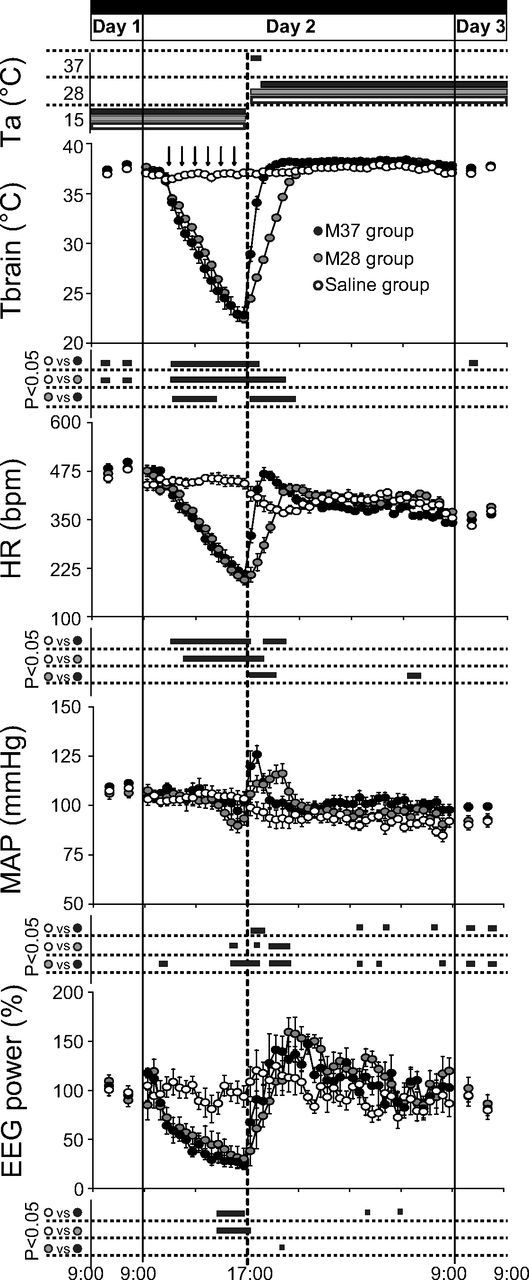
EEG and autonomic parameters. In animals exposed to constant darkness and a Ta of 15°C, repeated injections (black arrows at the top) of muscimol (gray-filled and black-filled circles) induced a large decrease in deep brain temperature (Tbrain), HR, and EEG total power, while MAP changed to a much lesser extent. No major effects were observed after repeated injections of saline (Saline group, empty circles; n = 6). After 1 h from the last injection, a rewarming period was started by increasing Ta from 15 to 28°C (M28 group, gray-filled circles; n = 7, n = 6 for Tbrain), or from 15 to 37°C for 1 h, returning to 28°C afterward (M37 group, black-filled circles; n = 6). This induced a rapid increase in Tbrain, HR, EEG, and MAP. Values during Day 1 and Day 3 are expressed as a 12 h average ± SEM, while those for Day 2 are expressed as a 30 min average ± SEM. Statistical significance (p < 0.05) is indicated for each group comparison by a black horizontal bar plotted below each section. The vertical solid lines indicate the end of each experimental day, while the vertical dotted line in the middle corresponds to the beginning of the rewarming period.
The increase in Ta from 15 to 28°C induced a progressive increase in Tbrain in the M28 group, which reached values similar to those observed in the Saline group after ∼3.5 h. Not surprisingly, normothermia was reached more rapidly (1.5 h) in the M37 group than in the M28 group. When compared with the Saline group, no significant differences in the time course of Tbrain in the M28 or M37 group were observed after the return of Tbrain within the normal physiological range. The increase in Ta from 15 to 28°C also induced, in the first 3 h, a decrease (from 443 ± 12 to 367 ± 7 bpm) in HR in the Saline group, which was followed by a slow increase in the second half of the night. During the same 3 h window, in the M28 group HR increased from 194 ± 12 to 431 ± 8 bpm, and converged to values that were not significantly different from those of the Saline group in the second part of the night. In the M37 group, the increase in HR was faster than in the M28 group, reaching a peak of 468 ± 16 bpm (t*(752) = 7.09, p < 0.01 vs the M28 group) in 1.5 h. This peak was followed by a slow decrease that reached values similar to those of the Saline group in the second part of the night.
The increase in Ta from 15 to 28°C induced a small decrease in MAP in the Saline group (from 103 ± 3 to 92 ± 4 mmHg after 3 h). In the M28 group, MAP significantly increased during the rewarming, reaching a peak of 116 ± 2 mmHg (t*(752) = 5.85, p > 0.01 vs saline) after 3.5 h and then decreased to stabilize at values similar to those of the Saline group. The MAP increase can be divided into two components: an early sharp increase and a late modest increase. The sharp increase was observed soon after the beginning of the rewarming and lasted for ∼1 h (until Tbrain reached ∼28°C), and was followed by a modest increase, which lasted until Tbrain reached normothermia. In the M37 group, only the early sharp increase in MAP was observed, with a magnitude that was even higher than that observed in the M28 group (125 ± 4 mmHg, t*(752) = 4.02, p < 0.01 vs M28 group), which was followed by a decrease that stabilized for the rest of the night at values that were often significantly higher than those of the Saline group. MAP values were still significantly higher when compared with those of the Saline group (t*(48) = 4.96, p < 0.01 from 9:00 to 21:00; t*(48) = 4.34, p < 0.01 from 21:00 to 9:00) and the M28 group (t*(48) = 4.34, p < 0.01 from 9:00 to 21:00; t*(48) = 4.11, p < 0.01 from 21:00 to 9:00) during Day 3. Finally, the increase in Ta from 15 to 28°C induced an increase in Total EEG power in both the M28 and in the M37 group, and such an increase was maintained at the levels of the Saline group during the rest of the night.
Effects of RVMM inhibition on the heat loss index
The effects induced by the inhibition of the RVMM neurons on the HLI are shown in Figure 4. After the first injection of muscimol, Ttail quickly increased from a pre-injection value of 22.8 ± 1.2°C to a peak of 29.2 ± 1.3°C (t*(120) = 8.61, p < 0.01 vs Saline group), consequently inducing an increase in HLI from a pre-injection value of 0.38 ± 0.07 to 0.73 ± 0.09 (t*(120) = 8.63, p < 0.01 vs Saline group). After having reached the peak value, Ttail progressively diminished for the 6 h injection period, paralleling the decline in Tbrain, while HLI remained constantly high for the entire period of muscimol delivery.
Figure 4.
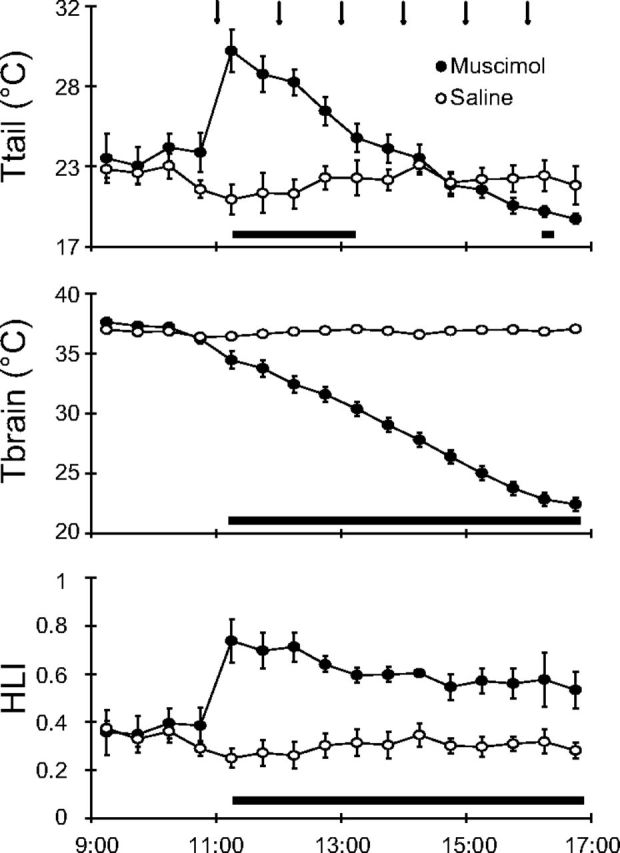
HLI. In animals exposed to a Ta of 15°C, repeated injections (black arrows at the top) of muscimol (filled circles) in the RVMM induced an increase in tail temperature (Ttail), a decrease in deep brain temperature (Tbrain), and an increase in the HLI, while no effects were evoked by repeated saline injections (empty circles). HLI was calculated by the equation: (Tbrain − Ta)/(Ttail − Ta), using data from the M28 group (n = 7). Values are expressed as a 30 min average ± SEM. Statistical significance (p < 0.05) is indicated by a black horizontal bar plotted below graphs.
Effects of RVMM inhibition on behavioral and sleep parameters
Shortly after the first muscimol injection, animals showed a behavioral pattern that aimed to increase thermal dissipation, i.e., saliva spreading and open posture. This behavior may have been caused by the sudden rush of blood to the skin that would have activated cutaneous warm receptors. With the progressive lowering of Tbrain, no postural changes aimed at reducing heat loss were observed. At the Tbrain nadir, the animal appeared to be lethargic, presenting very little or no spontaneous movement. During the Recovery Day (Day 3), no major signs of abnormality were detected in any treated animal. All physiological parameters were back within the physiological range, and the wake–sleep cycle was substantially normal and normally distributed (ultradian and circadian oscillations were conserved).
The effects on sleep parameters induced by the inhibition of RVMM neurons are shown in Figures 6 and 7. During the whole muscimol delivery period, the sleep states were unclassifiable according to the standard criteria, while clearly classifiable sleep reappeared in the rewarming phase soon after Tbrain approximated 35°C. As shown in Figure 5, after the reappearance of classifiable sleep states, Delta power in NREM sleep quickly increased to a peak of 215 ± 21% for the M28 group (t*(480) = 9.11, p < 0.01 vs Saline group) and 196 ± 17% for the M37 group (t*(480) = 4.39, p < 0.01 vs Saline group; t*(480) = 4.71, p < 0.01 vs M28 group), and in both muscimol groups it remained, for several hours, at a level that was significantly higher than that observed in the Saline group. During the same time window, Sigma power in NREM sleep and Theta power in wakefulness were similar among the three experimental groups. A transitory significant increase in Theta power in REM sleep was observed in the M28 group compared with the other groups after 3 h from the start of the rewarming.
Figure 6.

Sleep homeostasis in suspended animation. Animals exposed to constant darkness and to an ambient temperature (Ta) of 15°C underwent a suspended animation state through repeated muscimol injections (black arrows at the top) followed by a rewarming period that was started by increasing Ta from 15 to 28°C (M28 group, gray-filled circles; n = 7), or from 15 to 37°C for 1 h, returning to 28°C afterward (M37 group, black-filled circles; n = 6). Top, The amount of REM sleeps, accumulated in the three experimental days by both M28 and M37 groups, remained significantly lower compared with that of the animals repeatedly injected with saline (Saline group, empty circles; n = 6). In contrast, the accumulated amount of NREM sleep was significantly lower than that of the Saline group only for the M28 group. In Day 3 the M37 group accumulated less REM sleep and more NREM sleep than the M28 group. Bottom, Differences between the cumulative amount of REM sleep or NREM sleep in the M28 and the saline group, and the M37 and the saline group. These show that on Day 3 the M28 group produces the same amount of REM and NREM sleep as the saline group, while the M37 group produces less REM sleep and more NREM sleep than the saline group. Values are expressed as a 60 min average ± SEM. Sleep amounts are normalized on the respective average amount of Day 1. The vertical solid lines indicate the end of each experimental day, while the vertical dotted line corresponds to the beginning of the rewarming period. (*p < 0.05).
Figure 7.
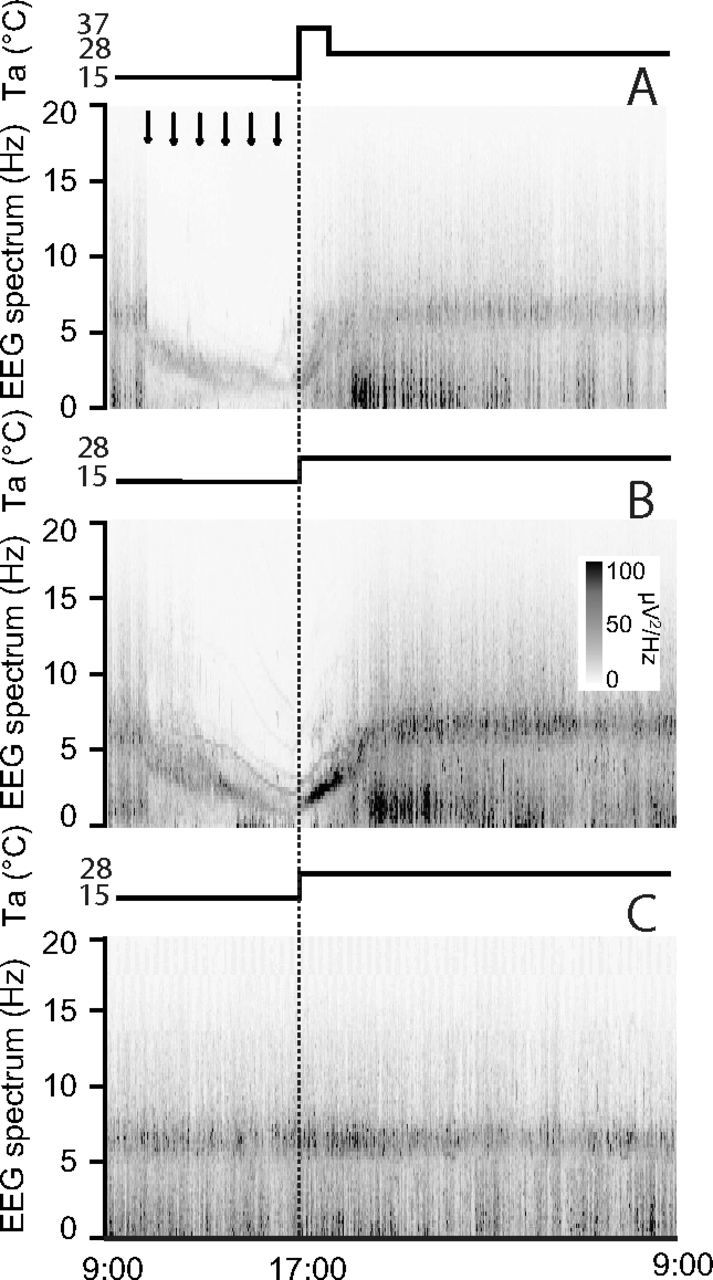
EEG power spectra. In animals exposed to constant darkness and an ambient temperature (Ta) of 15°C repeated injections (black arrows at the top) of muscimol (A, B) induced an evident shift of the EEG power spectrum toward slow frequencies, while repeated injections of saline (C; n = 6) did not modify the EEG spectrum. The increase of Ta from 15 to 28°C (M28 group, B; n = 7) or from 15 to 37°C for 1 h, returning to 28°C afterward (M37 group, A; n = 6) induced a rapid shift of the EEG spectrum toward fast frequencies, followed by a large increase in the power of the Delta band. Also, the M28 group (B) showed during the rewarming period a sharp increase in the power of the part of the spectrum giving origin to the Theta band at the end of the rewarming period. No major effects were induced by rewarming in the Saline group. EEG power spectrum was normalized to the average total EEG power of Day 1. Values are given per seconds with a resolution of 0.25 Hz. The vertical dotted lines indicate the beginning of the rewarming period.
Figure 5.
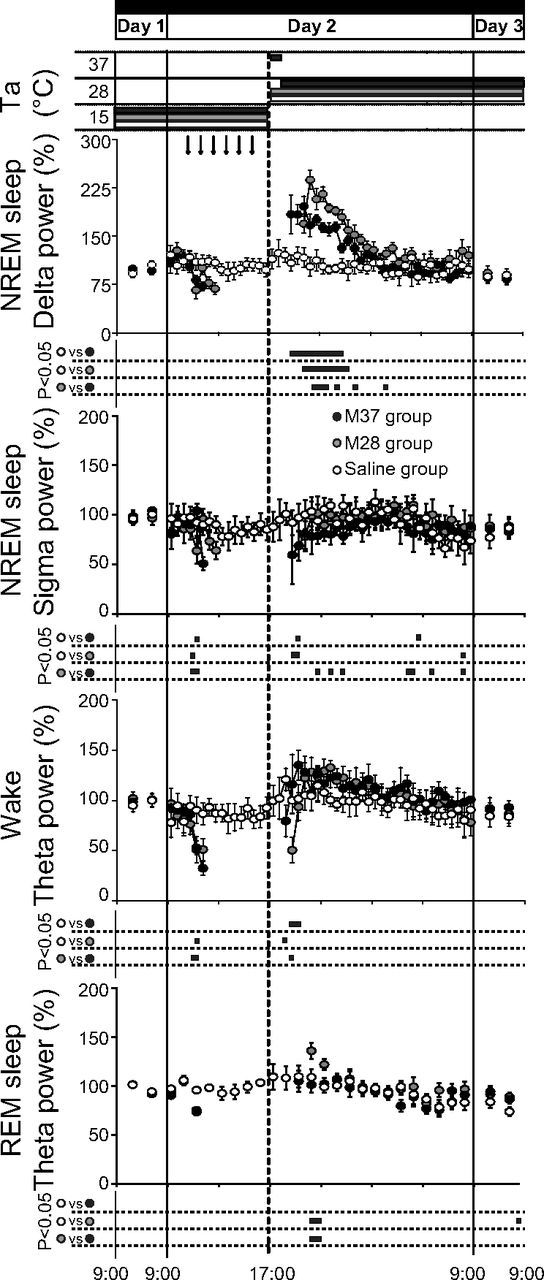
Sleep parameters. Animals exposed to constant darkness at an ambient temperature (Ta) of 15°C underwent a suspended animation state through repeated injections (black arrows at the top) of muscimol in the RVMM. After 1 h from the last injection, a rewarming period was started by increasing Ta from 15 to 28°C (M28 group, gray-filled circles; n = 7), or from 15 to 37°C for 1 h, returning to 28°C afterward (M37 group, black-filled circles; n = 6). The rewarming induced a large increase in NREM sleep Delta power, but small changes in NREM sleep Sigma power, wakefulness Theta power, and REM sleep Theta power. No major effects were caused by repeated injections of saline (Saline group, empty circles; n = 6). Relative values during Day 1 and Day 3 are expressed as a 12 h average ± SEM, while those for Day 2 are expressed as a 30 min average ± SEM for all variables, except for those of EEG Theta power during REM sleep, which are expressed as a 1 h average ± SEM. Statistical significance (p < 0.05) is indicated for each group comparison by a black horizontal bar plotted below each part. The vertical solid lines at extremes indicate the end of each experimental day, while the vertical dotted line in the middle corresponds to the beginning of the rewarming period.
As shown in Figure 6, the amount of REM sleep lost during the hypothermic bout was not recovered either in the M28 group or in the M37 group. In fact, at the end of Day 3, in both muscimol-injected groups the relative cumulative amount of REM sleep was lower than that observed in the Saline group (M28: t(11) = 2.28, p < 0.05; M37: t(10) = 3.38, p < 0.01). During the hypothermic bout, NREM sleep was also lost. The M28 group did not compensate for the NREM sleep loss, showing a significantly lower cumulative amount of NREM sleep at the end of Day 3, compared with both the Saline (t(11) = 3.56, p < 0.01) and the M37 group (t(10) = 2.91, p < 0.05). On the contrary, the loss of NREM sleep at the end of Day 3 was not statistically significant when compared with the Saline group in the M37 group. During Day 3, the two differently rewarmed groups presented some subtle differences in their sleep patterns. In particular, as shown in Figure 6, the M37 group seemed to express more NREM sleep and showed a tendency to lose more REM sleep compared with the Saline group, while this was not observed in the M28 group.
Effects of RVMM inhibition on the EEG spectrum
The effects on EEG spectrum induced by the inhibition of the RVMM neurons are shown in Figures 7 and 8. The EEG spectrum was strongly affected during the muscimol injections. As shown in Figure 7, the entire spectrum appeared to shift toward lower frequencies, with no activity in the high portion of the spectrum, similarly to what is described for naturally occurring torpor (Deboer, 1998, Strijkstra and Daan, 1998). Almost no EEG activity was observed at the nadir of Tbrain. In particular the Theta band appeared to slow down, drifting into the Delta band boundaries. In the M28 group, the rewarming produced a marked power increase and a progressive acceleration of the “slowed” Theta band that rapidly returned to physiological levels. Delta power also appeared strongly increased after the normal occurrence of the wake–sleep states was recovered. In the M37 group, the slowed Theta band very rapidly returned within a physiological frequency range, but with no clear increase in power. Delta power was clearly potentiated, once sleep reappeared, after the normal occurrence of the wake–sleep states was recovered. The average changes in the EEG power spectrum and the apparent shift of the Theta peak during the cooling and rewarming of the animals are shown for the three experimental groups in Figure 8.
Figure 8.

Shift of the EEG power spectrum. In animals exposed to an ambient temperature (Ta) of 15°C, the EEG spectrum showed, during the cooling induced by muscimol injections (data from the M28 group (n = 7), A–D), a progressive reduction of the main spectral components and a progressive shift toward slow frequencies. The rewarming at Ta 28°C (M28 group (n = 7), E–H) induced an immediate large increase in the power of the main spectral component and a progressive shift of the spectrum toward fast frequencies. The rewarming at Ta 37°C for 1 h returning to 28°C afterward (M37 group (n = 6), I–L) induced a progressive shift of the spectrum toward fast frequencies. EEG power spectrum is expressed as the 1 h average spectrum (0.25 Hz resolution) calculated at the time shown by the vertical line in inserts. Inserts show the average time course of deep brain temperature (Tbrain, filled circles) and Ta (continuous line) for a 12 h period (9:00–21:00) during the Injection Day. Vertical dotted lines highlight the temperature-dependent shift in the peak of the EEG Theta band during cooling at Ta 15°C and rewarming at Ta 28°C and Ta 37°C.
Discussion
To the best of our knowledge, these results constitute the first demonstration that a spontaneous activity (SA) state can be induced in a nonhibernator through the inhibition of a specific brain area belonging to the efferent arm of the central nervous pathways for thermoregulatory cold defense. Previous attempts to induce an SA state (Scanlan et al., 2004; Blackstone et al., 2005; Gluck et al., 2006; Zhang et al., 2006) were based on the hypothesis that hibernation/torpor is caused by endogenous substances, which are able to interfere systemically with cellular metabolism (Andrews, 2007). These attempts were successful in mice, a species that can enter torpor spontaneously under proper conditions (food deprivation and cold exposure) (Morhardt and Hudson, 1966), but limitedly effective in nonhibernators (Haouzi et al., 2008, Zhang et al., 2009). Thus, these treatments may be effective due to their capacity to mimic the conditions that trigger spontaneous torpor as a behavioral response to a reduction in energy substrates. Our results strengthen the potential role of the CNS in the induction of hibernation/torpor, since CNS-driven changes in organ physiology have been shown to be sufficient in inducing and maintaining a SA state.
The deep hypothermia we observed was the result of an increase in thermal dissipation, as shown by the changes observed in the HLI, and a likely decrease in heat production (Morrison and Nakamura, 2011). Thermal dissipation, although declining slightly for the reduction of the thermal gradient induced by the progressive body cooling, was maintained at a high level throughout the whole injection period, showing that RVMM inhibition could not be overrun by any ensuing thermoceptive input. Cumulative evidence suggests that VGLUT3 glutamatergic neurons (Nakamura et al., 2004) and serotoninergic neurons in the RVMM are key to a functional thermogenesis (Madden and Morrison, 2006, 2008, 2010; Ray et al., 2011). Therefore, the decrease in heat production shown in our experiment could be mediated by the inhibition of these neurons. Noticeably, the induced suspended animation state showed several similarities with the characteristics observed in nature during (hypothermic phase) or after the hypothermic bouts (rewarming phase).
Hypothermic phase
Changes in HR similar to our findings were observed in natural torpor (Elvert and Heldmaier, 2005; Swoap and Gutilla, 2009). In our case these are likely to have resulted from the withdrawal of an excitatory tone of RVMM neurons (Cao and Morrison, 2003) that could not be compensated by the intervention of either the hypothalamic paraventricular nucleus (Kc and Dick, 2010) or the rostral ventrolateral medulla (Morrison, 1999). However, since HR reaches very low levels, it may be hypothesized that the hypothermia could by itself substantially contribute to this effect (Sabharwal et al., 2004). Interestingly, cardiac arrhythmias, which represent a common complication of deep hypothermia (Johansson, 1996), were not observed in the present experiment. In view of the hypothesis that these arrhythmias are caused by a concomitant activation of the sympathetic and the parasympathetic cardiac outflow (Shattock and Tipton, 2012), this was probably due to a protective role exerted by the inhibition of sympathetic outflow.
Values of MAP remained stable for most of the injection period and diminished limitedly only in its last part. Similar changes have been observed during torpor in mice (Swoap and Gutilla, 2009). This confirms that RVMM neurons play a small role in MAP regulation (Morrison, 1999).
Our data confirm that with the progressive fall in Tbrain, the EEG total power decreases (Walker et al., 1977, Krilowicz et al., 1988, Deboer and Tobler, 1994) and the EEG spectrum shifts toward slower frequencies (Deboer, 1998). These EEG changes appear to be the consequence of the fall in brain temperature (Deboer and Tobler, 1995), but the potential for the changes in EEG accompanying hypothermia to be mediated by medullary neurons with ascending projections or by RVMM-mediated changes in cerebral blood flow (Cetas et al., 2009) cannot be ruled out. In any case, the limited diffusion, if any, of muscimol to nearby areas can be inferred by the fact that no effects due to the inhibition of the rostral ventrolateral medulla, a key area in AP regulation close to RVMM, were observed.
Rewarming phase
During the active rewarming phase animals were exposed to a condition in which a cold core was confronted with a warm environment. This is similar to the active warming used in the treatment of accidental hypothermia, which may lead to a sudden drop in MAP due to the large dilatation of cutaneous vessels (Kempainen and Brunette, 2004). However, in our experiment, both HR and MAP increased to a significantly high peak, closely mirroring the increase in Tbrain. This suggests that the increase in HR may depend not only on the reactivation of RVMM neurons, but also on the contribution of core temperature.
The powerful increase in Theta power observed during rewarming of the M28 group may be related to the degree of the thermogenetic effort (intense in the M28 group and very low or absent in the M37 group). These data suggest that the hippocampal activity may be significantly modulated by a powerful sympathetic activation and that this may be a useful model for the study of cortical plasticity.
Similarly to what has been observed in hibernators (Deboer and Tobler, 1996; Heller and Ruby, 2004), soon after the hypothermic bout animals fell asleep. The NREM sleep was characterized by a large increase in Delta power, a result observed in hibernators (Trachsel et al., 1991; Berger, 1993; Kilduff et al., 1993) and shown to be inversely related to the temperature drop (von der Ohe et al., 2007). The finding that Delta power increased less in the M37 group compared with the M28 groups is in line with the hypothesis that the thermogenic effort to regain normothermia could be a determinant, through a differential activation of the sympathetic outflow, of the magnitude of the Delta rebound. Whether such an increase in Delta power indicates that the hypothermic bout may or may not determine a period of sleep deprivation is still controversial (Strijkstra and Daan, 1998; Larkin and Heller, 1999; Palchykova et al., 2002). In consideration of the reported changes in synaptic plasticity in natural SA (von der Ohe et al., 2006, 2007), the Delta rebound observed in our condition can be plausibility interpreted within the theoretical framework of the “synaptic homeostasis” hypothesis (Tononi and Cirelli, 2003).
The presence of a Delta rebound is in contrast with the observation that the amount of REM sleep lost was apparently not recovered after the return to normothermia. This is in line with the finding that, following a hypothermic bout, hibernators show a REM sleep occurrence that is negatively correlated with the duration of hypothermia and no REM sleep rebound (Strijkstra and Daan, 1997). REM sleep occurrence is known to be homeostatically regulated in different species on both a long-term (Parmeggiani et al., 1980; Franken et al., 1991; Cerri et al., 2005; Amici et al., 2008) and a short-term (Vivaldi et al., 1994) basis (Parmeggiani et al., 1980; Franken et al., 1991; Vivaldi et al., 1994; Cerri et al., 2005; Amici et al., 2008). However, the total amount of REM sleep lost at the end of the Recovery Day was large and significant in both groups. The absence of a complete REM sleep recovery can be interpreted in two ways: (1) the process that monitors REM sleep debt was impaired during the hypothermic bout, implying that an unknown neuronal function monitoring the amount of REM sleep was impaired by the low brain temperature and (2) the need for REM sleep during the hypothermic bout was partially or totally curtailed, supporting the hypothesis of a reciprocal link between REM sleep and energy expenditure (Amici et al., 2008).
Our data show that the CNS can drive, in different organs, the physiological changes that are sufficient in inducing and maintaining suspended animation state. In other words, CNS activity may start the process of lowering core temperature, the low temperature itself being able to maintain the concomitant reduction in metabolic rate. The large phenomenological similarities between the suspended animation induced in a nonhibernator and that naturally occurring in hibernators, suggest that in the latter the RVMM could be spontaneously inhibited by specific pathways belonging to a torpor-inducing network. This possibility supports the hypothesis that the capacity for suspended animation constitutes a common trait for all mammals (including humans; Magnifico et al., 2002), which emerged in the phenotypes of some species according to different characteristics of evolutionary pressure (Geiser, 1998; Harris et al., 2004).
In conclusion, the present study indicates that the apparent barrier of suspended animation induction (Haouzi et al., 2008, Zhang et al., 2009) between hibernators and nonhibernators through a systemic interference with cellular metabolism (Scanlan et al., 2004; Blackstone et al., 2005; Gluck et al., 2006; Zhang et al., 2006) may be overcome and a new perspective may arise for the clinical application of hypothermia through CNS manipulation.
Footnotes
This work is supported by the Ministero dell'Università e della Ricerca Scientifica (MIUR), Italy, (PRIN 2008, Project 2008FY7K9S).
The authors declare no competing financial interests.
References
- Amici R, Cerri M, Ocampo-Garcés A, Baracchi F, Dentico D, Jones CA, Luppi M, Perez E, Parmeggiani PL, Zamboni G. Cold exposure and sleep in the rat: REM sleep homeostasis and body size. Sleep. 2008;31:708–715. doi: 10.1093/sleep/31.5.708. [DOI] [PMC free article] [PubMed] [Google Scholar]
- Andrews MT. Advances in molecular biology of hibernation in mammals. Bioessays. 2007;29:431–440. doi: 10.1002/bies.20560. [DOI] [PubMed] [Google Scholar]
- Berger RJ. Cooling down to hibernate: sleep and hibernation constitute a physiological continuum of energy conservation. Neurosci Lett. 1993;154:213–216. doi: 10.1016/0304-3940(93)90210-c. [DOI] [PubMed] [Google Scholar]
- Blackstone E, Morrison M, Roth MB. H2S induces a suspended animation-like state in mice. Science. 2005;308:518. doi: 10.1126/science.1108581. [DOI] [PubMed] [Google Scholar]
- Blessing WW, Nalivaiko E. Raphe magnus/pallidus neurons regulate tail but not mesenteric arterial blood flow in rats. Neuroscience. 2001;105:923–929. doi: 10.1016/s0306-4522(01)00251-2. [DOI] [PubMed] [Google Scholar]
- Cano G, Passerin AM, Schiltz JC, Card JP, Morrison SF, Sved AF. Anatomical substrates for the central control of sympathetic outflow to interscapular adipose tissue during cold exposure. J Comp Neurol. 2003;460:303–326. doi: 10.1002/cne.10643. [DOI] [PubMed] [Google Scholar]
- Cao WH, Morrison SF. Disinhibition of rostral raphe pallidus neurons increases cardiac sympathetic nerve activity and heart rate. Brain Res. 2003;980:1–10. doi: 10.1016/s0006-8993(03)02981-0. [DOI] [PubMed] [Google Scholar]
- Carey HV, Andrews MT, Martin SL. Mammalian hibernation: cellular and molecular responses to depressed metabolism and low temperature. Physiol Rev. 2003;83:1153–1181. doi: 10.1152/physrev.00008.2003. [DOI] [PubMed] [Google Scholar]
- Cerri M, Ocampo-Garces A, Amici R, Baracchi F, Capitani P, Jones CA, Luppi M, Perez E, Parmeggiani PL, Zamboni G. Cold exposure and sleep in the rat: effects on sleep architecture and the electroencephalogram. Sleep. 2005;28:694–705. doi: 10.1093/sleep/28.6.694. [DOI] [PubMed] [Google Scholar]
- Cerri M, Zamboni G, Tupone D, Dentico D, Luppi M, Martelli D, Perez E, Amici R. Cutaneous vasodilation elicited by disinhibition of the caudal portion of the rostral ventromedial medulla of the free-behaving rat. Neuroscience. 2010;165:984–995. doi: 10.1016/j.neuroscience.2009.10.068. [DOI] [PubMed] [Google Scholar]
- Cetas JS, Lee DR, Alkayed NJ, Wang R, Iliff JJ, Heinricher MM. Brainstem control of cerebral blood flow and application to acute vasospasm following experimental subarachnoid hemorrhage. Neuroscience. 2009;163:719–729. doi: 10.1016/j.neuroscience.2009.06.031. [DOI] [PMC free article] [PubMed] [Google Scholar]
- Deboer T. Brain temperature dependent changes in the electroencephalogram power spectrum of humans and animals. J Sleep Res. 1998;7:254–262. doi: 10.1046/j.1365-2869.1998.00125.x. [DOI] [PubMed] [Google Scholar]
- Deboer T, Tobler I. Sleep EEG after daily torpor in the Djungarian hamster: similarity to the effect of sleep deprivation. Neurosci Lett. 1994;166:35–38. doi: 10.1016/0304-3940(94)90834-6. [DOI] [PubMed] [Google Scholar]
- Deboer T, Tobler I. Temperature dependence of EEG frequencies during natural hypothermia. Brain Res. 1995;670:153–156. doi: 10.1016/0006-8993(94)01299-w. [DOI] [PubMed] [Google Scholar]
- Deboer T, Tobler I. Natural hypothermia and sleep deprivation: common effects on recovery sleep in the Djungarian hamster. Am J Physiol. 1996;271:R1364–R1371. doi: 10.1152/ajpregu.1996.271.5.R1364. [DOI] [PubMed] [Google Scholar]
- Drew KL, Buck CL, Barnes BM, Christian SL, Rasley BT, Harris MB. Central nervous system regulation of mammalian hibernation: implications for metabolic suppression and ischemia tolerance. J Neurochem. 2007;102:1713–1726. doi: 10.1111/j.1471-4159.2007.04675.x. [DOI] [PMC free article] [PubMed] [Google Scholar]
- Elvert R, Heldmaier G. Cardiorespiratory and metabolic reactions during entrance into torpor in dormice, Glis glis. J Exp Biol. 2005;208:1373–1383. doi: 10.1242/jeb.01546. [DOI] [PubMed] [Google Scholar]
- Franken P, Dijk DJ, Tobler I, Borbély AA. Sleep deprivation in rats: effects on EEG power spectra, vigilance states, and cortical temperature. Am J Physiol. 1991;261:R198–R208. doi: 10.1152/ajpregu.1991.261.1.R198. [DOI] [PubMed] [Google Scholar]
- Geiser F. Evolution of daily torpor and hibernation in birds and mammals: importance of body size. Clin Exp Pharmacol Physiol. 1998;25:736–739. doi: 10.1111/j.1440-1681.1998.tb02287.x. [DOI] [PubMed] [Google Scholar]
- Gluck EF, Stephens N, Swoap SJ. Peripheral ghrelin deepens torpor bouts in mice through the arcuate nucleus neuropeptide Y signaling pathway. Am J Physiol Regul Integr Comp Physiol. 2006;291:R1303–R1309. doi: 10.1152/ajpregu.00232.2006. [DOI] [PubMed] [Google Scholar]
- Haouzi P, Notet V, Chenuel B, Chalon B, Sponne I, Ogier V, Bihain B. H2S induced hypometabolism in mice is missing in sedated sheep. Respir Physiol Neurobiol. 2008;160:109–115. doi: 10.1016/j.resp.2007.09.001. [DOI] [PubMed] [Google Scholar]
- Harris MB, Olson LE, Milsom WK. The origin of mammalian heterothermy: a case for perpetual youth? In: Barnes BM, Carey HV, editors. Life in the cold: evolution, mechanisms, adaptation, and application. Fairbanks: Biological Papers of the University of Alaska (Institute of Arctic Biology); 2004. pp. 143–152. [Google Scholar]
- Heldmaier G, Ortmann S, Elvert R. Natural hypometabolism during hibernation and daily torpor in mammals. Respir Physiol Neurobiol. 2004;141:317–329. doi: 10.1016/j.resp.2004.03.014. [DOI] [PubMed] [Google Scholar]
- Heller HC, Ruby NF. Sleep and circadian rhythms in mammalian torpor. Annu Rev Physiol. 2004;66:275–289. doi: 10.1146/annurev.physiol.66.032102.115313. [DOI] [PubMed] [Google Scholar]
- Holm S. A simple sequentially rejective multiple test procedure. Scand J Stat. 1979;6:65–70. [Google Scholar]
- Johansson BW. The hibernator heart–nature's model of resistance to ventricular fibrillation. Cardiovasc Res. 1996;31:826–832. doi: 10.1016/0008-6363(95)00192-1. [DOI] [PubMed] [Google Scholar]
- Kc P, Dick TE. Modulation of cardiorespiratory function mediated by the paraventricular nucleus. Respir Physiol Neurobiol. 2010;174:55–64. doi: 10.1016/j.resp.2010.08.001. [DOI] [PMC free article] [PubMed] [Google Scholar]
- Kempainen RR, Brunette DD. The evaluation and management of accidental hypothermia. Respir Care. 2004;49:192–205. [PubMed] [Google Scholar]
- Kilduff TS, Krilowicz B, Milsom WK, Trachsel L, Wang LC. Sleep and mammalian hibernation: homologous adaptations and homologous processes? Sleep. 1993;16:372–386. doi: 10.1093/sleep/16.4.372. [DOI] [PubMed] [Google Scholar]
- Krilowicz BL, Glotzbach SF, Heller HC. Neuronal activity during sleep and complete bouts of hibernation. Am J Physiol. 1988;255:R1008–R1019. doi: 10.1152/ajpregu.1988.255.6.R1008. [DOI] [PubMed] [Google Scholar]
- Larkin JE, Heller HC. Sleep after arousal from hibernation is not homeostatically regulated. Am J Physiol. 1999;276:R522–R529. doi: 10.1152/ajpregu.1999.276.2.R522. [DOI] [PubMed] [Google Scholar]
- Lee CC. Is human hibernation possible? Annu Rev Med. 2008;59:177–186. doi: 10.1146/annurev.med.59.061506.110403. [DOI] [PubMed] [Google Scholar]
- Madden CJ, Morrison SF. Serotonin potentiates sympathetic responses evoked by spinal NMDA. J Physiol. 2006;577:525–537. doi: 10.1113/jphysiol.2006.116574. [DOI] [PMC free article] [PubMed] [Google Scholar]
- Madden CJ, Morrison SF. Brown adipose tissue sympathetic nerve activity is potentiated by activation of 5-hydroxytryptamine (5-HT)1A/5-HT7 receptors in the rat spinal cord. Neuropharmacology. 2008;54:487–496. doi: 10.1016/j.neuropharm.2007.10.019. [DOI] [PMC free article] [PubMed] [Google Scholar]
- Madden CJ, Morrison SF. Endogenous activation of spinal 5-hydroxytryptamine (5-HT) receptors contributes to the thermoregulatory activation of brown adipose tissue. Am J Physiol Regul Integr Comp Physiol. 2010;298:R776–R783. doi: 10.1152/ajpregu.00614.2009. [DOI] [PMC free article] [PubMed] [Google Scholar]
- Magnifico F, Pierangeli G, Barletta G, Candela C, Montagna P, Bonavina G, Cortelli P. Paroxysmal episodic central thermoregulatory failure. Neurology. 2002;58:1300–1302. doi: 10.1212/wnl.58.8.1300. [DOI] [PubMed] [Google Scholar]
- Melvin RG, Andrews MT. Torpor induction in mammals: recent discoveries fueling new ideas. Trends Endocrinol Metab. 2009;20:490–498. doi: 10.1016/j.tem.2009.09.005. [DOI] [PMC free article] [PubMed] [Google Scholar]
- Morhardt JE, Hudson JW. Daily torpor induced in white-footed mice (Peromyscus spp.) by starvation. Nature. 1966;212:1046–1047. doi: 10.1038/2121046b0. [DOI] [PubMed] [Google Scholar]
- Morrison SF. RVLM and raphe differentially regulate sympathetic outflows to splanchnic and brown adipose tissue. Am J Physiol. 1999;276:R962–R973. doi: 10.1152/ajpregu.1999.276.4.R962. [DOI] [PubMed] [Google Scholar]
- Morrison SF, Nakamura K. Central neural pathways for thermoregulation. Front Biosci. 2011;16:74–104. doi: 10.2741/3677. [DOI] [PMC free article] [PubMed] [Google Scholar]
- Morrison SF, Sved AF, Passerin AM. GABA-mediated inhibition of raphe pallidus neurons regulates sympathetic outflow to brown adipose tissue. Am J Physiol. 1999;276:R290–R297. doi: 10.1152/ajpregu.1999.276.2.R290. [DOI] [PubMed] [Google Scholar]
- Nakamura K, Morrison SF. Central efferent pathways for cold-defensive and febrile shivering. J Physiol. 2011;589:3641–3658. doi: 10.1113/jphysiol.2011.210047. [DOI] [PMC free article] [PubMed] [Google Scholar]
- Nakamura K, Matsumura K, Hübschle T, Nakamura Y, Hioki H, Fujiyama F, Boldogköi Z, Konig M, Thiel HJ, Gerstberger R, Kobayashi S, Kaneko T. Identification of sympathetic premotor neurons in medullary raphe regions mediating fever and other thermoregulatory functions. J Neurosci. 2004;24:5370–5380. doi: 10.1523/JNEUROSCI.1219-04.2004. [DOI] [PMC free article] [PubMed] [Google Scholar]
- Palchykova S, Deboer T, Tobler I. Selective sleep deprivation after daily torpor in the Djungarian hamster. J Sleep Res. 2002;11:313–319. doi: 10.1046/j.1365-2869.2002.00310.x. [DOI] [PubMed] [Google Scholar]
- Parmeggiani PL, Cianci T, Calasso M, Zamboni G, Perez E. Quantitative analysis of short term deprivation and recovery of desynchronized sleep in cats. Electroencephalogr Clin Neurophysiol. 1980;50:293–302. doi: 10.1016/0013-4694(80)90157-1. [DOI] [PubMed] [Google Scholar]
- Paxinos G, Watson C. The rat brain in stereotaxic coordinates. 6th ed. San Diego: Elsevier; 2007. [DOI] [PubMed] [Google Scholar]
- Ray RS, Corcoran AE, Brust RD, Kim JC, Richerson GB, Nattie E, Dymecki SM. Impaired respiratory and body temperature control upon acute serotonergic neuron inhibition. Science. 2011;333:637–642. doi: 10.1126/science.1205295. [DOI] [PMC free article] [PubMed] [Google Scholar]
- Romanovsky AA, Ivanov AI, Shimansky YP. Selected contribution: ambient temperature for experiments in rats: a new method for determining the zone of thermal neutrality. J Appl Physiol. 2002;92:2667–2679. doi: 10.1152/japplphysiol.01173.2001. [DOI] [PubMed] [Google Scholar]
- Sabharwal R, Coote JH, Johns EJ, Egginton S. Effect of hypothermia on baroreflex control of heart rate and renal sympathetic nerve activity in anaesthetized rats. J Physiol. 2004;557:247–259. doi: 10.1113/jphysiol.2003.059444. [DOI] [PMC free article] [PubMed] [Google Scholar]
- Scanlan TS, Suchland KL, Hart ME, Chiellini G, Huang Y, Kruzich PJ, Frascarelli S, Crossley DA, Bunzow JR, Ronca-Testoni S, Lin ET, Hatton D, Zucchi R, Grandy DK. 3-Iodothyronamine is an endogenous and rapid-acting derivative of thyroid hormone. Nat Med. 2004;10:638–642. doi: 10.1038/nm1051. [DOI] [PubMed] [Google Scholar]
- Shattock MJ, Tipton MJ. ‘Autonomic Conflict’: a different way to die during cold water immersion? J Physiol. 2012;590:3219–3230. doi: 10.1113/jphysiol.2012.229864. [DOI] [PMC free article] [PubMed] [Google Scholar]
- Strijkstra AM, Daan S. Sleep during arousal episodes as a function of prior torpor duration in hibernating European ground squirrels. J Sleep Res. 1997;6:36–43. doi: 10.1046/j.1365-2869.1997.00024.x. [DOI] [PubMed] [Google Scholar]
- Strijkstra AM, Daan S. Dissimilarity of slow-wave activity enhancement by torpor and sleep deprivation in a hibernator. Am J Physiol. 1998;275:R1110–R1117. doi: 10.1152/ajpregu.1998.275.4.R1110. [DOI] [PubMed] [Google Scholar]
- Swoap SJ, Gutilla MJ. Cardiovascular changes during daily torpor in the laboratory mouse. Am J Physiol Regul Integr Comp Physiol. 2009;297:R769–R774. doi: 10.1152/ajpregu.00131.2009. [DOI] [PMC free article] [PubMed] [Google Scholar]
- Tononi G, Cirelli C. Sleep and synaptic homeostasis: a hypothesis. Brain Res Bull. 2003;62:143–150. doi: 10.1016/j.brainresbull.2003.09.004. [DOI] [PubMed] [Google Scholar]
- Trachsel L, Edgar DM, Heller HC. Are ground squirrels sleep deprived during hibernation? Am J Physiol. 1991;260:R1123–R1129. doi: 10.1152/ajpregu.1991.260.6.R1123. [DOI] [PubMed] [Google Scholar]
- Vivaldi EA, Ocampo A, Wyneken U, Roncagliolo M, Zapata AM. Short-term homeostasis of active sleep and the architecture of sleep in the rat. J Neurophysiol. 1994;72:1745–1755. doi: 10.1152/jn.1994.72.4.1745. [DOI] [PubMed] [Google Scholar]
- von der Ohe CG, Darian-Smith C, Garner CC, Heller HC. Ubiquitous and temperature-dependent neural plasticity in hibernators. J Neurosci. 2006;26:10590–10598. doi: 10.1523/JNEUROSCI.2874-06.2006. [DOI] [PMC free article] [PubMed] [Google Scholar]
- von der Ohe CG, Garner CC, Darian-Smith C, Heller HC. Synaptic protein dynamics in hibernation. J Neurosci. 2007;27:84–92. doi: 10.1523/JNEUROSCI.4385-06.2007. [DOI] [PMC free article] [PubMed] [Google Scholar]
- Walker JM, Glotzbach SF, Berger RJ, Heller HC. Sleep and hibernation in ground squirrels (Citellus spp): electrophysiological observations. Am J Physiol. 1977;233:R213–R221. doi: 10.1152/ajpregu.1977.233.5.R213. [DOI] [PubMed] [Google Scholar]
- Wallenstein S, Zucker CL, Fleiss JL. Some statistical methods useful in circulation research. Circ Res. 1980;47:1–9. doi: 10.1161/01.res.47.1.1. [DOI] [PubMed] [Google Scholar]
- Winer BJ, Brown DR, Michels KM. Statistical principles in experimental design. Ed 3. Boston: McGraw-Hill; 1991. [Google Scholar]
- Zaretsky DV, Zaretskaia MV, DiMicco JA. Stimulation and blockade of GABA(A) receptors in the raphe pallidus: effects on body temperature, heart rate, and blood pressure in conscious rats. Am J Physiol Regul Integr Comp Physiol. 2003;285:R110–R116. doi: 10.1152/ajpregu.00016.2003. [DOI] [PubMed] [Google Scholar]
- Zhang F, Wang S, Luo Y, Ji X, Nemoto EM, Chen J. When hypothermia meets hypotension and hyperglycemia: the diverse effects of adenosine 5′-monophosphate on cerebral ischemia in rats. J Cereb Blood Flow Metab. 2009;29:1022–1034. doi: 10.1038/jcbfm.2009.28. [DOI] [PMC free article] [PubMed] [Google Scholar]
- Zhang J, Kaasik K, Blackburn MR, Lee CC. Constant darkness is a circadian metabolic signal in mammals. Nature. 2006;439:340–343. doi: 10.1038/nature04368. [DOI] [PubMed] [Google Scholar]