

Abstract
Previous studies have demonstrated that chronic brain hypoperfusion (CBH) causes Aβ aggregation by upregulating expression of amyloid precursor protein (APP) and β-site APP cleaving enzyme 1 (BACE1) protein, which is accompanied by cognitive impairment, but the mechanisms are not fully understood. In this study, we evaluated the effect of microRNA on memory impairment in rats induced by CBH. We show here that CBH generated by bilateral common carotid artery occlusion (2VO) significantly decreased the learning and memory ability in rats, as assessed by Morris water maze, and upregulated expression of APP and BACE1 proteins in the hippocampus and cortex of rats, as evaluated by Western blot and immunofluorescence. In reciprocal, qRT-PCR analysis showed that microRNA-195 (miR-195) was downregulated in both the hippocampus and cortex of rats following CBH, and in the plasma of dementia patients. APP and BACE1 proteins were downregulated by miR-195 overexpression, upregulated by miR-195 inhibition, and unchanged by binding-site mutation or miR-masks, indicating that APP and BACE1 are two potential targets for miR-195. Knockdown of endogenous miR-195 by lentiviral vector-mediated overexpression of its antisense molecule (lenti-pre-AMO-miR-195) elicited dementia in rats, whereas overexpression of miR-195 using lenti-pre-miR-195 reduced dementia vulnerability triggered by 2VO. Additionally, chromatin immunoprecipitation analysis showed that NFκB was bound to the promoter region of miR-195 and inhibited its expression. We conclude that miR-195 may play a key role in determining dementia susceptibility in 2VO rats by regulating APP and BACE1 expression at the post-transcriptional level, and exogenous complement of miR-195 may be a potentially valuable anti-dementia approach.
Introduction
The incidence of clinical dementia throughout the world is increasing as the population ages. Alzheimer's disease (AD) accounts for ∼60% and vascular dementia (VaD) accounts for ∼30% of the prevalence. Though they are classified as different subtypes, AD and VaD share common risk factors, indicating that their etiology is somehow related (Cole and Vassar, 2009). Currently, chronic brain hypoperfusion (CBH) is considered as a preclinical condition of mild cognitive impairment and is thought to precede dementia (Ruitenberg et al., 2005; Gorelick et al., 2011). However, how CBH produces dementia is largely unknown. Previous studies have demonstrated that CBH could induce cognitive impairment accompanied by amyloid-β (Aβ) aggregation (Kitaguchi et al., 2009; Zhiyou et al., 2009), but the mechanisms are not fully understood.
Recent studies reported that microRNAs (miRNAs) can regulate amyloid precursor protein (APP) and β-site APP cleaving enzyme 1 (BACE1) expressions. miR-298, miR-328 (Boissonneault et al., 2009), miR-107 (Wang et al., 2008), miR-29a/b-1, miR-9 (Hébert et al., 2008), and miR-29c (Zong et al., 2011) were found to target the BACE1 gene and to be decreased in their expression in AD transgenic animals or AD patients. APP was identified as a target for miR-16, the expression of which is decreased in senescence-accelerated transgenic mice (Liu et al., 2012). In addition, miR-17–5p, miR-20a (Hébert et al., 2009), and miR-101 (Long and Lahiri, 2011) were reported to regulate the expression of APP in human cell lines, and miR-124 modulated APP mRNA alternative splicing (Smith et al., 2011). Though these studies revealed the participation of miRNAs in the process of AD pathology, some important issues related to this novel mechanism remained unclear. Whether the downregulated miRNAs identified in AD transgenic mice models or AD patients were indeed caused by AD is still unresolved. What factors cause downregulation of these miRNAs in AD transgenic mice models and AD patients? What pathophysiological roles do deregulated miRNAs play? More of an issue of concern is that CBH not only is a common risk factor of AD and VaD, but is also accompanied by APP/BACE1 upregulation (Bennett et al., 2000; Cole and Vassar, 2009). Understanding how CBH produces dementia through upregulation of APP and BACE1 by miRNAs is particularly interesting.
By computational analysis of miRNAs that have the potential to target both APP and BACE1 3′ untranslated region (3′UTRs) using Targetscan and Pictar database, we identified that the miR-195/15b/16 miRNA family members are miRNAs that carry their binding sites in the 3′UTR of both APP and BACE1 genes. Aberrant expressions of miR-15b and miR-16 have been reported to play an important role in cancers, cardiovascular disease, and AD progression (Finnerty et al., 2010; Wang et al., 2011; Liu et al., 2012). Downregulation of miR-195 expression has been observed in various types of cancers (Soon et al., 2009; Xu et al., 2009; Ujifuku et al., 2010), in which miR-195 acts in a tumor-suppressor role. More importantly, a previous study reported that miR-195 regulates BDNF and alters the expression of downstream GABAergic transcripts in schizophrenia (Mellios et al., 2008), suggesting potential effects of miR-195 in CNS. However, the possible roles of miR-195 in dementia have not been studied. We hypothesized that CBH can develop into dementia through inhibition of miR-195/15b/16 expression, which in turn upregulates the expression of both APP and BACE1 proteins at the post-transcriptional levels.
Materials and Methods
Animals.
Male Sprague Dawley (SD) rats (weight 220–260 g, obtained from the Animal Center of the Second Affiliated Hospital of Harbin Medical University, Harbin, Heilongjiang Province, China) were housed at 23 ± 1°C with 55 ± 5% of humidity and maintained on 12 h dark/light artificial cycle (lights on at 7:00 A.M.) with food and water available ad libitum. Rats for creating permanent, bilateral common carotid artery occlusion (2VO) and stereotaxic injection of the lentiviral vectors were anesthetized with chloral hydrate (300 mg/kg) by intraperitoneal injection and maintained by administrating 0.5–1.0% isoflurane. The depth of anesthesia was monitored by detecting reflexes, heart rate, and respiratory rate. Samples for quantitative real-time (qRT)-PCR, Western blot assay, immunofluorescence staining, and ELISA analysis were obtained from the hippocampus and/or cortex of rats after they had been anesthetized with chloral hydrate (500 mg/kg, i.p.) followed by confirmation of death by exsanguination. Tissues for primary neuron culturing were from neonatal SD rats after administration of 20% isoflurane and confirmation of death by cervical dislocation. All animal procedures were approved by the Institutional Animal Care and Use Committee at Harbin Medical University (No. HMUIRB-2008-06) and the Institute of Laboratory Animal Science of China (A5655-01). All procedures were conformed to the Directive 2010/63/EU of the European Parliament.
Permanent, 2VO in the rat.
The method for preparation of 2VO rat was according to the study reported by Kumaran et al., (2008). Briefly, after being anesthetized, the bilateral common carotid arteries of rats were exposed via a midline ventral incision, carefully separated from the vagal nerves, and permanently ligated with 5–0 silk suture. The wounds were then sutured and rats were allowed to recover from anesthesia before being returned back to their cages. The extent of cerebral ischemia was evaluated at 1 and 8 weeks post 2VO. Briefly, the brains of rats were immediately removed, cut into 2 mm sections, then immersed sequentially into a phosphate-buffered 2% 2,3.5-triphenyltetrazolium chloride (TTC) solution at 37°C for 30 min, and then fixed in phosphate-buffered 4% paraformaldehyde (PFA) solution at 4°C.
Morris water maze.
The Morris water maze (MWM) consisted of a black circular pool of 2.0 m diameter, filled with opaque water (25 ± 1°C) via addition of black food pigment. A submerged escape platform (20 cm diameter platform, top surface 2.0 cm below water level) was located in the center of the first quadrant. Before training, the pupillary light reflex of all rats was tested and rats with impaired pupillary light reflex were excluded from the experiment to avoid the influence of the animal's vision on the test (Stevens et al., 2002). For cued training (three trials per day for 5 d), the rats were released into the water facing the side walls, and each rat was allowed 120 s to find the platform, otherwise, they were guided to the platform and permitted to rest for at least 20 s. After the last cued trial of day 5, the platform was removed from the pool and each rat received one 120 s swim probe trial on day 6. Escape latency (s), length of swim path (cm), swim speed (cm/s), the times of crossing platform, and the percentage of swimming distance in target quadrant in total distances of the pool were monitored using an online DigBehav-Morris water maze Video Analysis System (Mobile Datum Software Technology).
Human blood sample preparation.
Patients (average age: 82 ± 4 years old) from the First and Second Affiliated Hospital of Harbin Medical University diagnosed with VaD were recruited in the hospital based on the criteria of the National Institute of Neurological and Communicative Disorders (Sarazin et al., 2012). Written consent was obtained from all subjects, and the study protocol was approved by the Ethics Committee of Harbin Medical University.
For miRNA and Aβ quantification, whole blood samples (3 ml per patient) were collected from subjects via a direct venous puncture into a vacuum blood collection tube with sodium citrate. Whole blood samples of 0.5 ml were carefully transferred into an RNase-free tube for extraction of RNA. The remnant of the blood sample was used for ELISA analysis.
Sandwich ELISA analysis.
Preparation of samples used for ELISA analysis has been described previously (Lazarov et al., 2005; Bales et al., 2009; Meilandt et al., 2009). Frozen tissue from unilateral hippocampus samples were homogenized in Tris-buffered saline (TBS) containing protease inhibitors at 4°C for 30 min. Extracts were centrifuged at 100,000 × g for 1 h at 4°C. The supernatant representing the TBS-soluble fraction (Aβ-TBS) was collected. The resultant pellet was resuspended and sonicated in radioimmunoprecipitation assay (RIPA), and incubated at room temperature for 90 min. The RIPA-solubilized homogenates were centrifuged at 100,000 × g for 1 h at 4°C. The supernatant representing the RIPA-soluble fraction (Aβ-RIPA) was collected. The insoluble pellets were resuspended in 5 m guanidine HCl, pH 8.0, sonicated for 15 s, and incubated at 4°C for 90 min. The extracts were used to evaluate the insoluble Aβ. The level of insoluble or soluble Aβ was captured by monoclonal antibody BNT77, recognized by horseradish peroxidase-conjugated antibody specific for Aβ40 (BA27) and Aβ42 (BC05), quantified by using commercial Aβ1-42 and Aβ1-40 Kits (Wako Pure Chemical; catalog #292-64501, #294-64701), and finally analyzed according to the instructions of the kits.
For plasma Aβ level detection, briefly, blood collected in a vacuum blood collection tube with sodium citrate was centrifuged at 5000 × g, 4°C for 5 min to separate plasma from whole blood. A total of 0.2 ml plasma was diluted with 0.6 ml standard diluent. Captured Aβ was quantified and analyzed according to the instruction of the kits (Wako Pure Chemical; catalog #292-64501, #294-64701).
Primary hippocampal and cortical neuron cultures.
The hippocampal and cortical regions were removed from postnatal day 0 rat pups. After tissues were dissected and triturated, they were plated onto cell plates precoated with 10 μg/ml poly-d-lysine (Sigma) and cultured in culture media containing neurobasal medium (Invitrogen) with 2% B27 supplement (Invitrogen) and 10% fetal bovine serum (FBS; HyClone). After 3 d, the neurons were treated with 5 μm cytosine arabinoside (Sigma) to inhibit astrocyte proliferation. For all experiments, the neurons were used 5–7 d after plating.
Synthesis of miR-195, AMO-195, and other various oligonucleotides.
miR-195 mimics (sense: 5′-UAGCAGCACAGAAAUAUUGGC-3′; antisense: 5′-CAAUAUUUCUGUGCUGCUAUU-3′) and AMO-miR-195 (5′-GCCAAUAUUUCUGUGCUGCUA-3′) were synthesized by Shanghai GenePharma. AMO-195 contains 2′-O-methyl modifications. In addition, a scrambled RNA was used as a negative control (NC) (sense: 5′-UUCUCCGAACGUGUCACGUAA-3′ and antisense: 5′-ACGUGACACGUUCGGAGAAUU-3′). The BACE1 and APP-masking antisense oligodeoxynucleotides (ODNs) were synthesized by Shanghai Sangon Biological Engineering Technology and Service. BACE1 masking antisense-ODN-1 was 5′-AAGCAGCAACAUUUCCAACTC-3′, which masks the binding sites of miR-195 located in position 266–272 of BACE1 3′UTR; BACE1 masking antisense-ODN-2 was 5′-AGCCAGAGCAGCCCCAGUGCA-3′, which masks the binding sites of miR-195 located in position 1795–1801 of BACE1 3′UTR; APP masking antisense-ODN was 5′-AAGCAGCAAUCUGUACAGUAA-3′, which masks the binding sites of miR-195, located in position 562–568 of APP 3′UTR; five nucleotides or deoxynucleotides at both ends of the antisense molecules were locked by a methylene bridge connecting between the 2′-O- and the 4′-C atoms.
Transfection procedures.
Then 75 pmol/ml miR-195 and/or AMO-195, ODNs, or NC siRNAs were transfected into neonatal hippocampal and cortical neurons with X-treme GENE siRNA transfection reagent (catalog #04476093001; Roche) according to the manufacturer's instructions. Forty-eight hours after transfection, cells were collected for total RNA isolation or protein purification.
Construction of lentivirus vectors.
Using the BLOCK-iT pol II miR RNAi expression vector with the EmGFP kit from Invitrogen, three single-stranded DNA oligonucleotides were designed as follows: (1) pre-miR195 (“top strand” oligo: tgctgTAGCAGCACAGAAATATTGGCGTTTTGGCCACTGACTGACGCCAATATCTGTGCTGCTA) and its complementary chain (“bottom strand” oligo: cctgTAGCAGCACAGATATTGGCGTCAGTCAGTGGCCAAAACGCCAATATTTCTGTGCTGCTAc); (2) pre-AMO-miR195 (“top strand” oligo: tgctgGCCAATATTTCTGTGCTGCTAGTTTTGGCCACTGACTGACTAGCAGCAGAAATATTGGC) and its complementary sequence (“bottom strand” oligo: cctgGCCAATATTTCTGCTGCTAGTCAGTCAGTGGCCAAAACTAGCAGCACAGAAATATTGGCc); and (3) negative control (“top strand” oligo: tgctgAAATGTACTGCGCGTGGAGACGTTTTGGCCACTGACTGACGTCTCCACGCAGTACATTT) and its complementary sequence (“bottom strand” oligo: cctgAAATGTACTGCGTGGAGACGTCAGTCAGTGGCCAAAACGTCTCCACGCGCAGTACATTTc). We then cloned the double-stranded oligonucleotides generated by annealing the top and bottom strand oligos into the pcDNA6.2-GW/± EmGFP-miR vector and transformed the ligated constructs into competent Escherichia coli. After the colony was purified and identified as the correct expression clone, the pre-miRNA expression cassette was transferred to the Gateway adapted destination vectors using Pol II promoters to form a new miRNA expression clone containing attR substrates. The vector was identified after analyzing the plasmid sequence (Invitrogen). The titers of lenti-pre-miR-195 and lenti-pre-AMO-miR-195 vectors used for experiments were 1.05 × 10⁸ transducing U/ml and 7.0 × 10⁷ transducing U/ml, respectively. Virus suspensions were stored at −80°C until use and were briefly centrifuged and kept on ice immediately before injection.
Stereotaxic injection of the lentiviral vectors.
After anesthesia, rats were placed into a stereotaxic frame (RWB Life Science). Injection coordinates relative to the bregma were as follows: anteroposterior, −4.52 mm; mediolateral, ±3.2 mm; dorsoventral −3.16 mm below the surface of dura using coordinates derived from the atlas of Paxinos and Watson (1997). Two microliters (10,000 TU/μl) lenti-pre-miR-195 and/or lenti-pre-AMO-miR-195 were injected into CA1 of hippocampus using a 5 μl Hamilton syringe with a 33 gauge tip needle (Hamilton). The needle was then maintained in the place for another 2 min after injection and then withdrawn very slowly to prevent backflow of solution. The accuracy of injection sites was identified by the Evans blue (Sigma) stereotaxic injection directly into the hippocampus CA1 subfield.
Lipopolysaccharide treatments.
Lipopolysaccharide (LPS), purchased from Sigma Chemical, was dissolved in neurobasal medium to create a 100 μg/ml stock solution and stored at −20°C. When the cells had been cultured 5 d in vitro, they were exposed to fresh culture media with or without 10 μg/ml of LPS for the time period to be indicated.
Dual Luciferase reporter assay.
HEK293T cells (plated at 40–50% confluence) were transfected with 20 μmol/L miR-195, AMO-195, or NC siRNAs as well as 0.5 μg of psi-CHECK-2-target DNA (firefly luciferase vector) and 1 μl of blank plasmid using Lipofectamine 2000 (Invitrogen) transfection reagent according to the manufacturer's instructions. After 48 h of transfection, luciferase activities were measured with a dual luciferase reporter assay kit (catalog #E1910; Promega) and luminometer (GloMax 20/20; Promega). Nucleotide-substitution mutagenesis was performed using direct oligomer synthesis for the 3′UTRs of APP, BACE1-binding site 1 and BACE1-binding site 2. All constructs were sequence verified.
Chromatin immunoprecipitation assay.
Primary neurons were cultured as described above. The medium for the cultured neurons was replaced by fresh neurobasal medium with 2% B27 and 10% of FBS (HyClone) once every 3 d. The NFκB protein expression was initially detected by Western blot with antibodies against p65 (ab7970; Abcam). Chromatin immunoprecipitation assay (ChIP) was performed with the imprint ChIP assay kit (catalog #26156; Pierce Thermo Fisher Scientific) according to the manufacturer's instructions. The PCR primers (miR-195 ChIP Forward (F) primer 1: 5′-TGGGGTGAGGAATGTAGTGTTG-3′, miR-195 ChIP Reverse (R) primer 1: 5′-GGTCCCCTATTTTGAAAGGAGC-3′, miR-195 ChIP F2: 5′-CTTAGGTCCCTGCCTCTGTCG-3′, miR-195 ChIP R2: 5′-GAACAACAAAATCGGGAACCAGC-3′) were designed to amplify 296 and 201 bp fragments, respectively, from selected genomic regions, respectively. RT-PCR of genomic regions containing the putative NFκB-binding sites was performed in triplicate. Cycling parameters were 98°C for 5 min, followed by 35 cycles of 98°C for 30 s, 55°C for 20 s, 68°C for 20 s, and 72°C for 5 min. Amplification of the negative control construct, a 213 bp fragment spanning selected genomic regions, was performed with oligos 5′-CCAGCTCACGAGGGCCTCGG-3′ and 5′-CAGCCGCCCAGACCAAATGG-3′. The relative occupancy of the immunoprecipitated factor at a locus was estimated by using the comparative threshold method.
qRT-PCR.
Total RNA was purified with the Trizol Reagent (Invitrogen), according to the manufacturer's instructions. MiR-195 level was quantified by the TaqMan MicroRNA Reverse Transcription Kit (catalog #4366596, ABI; Roche) and TaqMan Gene Expression Master Mix (catalog #4369016; Applied Biosystems). APP and BACE1 mRNA levels were quantified by the High Capacity cDNA Reverse Transcription Kit (catalog #4368814, ABI; Roche) and the TaqMan Gene Expression Master Mix (catalog #4369016; Applied Biosystems). U6 or β-actin was used as an internal control. The TaqMan qRT-PCR probes and primers for miR-195 (catalog #4427975, ID: 000494), BACE1 (catalog #4331182; ID: Rn00569988_m1), APP (catalog #448892; ID: Rn00570673_ml), U6 (catalog #4427975; ID: 001973), and β-actin (catalog #4331182, ID: Rn00667869_ml) mRNA levels were designed by Applied Biosystems. qPCR was performed on a thermocycler ABI Prism 7500 fast (Applied Biosystems), and the protocol was as follows: (1) 95°C, 10 min; (2) 95°C, 15 s; (3) 60°C, and 1 min (repeat (2) and (3) for 40 cycles). Results were normalized against the internal control using the δ-δ CT method.
Western blot.
Total protein samples were extracted from hippocampus and prefrontal cortex of rats or primary cultured neurons for immunoblotting analysis. The nuclear protein was extracted using the kit from Beyotime Institute of Biotechnology according to the manufacturer's instructions. Protein concentrations from all extractions were measured using the Bio-Rad Protein Assay (Bio-Rad) in conjunction with bovine serum albumin standards. Protein samples (60 μg) were fractionated by SDS-PAGE gel then transferred to PVDF membrane. Anti-BACE1 antibody (catalog #ab2077; 1:1000; Abcam), anti-APP antibody (catalog #MAB348–100 μl; 1:1000; Millipore), anti-NFκB antibody (catalog #sc-372; 1:200; Santa Cruz Biotechnology), and anti-lamin B antibody (catalog #sc-6216; Santa Cruz Biotechnology) were used. Western blot bands were captured on the Odyssey Infrared Imaging System (LI-COR Biosciences) and quantified with Odyssey v1.2 software by measuring the band intensity (area × OD) in each group and normalizing to the internal control.
Immunofluorescence detection.
Rats were anesthetized with 10% chloral hydrate (500 mg/kg, i.p.) and perfused transcardially with 4% buffered PFA, pH 7.4. The brains were removed, dehydrated and frozen in OCT, and 20 μm sections were mounted on glass slides. After blocking, sections were incubated with the primary antibodies anti-MAP2 antibody (catalog #ab11267; 1:200; Abcam), anti-GFAP antibody (catalog #ab7260; 1:500; Abcam), anti-BACE1 antibody (catalog #ab2077; 1:1000; Abcam), or anti-APP antibody (catalog #MAB348–100 μl; 1:1000; Millipore) overnight at 4°C, and then the brain slices were washed and incubated with the secondary antibodies conjugated to Alexa Fluor 488 and Alexa Fluor 594 (Invitrogen) for 1 h at room temperature.
Statistical analysis.
Data were described as mean ± SEM. Quadrant-by-quadrant and day-by-day between-group's comparisons were performed using factorial ANOVA (split-plot design). Post hoc analyses of significant main effects were further examined using Fisher's PLSD tests. The two-tailed Student's t test was applied for comparisons between the two groups; p < 0.05 was considered statistically significant. SAS 9.1 software (Serial number: 989155; Institute Inc.) was used for all statistical analyses.
Results
Rat model of dementia induced by CBH generated by 2VO
We developed a rat model of CBH by 2VO for 8 weeks to produce the dementia phenotype (Farkas et al., 2007). With the model, we first analyzed cerebral ischemia of rats by TTC staining. The result showed that the CBH phenotype lasted for at least 8 weeks following 2VO (Fig. 1A). Using the MWM test (Vorhees and Williams, 2006), we found that the ability of spatial learning and memory was significantly impaired in 2VO rats compared with age-matched SD rats. First, after guiding a direct path to the hidden platform located in the first quadrant from the second quadrant of the tank, the 2VO rats had longer latency to navigate to the hidden platform than sham rats after starting from the third and fourth quadrant on day one (Fig. 1B; for groups: F(1,17) = 24.55, p < 0.0001; for quadrants: F(2,51) = 19.34, p < 0.0001; for groups × quadrants: F(2,51) = 4.91, p = 0.0112), indicating that 2VO rats are unable to learn to use cues as navigational guides. Second, in learning trial, the 2VO rats also took more time to find the hidden platform after they had been released into the tank in all of the three nontarget quadrants day by day (Fig. 1C–E; for groups: F(1,17) = 32.67, p < 0.0001; for days F(4,68) = 18.35, p < 0.0001; for groups × training days: F(4,68) = 0.77, p = 0.5477). The results suggested that 2VO rats have the decreased ability to combine cues with memory to reach the target. In addition, in the probe trial, 2VO rats showed reduced platform crossings (6.3 ± 0.29 and 3.8 ± 0.23 times in Sham and 2VO groups, respectively, p < 0.05 vs Sham). Further, the percentage of swimming distance in the target quadrant reduced to ∼28% in 2VO rats from ∼34% in Sham group (p < 0.05 vs Sham). These results indicate memory impairment of 2VO rats compared with Sham group in the probe trial (Fig. 1F). The decreased microtubule-associated protein 2 (MAP2) and increased glial fibrillary acidic protein (GFAP) expressions were used as hallmarks of dementia induced by cerebral hypoperfusion (Cechetti et al., 2012). In line with this notion, our immunofluorescence staining showed lower MAP2 expression (red) and higher GFAP level (green) in the hippocampus of 2VO rats than that in age-matched sham rats (Fig. 1G). These changes are consistent with the typical dementia induced by CBH.
Figure 1.
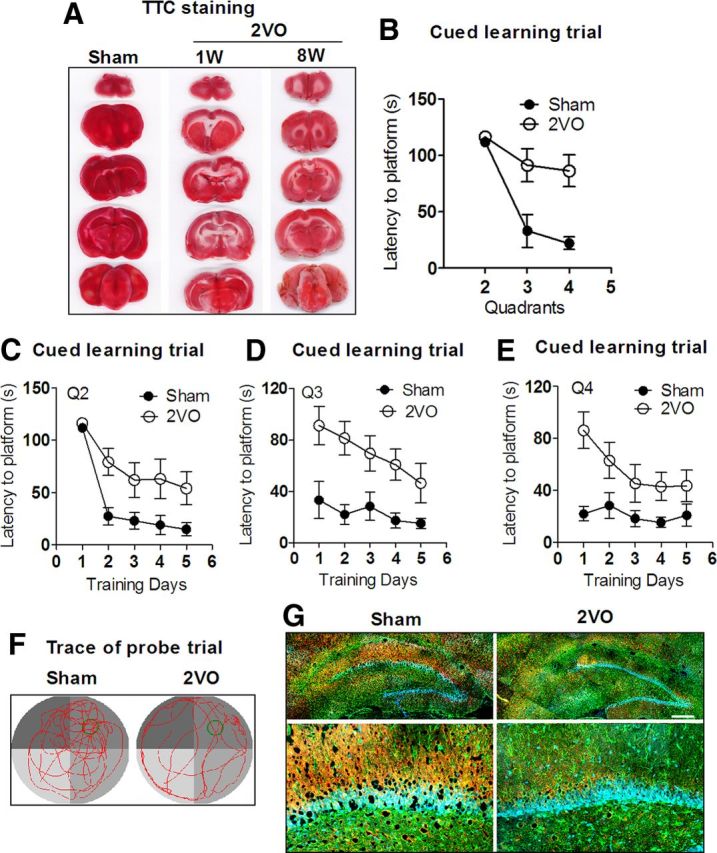
Learning and memory deficits of rats with 2VO assessed by MWM test. A, Characterization of cerebral ischemia in a coronal section after 2VO for 1 week (1W) and 8 weeks (8W). TTC staining was used to identify the brain ischemia. Red represents normal tissue and white represents infarct tissue. B, Comparison of average escape latency to find the platform for Sham group and 2VO group from other three nontarget quadrants (Q) starting trials at training day 1. n = 10 for Sham group, n = 9 for 2VO group, mean ± SEM (same below). C–E, Mean daily latencies to escape from the start point onto the hidden platform in Q2, 3, and 4. n = 10 for Sham group, n = 9 for 2VO group. F, Representative path tracings of the probe test on day 6 in the MWM test for each group. Typical swimming patterns signed by tending to target quadrant in Sham rats, while random-type swimming paths were found in 2VO rats. G, Characterization of cell assessment in the hippocampus from 2VO and Sham rats by immunofluorescence staining. Neuron marker MAP2 was stained in red and astrocyte marker GFAP was stained in green. Scale bar, 300 μm.
Western blot analysis showed that protein levels of APP and BACE1 in the hippocampus and cortex of 2VO rats were increased by >1.5-fold relative to Sham rats (Fig. 2A). These results were further supported by the increased immunofluorescence densities of both APP (red) and BACE1 (green) in the cortex, CA1, and dentate gyrus (DG) subfield of the hippocampus (Fig. 2B), though APP mRNAs was not changed nor were BACE1 mRNA levels even decreased in 2VO rats compared with Sham rats (Fig. 2C). In addition, Aβ40 is a more abundant proteolytic product of APP than Aβ42, which is processed by γ-secretase (Esler and Wolfe, 2001; Jacobsen and Iverfeldt, 2009). In the present study, we found that the soluble Aβ40 level in the hippocampus was decreased 23.59 ± 1.12 pmol/L in 2VO rats from 37.59 ± 3.66 pmol/L in Sham group rats, but there was no change in its insoluble form between the two groups (Fig. 2D), whereas the total content of Aβ40 in the plasma was significantly increased (Fig. 2F; 69.50 ± 8.6 and 81.62 ± 5.03 pmol/L in 2VO and Sham groups, respectively), as determined by ELISA. Since Aβ42 is considered to be a neurotoxic product of endoproteolysis of APP (Rosner et al., 2006), we measured Aβ42 levels in both the hippocampus and plasma. We found that the level of insoluble Aβ42 levels in the hippocampus of 2VO rats was increased into 9.41 ± 0.41 pmol/L from 5.83 ± 0.36 pmol/L in Sham rats, although its soluble level was unchanged (Fig. 2E). In line with this result, the total Aβ42 level was also increased in plasma of 2VO rats (Fig. 2F). Importantly, the ratio of Aβ42/Aβ40 was significantly increased in both the hippocampus (soluble: 0.19; insoluble: 0.27) and plasma (0.12) relative to that in control group (hippocampus: soluble: 0.12; insoluble: 0.16. plasma: 0.09). These results suggest that enhanced β-cleavage of APP may participates in the process of abnormal amyloidogenesis in 2VO rats (Yin et al., 2007).
Figure 2.

Alterations of APP, BACE1, and Aβ levels in 2VO rats compared with Sham-operated rats. A, Western blot analysis with the hippocampus and cortex tissues in Sham and 2VO rats. Top, Representative immunoblotting images of APP, BACE1, and β-actin. Bottom, The digital data of the immunoblotting analysis. The optical density was evaluated for each band and values for 2VO rat tissue were normalized to Sham group after correction for protein loading with β-actin. *p < 0.05 versus Sham, n = 6. B, Representative confocal microscope images showing cells stained for APP (red, left) and BACE1 (green, middle). Merged images depicting double positivity (yellow) are shown on the right in cortex, CA1, and DG tissues of Sham and 2VO rats. Scale bar, 200 μm. C, The relative quantification of APP and BACE1 mRNA levels was detected by qRT-PCR normalized to β-actin, followed by further normalization to the values from Sham brain tissues. *p < 0.05 versus Sham, n = 7. D, Soluble and insoluble Aβ40 levels in hippocampus tissues from 2VO rats and Sham rats by ELISA assay. *p < 0.05 versus Sham, n = 5. E, Soluble and insoluble Aβ42 levels in hippocampus tissues from 2VO rats and Sham rats by ELISA assay. *p < 0.05 versus Sham, n = 7. F, Aβ42 and Aβ40 levels in plasma of rats by ELISA assay. *p < 0.05 versus Sham, n = 7. Hippo, hippocampus.
MiR-195 targets APP and BACE1
The fact that the APP and BACE1 protein levels were increased while the mRNA level of APP was unchanged and BACE1 mRNA was even decreased in both the hippocampus and cortex suggests that a post-transcriptional regulatory mechanism might account for the observed changes. To test this notion, we conducted computational analysis using the miRNA databases Targetscan and Pictar to identify the candidate miRNAs that have the potential to regulate the expression of both APP and BACE1. In this way, the miR-195/15b/16 cluster (Fig. 3A) was picked up for our experimental studies. Our qRT-PCR analysis showed that miR-195, a highly conserved transcript among species (Guo et al., 2010), was downregulated into ∼60% of Sham rats in both the hippocampus and the cortex (Fig. 3B), while levels of miR-15b and miR-16 were not significantly changed (Fig. 3C,D). To elucidate whether the decreased miR-195 has potential clinical significance, seven patients who were diagnosed with VaD according to clinical diagnosis standard were recruited for our study. As illustrated in Figure 3E, the plasma concentration of Aβ42 was significantly increased in VaD patients compared with control group. The Aβ40 level displayed a similar tendency but did not reach statistical significance (Fig. 3E). Further, we found that miR-195 level in blood from VaD patients was decreased by ∼50% of the control group (p < 0.05 vs non-VaD patients, n = 7), indicating that miR-195 may also be involved in the pathophysiology of human dementia.
Figure 3.

Reduction of miR-195 level in both 2VO rats and patients with VaD. A, Sequences of the miR-195/15b/16 family members. The conserved seed sequences among three miRNAs are underlined. B, miR-195 levels after normalization to U6 levels, measured by qRT-PCR. *p < 0.05 versus Sham, n = 12. C, D, miR-16 and miR-15b levels were quantified by qRT-PCR, no significant differences were found for hippocampus and cortex tissues in 2VO rats compared with sham rats. n = 12. E, Aβ42 and Aβ40 levels in plasma of patients with VaD by ELISA assay. *p < 0.05 versus non-VaD patients, n = 7.
To experimentally verify APP and BACE1 as targets of miR-195, we first cloned the full length of the 3′UTRs of APP or BACE1 containing the miR-195 binding sites into the luciferase-expressing reporter plasmid, and then assessed the effects of miR-195 on reporter activities in HEK293T cells. As shown in Figure 4, A and B, cotransfection of miR-195 with the plasmid consistently produced less luciferase activities than transfection of the plasmid alone, whereas mutation of the binding sites abolished the effect of miR-195. Application of 2′-O-methyl antisense oligoribonucleotides to miR-195 (AMO-195) eliminated the silencing effect of miR-195 on APP genes (Fig. 4B). There were two binding sites of miR-195 in the 3′UTR of BACE1 (Fig. 4C). As displayed in Figure 4, D and E, miR-195 significantly inhibited luciferase activities of BACE1 (Fig. 4D). Both of the binding sites contributed to the repressive effects. Mutations in the site BACE1–1:266–272 bp and the site BACE1–2:1795–1808 bp reduced the repressive effects on luciferase activities by 20 and 23%, respectively.
Figure 4.

APP and BACE1 are potential targets of miR-195. A, Complementarity between miR-195 seed sequence (5′end 7–8 nt) and the 3′UTR of rat's APP predicted by a computational and bioinformatics-based approach using the Targetscan algorithm. Watson–Crick complementarity is connected by “|”. The mutations made to the genes are underlined. B, Luciferase reporter gene assay for interactions between miR-195 and its binding sites in the 3′UTR of the APP mRNA in HEK293T cells. Cells were transfected with luciferase-target motif chimeric vector alone, miR-195, miR-195 + AMO-195, or NC using Lipofectamine 2000. *p < 0.05 versus blank, #p < 0.05 versus miR-195. C, miR-195 seed sequence (5′end 7–8 nt) complementary with the 3′UTR of rat's BACE1 predicted by a computational and bioinformatics-based approach using the Targetscan algorithm. Watson–Crick complementarity is connected by “|”. The mutations made to the genes are underlined. D, E, Luciferase reporter gene assay for interactions between miR-195 and its binding sites (D) or mutation of binding site (E) in the 3′UTR of the BACE1 mRNAs in HEK293T cells. Cells were transfected with luciferase-target motif chimeric vector alone, miR-195, miR-195 + AMO-195, or NC using Lipofectamine 2000. *p < 0.05 versus blank, #p < 0.05 versus miR-195.
To observe whether changes of miR-195 could affect APP and BACE1 expression in neurons, miR-195 and AMO-195 were transfected by X-treme GENE siRNA transfection reagent into cultured neonatal rat neurons (NRNs). The successful transfection of miR-195 and AMO-195 into NRNs was verified by qRT-PCR (Fig. 5A). Using immunoblotting and immunofluorescence analyses with cultured NRNs (Fig. 5B–D), we observed that miR-195 effectively inhibited the expression of both APP and BACE1 by nearly 60% relative to control group, whereas the scrambled NC miRNA failed to affect the protein levels. In contrast, AMO-195 rescued the downregulation of both APP and BACE1 elicited by miR-195, indicating the sequence specificity of miR-195 actions. The mRNA levels of both APP and BACE1 after transfection with miR-195, AMO-195, and miR-195+AMO-195 were unchanged (Fig. 5E). To verify that the observed changes of APP and BACE1 in cultured neurons transfected with miR-195 were the direct actions of miR-195, the miRNA-masking antisense ODNs (miR-masks) technique was used as previously reported (Choi et al., 2007). An miR-mask is an antisense ODN fragment designed to fully base pair to a protein-coding mRNA at the sequence motif spanning the binding site for an endogenous miRNA of interest (Fig. 5F). Since an miR-mask only acts on the target gene with minimal effects on other target genes that may also be targeted by a same miRNA, the anti-miRNA action of an miR-mask is gene specific. In this study, we designed three miR-195-masks that can base pair the miR-195 binding sites in the 3′UTRs of APP and BACE1 genes, which are labeled APP-ODN, BACE1-ODN1, and BACE1-ODN2. As expected from their principle of action, these miR-masks, unlike AMO-195, did not affect miR-195 level when cotransfected with miR-195. APP-ODN blocked the repressive effects of miR-195 on APP but did not affect its effects on BACE1 (Fig. 5G). On the other hand, when cells were cotransfected with miR-195 and BACE1-ODN1 or BACE1-ODN2, downregulation of BACE1 by miR-195 was prevented without affecting APP expression (Fig. 5H).
Figure 5.
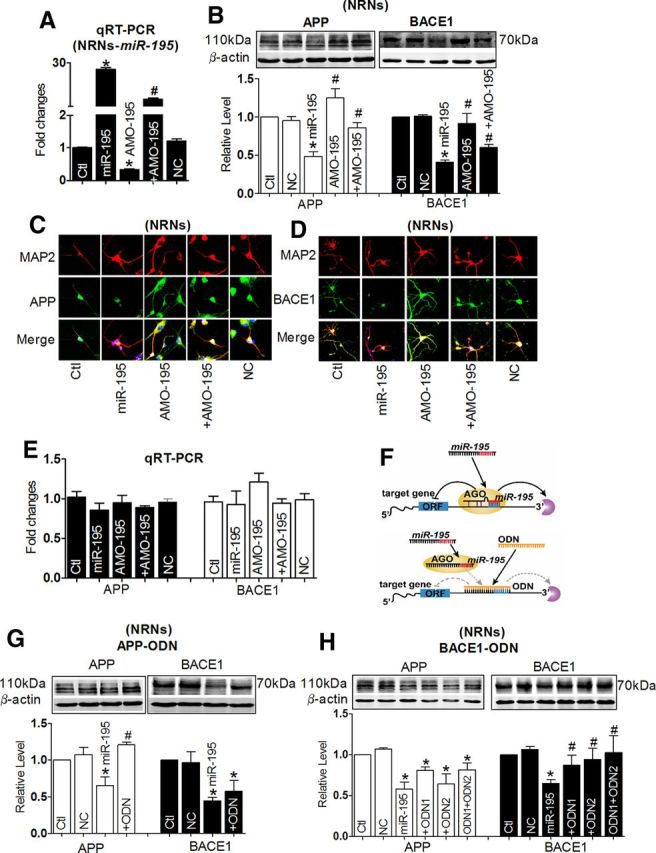
miR-195 downregulates the expression of APP and BACE1 proteins. A, Verification of uptake of miR-195 by NRNs after transfection. *p < 0.05 versus NC, n = 7 independent RNA samples for each group. B, Effects of miR-195 on protein levels of endogenous APP and BACE1 in primary cultured NRNs by Western blot analysis. Cells were transfected with miR-195, AMO-195, miR-195 + AMO-195, or NC, from three batches of cells for each group. *p < 0.05 versus NC; #p < 0.05 versus miR-195. C, D, Representative confocal microscope images showing primary culture hippocampus neuron stained for MAP2 (red, upper), APP (C, green, middle), and BACE1 (D, green, middle). Merged images depicting double positivity (yellow) are shown on the bottom after transfection with miR-195 mimics and/or AMO-195 and NC. E, The mRNA level of APP and BACE1 in cells after transfection with miR-195, AMO-195, and miR-195 + AMO-195. n = 5. F, Schematic of miR-195 silencing using ODNs. Top, miR-195 binds to partially complementary target sites in the 3′UTRs of target mRNAs (APP and BACE1), which mediates translational repression or mRNA degradation. Bottom, Gene-specific ODNs (designed as 22 oligonucleotides fully complementary to the complete sequence of miR-195 target sites in the 3′UTRs of target mRNAs) with high binding affinity completely masking the target sites of miR-195 in the 3′UTRs of target mRNAs, which block the repression of target mRNAs. ORF, open reading frame; AGO, argonaute. G, H, Derepression of APP by APP-ODN (G) and BACE1 by BACE1-ODN (H) in NRNs, respectively, determined by Western blot analysis. n = 3 batches of cells for each group. *p < 0.05 versus NC; #p < 0.05 versus miR-195. Ctl, control.
Knockdown of miR-195 elicits learning and memory deficits
Upregulation of APP and BACE1 due to miR-195 suppression is expected to promote dementia. To test this notion, 2.0 μl of anti-miR-195 oligonucleotide fragment carried by lentivirus vector (lenti-pre-AMO-miR-195) was stereotaxically injected directly into the bilateral hippocampus CA1 subfields for each rat. The injection sites were visualized by Evans blue injection (Fig. 6A). Application of lenti-pre-AMO-miR-195 resulted in significantly lower expression of miR-195 (>50%) in the hippocampus of rats after 8 weeks than the rats pre-injected with the NC oligonucleotide (Fig. 6B). In addition, miR-195 downregulation was not limited to the hippocampus, but was also seen in the cortex, suggesting that injected lenti-pre-AMO-miR-195 in the hippocampus can be somehow transferred to the cortex (Fig. 6B). As shown in Figure 6C, by MWM test, loss of function of miR-195 resulted in a prolonged latency to navigate to the hidden platform on day 1 after injection (post hoc analyses, AMO-195 vs NC, Q2: F(2,37) = 1.190, p = 0.328; Q3: F(2,37) = 4.499, p < 0.05; Q4: F(2,37) = 7.265, p < 0.05), which was partially reversed by combination with lenti-pre-miR-195 (post hoc analyses, AMO-195 vs AMO + miR-195, p < 0.05). By analyzing the latency to the platform day by day, the lenti-pre-AMO-miR-195 rats took a longer time to find the platform compared with the NC-treated animals, and lenti-pre-miR-195 reversed the prolonged latency to the platform of rats following lenti-pre-AMO-miR-195 injection (Fig. 6D; Day 1: F(4,77) = 6.991, p < 0.05; Day 2: F(4,77) = 6.975, p < 0.05; Day 3: F(4,77) = 2.963, p = 0.08; Day 4: F(4,77) = 4.505, p < 0.05; Day 5: F(4,77) = 1.530, p = 0.24). Though the lenti-pre-miR-195 injection did not reverse the decreased platform crossings induced by the lenti-pre-AMO-miR-195 in probe trial (Fig. 6E; crossing times: 8.0 ± 0.52, 4.71 ± 0.39, and 6.29 ± 0.33 in control; AMO-195; and AMO + miR-195 groups, respectively), the percentage of swimming distance in the target quadrant relative to the total distance was markedly improved from ∼30 to ∼35% (Fig. 6F). This phenomenon may be caused by the looping search pattern in rats administrated by AMO-195 (Fig. 6G). The protein levels of APP and BACE1 were measured by Western blot. As shown in Figure 6, H and I, APP and BACE1 protein levels were significantly increased in both the hippocampus and the cortex in rats treated with lenti-pre-AMO-miR-195, compared with NC group. Cotransfection with the lenti-pre-miR-195 could reverse the effects of AMO-195 (Fig. 6H,I). The results were further supported by the increase of insoluble Aβ42 from the hippocampus after the lenti-pre-AMO-miR-195 injection (8.45 ± 0.18 pmol/L), which was reversed by cotransfection with the lenti-pre-miR-195 (5.19 ± 0.74 pmol/L), although the soluble Aβ42 levels were not significantly changed among three groups (Fig. 6J). Similar changes of Aβ42 level were observed in blood samples (Fig. 6K; 6.98 ± 0.12, 8.53 ± 0.22, and 6.85 ± 0.15 pmol/L in NC; AMO-195; and AMO + miR-195 group, respectively). Importantly, miR-195 effectively reversed the increased ratios of Aβ42/Aβ40 induced by AMO-195 in both the hippocampus (Fig. 6 L) and plasma (Fig. 6M).
Figure 6.
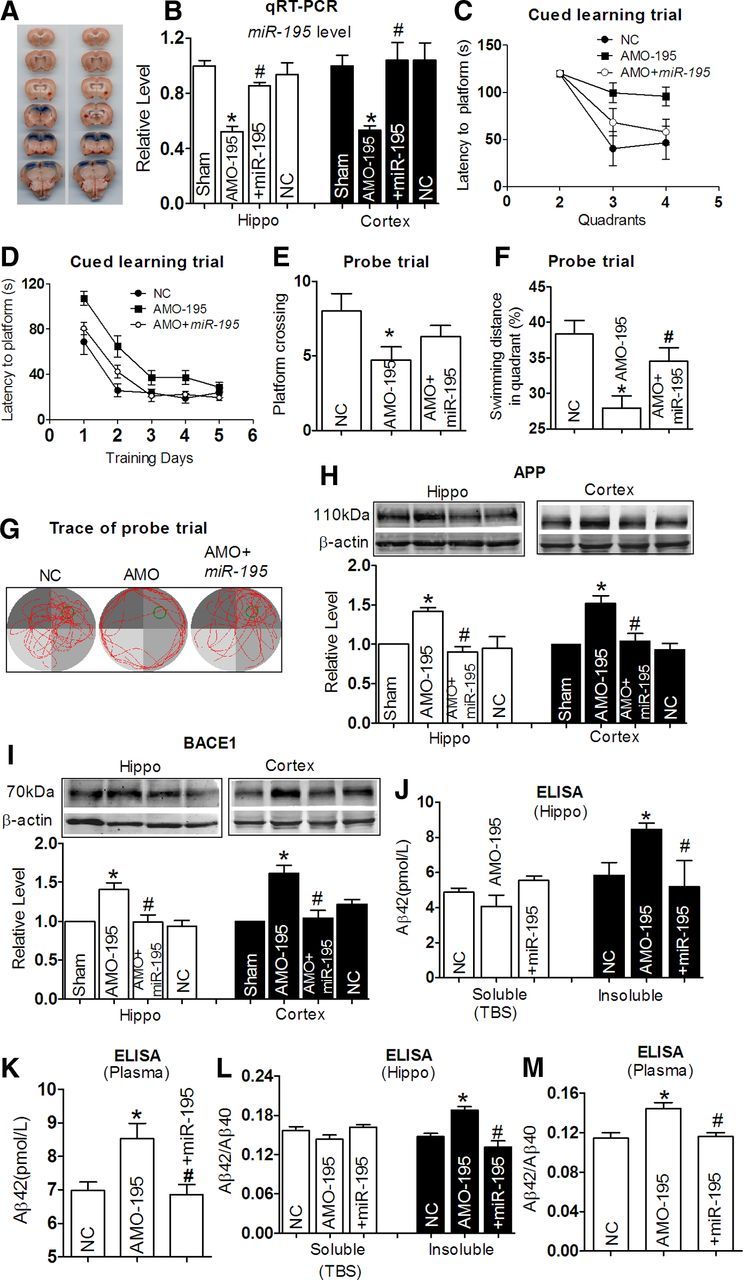
miR-195 knockdown produces learning and memory deficits in rats. A, Verification of the injection sites by Evans blue staining in stereotaxic surgery. B, Quantification of miR-195 in the hippocampus and the cortex tissues after stereotaxic injection for 8 weeks using qRT-PCR. Rats were transfected with lenti-pre-AMO-miR-195, lenti-pre-AMO-miR-195 + lenti-pre-miR-195, or NC. Data shown were from six rats for each group. *p < 0.05 versus NC; #p < 0.05 versus lenti-pre-AMO-miR-195. C, Average escape latency to platform at day 1 after lenti-pre-AMO-miR-195, lenti-pre-AMO-miR-195 + lenti-pre-miR-195 treatment, and NC. n = 6 for NC group, n = 8 for lenti-pre-AMO-miR-195 group, and blank n = 8 for lenti-pre-AMO-miR-195 + lenti-pre-miR-195 group. D, Mean daily latencies to escape from the start point onto the hidden platform after lenti-pre-AMO-miR-195, lenti-pre-AMO-miR-195 + lenti-pre-miR-195 treatment for 8 weeks. n = 6 for NC group, n = 8 for lenti-pre-AMO-miR-195 group, and n = 8 for lenti-pre-AMO-miR-195 + lenti-pre-miR-195 group. E, Number of times crossed the target platform location during probe trial. *p < 0.05 versus NC, n = 6. F, Percentage of swimming distance in the target quadrant relative to the total distance of the pool during probe trial. *p < 0.05 versus NC, #p < 0.05 versus lenti-pre-AMO-miR-195, n = 6. G, Representative path tracings of the probe test on day 6 in the MWM test for each group. H, I, APP (H) and BACE1 (I) protein levels in the hippocampus and the cortex tissues after treatment by lenti-pre-AMO-miR-195 and lenti-pre-AMO-miR-195 + lenti-pre-miR-195 for 8 weeks. *p < 0.05 versus NC, #p < 0.05 versus lenti-pre-AMO-miR-195, n = 6. J, Aβ42 levels in the hippocampus tissues from lenti-pre-AMO-miR-195 and lenti-pre-AMO-miR-195 + lenti-pre-miR-195 treatment for 8 weeks and from NC rats, measured by ELISA assay. *p < 0.05 versus NC, #p < 0.05 versus lenti-pre-AMO-miR-195, n = 5. K, Elevated Aβ42 levels in plasma of rats treated by lenti-pre-AMO-miR-195 detected by ELISA assay. *p < 0.05 versus NC, #p < 0.05 versus lenti-pre-AMO-miR-195, n = 5. L, M, The ratios of Aβ42/Aβ40 in the hippocampus tissues (L) and plasma (M) from lenti-pre-AMO-miR-195 and lenti-pre-AMO-miR-195 + lenti-pre-miR-195 treatment for 8 weeks and NC rats by ELISA assay, *p < 0.05 versus NC, #p < 0.05 versus lento-pre-AMO-miR-195, n = 5.
miR-195 mimics mitigate dementia phenotype induced by 2VO
The next question we asked ourselves was if miR-195 indeed plays a significant role in controlling dementia initiation and maintenance, and if miR-195 is downregulated in the 2VO dementia model, the overexpression of miR-195 should be able to prevent the dementia phenotype induced by 2VO. To test this hypothesis, lenti-pre-miR-195 was injected into the hippocampus of 2VO rats. Our data showed that lenti-pre-miR-195 reduced the prolonged latency to locate the platform in 2VO rats at day 1 (Fig. 7A; Q2: F(2,35) = 0.808, p = 0.464; Q3: F(2,35) = 3.947, p < 0.05; Q4: F(2,35) = 5.301, p < 0.05), significantly improving the memory ability, as indicated by shortened latency to the platform day by day, compared with 2VO age-matched rats transfected with NC (Fig. 7B; Day 1: F(4,69) = 3.736, 12.895, 7.070, 12.994, 4.656 for Day 1 to Day 5, respectively, p < 0.05). In addition, in probe trail, lenti-pre-miR-195 transfection increased the platform crossing times (Fig. 7C) and the percentage of swimming distance in the target quadrant relative to the total distance in 2VO rats (∼38%) compared with 2VO rats treated by NC (Fig. 7D,E; ∼22%).
Figure 7.
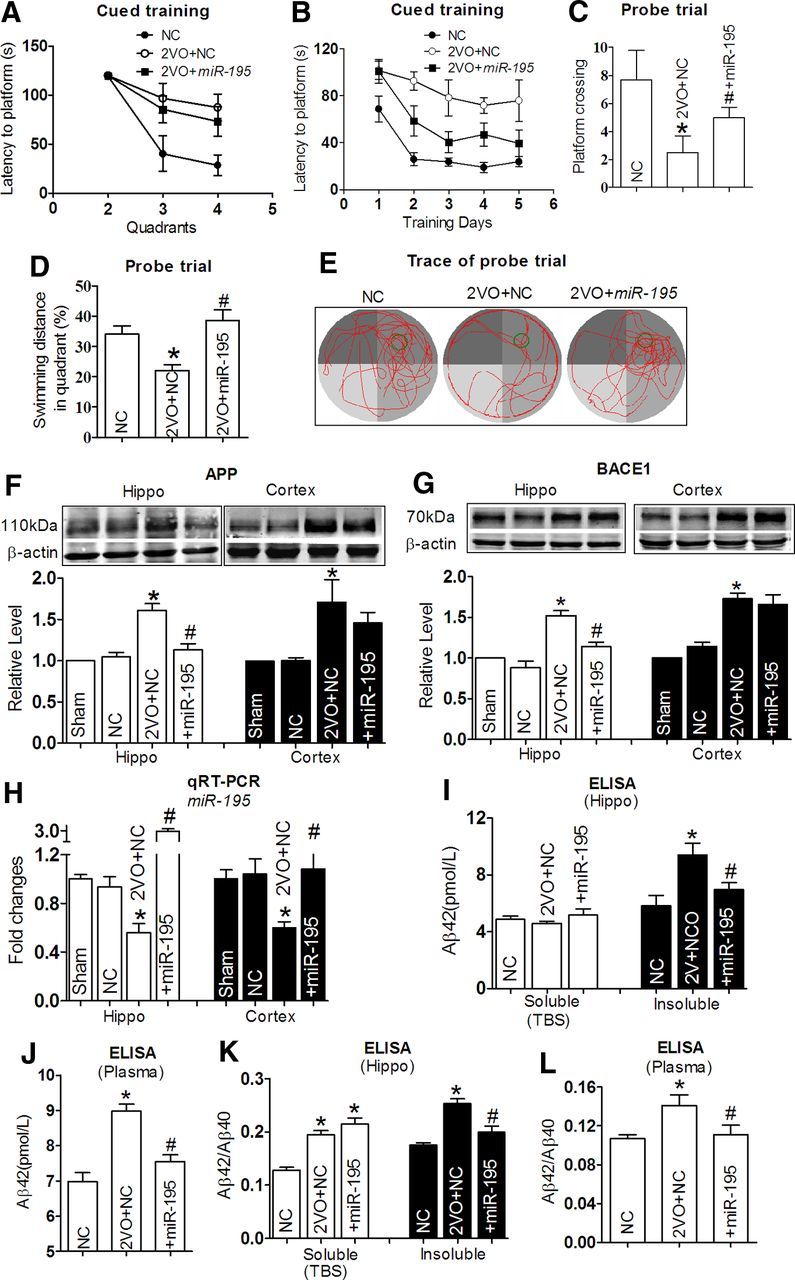
miR-195 attenuates learning and memory deficits in 2VO model. A, Comparison of averaged escape latency to find the platform from three nontarget quadrants at training day 1 after 2VO and 2VO + lenti-pre-miR-195 treatment for 8 weeks. n = 6. B, Mean daily latencies to escape from the start point to the hidden platform after 2VO and 2VO + lenti-pre-miR-195 treatment for 8 weeks, n = 6. C, Number of times crossing the target platform location during probe trial. *p < 0.05 versus NC, #p < 0.05 versus 2VO, n = 6. D, Percentage of swimming distance in the target quadrant relative to the total distance during probe trial. *p < 0.05 versus NC, #p < 0.05 versus 2VO, n = 6. E, Representative path tracings of the probe test on day 6 in the MWM test for each group. Edge-type swim tracing was recorded in 2VO rats, which was reversed by lenti-pre-miR-195. F, G, APP (F) and BACE1 (G) protein expression in the hippocampus and the cortex tissues in 2VO rats with or without lenti-pre-miR-195 treatment for 8 weeks. *p < 0.05 versus NC, #p < 0.05 versus 2VO, n = 5. H, Quantification of miR-195 in the hippocampus and cortex tissues of rats 2VO with or without lenti-pre-miR-195 treatment determined with qRT-PCR. *p < 0.05 versus NC, #p < 0.05 versus 2VO, n = 5. I, Aβ42 levels in hippocampus tissues from 2VO rats with or without lenti-pre-miR-195 treatment and NC rats by ELISA assay. *p < 0.05 versus NC, #p < 0.05 versus 2VO, n = 5. J, Aβ42 levels in plasma by ELISA assay. *p < 0.05 versus NC, #p < 0.05 versus 2VO, n = 5. K, L, The ratios of Aβ42/Aβ40 in hippocampus tissues (K) and plasma (L) were compared. *p < 0.05 versus NC, #p < 0.05 versus 2VO, n = 5.
As predicted, increased APP expression in both the hippocampus and the cortex of 2VO rats was prevented by lenti-pre-miR-195 transfection (Fig. 7F). Interestingly, miR-195 inhibited the increased APP and BACE1 expression in the hippocampus induced by 2VO, but did not affected their levels in the cortex (Fig. 7G). The relative higher expression of miR-195 in the hippocampus than in the cortex of rats after lenti-pre-miR-195 injection might explain the disparate results between APP and BACE1 expression (Fig. 7H). MiR-195 also significantly inhibited the increased insoluble Aβ42 level in the hippocampus (Fig. 7I; insoluble: 5.83 ± 0.36, 9.41 ± 0.41, 6.98 ± 0.23 pmol/L in NC, 2VO + NC, and 2VO + miR-195, respectively) and total Aβ42 level in plasma (Fig. 7J; 6.98 ± 0.12, 8.98 ± 0.09, 7.54 ± 0.10 pmol/L in NC, 2VO + NC, and 2VO + miR-195, respectively). Thereafter, we found that miR-195 also effectively mitigated the increased ratios of Aβ42/Aβ40 in both the hippocampus and plasma induced by 2VO (Fig. 7K,L).
Mechanisms for downregulation of miR-195 in dementia following 2VO
Having shown that downregulation of miR-195 played a pivotal role in controlling dementia pathology at least partially via regulating expression of APP and BACE1, we went on to elucidate potential molecular mechanisms underlying the deregulation of miR-195 in 2VO rats. Our computational analysis revealed multi-NFκB binding sites in the promoter domain of the miR-195 gene (Fig. 8A). Intriguingly, NFκB members have been found to contribute to several neurodegenerative disorders, such as AD and Parkinson's and Huntington's disease (Hunot et al., 1997; Kaltschmidt et al., 1997; Khoshnan et al., 2004), and to be activated under anoxia (Sirabella et al., 2009). We therefore examined the possibility of NFκB as a regulator of miR-195 transcription.
Figure 8.

NFκB regulates miR-195 cluster transcription. A, Schematic representation of the seven upstream region of the rat miR-195 cluster. Sequences between −2000 and −441 bp of the rat miR-195 cluster are aligned with the corresponding sequences of human miR-195 cluster. The conservative NFκB targeting sites are marked by a box. The primers for ChIP assay were underlined. B, ChIP analysis of in vivo NFκB binding to the promoter between −2000 and −1705 bp. ChIP assay was performed using hippocampus neuron. The anti-IgG antibody and H2O treatment were used as negative control. The anti-NFκB antibody was used to target specific immunoprecipitation. NFκB binding to these target sites activates miR-195 promoter activity. C, ChIP analysis of in vivo NFκB binding to the promoter between −642 and −441 bp. ChIP assay showed that NFκB binding to this target site did not activate miR-195 promoter activity. M1, M2: loading markers; input: positive control. D, E, Total and nuclear NFκB protein expression in the hippocampus (D) and the cortex (E) tissues of 2VO rats. *p < 0.05 versus Sham, n = 6. F, LPS inhibit the expression of miR-195 determined with qRT-PCR after miR-195 mimics transfection. *p < 0.05 versus NC, n = 5. G, H, Upregulation of APP (G) and BACE1 (H) protein expression induced by LPS, which was reversed by miR-195 mimics transfection. *p < 0.05 versus NC, #p < 0.05 versus miR-195, $p < 0.05 versus LPS, n = 5. Ctl, control.
We found that the promoter sequences of miR-195 are highly conserved between human and rat (Fig. 8A). More important was that there are seven optimal and conserved NFκB binding sites in the promoter region of the miR-195 gene (Fig. 8A). We then tested whether NFκB could directly bind to the promoter region of miR-195 using ChIP analysis. The data in Figure 8, B and C, suggest that NFκB is able to bind to the miR-195 promoter, and the binding site located in −2000 to −1708 bp upstream of the pre-miR-195 promoter. Next, we evaluated the effect of NFκB on miR-195 expression. As shown in Figure 8, D and E, the total protein level of NFκB did not change in either the hippocampus or the cortex, but it was significantly increased in the nuclear extracts as a proportion of total NFκB protein. This finding indicated that NFκB may negatively regulate miR-195 expression. In line with our prediction, LPS (an agonist of the p65 subunit of NFκB) significantly inhibited the expression of miR-195 in primary cultured hippocampus neurons (Fig. 8F). As expected, LPS significantly triggered upregulation of both APP and BACE1, an effect abolished by cotransfection with miR-195 (Fig. 8G,H). The results implied that actions of NFκB on APP and BACE1 were partially dependent on miR-195.
Discussion
Together, the present study displayed that downregulation of miR-195 mediated the formation of Aβ42 by upregulating the expression of both APP and BACE1, thereby increasing the susceptibility to dementia of rats following CBH by 2VO. Another finding is that NFκB negatively regulated the expression of miR-195. Therefore, our study revealed a novel insight into the molecular mechanisms of dementia at the miRNA level. Furthermore, our results suggest the possibility of miR-195 as an endogenous anti-dementia miRNA: downregulation of miR-195 can result in an increased vulnerability to dementia.
Consideration of the 2VO animal model
Senile dementia is a slow developmental process, which results not only from genetic background but also from multi-effectors. Since aggregation of Aβ (signed by senile plaques), a production of aberrant APP metabolism by BACE1, is considered as a causative factor for dementia, numerous studies focused on the molecular mechanisms of dementia triggered by the Aβ aggregation in transgenic mice. However, the predisposing factors of the Aβ aggregation are still poorly understood due to the lack of an ideal animal model that mimics the developmental process of dementia in clinic. There is a consensus that brain hypoxia is a pivotal inducer of dementia. However, acute cerebral infarction after stroke was not suitable to assess the cognitive function due to the severe dyskinesia. A moderate but persistent reduction in brain blood flow, also named chronic brain hypoxia, was reported to compromise memory processes and contribute to the development and progression of dementia (Farkas et al., 2007; Gorelick et al., 2011), which better reflects the status of patients suffering from dementia in clinic. Previous studies have documented that CBH generated by 2VO can provoke chronic brain hypoxia without motor dysfunction in rats (Sarti et al., 2002a), we therefore used a rat model of CBH by 2VO in the present study. Our data showed that 2VO for 8 weeks in rats not only induced CBH but also triggered spatial memory impairment without motor dysfunction. The pathophysiological characteristics of CBH induced by 2VO were further indicated by the downregulation of MAP2 and upregulation of GFAP. In addition, 2VO rats displayed spatial memory impairment: the failure to use the cues to learn to find goals in learning trial and the decreased swimming distance in target quadrant in the probe trial. These results demonstrated that CBH generated by 2VO for 8 weeks in rats could induce impairment of cognition, which is in line with previous reports (Sarti et al., 2002b; Kumaran et al., 2008). It is worth mentioning that, in the present study, we used SD rats but not Wistar rats to establish the 2VO animal model due to a greater mortality of Wistar rats after 2VO than SD rats, which have a relative larger circle of Willis. Basically, ∼33–37% rats were excluded from the experiment due to the loss of pupillary reflex, which was consistent with a previous report (Stevens et al., 2002).
2VO produces deposition of Aβ association with downregulation of miR-195
Several studies have reported that cerebral hypoperfusion induces dysfunction of metabolism including changes of glucose metabolism, ATPase activity, and the lactate concentration, as well as reduced dendritic arborization (Friedrich and Aszódi, 1991; Farkas et al., 2007). Here we observed that 2VO triggered the Aβ deposition, which was accompanied by upregulation of both APP and BACE1 proteins, which was consistent with previous reports (Bennett et al., 2000; Zhiyou et al., 2009). Cleavage of APP by BACE1 is the basis for Aβ42 formation, and Aβ42 accumulation is found in most dementias. Since Aβ is not only an initiator of senile plaques but also an inducer of hyperphosphorylated tau protein and neurotoxicity, its accumulation is thought to be an initial causative factor for dementia (Cole and Vassar, 2009). Thus, either preventing the deposition or promoting the clearance of Aβ may be a rational approach for the treatment of dementia patients (Palop and Mucke, 2010). In the present study, we found that 2VO or AMO-195 injection induced, while upregulation of miR-195 by lenti-pre-miR-195 transfection prevented, the increase of insoluble Aβ42 levels in the hippocampus of rats. In contrast, the soluble Aβ42 levels were not changed. A possible explanation for this observation is that since amyloid formation is a dynamic process, the size of the water-soluble pool will likely fluctuate. Here we are dealing with TBS-soluble Aβ42, which is considered as the Aβ42 secreted to the extracellular environment (Sakono and Zako, 2010). Hence, we speculated that the soluble Aβ42 remained unaltered because it was rapidly incorporated into the insoluble Aβ filaments form, but was not taken up by cells into intracellular pools (as indicated by the lack of appreciable change in the level of RIPA-soluble Aβ42 that was observed; data not shown here). It is worthy of mentioning that the increased ratio of Aβ42/Aβ40 is considered more crucial than the absolute amount of peptides for induction of neurotoxic conformation (Kuperstein et al., 2010), and a higher ratio of Aβ42/Aβ40 was demonstrated to be associated with higher BACE1 activities (Yin et al., 2007). Here we found that miR-195 effectively mitigated the increased ratios of Aβ42/Aβ40 in both the hippocampus and plasma of rats induced by either AMO-195 or 2VO. The results strongly supported that downregulation of miR-195 could induce cognitive impairment associated with abnormal APP processing.
Though the increased expression of BACE1 and APP proteins and their activities were hallmarks in both AD and VaD patients, the mRNA level of BACE1 was found unaltered, while that of APP was reduced in the AD and/or aging brains (Harrison et al., 1994; Preece et al., 2003). In contrast, we found, in the present study, that the level of APP mRNA was unchanged whereas BACE1 mRNA was decreased. These results indicated that post-transcriptional regulation of BACE1 and APP expressions might play a pivotal role under different disease states. A number of putative transcription factor binding sites have been identified in the promoter regions of the BACE1 and APP genes such as NFκB, Sp1, HNF-3β, YY1, MZF1, and GATA in the BACE1 promoter (Rosner et al., 2006), and thyroid hormone (T3), TGF-β1, NFκB, and Sp1 in the APP promoter (Amara et al., 1999; Belakavadi et al., 2011). Currently, microRNAs have been commonly considered as modulators of protein expression at the post-transcriptional level, modulating the development, function, and pathogenesis in multiple types of diseases. Our findings here disclosed that miR-195, which was able to regulate the expression of both APP and BACE1 genes, was downregulated in both the hippocampus and the cortex of 2VO rats and in the blood of both 2VO rats and patients who were diagnosed with VaD as well, suggesting that downregulated miR-195 might play a role in the initiation and maintenance of dementia induced by CBH. Of note, a recent study reported that, under physiological conditions, NFκB triggered a repressive effect on Aβ production that contributes to maintaining its homeostasis, while participating in a degenerative cycle in which Aβ would feed its own production under pathological conditions (Chami et al., 2012). Here we found that NFκB also regulated the expression of APP and BACE1 indirectly through regulating miR-195 along with its direct action on the APP and BCAE1 transcription (Buggia-Prevot et al., 2008), implying that effect of NFκB on APP and BACE1 were partially dependent on miR-195 following CBH. In addition, why the BACE1 mRNA level was decreased in rats following 2VO is unclear, and this needs to be studied further.
MiRNA-195 protects against dementia via its anti-amyloidogenic effect
Our study provided strong evidence that downregulation of miR-195 in both the hippocampus and the cortex by lenti-pre-AMO-miR-195 injection could produce susceptibility to dementia due to upregulation of APP and BACE1. In contrast, lenti-pre-miR-195 injection into the hippocampus improved the memory impairment induced by 2VO, which was accompanied by the decreased expression of both APP and BACE1, and the reduced Aβ depositions as well, though the lost learning ability was not improved. The mechanisms for these observations need to be studied further, yet, the improvement of reduced memory in 2VO rats after lenti-pre-miR-195 injection suggests that upregulation of miR-195 is a way to prevent dementia associated with CBH.
It is worth mentioning that the miR-195 family harbors many other members including miR-15abc/16/16abc/322/424/497/1907 (http://www.targetscan.org), and previous studies have reported that there are many other miRNAs that can also regulate APP or BACE1 expression. Whether these miRNAs also exert their functions under CBH conditions is unclear. However, it is intriguing that miR-195, miR-16, and miR-15b seem to independently exert their functions under different disease models, though they are grouped into the same miRNA family. For example, in an age-associated AD animal model (SAMP8), the miR-16 level was significantly decreased with only minor a change of miR-195 level (Liu et al., 2012). In human AD brain, both miR-15b and miR-16 levels were downregulated in white matter with no change of miR-195, while the miR-195 level was decreased in gray matter with no changes of miR-15b and miR-16 expression (Wang et al., 2011). In the present study, miR-195 was found decreased whereas miR-16 and miR-15b remained unaltered in the CBH rat model. These results together suggested that miRNAs involved in the same family cluster do not necessarily play a role at the same time and exert the same function.
Limitations and prospects
In the present study, though we have demonstrated the direct action of miR-195 on the expression of APP and BACE1 using both in vitro and in vivo models, and the promise of miR-195 to prevent dementia induced by 2VO, we cannot exclude other possible mechanisms. Multidisciplinary research has explored various approaches for preventing and/or delaying the onset of late-life dementia (Larson, 2010). There is a great interest in novel therapeutic approaches to treat dementia, one of which in early development is gene therapy (Roshan et al., 2009). Our findings suggest that miR-195 might be a candidate for dementia-targeting gene therapy in the future. However, it should be noted that the data from this study were primarily based upon animal model investigation; caution must be taken when extrapolating the results to humans.
Footnotes
This work was supported by Natural Science Foundation of China (81271207, 81070882, and 81000499) and Creative Research Groups of the National Natural Science Foundation of China (81121003). We thank Dr. Hai-Yan Zhang, from Shanghai Institute of Materia Medica (China), for her suggestion for the discussion and technical guidance; Dr. Fang Xie, from Harbin Medical University, for her excellent job of drawing; Dr. Jeff Hatcher, from the University of Central Florida College of Medicine, for his kindly English edition.
The authors declare no competing financial interests.
References
- Amara FM, Junaid A, Clough RR, Liang B. TGF-beta(1), regulation of alzheimer amyloid precursor protein mRNA expression in a normal human astrocyte cell line: mRNA stabilization. Brain Res Mol Brain Res. 1999;71:42–49. doi: 10.1016/s0169-328x(99)00158-8. [DOI] [PubMed] [Google Scholar]
- Bales KR, Liu F, Wu S, Lin S, Koger D, DeLong C, Hansen JC, Sullivan PM, Paul SM. Human APOE isoform-dependent effects on brain beta-amyloid levels in PDAPP transgenic mice. J Neurosci. 2009;29:6771–6779. doi: 10.1523/JNEUROSCI.0887-09.2009. [DOI] [PMC free article] [PubMed] [Google Scholar]
- Belakavadi M, Dell J, Grover GJ, Fondell JD. Thyroid hormone suppression of beta-amyloid precursor protein gene expression in the brain involves multiple epigenetic regulatory events. Mol Cell Endocrinol. 2011;339:72–80. doi: 10.1016/j.mce.2011.03.016. [DOI] [PubMed] [Google Scholar]
- Bennett SA, Pappas BA, Stevens WD, Davidson CM, Fortin T, Chen J. Cleavage of amyloid precursor protein elicited by chronic cerebral hypoperfusion. Neurobiol Aging. 2000;21:207–214. doi: 10.1016/s0197-4580(00)00131-7. [DOI] [PubMed] [Google Scholar]
- Boissonneault V, Plante I, Rivest S, Provost P. MicroRNA-298 and microRNA-328 regulate expression of mouse beta-amyloid precursor protein-converting enzyme 1. J Biol Chem. 2009;284:1971–1981. doi: 10.1074/jbc.M807530200. [DOI] [PMC free article] [PubMed] [Google Scholar]
- Buggia-Prevot V, Sevalle J, Rossner S, Checler F. NFkappaB-dependent control of BACE1 promoter transactivation by Abeta42. J Biol Chem. 2008;283:10037–10047. doi: 10.1074/jbc.M706579200. [DOI] [PubMed] [Google Scholar]
- Cechetti F, Pagnussat AS, Worm PV, Elsner VR, Ben J, da Costa MS, Mestriner R, Weis SN, Netto CA. Chronic brain hypoperfusion causes early glial activation and neuronal death, and subsequent long-term memory impairment. Brain Res Bull. 2012;87:109–116. doi: 10.1016/j.brainresbull.2011.10.006. [DOI] [PubMed] [Google Scholar]
- Chami L, Buggia-Prévot V, Duplan E, Delprete D, Chami M, Peyron JF, Checler F. Nuclear factor-kappaB regulates betaAPP and beta- and gamma-secretases differently at physiological and supraphysiological Abeta concentrations. J Biol Chem. 2012;287:24573–24584. doi: 10.1074/jbc.M111.333054. [DOI] [PMC free article] [PubMed] [Google Scholar]
- Choi WY, Giraldez AJ, Schier AF. Target protectors reveal dampening and balancing of Nodal agonist and antagonist by miR-430. Science. 2007;318:271–274. doi: 10.1126/science.1147535. [DOI] [PubMed] [Google Scholar]
- Cole SL, Vassar R. Linking vascular disorders and Alzheimer's disease: potential involvement of BACE1. Neurobiol Aging. 2009;30:1535–1544. doi: 10.1016/j.neurobiolaging.2007.12.012. [DOI] [PMC free article] [PubMed] [Google Scholar]
- Esler WP, Wolfe MS. A portrait of Alzheimer secretases—new features and familiar faces. Science. 2001;293:1449–1454. doi: 10.1126/science.1064638. [DOI] [PubMed] [Google Scholar]
- Farkas E, Luiten PG, Bari F. Permanent, bilateral common carotid artery occlusion in the rat: a model for chronic cerebral hypoperfusion-related neurodegenerative diseases. Brain Res Rev. 2007;54:162–180. doi: 10.1016/j.brainresrev.2007.01.003. [DOI] [PubMed] [Google Scholar]
- Finnerty JR, Wang WX, Hébert SS, Wilfred BR, Mao G, Nelson PT. The miR-15/107 group of microRNA genes: evolutionary biology, cellular functions, and roles in human diseases. J Mol Biol. 2010;402:491–509. doi: 10.1016/j.jmb.2010.07.051. [DOI] [PMC free article] [PubMed] [Google Scholar]
- Friedrich P, Aszódi A. MAP2: a sensitive cross-linker and adjustable spacer in dendritic architecture. FEBS Lett. 1991;295:5–9. doi: 10.1016/0014-5793(91)81371-e. [DOI] [PubMed] [Google Scholar]
- Gorelick PB, Scuteri A, Black SE, Decarli C, Greenberg SM, Iadecola C, Launer LJ, Laurent S, Lopez OL, Nyenhuis D, Petersen RC, Schneider JA, Tzourio C, Arnett DK, Bennett DA, Chui HC, Higashida RT, Lindquist R, Nilsson PM, Roman GC, et al. Vascular contributions to cognitive impairment and dementia: a statement for healthcare professionals from the American Heart Association/American Stroke Association. Stroke. 2011;42:2672–2713. doi: 10.1161/STR.0b013e3182299496. [DOI] [PMC free article] [PubMed] [Google Scholar]
- Guo AY, Sun J, Jia P, Zhao Z. A novel microRNA and transcription factor mediated regulatory network in schizophrenia. BMC Syst Biol. 2010;4:10. doi: 10.1186/1752-0509-4-10. [DOI] [PMC free article] [PubMed] [Google Scholar]
- Harrison PJ, Barton AJ, Procter AW, Bowen DM, Pearson RC. The effects of Alzheimer's disease, other dementias, and premortem course on beta-amyloid precursor protein messenger RNA in frontal cortex. J Neurochem. 1994;62:635–644. doi: 10.1046/j.1471-4159.1994.62020635.x. [DOI] [PubMed] [Google Scholar]
- Hébert SS, Horré K, Nicolaï L, Papadopoulou AS, Mandemakers W, Silahtaroglu AN, Kauppinen S, Delacourte A, De Strooper B. Loss of microRNA cluster miR-29a/b-1 in sporadic Alzheimer's disease correlates with increased BACE1/beta-secretase expression. Proc Natl Acad Sci U S A. 2008;105:6415–6420. doi: 10.1073/pnas.0710263105. [DOI] [PMC free article] [PubMed] [Google Scholar]
- Hébert SS, Horré K, Nicolaï L, Bergmans B, Papadopoulou AS, Delacourte A, De Strooper B. MicroRNA regulation of Alzheimer's amyloid precursor protein expression. Neurobiol Dis. 2009;33:422–428. doi: 10.1016/j.nbd.2008.11.009. [DOI] [PubMed] [Google Scholar]
- Hunot S, Brugg B, Ricard D, Michel PP, Muriel MP, Ruberg M, Faucheux BA, Agid Y, Hirsch EC. Nuclear translocation of NF-kappaB is increased in dopaminergic neurons of patients with parkinson disease. Proc Natl Acad Sci U S A. 1997;94:7531–7536. doi: 10.1073/pnas.94.14.7531. [DOI] [PMC free article] [PubMed] [Google Scholar]
- Jacobsen KT, Iverfeldt K. Amyloid precursor protein and its homologues: a family of proteolysis-dependent receptors. Cell Mol Life Sci. 2009;66:2299–2318. doi: 10.1007/s00018-009-0020-8. [DOI] [PMC free article] [PubMed] [Google Scholar]
- Kaltschmidt B, Uherek M, Volk B, Baeuerle PA, Kaltschmidt C. Transcription factor NF-kappaB is activated in primary neurons by amyloid beta peptides and in neurons surrounding early plaques from patients with Alzheimer disease. Proc Natl Acad Sci U S A. 1997;94:2642–2647. doi: 10.1073/pnas.94.6.2642. [DOI] [PMC free article] [PubMed] [Google Scholar]
- Khoshnan A, Ko J, Watkin EE, Paige LA, Reinhart PH, Patterson PH. Activation of the IkappaB kinase complex and nuclear factor-kappaB contributes to mutant huntingtin neurotoxicity. J Neurosci. 2004;24:7999–8008. doi: 10.1523/JNEUROSCI.2675-04.2004. [DOI] [PMC free article] [PubMed] [Google Scholar]
- Kitaguchi H, Tomimoto H, Ihara M, Shibata M, Uemura K, Kalaria RN, Kihara T, Asada-Utsugi M, Kinoshita A, Takahashi R. Chronic cerebral hypoperfusion accelerates amyloid beta deposition in APPSwInd transgenic mice. Brain Res. 2009;1294:202–210. doi: 10.1016/j.brainres.2009.07.078. [DOI] [PubMed] [Google Scholar]
- Kumaran D, Udayabanu M, Kumar M, Aneja R, Katyal A. Involvement of angiotensin converting enzyme in cerebral hypoperfusion induced anterograde memory impairment and cholinergic dysfunction in rats. Neuroscience. 2008;155:626–639. doi: 10.1016/j.neuroscience.2008.06.023. [DOI] [PubMed] [Google Scholar]
- Kuperstein I, Broersen K, Benilova I, Rozenski J, Jonckheere W, Debulpaep M, Vandersteen A, Segers-Nolten I, Van Der Werf K, Subramaniam V, Braeken D, Callewaert G, Bartic C, D'Hooge R, Martins IC, Rousseau F, Schymkowitz J, De Strooper B. Neurotoxicity of Alzheimer's disease Abeta peptides is induced by small changes in the Abeta42 to Abeta40 ratio. EMBO J. 2010;29:3408–3420. doi: 10.1038/emboj.2010.211. [DOI] [PMC free article] [PubMed] [Google Scholar]
- Larson EB. Prospects for delaying the rising tide of worldwide, late-life dementias. Int Psychogeriatr. 2010;8:1196–1202. doi: 10.1017/S1041610210001080. [DOI] [PMC free article] [PubMed] [Google Scholar]
- Lazarov O, Robinson J, Tang YP, Hairston IS, Korade-Mirnics Z, Lee VM, Hersh LB, Sapolsky RM, Mirnics K, Sisodia SS. Environmental enrichment reduces Abeta levels and amyloid deposition in transgenic mice. Cell. 2005;120:701–713. doi: 10.1016/j.cell.2005.01.015. [DOI] [PubMed] [Google Scholar]
- Liu W, Liu C, Zhu J, Shu P, Yin B, Gong Y, Qiang B, Yuan J, Peng X. MicroRNA-16 targets amyloid precursor protein to potentially modulate Alzheimer's-associated pathogenesis in SAMP8 mice. Neurobiol Aging. 2012;33:522–534. doi: 10.1016/j.neurobiolaging.2010.04.034. [DOI] [PubMed] [Google Scholar]
- Long JM, Lahiri DK. MicroRNA-101 downregulates Alzheimer's amyloid-beta precursor protein levels in human cell cultures and is differentially expressed. Biochem Biophys Res Commun. 2011;404:889–895. doi: 10.1016/j.bbrc.2010.12.053. [DOI] [PMC free article] [PubMed] [Google Scholar]
- Meilandt WJ, Cisse M, Ho K, Wu T, Esposito LA, Scearce-Levie K, Cheng IH, Yu GQ, Mucke L. Neprilysin overexpression inhibits plaque formation but fails to reduce pathogenic Abeta oligomers and associated cognitive deficits in human amyloid precursor protein transgenic mice. J Neurosci. 2009;29:1977–1986. doi: 10.1523/JNEUROSCI.2984-08.2009. [DOI] [PMC free article] [PubMed] [Google Scholar]
- Mellios N, Huang HS, Grigorenko A, Rogaev E, Akbarian S. A set of differentially expressed miRNAs, including miR-30a-5p, act as post-transcriptional inhibitors of BDNF in prefrontal cortex. Hum Mol Genet. 2008;17:3030–3042. doi: 10.1093/hmg/ddn201. [DOI] [PMC free article] [PubMed] [Google Scholar]
- Palop JJ, Mucke L. Amyloid-beta-induced neuronal dysfunction in Alzheimer's disease: from synapses toward neural networks. Nat Neurosci. 2010;13:812–818. doi: 10.1038/nn.2583. [DOI] [PMC free article] [PubMed] [Google Scholar]
- Preece P, Virley DJ, Costandi M, Coombes R, Moss SJ, Mudge AW, Jazin E, Cairns NJ. Beta-secretase (BACE) and GSK-3 mRNA levels in Alzheimer's disease. Brain Res Mol Brain Res. 2003;116:155–158. doi: 10.1016/s0169-328x(03)00233-x. [DOI] [PubMed] [Google Scholar]
- Paxinos G, Watson C. The rat brain in stereotaxic coordinates. Ed 3. San Diego: Academic; 1997. [DOI] [PubMed] [Google Scholar]
- Roshan R, Ghosh T, Scaria V, Pillai B. MicroRNAs: novel therapeutic targets in neurodegenerative diseases. Drug Discov Today. 2009;14:1123–1129. doi: 10.1016/j.drudis.2009.09.009. [DOI] [PubMed] [Google Scholar]
- Rossner S, Sastre M, Bourne K, Lichtenthaler SF. Transcriptional and translational regulation of BACE1 expression—Implications for Alzheimer's disease. Prog Neurobiol. 2006;79:95–111. doi: 10.1016/j.pneurobio.2006.06.001. [DOI] [PubMed] [Google Scholar]
- Ruitenberg A, den Heijer T, Bakker SL, van Swieten JC, Koudstaal PJ, Hofman A, Breteler MM. Cerebral hypoperfusion and clinical onset of dementia: the Rotterdam Study. Ann Neurol. 2005;57:789–794. doi: 10.1002/ana.20493. [DOI] [PubMed] [Google Scholar]
- Sakono M, Zako T. Amyloid oligomers: formation and toxicity of Abeta oligomers. FEBS J. 2010;277:1348–1358. doi: 10.1111/j.1742-4658.2010.07568.x. [DOI] [PubMed] [Google Scholar]
- Sarazin M, de Souza LC, Lehéricy S, Dubois B. Clinical and Research Diagnostic Criteria for Alzheimer's Disease. Neuroimaging Clin N Am. 2012;22:23–32. viii. doi: 10.1016/j.nic.2011.11.004. [DOI] [PubMed] [Google Scholar]
- Sarti C, Pantoni L, Bartolini L, Inzitari D. Cognitive impairment and chronic cerebral hypoperfusion: what can be learned from experimental models. J Neurol Sci. 2002a;203–204:263–266. doi: 10.1016/s0022-510x(02)00302-7. [DOI] [PubMed] [Google Scholar]
- Sarti C, Pantoni L, Bartolini L, Inzitari D. Persistent impairment of gait performances and working memory after bilateral common carotid artery occlusion in the adult Wistar rat. Behav Brain Res. 2002b;136:13–20. doi: 10.1016/s0166-4328(02)00090-6. [DOI] [PubMed] [Google Scholar]
- Sirabella R, Secondo A, Pannaccione A, Scorziello A, Valsecchi V, Adornetto A, Bilo L, Di Renzo G, Annunziato L. Anoxia-induced NF-kappaB-dependent upregulation of NCX1 contributes to Ca2+ refilling into endoplasmic reticulum in cortical neurons. Stroke. 2009;40:922–929. doi: 10.1161/STROKEAHA.108.531962. [DOI] [PubMed] [Google Scholar]
- Smith P, Al Hashimi A, Girard J, Delay C, Hébert SS. In vivo regulation of amyloid precursor protein neuronal splicing by microRNAs. J Neurochem. 2011;116:240–247. doi: 10.1111/j.1471-4159.2010.07097.x. [DOI] [PubMed] [Google Scholar]
- Soon PS, Tacon LJ, Gill AJ, Bambach CP, Sywak MS, Campbell PR, Yeh MW, Wong SG, Clifton-Bligh RJ, Robinson BG, Sidhu SB. miR-195 and miR-483–5p identified as predictors of poor prognosis in adrenocortical cancer. Clin Cancer Res. 2009;15:7684–7692. doi: 10.1158/1078-0432.CCR-09-1587. [DOI] [PubMed] [Google Scholar]
- Stevens WD, Fortin T, Pappas BA. Retinal and optic nerve degeneration after chronic carotid ligation: time course and role of light exposure. Stroke. 2002;33:1107–1112. doi: 10.1161/01.str.0000014204.05597.0c. [DOI] [PubMed] [Google Scholar]
- Ujifuku K, Mitsutake N, Takakura S, Matsuse M, Saenko V, Suzuki K, Hayashi K, Matsuo T, Kamada K, Nagata I, Yamashita S. miR-195, miR-455–3p and miR-10a(*) are implicated in acquired temozolomide resistance in glioblastoma multiforme cells. Cancer Lett. 2010;296:241–248. doi: 10.1016/j.canlet.2010.04.013. [DOI] [PubMed] [Google Scholar]
- Vorhees CV, Williams MT. Morris water maze: procedures for assessing spatial and related forms of learning and memory. Nat Protocols. 2006;1:848–858. doi: 10.1038/nprot.2006.116. [DOI] [PMC free article] [PubMed] [Google Scholar]
- Wang WX, Rajeev BW, Stromberg AJ, Ren N, Tang G, Huang Q, Rigoutsos I, Nelson PT. The expression of microRNA miR-107 decreases early in Alzheimer's disease and may accelerate disease progression through regulation of beta-site amyloid precursor protein-cleaving enzyme 1. J Neurosci. 2008;28:1213–1223. doi: 10.1523/JNEUROSCI.5065-07.2008. [DOI] [PMC free article] [PubMed] [Google Scholar]
- Wang WX, Huang Q, Hu Y, Stromberg AJ, Nelson PT. Patterns of microRNA expression in normal and early Alzheimer's disease human temporal cortex: white matter versus gray matter. Acta Neuropathol. 2011;121:193–205. doi: 10.1007/s00401-010-0756-0. [DOI] [PMC free article] [PubMed] [Google Scholar]
- Xu T, Zhu Y, Xiong Y, Ge YY, Yun JP, Zhuang SM. MicroRNA-195 suppresses tumorigenicity and regulates G1/S transition of human hepatocellular carcinoma cells. Hepatology. 2009;50:113–121. doi: 10.1002/hep.22919. [DOI] [PubMed] [Google Scholar]
- Yin YI, Bassit B, Zhu L, Yang X, Wang C, Li YM. {gamma}-Secretase Substrate Concentration Modulates the Abeta42/Abeta40 Ratio: implications for Alzheimer disease. J Biol Chem. 2007;282:23639–23644. doi: 10.1074/jbc.M704601200. [DOI] [PubMed] [Google Scholar]
- Zhiyou C, Yong Y, Shanquan S, Jun Z, Liangguo H, Ling Y, Jieying L. Upregulation of BACE1 and beta-amyloid protein mediated by chronic cerebral hypoperfusion contributes to cognitive impairment and pathogenesis of Alzheimer's disease. Neurochem Res. 2009;34:1226–1235. doi: 10.1007/s11064-008-9899-y. [DOI] [PubMed] [Google Scholar]
- Zong Y, Wang H, Dong W, Quan X, Zhu H, Xu Y, Huang L, Ma C, Qin C. miR-29c regulates BACE1 protein expression. Brain Res. 2011;1395:108–115. doi: 10.1016/j.brainres.2011.04.035. [DOI] [PubMed] [Google Scholar]