

Abstract
During non-rapid eye movement (NREM) sleep, a global decrease in synaptic strength associated with slow waves (SWs) would enhance signal-to-noise ratio of neural responses during subsequent wakefulness. To test this prediction, 32 human volunteers were trained to a coarse orientation discrimination task, in either the morning or evening. They were retested after 8 h of wakefulness or sleep, respectively. Performance was enhanced only after a night of sleep, in the absence of any change in the abundance of NREM SWs but in proportion to the number of SWs “initiated” in lateral occipital areas during posttraining NREM sleep. The sources of these waves overlapped with the lateral occipital complex, in which responses to the learned stimulus, as assessed by fMRI, were selectively increased the next morning. This response enhancement was proportional to rapid eye movement (REM) sleep duration. These results provide an example of local sleep in which local initiation of SWs during NREM sleep predicts later skill improvement and foreshadows locally enhanced neural signals the next day. In addition, REM sleep also promotes local learning-dependent activity, possibly by promoting synaptic plasticity.
Introduction
Slow waves (SWs) represent a paramount feature of non-rapid eye movement (NREM) sleep. They occur in close temporal relationship with fluctuations in neuronal membrane potential, which alternates at low frequency between depolarized levels during which neurons fire intensely (“up” state) and a hyperpolarized state during which firing rate is reduced (“down”) (Steriade and McCarley, 2005). Transitions between up and down states occur synchronously in large neuronal populations and result in the alternation of “on” and “off” states (Vyazovskiy et al., 2009) or activated and silent states (Volgushev et al., 2006).
Slow wave activity (SWA; the EEG power between 0.75 and 4 Hz), as well as the slope of SWs have been proposed as markers of neuronal synchronization, which reveal changes in synaptic efficacy across the sleep/wake cycle (Esser et al., 2007). They increase with the duration of the preceding wake and decrease during NREM sleep (Riedner et al., 2007; Vyazovskiy et al., 2009). Likewise, in rodents, synaptic efficacy assessed by evoked responses in vivo (Vyazovskiy et al., 2008) or miniature EPSCs (mEPSCs) from cortex slices (Liu et al., 2010) increases after waking and decreases after sleep. Also, molecular markers are consistent with synaptic potentiation of glutamatergic neurotransmission during wakefulness and its depression during sleep (Vyazovskiy et al., 2008). These results are currently framed in a hypothesis assuming a net synaptic potentiation during wakefulness and a downscaling of synaptic strength during NREM sleep (Tononi and Cirelli, 2006).
This hypothesis makes three predictions about the influence of NREM sleep on memory. First, NREM sleep is locally modulated by the experience acquired during preceding wakefulness. This prediction is supported by the effects of local interventions (Huber et al., 2007, 2008). However, its influence on learning has been so far tested using a visuomotor task (Huber et al., 2004) that involves large-scale brain circuits (Krakauer et al., 2004), making it difficult to assess local learning. In contrast, visual perceptual learning results from local plasticity in relevant neural populations of the visual system (Schwartz et al., 2002; Zhang et al., 2010) and allows to test the influence of local learning on subsequent sleep. We used a coarse orientation discrimination (COD) task to assess interactions between local learning and NREM sleep changes. Second, the hypothesis assumes that synaptic downscaling during NREM sleep would increase signal-to-noise ratio (SNR) in the relevant brain circuits the following day. Although, at the behavioral level, NREM sleep was associated with enhanced (Huber et al., 2004) and less variable (Hill et al., 2008) performance, this prediction has never been directly tested in terms of local brain activity. Using fMRI, we assessed whether neural responses to the learned task increased above noise level after a night of sleep. Finally, the hypothesis states that “the homeostatic regulation of SWA is tied to the amount of synaptic potentiation that has occurred during previous wakefulness” (Tononi and Cirelli, 2006). We show that the site of initiation of SWs during posttraining NREM sleep is another parameter that relates to local learning.
Materials and Methods
Ethics statement.
The study was approved by the Ethics Committee of the Academic Hospital and Faculty of Medicine of the University of Liège (Liège, Belgium).
Participants.
Thirty-two young healthy volunteers participated to this study (18–30 years old, 16 males). They were recruited through advertisement on the university intranet. The absence of medical, traumatic, psychiatric, or sleep disorders was established by a semistructured interview. None complained of excessive daytime sleepiness as assessed by the Epworth Sleepiness Scale (Johns, 1991), nor of sleep disturbances as determined by the Pittsburgh Sleep Quality Index Questionnaire (Buysse et al., 1989). All participants had normal scores on the 21-item Beck Anxiety Inventory and the 21-item Beck Depression Inventory II (Beck et al., 1988). They were right-handed as indicated by the Edinburgh Inventory (Oldfield, 1971). Extreme chronotypes according to the Horne and Östberg morningness–eveningness questionnaire (Horne and Ostberg, 1976) and Munich Chronotype Questionnaire (Roenneberg et al., 2003) were excluded. They were non-smokers and moderate caffeine (≤ 2 U caffeine/d) and alcohol (≤ 2 U alcohol/week) consumers. None were on medication. No caffeine was allowed during the experiment.
Design overview.
Volunteers were trained to perform a COD task in which they had to discriminate the orientation of orthogonal gratings displayed peripherally and occluded by increasing levels of noise (decreasing SNR; Fig. 1A,B). Previous experiments have shown that nocturnal sleep enhances this perceptual skill (Matarazzo et al., 2008). Volunteers were divided into two groups, depending on whether initial training took place in the morning or in the evening. Volunteers were retested for behavioral performance after a period of wakefulness or sleep, respectively (Fig. 1C). fMRI measurements assessed the responses to learned and control stimuli during three testing sessions: at baseline (before training), during immediate testing (right after training), and during a delayed testing session (Fig. 1C).
Figure 1.

Protocol. A, Stimuli. Top, QTOT, One of the two possible trained stimuli (112.5°, 5° eccentricity in the bottom right quadrant) is displayed at 90% SNR. Bottom left, QUOT, A 22.5° orientation stimulus is displayed in the left bottom quadrant at 90% SNR. Bottom right, QTOU, A 157.5° orientation stimulus is displayed in the bottom right quadrant at 90% SNR. B, Time course of a trial (30% SNR). Note the fixation cross and the answer prompt (“Left or Right?”). C, Experimental design. Top row, Sleep group; bottom row, wake group. IT, Initial training; Tr, training session; Te, testing session.
Task description.
The task was coded using MATLAB 7.1 (MathWorks), with Cogent 2000 (version 1.25; http://www.vislab.ucl.ac.uk/cogent.php). The stimuli were generated by a Dell workstation (Dell Computer Company) and were projected on an MRI-compatible screen via a Sanyo projector, with a display area covering 10° of the volunteers' visual field. Stimuli were presented with maximum contrast, mean luminance of 45 cd/m2, and a maximum illuminance of 50 lux at 90 cm, at a 1024 × 768 pixels resolution and 50 Hz refresh rate.
Volunteers were instructed to discriminate the orientation of a sinusoidal grating (2° cycles/grating, 2° in diameter) placed at 5° eccentricity in the lower visual quadrant (Fig. 1A). The phases of the gratings were randomized across trials to ensure that participants discriminated orientation instead of local luminance cues. The stimuli were embedded in variable background sinusoidal noise covering the entire screen. A central cross was always presented to ensure visual fixation, as assessed by the infrared eye-tracking system. Each trial consisted of a 150 ms presentation of a grating embedded in background noise, followed by an answer prompt embedded in different background noise. Volunteers had 1250 ms to give their answer via an MRI-compatible keypad held in their right hand (Fig. 1B).
Two versions of the COD task were used for this study. One version aimed at inducing perceptual learning and was used in the “training” session. It was also briefly used during the “familiarization” session. During these sessions, only two orthogonal orientations were presented (22.5° and 112.5° from the horizon, which were referred to as “right” and “left” orientations for the volunteers) in the bottom right quadrant (Fig. 1A, top). Noise level was adapted to individual performance after a 4/1 transformed up–down staircase procedure (Wetherill and Levitt, 1965) and matching the luminance distribution of the sinusoidal grating (sinusoidal noise). The initial noise level was set at 10%, corresponding to an SNR of 0.9. For a given SNR X, (1 − X) × 100% grating pixels were replaced by the noise pattern (e.g., for the 0.9 SNR, 10% of the grating pixels were occluded by the noise pattern). After four consecutive correct answers, the current SNR was reduced by 6%, whereas it was increased by 6% in case of a single wrong answer. No feedback was given. The SNR at the beginning of a given block was equal to the SNR achieved at the end of the preceding block.
Another version of the task was used during “testing” sessions, to assess learning-related changes in regional brain responses. In this version, three trial types were presented. In the first trial type, stimuli were identical to those described in the training session and are referred to as “trained orientation and quadrant” and thus named QTOT (quadrant trained, orientation trained). The second trial type consisted of stimuli displayed in the bottom right quadrant but at a different orientation: a 45° shift was applied to learning stimuli resulting in 67.5° or 157.5° orientations [QTOU (quadrant trained, orientation untrained); Fig. 1A, bottom right]. The third trial type consisted of stimuli displayed at the learned orientation (22.5° and 112.5°) but in the bottom left quadrant [QUOT (quadrant untrained, orientation trained); Fig. 1A, bottom left]. Stimulus orientation and position was randomly varied across blocks. SNR were adapted to the individual SNR achieved at the end of the familiarization session.
In addition, for testing sessions, two categories of stimuli were used, characterized by their low or high SNR. These SNRs were equal to the individual SNR achieved at the end of the familiarization session, decreased or augmented by 10%. For instance, a final SNR of 0.35 in the familiarization session would result in testing SNR values of 0.25 and 0.45 in the test sessions. This method allowed us to present the volunteers with two sets of SNR values; low SNR values [high noise (HN)] are consistently harder to discern than higher SNR values [low noise (LN)]. Testing sessions lasted for ∼20 min and comprised 90 blocks of eight trials, equally divided in 30 blocks per type of stimulus.
Volunteers were always informed of which type of block they were about to begin, as well as whether SNR would be modulated (staircase during training or two fixed levels during testing). In both cases, pauses between blocks randomly varied from 15 to 35 s.
Experimental design.
Experimental design is illustrated on Figure 1C. For 7 d before the beginning of the first scanning session, volunteers were instructed to follow strict sleeping schedules with no daytime naps. Their sleep/wake cycle was assessed by sleep diaries and actigraphic recordings (Actiwatch; Cambridge Technology). Participants who showed deviations for >15 min from their habitual sleep/wake schedules were excluded from the study.
During the first habituation night in the laboratory, a polygraphic sleep recording was obtained to rule out sleep disorders and familiarize participants to experimental settings. During the second night, sleep polygraphy was recorded using 64-channel EEG, two-channel EOG and chin EMG. These data served as baseline to assess the influence of training on the posttraining sleep activity.
Volunteers were assigned to two experimental groups for this study. Both groups underwent the same experimental sessions although at different times of day in the following order (Fig. 1C).
The familiarization session lasted ∼4 min and consisted of one block of 100 trials. SNR was adjusted using the staircase procedure. The performance level achieved at the end of this session was used to generate the HN and LN trials of the testing sessions.
A “baseline testing” session (“test session 1”) took place before training. No difference was expected between brain responses to QTOT, QTOU, and QUOT stimuli, because volunteers had not yet been consistently trained to any stimulus. This session, as all testing sessions, lasted for ∼20 min and consisted of 90 blocks of eight trials.
A “first training” session was conducted to induce perceptual learning and compute behavioral performance. This session lasted for ∼25 min and consisted of seven blocks of 70 trials.
An “immediate testing” session (“test session 2”) took place after training. This session was aimed at assessing the early modifications of brain responses induced by perceptual learning, if any.
A “delayed testing” session (“test session 3”) took place 8 h (“wake”) or 12 h (“sleep”) after training. This session allowed us to assess the changes in brain responses to the learned stimulus that would occur after several hours of wakefulness (wake group) or sleep (sleep group).
A “second training” session was conducted right after the delayed testing session to estimate the change in perceptual performance (SNR) achieved by volunteers after a period of wakefulness or sleep.
In the sleep group, participants came to the laboratory at 7:00 P.M., were instructed about the task, and then underwent the first scanning session (starting ∼8:00 P.M.). Afterward, they were placed in a dimly lit room (<5 lux), where they were fitted with a 64-channel electrode net. They were subsequently put to bed in accordance with their usual sleep time, typically ∼11:30 P.M. After 8 h of sleep, participants were woken up (typically ∼7:30 AM); they could then take a shower and eat a light breakfast. After performing a psychomotor vigilance task (PVT) (Dinges and Powell, 1985), they were placed in the scanner ∼8:30 A.M. for the last sessions. Participants left the laboratory ∼10:30 A.M.
In the wake group, participants came to the laboratory at ∼8:00 A.M. or 10:00 A.M. (according to their individual sleep/wake schedule), were instructed about the task, and underwent the first scanning session. They were then immediately placed in a dimly lit room (<5 lux) for 8 h. They were instructed to stay in a semi-supine position, performed hourly PVTs, and were not allowed to read, watch movies, or television. A closed-circuit camera system allowed the experimenter to verify that participants were awake and were not stimulated in any way. Light snacks were administered at 12:00 P.M. and right before the end of the 8 h rest period. Between 6:30 P.M. and 8:30 P.M., participants performed the last scanning sessions. They left the laboratory between 8:00 P.M. and 10:00 P.M.
Behavioral analyses.
We computed the geometric mean of the SNR value of the reversal points for each block of 70 trials in the training sessions. Statistical analyses consisted of a repeated-measures ANOVA with individual blocks and sessions as within-subject factors and groups (sleep vs wake) as between-subjects factor, followed by planned comparisons testing the main effect of sessions and the group × session interaction across blocks. Only the last six blocks of each session were included in the analysis to exclude the warm-up effect observed during the first block.
fMRI data acquisition and analysis.
fMRI time series were acquired during all training and testing sessions with a Siemens Allegra 3T MRI Scanner. BOLD signal was recorded using multislice T2*-weighted fMRI images, which were obtained with a gradient echo-planar imaging sequence using axial slice orientation (32 slices; voxel size, 3.4 × 3.4 × 3 mm3 with 30% of gap; matrix size, 64 × 64 × 32; repetition time, 2130 ms; echo time, 40 ms; flip angle, 90°). Structural brain images consisted of a T1-weighted 3D modified driven equilibrium Fourier transform image (repetition time, 7.92 ms; echo time, 2.4 ms; time of inversion, 910 ms; flip angle, 15°; field of view, 230 × 176 cm2; matrix size, 256 × 224 × 176; voxel size, 1 × 1 × 1 mm3) (Deichmann, 2006). An eye-tracking system (LRO5000; ASL) with a sampling rate of 60 Hz was used to monitor eye gaze during all sessions.
Functional volumes were analyzed with SPM5 (www.fil.ion.ucl.ac.uk/spm/software/spm5/). The three initial scans were discarded to account for magnetic saturation effects. Remaining scans were corrected for head motion, coregistered, spatially normalized to a canonical echo-planar imaging template conforming to the MNI, and spatially smoothed (Gaussian kernel, 8 mm FWHM). A first-level analysis accounting for fixed effects within subjects and a second-level analysis accounting for random effects (RFX) were conducted. A general linear model was used to estimate brain responses to the different types of stimuli that were presented during the testing sessions. Visualization of the correctly identified stimuli were modeled as stick functions and convolved with the canonical hemodynamic response function. More specifically, we modeled six types of responses, two for each of the three stimuli types presented during testing sessions (QTOT, QTOU, QUOT). Each trial type was further split with respect to the level of noise (HN or LN) embedded in the stimuli. Regressors derived from incorrect and absent responses, as well as realignment parameters, were included in the design matrix and considered covariates of no interest. High-pass filtering was implemented in the matrix design using a cutoff period of 128 s to remove low-frequency drifts from the time series. Serial correlations in the fMRI signal were estimated using an autoregressive (order 1) plus white noise model and a restricted maximum-likelihood algorithm.
In each subject, the effects of interest were then tested by linear contrasts, generating statistical parametric maps. The main contrast of interest assessed the learning effect by comparing the cerebral responses to QTOT and QTOU (for HN and LN) and estimating the changes in these responses between sessions 1 and 3, as well as 2 and 3 (sessions × learning interactions). Summary statistic images for the contrasts of interest were spatially smoothed (6 mm FWHM) and entered in a second-level analysis to account for intersubject differences (RFX model): we computed two-sample t tests to assess whether these differences were statistically significant between groups (sleep vs wake). Because procedural learning was shown to be associated with spindles and rapid eye movement (REM) sleep, additional RFX tested whether the overnight changes in BOLD responses were linearly related to the changes in spindle density and REM sleep duration between baseline and posttraining nights.
The resulting set of voxel values for each contrast constituted maps of the t statistics with a threshold set at puncorrected = 0.001. Statistical inferences were performed after correction for multiple comparisons at a threshold of p = 0.05. Corrections for multiple comparisons (familywise error method) were based on the Gaussian random field theory and computed on the entire brain volume or on small spherical volumes (10 mm radius) around a priori locations of activation. Activations were expected in occipital areas responsible for orientation coding and object-from-texture discrimination (Orban et al., 1997; Appelbaum et al., 2006).
To conform to the downscaling hypothesis, any modification of learning-related responses mediated by sleep should be observed only within areas recruited during learning in the first place. Therefore, data acquired during the first training session were analyzed using the same mixed-effects model as described above for testing sessions. The fixed-effects design matrix modeled the main effect of stimulus presentation and its linear modulation by the stimulus SNR. This regressor accounted for learning effect during the training session. Because during training sessions only QTOT stimuli were presented, this learning effect is estimated differently from the learning effect reported for testing sessions (QTOT–QTOU). The second-level RFX consisted of a one-sample t test assessing the learning effect during training. Statistical inferences were conducted as in the main analysis.
EEG data acquisition and analyses.
For baseline and posttraining night sleep, our aim was to obtain a high-density EEG recording during the first NREM cycle, because changes in regional SWA were reported mainly during this period (Huber et al., 2004). EEG signals were acquired via 64-ring-type electrodes fitted into a net plugged into a Quickamp (Brain Products) 72-channel amplifier (64 EEG, bipolar vertical and horizontal EOG and chin EMG), and recorded via BrainVision Recorder. During recording, EEG electrodes were referenced to the mean signal of all channels. Electrode–skin impedance was kept below 10 kΩ. Recordings were digitalized at 500 Hz with a bandpass filter from direct current to Nyquist frequency and a 50 Hz notch filter. Electrode positions were measured by a positioning system (Zebris) to allow for 3D reconstruction of scalp currents (for instance, SWs).
Sleep periods were scored using standard criteria with the “fMRI Artifact Removal and Sleep Scoring Toolbox” (FASST; http://www.montefiore.ulg.ac.be/∼phillips/FASST.html) (Leclercq et al., 2011). The EEG files were segmented to isolate the first NREM sleep cycle for each volunteer. Power spectra were computed using a fast Fourier transform on successive 4 s epochs, overlapping by 2 s and weighted by a Hanning window. For each electrode, relative power in the delta band (0.5–4 Hz) was normalized to the mean absolute power over all electrodes (Huber et al., 2004). Repeated-measures ANOVAs were conducted with electrodes and nights (baseline vs posttraining) as within-subjects factors. We also correlated the individual overnight improvement in performance with the SWA computed at each electrode over the first NREM sleep period.
The FASST was also used to semiautomatically detect and characterize NREM sleep SWs and spindles during the first NREM cycle. SW detection was based on the detection parameters by Massimini et al. (2004) and identified the peak negativity of each wave on the scalp, as well as the trajectory followed by each slow oscillation across electrodes. The detection algorithm was applied to potentials locally averaged over four non-overlapping areas of the scalp (region 1: F3, F1, Fz, F2, F4, FC1, FC2; region 2: FC5, FC3, C5, C3, C1, CP3, CP5; region 3: FC6, FC4, C6, C4, C2, CP6, CP4; and region 4: CP1, CPZ, CP2, P3, P1, Pz, P2, P4). The criteria for slow oscillation detection were as follows: a negative zero crossing and a subsequent positive zero crossing separated by 0.3–1.0 s, a negative peak between the two zero crossings with voltage less than −80 μV, and a negative-to-positive peak-to-peak amplitude >140 μV. This analysis allowed us to identify the waves and their trajectories, by determining which scalp electrode positions were crossed by each waves. We also identified the site of “initiation” of each wave (between quotes), operationally defined as the electrode position associated with the earliest peak negativity. This initiation site is obviously different from the actual initiation site of on states which can only be identified by intracortical multicellular recordings (according to Chauvette et al., 2010). For each SW, parameters, such as amplitude and maximum slope, were computed for both baseline and posttraining nights. Repeated-measures ANOVAs were conducted with electrodes and night (baseline vs posttraining) as within-subject factors. We correlated the individual overnight improvement in performance with the number of SWs propagating through or initiated at each electrode.
In additional analyses of SWs, we identified the current sources associated with the peak negativity of waves that we thought related to learning (see Results), using the SPM toolbox (SPM8; www.fil.ion.ucl.ac.uk/spm/software/spm8/). For each volunteer, electrode positions were coregistered to the individual structural MR, by specifying three fiducial points (left and right ear, nasion) derived from electrode position measurement. Forward (EEG BEM model) and inverse (based on multiple sparse priors algorithm) models were then applied to each individual EEG signal. For each volunteer, a mean wave initiated over PO7 was generated by averaging the individual waves initiated over PO7. Finally, the projected EEG activity during the 1000 ms period centered on the peak negativity of average wave was obtained as a 3D NIfTI (Neuroimaging Informatics Technology Initiative) image per each volunteer.
These images were then analyzed with the nonparametric statistical testing SnPM toolbox (http://www2.warwick.ac.uk/fac/sci/statistics/staff/academic-research/nichols/software/snpm/) of SPM to visualize any consistent focal points of origin for the mean slow oscillations across all subjects.
Spindles were detected following the procedure proposed by Mölle et al. (2002), on Fz, Cz, and Pz (referenced to mean mastoids). Data were bandpass filtered between 11 and 15 Hz using linear phase finite impulse response filters (−3 dB at 11.1 and 15.9 Hz). Filtering was performed in both forward and reverse directions, which results in zero-phase distortion and doubling of the filter order. The root mean square of the filtered signal was calculated using a time window of 0.25 s. Sleep spindles were identified by thresholding the spindle root mean square signal at its 95th percentile. Spindles were subsequently visually checked for correct detection.
Statistical analyses of EEG data consisted of repeated-measures ANOVA on SWA, or the number of waves “crossing” or initiated at each electrode during the first NREM cycle with electrode and night (baseline vs posttraining) as within-subject factors. Degrees of freedom of the ANOVA were adjusted using the Greenhouse–Geisser (GG) method. Uncorrected F values are reported together with the GG ε and corrected p values.
Simple linear regressions were used to assess the dependency between individual overnight improvement in performance (i.e., the individual difference in mean SNR between sessions) and (1) the number of SWs crossing or (2) initiated at each scalp positions during test night, (3) the change in spindle density or (4) the change in REM sleep duration from baseline to test night. Statistical inferences were conducted after Bonferroni's correction for multiple comparisons at p < 0.05.
Results
Demographic data
After excluding four volunteers for technical issues and five for noncompliance to regular sleep rhythms, 11 participants were included in the sleep group (seven women) and 12 in the WAKE group (six women; mean age, 23 years ± 6 months). According to actigraphic recordings and sleep diaries, sleep duration did not differ between groups for the 5 d before the testing day (average: 8 h 17 min ± 22 min; t(21) = −0.58; p = 0.15). On average, volunteers in the SLEEP group spent 7 h 53 min ± 19 min and 7 h 58 min ± 24 min in the laboratory during the baseline and posttraining nights, respectively. Volunteers in the wake group spent an average of 8 h 2 min ± 12 min during the baseline night (t(21) = −0.69; p = 0.49, relative to SLEEP group).
Behavioral results
We checked that changes in performance at retest were not attributable to differences in alertness at different time-of-day (evening for the wake group, morning for the sleep group). Objective alertness as assessed by reaction times during a PVT before final retest did not differ between groups (t(18) = −1.25; p = 0.349).
We then assessed perceptual learning with a repeated-measures ANOVA testing for the effects of group, training session, and block (the last six of seven blocks of each training session) on the SNR of noise-filled gratings: the lower the SNR, the better was the performance (Fig. 2A). The main effects of session (F(1,12) = 7.79; p = 0.011) and block (F(5,105) = 13.859; p < 10−6) were statistically significant, whereas the main effect of group was not (F(1,21) = 1.687; p = 0.208). However, the session × group interaction (F(1,21) = 6.391; p = 0.019), as well as the block × group interaction (F(5,105) = 6.731; p < 10−5) were statistically significant. In contrast, the session × block interaction (F(5,105) = 0.862; p = 0.509) and the triple session × block × group interaction (F(5,105) = 0.558; p = 0.732) were not significant. Planned comparisons showed that performance was significantly better in the sleep than in the wake group during the second session (p = 0.007) but not during the initial training session (p = 0.837). In the sleep group, performance increased significantly overnight (p = 0.001), whereas performance did not change significantly between sessions for the wake group (p = 0.850). The data showed that an offline gain in performance between sessions could be observed 8 h after initial training, without any additional practice. However, this gain was observed only when this interval contained a night of sleep.
Figure 2.
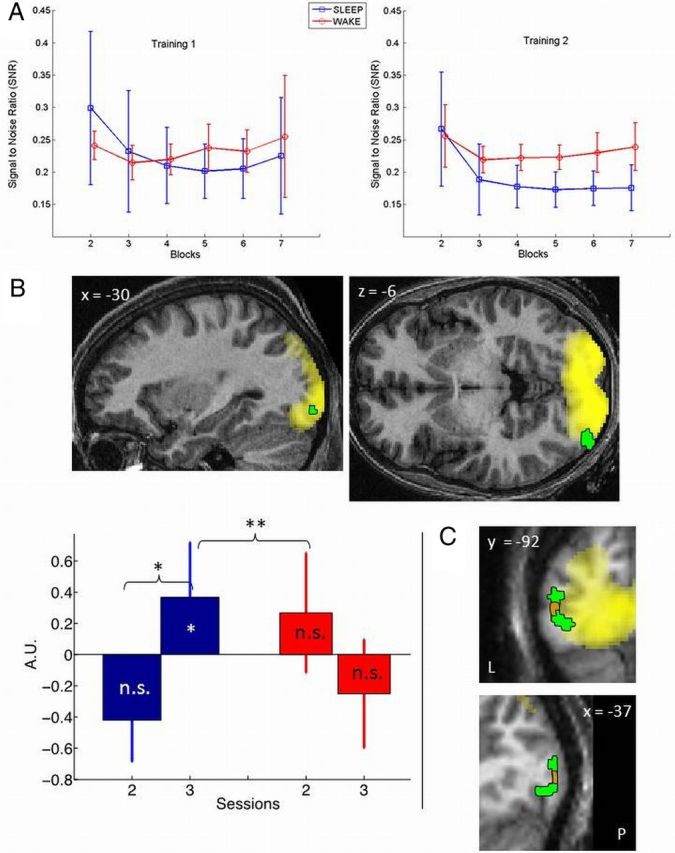
Behavioral and fMRI results. A, SNR thresholds achieved during blocks 2–7 during behavioral (training) sessions, in wake (red) and sleep (blue) groups. B, Top, Left lateral occipital area showing a significantly larger increase in learning effect (QTOT–QTOU) from immediate (session 2) to delayed (session 3) testing in the sleep than in the wake group (red), displayed in sagittal (left) and transverse (right) sections, at p < 0.001 uncorrected and superimposed on the learning effect observed during training (yellow) and the structural MR scan of a typical volunteer, normalized to the MNI space. Bottom, Parameter estimates of learning-related responses in this area during sessions 2 and 3 in sleep (blue) and wake (red) groups. *p < 0.05, significant within-session learning effect (QTOT–QTOU; corrected for multiple comparisons on small volume of interest). **p < 0.05, significant change in learning effect from immediate to delayed testing in sleep group (corrected for multiple comparisons on small volume of interest). ***p < 0.05, significant session × group interaction (corrected for multiple comparisons on small volume of interest). n.s., Not significantly different from zero. C, Sagittal (bottom) and coronal (top) display of the areas showing enhanced response during delayed testing in proportion to REM sleep duration (orange), superimposed on the group × session interaction (green), the learning effect observed during training (yellow) and the structural MR scan of a typical volunteer, normalized to the MNI space (displays at p < 0.001 uncorrected). A.U., Arbitrary units; L, left; P, posterior.
Finally, the gain in performance was not correlated with changes in spindle density or REM sleep duration between baseline and posttraining nights.
fMRI results
The changes in regional brain responses induced by perceptual learning were assessed by contrasting responses to stimuli with trained orientations presented in the trained quadrant with highly noisy stimuli (SNR <30%) presented in the same quadrant but with untrained orientations (QTOT > QTOU; see Materials and Methods and Table 1).
Table 1.
Summary of the neural correlates of learning effects
| Brain area | x (mm) | y (mm) | z (mm) | Z score | punc | psvc |
|---|---|---|---|---|---|---|
| Local peak voxel significantly related to learning during initial training (inversely proportional to SNR) | ||||||
| Left inferior lateral occipital cortex | −30 | −92 | −6 | 3.37 | <0.001 | 0.017 |
| Trial type (QTOT > QTOU) × group (sleep > wake) interaction during the delayed testing session (session 3) | ||||||
| Left inferior lateral occipital cortex | −42 | −90 | −8 | 3.63 | <0.001 | 0.009 |
| Learning effect (QTOT > QTOU) during the delayed testing session (session 3) in the sleep group | ||||||
| Left inferior lateral occipital cortex | −38 | −92 | −12 | 3.41 | <0.001 | 0.033 |
| Trial type (QTOT > QTOU) × session (session 3 > session 2) interaction in the sleep group | ||||||
| Left inferior lateral occipital cortex | −32 | −90 | −8 | 3.56 | <0.001 | 0.003 |
| Trial type (QTOT > QTOU) × session (session 3 > session 2) × group (sleep > wake) interaction | ||||||
| Left inferior lateral occipital cortex | −38 | −88 | −8 | 3.23 | <0.001 | 0.029 |
| Right inferior lateral occipital cortex | 44 | −82 | −12 | 3.15 | <0.05 | n.s. |
| Peak voxel with significant changes in learning-related (QTOT > QTOU) responses in proportion to REM sleep duration | ||||||
| Left inferior lateral occipital cortex | −40 | −92 | 1 | 3.65 | <0.001 | 0.017 |
n.s., Not significant.
No significant learning effect (QTOT–QTOU) was detected before training or during the immediate posttraining session in neither the wake group nor the sleep group. In neither group were there any significant changes in learning-related responses from baseline to immediate posttraining session.
A significant learning effect was observed in the left inferior lateral occipital cortex [coordinates, (−38, −92, −12 mm); Z = 3.41, psmall volume correction (svc) = 0.033; Fig. 2B, green], during the delayed testing session (session 3), the day after training in the sleep group, but not in the posttraining evening in the wake group. The area overlapped with brain areas significantly recruited during training as performance increases [i.e., SNR decreases; local peak voxel: coordinates, (−30, −92, −6); Z = 3.27, psvc = 0.017; Fig. 2B, yellow].The learning effect in the delayed testing session was significantly larger in the sleep than in the wake group [trial type (QTOT vs QTOU) × group (SLEEP vs WAKE) interaction during session 3; (−42, −90, −8); Z = 3.63, psvc = 0.009]. The changes in learning effect from immediate to delayed testing were significant in the sleep group in the same occipital area [trial type (QTOT vs QTOU) × session (2 vs 3) in sleep; (−32, −90, −8); Z = 3.56, psvc = 0.003] and significantly larger in the latter than in the wake group [trial type (QTOT vs QTOU) × session (2 vs 3) × group (sleep vs wake) interaction; (−38, −88, −8); Z = 3.23; psvc = 0.029; Figure 2B]. At a lenient statistical threshold (puncorrected < 0.05), a learning effect was detected in the contralateral homologous area in the right occipital cortex [ipsilateral to the learned stimulus; (44, −82, −12); Z = 3.15] when comparing activations between sleep and wake groups for trained versus untrained orientations between the first and last testing sessions [trial type (QTOT vs QTOU) × session (2 vs 3) × group (sleep vs wake) interaction].
These results indicate that brain responses to HN stimuli selectively presented at the trained orientation and quadrant were enhanced 8 h after initial training but only if the interval was filled with nocturnal sleep. Activity estimates confirm that learning-related responses were significantly enhanced during the delayed testing session (in the morning, after a full night of sleep) relative to the immediate testing session (in the evening) in the sleep group, whereas learning-related responses did not significantly change across sessions in the wake group (Fig. 2B).
These results were observed for HN stimuli. The same contrasts, for the LN condition, did not show any significant differences in brain responses. We assume that only HN stimuli were associated with changes in brain responses because stimuli during training sessions were almost exclusively presented at the HN level with low SNRs. This high level of noise thus supported a greater level of perceptual learning.
Because sleep-dependent consolidation has been related to spindles and REM sleep and for the sake of completeness, we looked whether the changes in learning-related responses (QTOT–QTOU) were related to modifications in spindle density or REM sleep duration between baseline and test nights. The change in learning-related responses between immediate and delayed testing was not correlated with the change in spindle density between baseline and posttraining nights. In contrast, learning-related responses in the same area [coordinates, (−40, −92, 1); Z = 3.65; psvc = 0.017] were significantly enhanced during delayed testing, relative to immediate testing, in proportion to the change in REM sleep duration between baseline and posttraining nights (Fig. 2C).
Sleep EEG results
The data of one subject were lost, and the analyses were run on 10 participants' data. Sleep parameters in the sleep group are summarized in Table 2. No significant differences in the sleep architecture were observed.
Table 2.
Sleep parameters derived from the baseline and posttraining nights in the sleep group
| Parameter | Dimension | Baseline | Posttraining | p |
|---|---|---|---|---|
| N2 latency | min | 27.1 ± 19.27 | 13.75 ± 7.31 | 0.23 |
| REM sleep latency | min | 112.3 ± 34.76 | 115.3 ± 35.46 | 0.86 |
| TST | min | 406.9 ± 79.2 | 436.1 ± 71.6 | 0.82 |
| Sleep efficiency | % | 82.9 ± 16.3 | 86.4 ± 14.0 | 0.56 |
| Duration N2 | min | 175.9 ± 41.4 | 222.4 ± 66.2 | 0.11 |
| Duration N3 | min | 141.1 ± 31.9 | 138.6 ± 48.5 | 0.89 |
| Duration REM sleep | min | 89.9 ± 30.8 | 75.3 ± 22.3 | 0.26 |
| Duration N2 (% TST) | % | 35.5 ± 8.6 | 43.9 ± 12.8 | 0.13 |
| Duration N3 (% TST) | % | 28.4 ± 6.5 | 27.4 ± 9.9 | 0.81 |
| Duration REM sleep (% TST) | % | 18.1 ± 6.3 | 14.9 ± 4.5 | 0.22 |
| Total number of SWs | 1933.9 ± 25.2 | 1879.8 ± 21.4 | 0.72 | |
| Number of SWs propagating through PO7 | 475.8 ± 275.5 | 378.9 ± 193.8 | 0.34 | |
| Number of SWs initiated at PO7 | 47.22 ± 43.9 | 35.2 ± 20.0 | 0.41 | |
| Number of SWs initiated at PO8 | 41,56 ± 33.8 | 43.89 ± 21.96 | 0.22 | |
| Spindle density | min−1 | 2.84 ± 1.29 | 3.05 ± 1.27 | 0.70 |
Sleep efficiency is defined as (N2 + N3 + R/TST) × 100. TST, Total sleep time. Values are mean ± SD.
Repeated-measures ANOVA on SWA during the first NREM cycle with electrode and night (baseline vs posttraining) as within-subject factors revealed a significant effect of electrode (F(63,504) = 51.75; p < 10−6; GG ε = 0.052), whereas neither the effect of night (F(1,8) = 0.874; p = 0.38; GG ε = 1) nor the electrode × night interaction (F(63,504) = 0.441; p = 0.99; GG ε = 0.026) were significant (Fig. 3A). The individual overnight improvement in performance did not significantly regress with SWA computed over the first NREM sleep period for any of the electrodes.
Figure 3.

EEG and fMRI results. A, Scalp distribution of SWA during the first NREM cycle of baseline (left) and posttraining (right) nights. B, Scalp distribution of the number of SWs crossing each electrode position during the first NREM cycle of baseline (left) and posttraining (right) nights. C, Scalp distribution of the number of SWs initiated at each electrode position during the first NREM cycle of baseline (left) and posttraining (right) nights. D, Scalp distribution of squared correlation coefficients (r2) between the number of SWs initiated at each electrode position during the first NREM cycle of posttraining night and the overnight gain in performance. E, Correlation between the number of SWs initiated at PO7 during the first NREM cycle of posttraining night and the overnight gain in performance. F, Coregistration of the current sources of SWs initiated at PO7 during the first NREM cycle of posttraining night (red) and the area showing an overnight increase in learning response during fMRI testing (green) averaged across all subjects.
The repeated-measures ANOVA conducted on the total number of waves crossing each scalp electrode position during the first NREM cycle revealed a significant effect of electrode (F(63,504) = 123.41; p < 10−6; GG ε = 0.047) but did not show any significant effect of night (F(1,8) = 0.13; p = 0.72; GG ε = 1) nor any electrode × night interaction (F(63,504) = 0.28; p = 1; GG ε = 0.002; Fig. 3B). By summing waves, respectively, over frontal and occipital electrodes, the number of detected waves was expectedly larger in frontal (1279 ± 234) than occipital (389 ± 76) electrodes, confirming the frontal predominance of SWs. For none of the electrodes did the individual overnight improvement in performance regress with the number of SWs, the trajectory of which crossed the electrode scalp positions.
The repeated-measures ANOVA conducted on the number of waves initiated at each electrode (i.e., electrode with the earliest peak negativity; see Materials and Methods) during the first NREM cycle revealed a significant effect of electrode (F(63,504) = 20.75; p < 10−6; GG ε = 0.083). As expected, most of the waves were initiated in frontal areas (frontal electrodes, 89 ± 12) and less frequently from occipital areas (occipital electrodes, 37 ± 9). However, there was not any significant night effect (F(1,9) = 0.04; p = 0.83; GG ε = 1) nor any electrode × night interaction (F(63,504) = 0.73; p = 0.93; GG ε = 0.073; Fig. 3C).
However, and most importantly, the number of slow oscillations initiated at PO7 during the first NREM cycle was significantly correlated to the individual overnight performance gain (F(1,8) = 28.11; p = 0.00078, Bonferroni's correction over 64 electrodes; r2 = 0.75; Fig. 3D,E). The correlation remained significant after discarding the two best performers (p = 0.04; r2 = 0.55). This correlation was not significant for any other electrode during posttraining night, and no such correlation was observed during the baseline night. These results suggest that the initiation of SWs is related to offline memory processing selectively in occipital areas. In addition, occipital SW initiation does not reflect a general ability for visual perceptual learning because it was related to performance gains specifically during NREM sleep after training.
This result is all the more intriguing that the number of SWs initiated from PO7 was not significantly different from that recorded in PO8 during neither baseline night (paired t test, t(8) = 0.60; p = 0.56) nor posttraining night (paired t test, t(8) = 1.34; p = 0.21).
The current sources associated with the averaged SW initiated at PO7 during the first NREM period, computed over the entire group, were located in bilateral occipito-temporal areas and, on the left side, showed an excellent consistency [peak voxel of reconstructed SW activity coordinates, (−40, −90, −10 mm)] with the location of enhanced learning-related BOLD responses observed after sleep (Fig. 3F). This result is remarkable given that the signals were obtained at different time points in the process of memory consolidation, in two different states of vigilance, and with two different imaging techniques. It shows that SWs initiated in lateral occipital areas during posttraining NREM sleep not only predict individual overnight gains in performance but recruit brain areas that selectively enhance their response to the learned stimulus the next morning.
Discussion
Normal volunteers were trained to discriminate two orthogonally oriented gratings embedded in increasing levels of noise, in either the morning or evening. They were retested after 8 h of wakefulness or sleep, respectively. Performance was enhanced after 8 h only in the sleep group. This gain in performance was specifically predicted by the number of SWs initiated in occipito-temporal areas during NREM sleep. The next morning (i.e., only in the sleep group), an overlapping area in the left occipital cortex showed enhanced neural responses selectively for the trained orientations. This response enhancement was proportional to individual REM sleep changes from baseline to posttraining night. Collectively, these findings suggest that, in the same occipital area, the local initiation of learning-related SWs during posttraining NREM sleep foreshadows the enhancement of learning-related responses the next morning and that REM sleep favorably influences this increase.
Increased performance only occurs after nocturnal sleep and is predicted by locally initiated NREM sleep SWs
Confirming our previous findings (Matarazzo et al., 2008), orientation discrimination was enhanced 8 h after initial training only if this interval included nocturnal sleep. An equal period of quiet daytime wakefulness did not lead to any change in performance. We conclude that the mere passing of time cannot account for the behavioral results. Although a circadian effect cannot be ruled out, we provide evidence for a direct influence of NREM sleep SWs on delayed perceptual performance. During the posttraining night, the number of SWs specifically initiated at PO7 with sources in bilateral occipital areas predicted the overnight performance gain, although the total number of waves crossing occipital electrode scalp positions or initiated in occipital areas did not change from baseline to posttraining night.
During later testing, local neural responses are selectively enhanced above noise level, only for trained orientations, only after sleep and in proportion to REM sleep
Consistent with behavioral results, changes in responses specific to learned orientations, relative to novel untrained orientations, were observed after training only in the sleep group. This result indicates that only sleep can lead to offline memory processing, resulting in increased SNR neural responses the next morning. The influence of sleep is further suggested by two pieces of experimental evidence. First, the changes in fMRI activations paralleled the behavioral changes, which in turn were significantly related to SWs initiated locally during posttraining NREM sleep. Second, the between-session enhancement of responses to the learned stimuli was spatially consistent with the source of local SWs spontaneously generated during the interleaved night of sleep. These findings suggest that a local offline memory processing takes place during posttraining NREM sleep and leads the next morning to both improved perceptual skills and enhanced local neural responses reflecting an increased SNR for the learned stimulus, in keeping with the predictions of the downscaling hypothesis.
The enhancement of occipital learning-related responses was proportional to the change in REM sleep during posttraining night relative to baseline night. This result suggests the participation of REM sleep in perceptual learning, although the overnight gain in performance did not correlate with REM sleep, in contrast to previous reports (Karni et al., 1994; Mednick et al., 2003).
The identified brain area is compatible with the lateral occipital complex, a set of areas involved in shape and object-related processing (Malach et al., 1995). Object recognition is thought to rely in part on extracting shapes from temporally structured figure–ground configurations (Appelbaum et al., 2006), a process involved in our COD task. The lateral occipital complex is also activated by fine orientation discrimination (Orban et al., 1997). After sleep, neural populations coding for trained orientations enhanced their responses, whereas in the populations coding for untrained orientations, responses did not change or changed to a significantly smaller extent. Perceptual learning would thus be supported by a limited neural population, specifically responsive to the learned orientation.
The initiation of SWs as a marker of local learning during NREM sleep
Perceptual learning is currently thought to be associated with Hebbian plastic changes in sensory cortices under the combined influence of attention, neuromodulatory systems (Raiguel et al., 2006; Roelfsema et al., 2010), and local horizontal connections within each area. Experience would locally induce a net increase in synaptic strength, either through synaptic potentiation or by the growth of dendritic spines and axonal boutons (Stettler et al., 2006; Holtmaat et al., 2008). It can be assumed that learning the COD task increased local synaptic strength, and, following the hypothesis of synaptic homeostasis, this should result in changes in local SWs during posttraining NREM sleep. Contrary to this prediction, perceptual learning was not associated with any change in SWA, number of SWs crossing occipital electrode positions, or number of locally initiated waves (Gilbert et al., 2009). However, these results are consistent with the fact that orientation learning is associated with changes in orientation tuning of individual neurons and not necessarily with an increase in the population of neurons responding to learned orientations (Schoups et al., 2001).
Nevertheless, during the posttraining night, the number of SWs initiated in occipital areas predicted the overnight gain in performance. The initiation of cortical activity during a slow oscillation is still debated and could result from intrinsic properties of layer V neurons (Sanchez-Vives and McCormick, 2000), state transitions occurring in small neuronal ensembles (Cossart et al., 2003), or spontaneous synaptic events switching the whole network into an active state (Timofeev et al., 2000). In the latter case, the switch from down to up state would be mediated by spontaneous synaptic events that appear probabilistically in any neuron and are reflected as mEPSCs (Chauvette et al., 2010). Neurons with potentiated synapses, which generate more frequent mEPSCs, are best suited for switching local neural populations into the up state. If these processes apply to humans, initiation of slow oscillations would randomly recruit local neurons during the baseline night (according to their respective synaptic potentiation during the previous waking period), whereas it would more consistently involve populations coding for the trained orientation during posttraining night, which are more prone to generate mEPSCs (Liu et al., 2010). At the level of neuronal populations coding for the learned orientations, this enhanced participation in local slow oscillation is likely to optimize synaptic homeostasis and increase subsequent responses to learned orientations relative to other orientations. Testing this hypothesis is beyond current fMRI resolution, but it leads to the testable prediction that the probability of up state initiation should change differentially between neural ensembles depending on the respective synaptic potentiation induced by orientation learning during the previous waking period. The generality of these findings should be ultimately investigated using other perceptual learning paradigms.
Concluding remarks
We provide an example of a local learning, which is supported by an orientation-selective neural population within lateral occipital areas. This perceptual learning seems associated with a change in local SW initiation during posttraining NREM sleep, without any modification in standard NREM sleep parameters, such as SWA. Indeed, the next morning, the selective gain in performance for trained stimuli is predicted by SWs locally initiated in occipital areas. In addition, during delayed testing the next morning, brain responses selectively evoked by learned stimuli are enhanced in the same occipital areas, suggesting that SW-dependent processes foreshadow this increase in SNR. These results support the downscaling hypothesis and extend its scope by emphasizing the potential importance of NREM sleep SW initiation as a marker of local sleep pressure induced by learning. However, it is also true that the results, based on BOLD signal, do not identify the underpinning mechanisms that could equally involve protein synthesis induced by learning or local metabolic changes related to energy restoration or elimination of adenosine. Finally, occipital responses were increased in proportion to REM sleep duration, supporting the view that REM sleep is also associated with substantial local neural plasticity, potentially in relation to enhanced synaptic potentiation (Ribeiro et al., 1999, 2007; Ravassard et al., 2009).
Footnotes
This work was supported by the Belgian National Fund of Scientific Research, the Flemish Fund for Scientific Research, the University of Liège, and the Queen Elisabeth Medical Foundation. This project was in part sponsored by the Belgian Inter-University Attraction Program. We thank Igor Timofeev for his input about the cellular mechanisms of slow-wave initiation during NREM sleep.
The authors declare no competing financial interests.
References
- Appelbaum LG, Wade AR, Vildavski VY, Pettet MW, Norcia AM. Cue-invariant networks for figure and background processing in human visual cortex. J Neurosci. 2006;26:11695–11708. doi: 10.1523/JNEUROSCI.2741-06.2006. [DOI] [PMC free article] [PubMed] [Google Scholar]
- Beck AT, Epstein N, Brown G, Steer RA. An inventory for measuring clinical anxiety: psychometric properties. J Consult Clin Psychol. 1988;56:893–897. doi: 10.1037//0022-006x.56.6.893. [DOI] [PubMed] [Google Scholar]
- Buysse DJ, Reynolds CF, 3rd, Monk TH, Berman SR, Kupfer DJ. The Pittsburgh Sleep Quality Index: a new instrument for psychiatric practice and research. Psychiatry Res. 1989;28:193–213. doi: 10.1016/0165-1781(89)90047-4. [DOI] [PubMed] [Google Scholar]
- Chauvette S, Volgushev M, Timofeev I. Origin of active states in local neocortical networks during slow sleep oscillation. Cereb Cortex. 2010;20:2660–2674. doi: 10.1093/cercor/bhq009. [DOI] [PMC free article] [PubMed] [Google Scholar]
- Cossart R, Aronov D, Yuste R. Attractor dynamics of network UP states in the neocortex. Nature. 2003;423:283–288. doi: 10.1038/nature01614. [DOI] [PubMed] [Google Scholar]
- Deichmann R. Fast structural brain imaging using an MDEFT sequence with a FLASH-EPI hybrid readout. Neuroimage. 2006;33:1066–1071. doi: 10.1016/j.neuroimage.2006.08.005. [DOI] [PubMed] [Google Scholar]
- Dinges D, Powell J. Microcomputer analyses of performance on a portable, simple visual RT task during sustained operations. Behav Res Methods Instrum Comput. 1985;17:652–655. [Google Scholar]
- Esser SK, Hill SL, Tononi G. Sleep homeostasis and cortical synchronization. I. Modeling the effects of synaptic strength on sleep slow waves. Sleep. 2007;30:1617–1630. doi: 10.1093/sleep/30.12.1617. [DOI] [PMC free article] [PubMed] [Google Scholar]
- Gilbert CD, Li W, Piech V. Perceptual learning and adult cortical plasticity. J Physiol. 2009;587:2743–2751. doi: 10.1113/jphysiol.2009.171488. [DOI] [PMC free article] [PubMed] [Google Scholar]
- Hill S, Tononi G, Ghilardi MF. Sleep improves the variability of motor performance. Brain Res Bull. 2008;76:605–611. doi: 10.1016/j.brainresbull.2008.02.024. [DOI] [PMC free article] [PubMed] [Google Scholar]
- Holtmaat A, De Paola V, Wilbrecht L, Knott GW. Imaging of experience-dependent structural plasticity in the mouse neocortex in vivo. Behav Brain Res. 2008;192:20–25. doi: 10.1016/j.bbr.2008.04.005. [DOI] [PubMed] [Google Scholar]
- Horne JA, Ostberg O. A self-assessment questionnaire to determine morningness-eveningness in human circadian rhythms. Int J Chronobiol. 1976;4:97–110. [PubMed] [Google Scholar]
- Huber R, Ghilardi MF, Massimini M, Tononi G. Local sleep and learning. Nature. 2004;430:78–81. doi: 10.1038/nature02663. [DOI] [PubMed] [Google Scholar]
- Huber R, Esser SK, Ferrarelli F, Massimini M, Peterson MJ, Tononi G. TMS-induced cortical potentiation during wakefulness locally increases slow wave activity during sleep. PLoS One. 2007;2:e276. doi: 10.1371/journal.pone.0000276. [DOI] [PMC free article] [PubMed] [Google Scholar]
- Huber R, Määtt ä S, Esser SK, Sarasso S, Ferrarelli F, Watson A, Ferreri F, Peterson MJ, Tononi G. Measures of cortical plasticity after transcranial paired associative stimulation predict changes in electroencephalogram slow-wave activity during subsequent sleep. J Neurosci. 2008;28:7911–7918. doi: 10.1523/JNEUROSCI.1636-08.2008. [DOI] [PMC free article] [PubMed] [Google Scholar]
- Johns MW. A new method for measuring daytime sleepiness: the Epworth sleepiness scale. Sleep. 1991;14:540–545. doi: 10.1093/sleep/14.6.540. [DOI] [PubMed] [Google Scholar]
- Karni A, Tanne D, Rubenstein BS, Askenasy JJ, Sagi D. Dependence on REM sleep of overnight improvement of a perceptual skill. Science. 1994;265:679–682. doi: 10.1126/science.8036518. [DOI] [PubMed] [Google Scholar]
- Krakauer JW, Ghilardi MF, Mentis M, Barnes A, Veytsman M, Eidelberg D, Ghez C. Differential cortical and subcortical activations in learning rotations and gains for reaching: a PET study. J Neurophysiol. 2004;91:924–933. doi: 10.1152/jn.00675.2003. [DOI] [PubMed] [Google Scholar]
- Leclercq Y, Schrouff J, Noirhomme Q, Maquet P, Phillips C. fMRI artefact rejection and sleep scoring toolbox. Comput Intell Neurosci. 2011;2011:598206. doi: 10.1155/2011/598206. [DOI] [PMC free article] [PubMed] [Google Scholar]
- Liu ZW, Faraguna U, Cirelli C, Tononi G, Gao XB. Direct evidence for wake-related increases and sleep-related decreases in synaptic strength in rodent cortex. J Neurosci. 2010;30:8671–8675. doi: 10.1523/JNEUROSCI.1409-10.2010. [DOI] [PMC free article] [PubMed] [Google Scholar]
- Malach R, Reppas JB, Benson RR, Kwong KK, Jiang H, Kennedy WA, Ledden PJ, Brady TJ, Rosen BR, Tootell RB. Object-related activity revealed by functional magnetic resonance imaging in human occipital cortex. Proc Natl Acad Sci U S A. 1995;92:8135–8139. doi: 10.1073/pnas.92.18.8135. [DOI] [PMC free article] [PubMed] [Google Scholar]
- Massimini M, Huber R, Ferrarelli F, Hill S, Tononi G. The sleep slow oscillation as a traveling wave. J Neurosci. 2004;24:6862–6870. doi: 10.1523/JNEUROSCI.1318-04.2004. [DOI] [PMC free article] [PubMed] [Google Scholar]
- Matarazzo L, Franko E, Maquet P, Vogels R. Offline processing of memories induced by perceptual visual learning during subsequent wakefulness and sleep: a behavioral study. J Vis. 2008;8:7, 1–9. doi: 10.1167/8.4.7. [DOI] [PubMed] [Google Scholar]
- Mednick S, Nakayama K, Stickgold R. Sleep-dependent learning: a nap is as good as a night. Nat Neurosci. 2003;6:697–698. doi: 10.1038/nn1078. [DOI] [PubMed] [Google Scholar]
- Mölle M, Marshall L, Gais S, Born J. Grouping of spindle activity during slow oscillations in human non-rapid eye movement sleep. J Neurosci. 2002;22:10941–10947. doi: 10.1523/JNEUROSCI.22-24-10941.2002. [DOI] [PMC free article] [PubMed] [Google Scholar]
- Oldfield RC. The assessment and analysis of handedness: the Edinburgh inventory. Neuropsychologia. 1971;9:97–113. doi: 10.1016/0028-3932(71)90067-4. [DOI] [PubMed] [Google Scholar]
- Orban GA, Dupont P, Vogels R, Bormans G, Mortelmans L. Human brain activity related to orientation discrimination tasks. Eur J Neurosci. 1997;9:246–259. doi: 10.1111/j.1460-9568.1997.tb01395.x. [DOI] [PubMed] [Google Scholar]
- Raiguel S, Vogels R, Mysore SG, Orban GA. Learning to see the difference specifically alters the most informative V4 neurons. J Neurosci. 2006;26:6589–6602. doi: 10.1523/JNEUROSCI.0457-06.2006. [DOI] [PMC free article] [PubMed] [Google Scholar]
- Ravassard P, Pachoud B, Comte JC, Mejia-Perez C, Scoté-Blachon C, Gay N, Claustrat B, Touret M, Luppi PH, Salin PA. Paradoxical (REM) sleep deprivation causes a large and rapidly reversible decrease in long-term potentiation, synaptic transmission, glutamate receptor protein levels, and ERK/MAPK activation in the dorsal hippocampus. Sleep. 2009;32:227–240. doi: 10.1093/sleep/32.2.227. [DOI] [PMC free article] [PubMed] [Google Scholar]
- Ribeiro S, Goyal V, Mello CV, Pavlides C. Brain gene expression during REM sleep depends on prior waking experience. Learn Mem. 1999;6:500–508. doi: 10.1101/lm.6.5.500. [DOI] [PMC free article] [PubMed] [Google Scholar]
- Ribeiro S, Shi X, Engelhard M, Zhou Y, Zhang H, Gervasoni D, Lin SC, Wada K, Lemos NA, Nicolelis MA. Novel experience induces persistent sleep-dependent plasticity in the cortex but not in the hippocampus. Front Neurosci. 2007;1:43–55. doi: 10.3389/neuro.01.1.1.003.2007. [DOI] [PMC free article] [PubMed] [Google Scholar]
- Riedner BA, Vyazovskiy VV, Huber R, Massimini M, Esser S, Murphy M, Tononi G. Sleep homeostasis and cortical synchronization. III. A high-density EEG study of sleep slow waves in humans. Sleep. 2007;30:1643–1657. doi: 10.1093/sleep/30.12.1643. [DOI] [PMC free article] [PubMed] [Google Scholar]
- Roelfsema PR, van Ooyen A, Watanabe T. Perceptual learning rules based on reinforcers and attention. Trends Cogn Sci. 2010;14:64–71. doi: 10.1016/j.tics.2009.11.005. [DOI] [PMC free article] [PubMed] [Google Scholar]
- Roenneberg T, Wirz-Justice A, Merrow M. Life between clocks: daily temporal patterns of human chronotypes. J Biol Rhythms. 2003;18:80–90. doi: 10.1177/0748730402239679. [DOI] [PubMed] [Google Scholar]
- Sanchez-Vives MV, McCormick DA. Cellular and network mechanisms of rhythmic recurrent activity in neocortex. Nat Neurosci. 2000;3:1027–1034. doi: 10.1038/79848. [DOI] [PubMed] [Google Scholar]
- Schoups A, Vogels R, Qian N, Orban G. Practising orientation identification improves orientation coding in V1 neurons. Nature. 2001;412:549–553. doi: 10.1038/35087601. [DOI] [PubMed] [Google Scholar]
- Schwartz S, Maquet P, Frith C. Neural correlates of perceptual learning: a functional MRI study of visual texture discrimination. Proc Natl Acad Sci U S A. 2002;99:17137–17142. doi: 10.1073/pnas.242414599. [DOI] [PMC free article] [PubMed] [Google Scholar]
- Steriade M, McCarley RW. Brain control of wakefulness and sleep. New York: Kluwer Academic; 2005. [Google Scholar]
- Stettler DD, Yamahachi H, Li W, Denk W, Gilbert CD. Axons and synaptic boutons are highly dynamic in adult visual cortex. Neuron. 2006;49:877–887. doi: 10.1016/j.neuron.2006.02.018. [DOI] [PubMed] [Google Scholar]
- Timofeev I, Grenier F, Bazhenov M, Sejnowski TJ, Steriade M. Origin of slow cortical oscillations in deafferented cortical slabs. Cereb Cortex. 2000;10:1185–1199. doi: 10.1093/cercor/10.12.1185. [DOI] [PubMed] [Google Scholar]
- Tononi G, Cirelli C. Sleep function and synaptic homeostasis. Sleep Med Rev. 2006;10:49–62. doi: 10.1016/j.smrv.2005.05.002. [DOI] [PubMed] [Google Scholar]
- Volgushev M, Chauvette S, Mukovski M, Timofeev I. Precise long-range synchronization of activity and silence in neocortical neurons during slow-wave oscillations. J Neurosci. 2006;26:5665–5672. doi: 10.1523/JNEUROSCI.0279-06.2006. [Erratum (2006) 26:table of contents] [DOI] [PMC free article] [PubMed] [Google Scholar]
- Vyazovskiy VV, Cirelli C, Pfister-Genskow M, Faraguna U, Tononi G. Molecular and electrophysiological evidence for net synaptic potentiation in wake and depression in sleep. Nat Neurosci. 2008;11:200–208. doi: 10.1038/nn2035. [DOI] [PubMed] [Google Scholar]
- Vyazovskiy VV, Olcese U, Lazimy YM, Faraguna U, Esser SK, Williams JC, Cirelli C, Tononi G. Cortical firing and sleep homeostasis. Neuron. 2009;63:865–878. doi: 10.1016/j.neuron.2009.08.024. [DOI] [PMC free article] [PubMed] [Google Scholar]
- Wetherill G, Levitt H. Sequential estimation of points on a psychometric function. Br J Math Stat Psychol. 1965;18:1–10. doi: 10.1111/j.2044-8317.1965.tb00689.x. [DOI] [PubMed] [Google Scholar]
- Zhang J, Meeson A, Welchman AE, Kourtzi Z. Learning alters the tuning of functional magnetic resonance imaging patterns for visual forms. J Neurosci. 2010;30:14127–14133. doi: 10.1523/JNEUROSCI.2204-10.2010. [DOI] [PMC free article] [PubMed] [Google Scholar]