

Abstract
P2X receptors are widely distributed in the nervous system, and P2X7 receptors have roles in neuropathic pain and in the release of cytokines from microglia. They are trimeric membrane proteins, which open an integral ion channel when ligated by extracellular ATP. This channel is preferentially permeable to small cations (sodium, potassium, calcium) but also allows permeation of larger cations such as N-methyl-d-glucamine. ATP also leads to entry of fluorescent dyes in many cells expressing P2X7 receptors, but controversy persists as to whether such large molecules pass directly through the open ion channel or enter the cell by a different route. We measured cellular fluorescence and membrane currents in individual human embryonic kidney cells expressing rat P2X7 receptors. Introduction of positive side chains by mutagenesis into the inner half of the pore-forming second transmembrane domain of the receptor (T348K, D352N, D352K) increased relative permeability of chloride ions. It also promoted entry of the large (>1 nm) negative dye fluorescein-5-isothiocyanate while decreasing entry of the structurally similar but positive dye ethidium. Furthermore, larger cysteine-reactive methanethiosulfonates [sulforhodamine-methanethiosulfonate and 2-((biotinoyl)amino)ethyl methanethiosulfonate] reduced both ATP-evoked currents and dye entry when applied to open P2X7[G345C] receptors. The results demonstrate that the open channel of the P2X7 receptor can allow passage of molecules with sizes up to 1.4 nm.
Introduction
All P2X receptors are found in the nervous system (Collo et al., 1996), and P2X7 receptors are particularly expressed in microglia. Their activation underlies the release of inflammatory cytokines (Perregaux and Gabel, 1994; Sanz and Di Virgilio, 2000; Duan and Neary, 2006; Färber and Kettenmann, 2006; Weisman et al., 2012). Mice genetically modified to lack the P2X7 receptor show marked insensitivity in models of inflammatory or neuropathic pain (Chessell et al., 2005; Clark et al., 2010) and do not develop visceral afferent hypersensitivity in a model of postinfectious irritable bowel syndrome (Keating et al., 2011). There is also evidence for the involvement of P2X7 receptors in experimental autoimmune encephalomyelitis (Matute et al., 2007; Domercq et al., 2010). Thus, blockers of the P2X7 receptor are considered likely to have therapeutic benefit in pain, inflammation, and multiple sclerosis (Romagnoli et al., 2008).
P2X receptors are trimeric membrane proteins with an integral ion channel (Brake et al., 1994; Valera et al., 1994; North, 2002; Kawate et al., 2009; Hattori and Gouaux, 2012). Most P2X receptors are highly cation selective, although some (e.g., P2X5) also have significant anion permeability (North, 2002; Bo et al., 2003). The open channel properties of ligand-gated ion channels are generally considered to be fixed with respect to the selective permeation of small ions (e.g., sodium, potassium, calcium, or chloride) (Hille, 2001), but some P2X receptors become permeable to larger cations [e.g., N-methyl-d-glucamine (NMDG)] during several seconds of continued ATP application (Surprenant et al., 1996; Khakh et al., 1999; Virginio et al., 1999a,b; Yan et al., 2008). In P2X4 (Khakh et al., 1999) and P2X7 (Yan et al., 2008) receptors, the current evoked by ATP is clearly biphasic. In both cases, it was shown that the later sustained phase of current corresponded to the development of an NMDG-permeable dilated state (Yan et al., 2008).
A second approach to the study of P2X receptor pore dilation has been by observation of the entry of fluorescent dyes such as YO-PRO-1 and ethidium (Virginio et al., 1999b). The uptake of dye also develops during several seconds of ATP application, suggesting that these two different kinds of measurements report the same underlying molecular conformational change. On the other hand, it has been suggested that activation of P2X7 receptors might result in the transport of larger fluorescent dyes into the cell by mechanisms other than direct permeation through the P2X7 receptor protein (for review, see North, 2002; Pelegrín, 2011). One candidate molecule is pannexin (Pelegrin and Surprenant, 2006). The purpose of the present experiments was to determine directly whether molecules exceeding 1 nm (in their two smallest axes) could pass through the P2X7 receptor channel. The first approach was to measure membrane currents and fluorescent dye uptake in the same cells at the same time, and to determine whether both were affected in a similar way by mutations introduced into the channel permeation pathway. The second method was to size the permeation pathway by asking whether large methanethiosulfonates could pass through the open channel (Li et al., 2010), and by thiolating a cysteine engineered into the inner pore, inhibit both the current and fluorescent dye uptake.
Materials and Methods
Molecular and cell biology.
Site-directed mutagenesis was performed on the rat P2X7 subunit using the Stratagene QuikChange method. All constructs carried a 6 aa (EYMPME) C-terminal tag for immunodetection. The wild-type and mutant P2X7 receptor cDNA (0.05 μg) were transiently coexpressed together with pEGFP-N1 or pDsRed1-N1 vector cDNA (0.1 μg) into human embryonic kidney (HEK) 293 cells using Lipofectamine 2000 (Invitrogen). Cells were seeded on borosilicate glass coverslips (Agar Scientific).
Western blot and surface expression.
Cell surface proteins were labeled using EZ-link sulfo-NHS-LC-biotin (Pierce). Cells were washed three times in PBS supplemented with 2 mm CaCl2, 0.5 mm MgCl2 (PBS-CM), pH 7.4, and incubated in PBS-CM containing 1 mg/ml biotin for 30 min at 4°C. After washing, proteins were solubilized in cell lysis buffer containing 20 mm Tris, pH 7.4; 100 mm NaCl; 5 mm EDTA; 1% nonyl phenoxypolyethoxylethanol (NP-40); and antiproteases and phosphatases (Halt Phosphatase Inhibitor Cocktail; Pierce) for 30 min at 4°C. After centrifugation (13,000 × g; 10 min), total protein samples were removed and biotinylated surface proteins in the cell lysate were bound to immuno-pure immobilized neutravidin beads (Pierce) for 1 h at room temperature. After washing in buffer, LDS sample buffer (Invitrogen) was added and the samples were boiled (95°C, 5 min) to release cell surface protein. Samples were separated on 4–12% Nu-PAGE gels (Invitrogen) and transferred to nitrocellulose membranes. Western blotting was performed according to standard protocols, and proteins were visualized using rabbit anti-EYMPME primary antibody (Bethyl) and HRP-conjugated secondary antibody (both at 1:2000 dilution). Band densities were quantified using Carestream Molecular Imaging Molecular software. The P2X2 receptor mutated at the three glycosylation sites (N182S, N239S, and N298S) was used as a negative control (Newbolt et al., 1998). For detection of 2-aminoethyl methanethiosulfonate (MTSEA)-biotin binding to P2X7[G345C] receptors, the protocol was modified to include samples with and without ATP (3 mm, 90 s), with and without MTSEA-biotin (300 μm; 90 s during ATP application), and with and without preincubation with membrane-permeable N-acetylcysteine amide (10 mm, 20 min). After cell lysis, proteins were denatured by adding SDS (2%) and heated (80°C, 5 min) to promote biotin exposure. SDS was removed by centrifugation on 10 kDa nominal molecular mass cutoff filters (Millipore), and biotinylated proteins were purified using neutravidin-agarose beads and separated by SDS-PAGE as described above. P2X7 proteins were visualized using an antibody against the C terminus (Alomone Labs).
Electrophysiological recording.
Whole-cell patch-clamp recordings were made at room temperature 24–48 h after transfection. Recording pipettes were pulled from borosilicate glass (Harvard Apparatus) and had resistances of 2–4 MΩ. The intracellular (pipette) solution contained the following (in mm): 147 NaCl, 0.1 CaCl2, 1 EGTA, and 10 HEPES. Cysteine (10 mm) was added to this solution for some experiments. The standard extracellular solution contained the following (in mm): 147 NaCl, 2 KCl, 1 CaCl2, 1 MgCl2, 10 HEPES, and 13 glucose. For the measurement of permeability ratios, reversal potentials were recorded first in a solution containing (in mm) 151.7 sodium and 147 chloride, and then in a solution containing either (1) 42.5 sodium, 40 chloride, and 200 d-mannitol; or (2) 149.5 sodium, 137 gluconate, and 10 chloride (all solutions with 13 glucose and 10 HEPES). Reversal potentials were obtained from 2′3′-O-(4-benzoylbenzoyl)-ATP (BzATP)-elicited currents measured during voltage ramps (−60 to +60 mV in 1 s) applied at 0.5 Hz. The bath and indifferent electrode were connected by an agar bridge that contained 3 m KCl. All solutions were maintained at 285–315 mOsm/L and pH 7.3 (adjusted with NaOH, which accounts for the final ion concentrations). Currents were recorded with an EPC10 amplifier using Patchmaster software (HEKA) from a holding potential of −60 mV, unless stated otherwise. The data were low-pass filtered at 3 kHz and sampled at 1–5 kHz. Agonists and other compounds were applied using a RSC-160 rapid perfusion system (Bio-Logic) and Perfusion Pencil (Digitimer). Agonist concentrations were 5 mm ATP or 20 μm BzATP, unless stated otherwise.
Confocal laser-scanning fluorescence microscopy.
Fluorescent images were acquired using a Nikon laser-scanning C1 confocal microscope with Nikon 20× Plan Apo or 40× Fluor objective. Fluorescence excitation and detection were performed with a Ar-ion 488 nm laser line with 515/30 nm emission filter, and an HeNe 543 nm laser line with 570 nm LP emission filter. Photobleaching was reduced to <5% over the duration of experiments by use of neutral density filters. When two fluorophores were present in the same cell, recordings were made separately so that bleed-through became negligible. For each experiment, the confocal settings were kept constant between days. In contrast to ethidium, fluorescein isothiocyanate (FITC) is spontaneously fluorescent. Therefore, the time course of influx was determined by correcting for variations in the background that occurred during solution changes (determined using the noncellular background fluorescence), and subtracting the baseline before ATP was applied. Fluorescent dyes were used at the following concentrations: YO-PRO-1, 1 μm; ethidium bromide, 25 μm; and FITC, 50 μm. In cases where fluorescent recordings were made simultaneously with electrophysiology, the C1 confocal and RSC-160 were both triggered by telegraphing outputs of the EPC10 amplifier.
Data analysis.
Electrophysiological data were analyzed using FitMaster (HEKA), Axograph X (Molecular Devices) and Prism 4 (GraphPad) software. Relative chloride permeabilities were calculated from the reversal potential of the ATP-evoked current (Erev; in mV, corrected for liquid junction potentials) using the following equation: PCl/PNa = {(1 − exp(−x)) ([Na]o − [Na]i exp(x))}/{([Cl]i exp(−x) − [Cl]o) (1 − exp(x))}, where [Na]i = 151.7 and [Cl]i = 147 mm, while [Na]o and [Cl]o were varied, as above. x = ErevF/RT (F is the Faraday constant, R is the gas constant, and T is the absolute temperature). Fluorescent images were analyzed using EZ-C1 Viewer (Nikon) and were low-pass filtered with a 3 × 3 pixel median filter using ImageJ. Pooled data are given as the mean ± SEM. Tests for statistical significance were performed using nonparametric ANOVA.
Molecular models.
Closed and open molecular models of the rat P2X7 receptor were made with MODELLER 9.10 (Sali and Blundell, 1993) using the zebrafish P2X4.1 crystal structures (PDB accession 4DW0 and 4DW1) as templates. MolProbity (Davis et al., 2007) was used to assess lowest-energy models, and the selected closed and open models were energy minimized using AMBER. The models both showed 99.5% of residues in the allowed regions of the Ramachandran plot. The pore diameter was calculated using HOLE (Smart et al., 1996). Application of the HOLE program to the crystal structure of the open P2X4.1 receptor showed the narrowest constriction was 0.65 nm (formed by A347): our model of the rat P2X7 structure indicates a similar minimum diameter (0.62 nm) at the level of S342. Molecular dimensions (Table 1) were calculated from Van der Waals radii using energy-minimized structures in PRODRG (http://davapc1.bioch.dundee.ac.uk/prodrg/). Protein images were produced using UCSF Chimera 1.6 (Pettersen et al., 2004).
Table 1.
Dimensions of molecules used to study P2X7 receptors
| Molecule | Charge | MW | x | y | z |
|---|---|---|---|---|---|
| NMDG | Positive | 196 | 0.60 | 0.60 | 1.25 |
| YO-PRO-1 | Positive | 378 | 0.70 | 0.80 | 1.90 |
| Ethidium | Positive | 314 | 0.65 | 1.10 | 1.30 |
| FITC | Negative | 387 | 0.85 | 1.10 | 1.45 |
| MTSEA | Positive | 156 | 0.55 | 0.55 | 1.00 |
| MTSEA-biotin | Neutral | 382 | 0.75 | 0.80 | 1.85 |
| MTSR | Neutral | 696 | 0.90 | 1.40 | 1.65 |
x, y, z dimensions are in nanometers. MW, Molecular weight of the ion; MTSR, sulfo-rhodamine methanethiosulfonate.
Results
The first application of ATP to a HEK293 cell expressing P2X7 receptors typically causes a slowly rising current that reaches a steady state after several tens of seconds (Fig. 1A). Subsequent applications then evoke reproducible currents. We term this phenomenon facilitation: it can also be produced by several repeated applications of ATP for shorter periods of time. The mechanism underlying current facilitation is not fully understood. Roger et al. (2008) distinguished a calcium-dependent and a calcium-independent component. A study by Yan et al. (2010), who called it sensitization, strongly suggests that it reflects differences in the conductive state of the channel that depend on the number (i.e., 1, 2, or 3) of bound ATP molecules. The experiments described in the present article use relatively high concentrations of ATP (3 or 5 mm), and, to ensure reproducible responses, we only measured currents and fluorescence changes after facilitation.
Figure 1.

Simultaneous measurement of membrane current and dye influx. A, An initial application of ATP (5 mm) evoked a current with a biphasic increase in amplitude, and subsequent applications gave reproducible responses. Agonist was applied for 20 s at 2 min intervals. B, Representative recordings of wild-type P2X7 receptor ionic current (black) and cumulative YO-PRO-1 fluorescence (green) measured simultaneously, with ATP (5 mm) applied for 40 s (bar). Cells were held at the indicated membrane potentials (mV). C, Cell fluorescence imaged at 40 s, at several membrane potentials. The position of the recording pipette is indicated. Scale bar, 10 μm. Bottom right panels show mock-transfected cells. D, Time course of YO-PRO-1 fluorescence shows that its influx is reduced at more positive membrane potentials. †Control cells not expressing P2X7 receptors. E, Current–voltage plots for ATP-evoked currents and YO-PRO-1 influx (rate of change of cumulative YO-PRO-1 signal). The fluorescence–voltage relationship is fit to a unidirectional influx equation of the form y = A*V*{exp(−BV)/(1 − exp(−BV)}, where V is the membrane potential, and A and B are constants. Cells were stably expressing the P2X7 receptor. Error bars indicate the SE of the mean for 9–12 cells in each case.
Simultaneous measurement of ionic current and fluorescent dye entry
In individual HEK293 cells expressing the rat P2X7 receptor, extracellular ATP evoked a large inward current and a concomitant increase in fluorescence from influx of YO-PRO-1 (Fig. 1B–E). The current and the YO-PRO-1 entry were closely coupled in time, developing when ATP was applied and ceasing when the ATP application was discontinued (Fig. 1B). At +60 mV, the ionic current was outward, and the YO-PRO-1 uptake was much reduced (Fig. 1B). Ionic current through the open P2X7 receptor was linearly related to voltage and reversed close to 0 mV, as has been described (Surprenant et al., 1996) (Fig. 1E). In the same cells, dye entry was also voltage dependent (Fig. 1D,E), although this is essentially a unidirectional flux because the dye that enters the cell must bind to DNA before its fluorescence is detectable. These results show that movement of the large divalent cation YO-PRO-1 (0.70 × 0.80 × 1.90 nm; Table 1) is affected by the membrane electric field in a manner similar to smaller inorganic ions.
Mutations that increase chloride permeability
P2X7 receptors are more permeable to cations (Na+, K+, and Ca2+) than anions (North, 2002). In the P2X2 receptor, as for channels of the nicotinic superfamily (Galzi et al., 1992; Hille, 2001), this selectivity can be altered by manipulating the fixed charge on the wall of the ion permeation pathway by site-directed mutagenesis (P2X2[T339K]) (Browne et al., 2011). The substitution corresponding to P2X2[T339K] in the P2X7 receptor (S342K) was not functional, and we therefore made substitutions at positions corresponding to two and three turns along the helix of the second transmembrane domain (Fig. 2A): some substitutions at T348 and D352 provided functional channels (Fig. 2B,C). By measuring cell surface biotinylation, we found that D352N, D352K, and T348K were all present at the cell surface, although D352A was not (Fig. 2D,E). Substitutions of the conserved aspartate acid residue at D352 have previously been reported to impair cell surface expression (in P2X5 receptors; Duckwitz et al., 2006).
Figure 2.
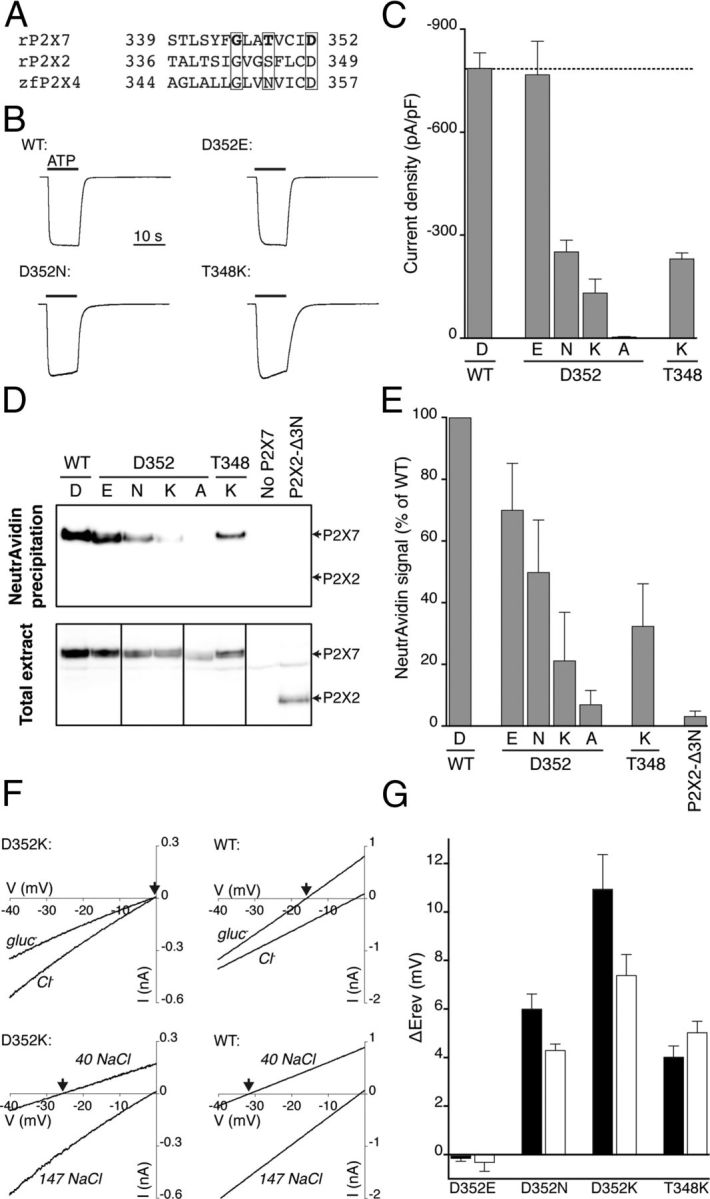
Pore mutations increase permeability to chloride ions. A, Aligned sequences of part of the second transmembrane domain of rat P2X7, rat P2X2 and zebrafish P2X4 receptors. The boxed residues are those changed in the present study (rat P2X7 G345, T348, and D352). B, Currents elicited by ATP (5 mm) at wild-type and mutated P2X7 receptor (normalized: amplitudes were wild-type 10.4 nA, D352E 7.2 nA, D352N 2.3 nA, and T348K 3.1 nA). Error bars indicate the SE of the mean for 8–28 cells. C, Peak current densities for ATP-evoked currents in wild-type and mutated P2X7 receptors. D, Surface expression of wild-type and mutated P2X7 receptors. E, Band densities were measured from three independent biotinylation experiments, one of which is illustrated in D. F, Representative current–voltage relationships for wild-type P2X7 receptors and mutation D352K. Voltage ramps were delivered in the presence of agonist in control solution (see Materials and Methods) and a solution in which most extracellular chloride ions were substituted by gluconate (top; gluc−), or most extracellular sodium and chloride was substituted by mannitol (bottom; 40 NaCl). In both cases, wild-type and mutant P2X7 receptors show different reversal potentials (arrows) in reduced extracellular chloride concentrations. G, The difference in reversal potential compared with wild-type P2X7 receptors. These plots are uncorrected for liquid junction potentials. Open bars represent mannitol substitution. Filled bars represent gluconate substitution.
We measured current reversal potentials in cells expressing these three mutated P2X7 channels, using mannitol substitution for most extracellular sodium chloride (see Materials and Methods) (Fig. 2F, bottom panels). Wild-type receptors showed a reversal potential of ∼32 mV (Fig. 2F, bottom right), but this was only 26 mV for D352K (Fig. 2F, bottom left): this difference in the shift is plotted in Figure 2G. On average, the difference in reversal potential was ∼4.5 mV in the case of D352N and T348K, and ∼7.5 mV for D352K (Fig. 2G). We calculated corresponding PCl/PNa ratios from these shifts (see Materials and Methods). Wild-type P2X7 receptors had a very low chloride permeability (<0.01) (Virginio et al., 1999b), and this was similar for D352E (0.004 ± 0.004, n = 8). The values for the other mutations were as follows: D352N 0.068 ± 0.004 (n = 11); D352K 0.123 ± 0.017 (n = 8); and T348K 0.081 ± 0.008 (n = 8). Figure 2, F (top panels) and G, also shows qualitatively similar shifts in reversal potential observed when sodium gluconate replaced 93% of sodium chloride.
Thus, for D352 the largest effect on chloride permeability was observed with two increments of electronic charge (2e: D352K), an intermediate change was observed when the substituent side chain differed from wild-type by one e unit (D352N, or T348K), and there was no effect when the charge was maintained (D352E) (Fig. 2F,G): these changes would be six and three e in a trimeric channel (Browne et al., 2011). Side-chain volume seems not to play a role, given that Asp and Asn are very similar (111 vs 114 Å3). These residues (T348 and D352) correspond in position to S345 and D349 of the P2X2 receptor (Fig. 2A), where the equivalent substitutions ([S345K] and D349N]) cause a large reduction in single-channel currents, consistent with exposure in the permeation pathway (Cao et al., 2009). We also found an increased relative chloride permeability at P2X7[G345R] [PCl/PNa 0.11 ± 0.02, n = 8 (mannitol substitution)]. However, whole-cell currents were very small with this mutation (19 ± 2 pA/pF, n = 6) compared with wild type (787 ± 45 pA/pF, n = 28).
The same mutations decrease entry of cationic dyes and increase entry of anionic dyes
If fluorescent dyes use the same permeation pathway as small inorganic ions, we might expect their entry to the cell to be similarly affected by the changes in TM2. For these experiments, we chose two fluorescent molecules that were closely related in size and structure (Fig. 3A), but which carried either a positive or a negative net charge. The cation (ethidium) and the anion (FITC) (Fig. 3A; Table 1) have distinct emission spectra, and their cellular fluorescence was measured simultaneously. An influx of ethidium and FITC was observed only when extracellular ATP was applied to cells expressing the P2X7 receptor, and there was a strong correlation (Pearson's r = 0.86) between the two fluorescent signals: that is, cells that were most permeable to cationic ethidium were also the most permeable to anionic FITC (Fig. 3B). However, the membrane electric field changed the uptake of these dyes in opposite directions. After 90 s of ATP application, ethidium uptake changed from 1.00 ± 0.20 (normalized: arbitrary units of fluorescence intensity, n = 6) at −40 mV to 0.28 ± 0.05 (n = 7) at +40 mV. FITC uptake was 0.08 ± 0.05 (n = 6) at −40 mV compared with its normalized value of 1.00 ± 0.05 (n = 7) at +40 mV.
Figure 3.

Simultaneous uptake of positive and negative dyes. A, Structures of ethidium and FITC. B, Correlation between cellular influx of ethidium and FITC. Cells stably expressing the P2X7 receptor were imaged after ATP (5 mm, 90 s) and 30 s wash. A significant positive correlation between the influx of FITC and ethidium in 71 cells indicates that cells that became the most permeable to large cations also became the most permeable to large anions. Neither FITC nor ethidium fluorescence was observed in the absence of ATP, or in cells not expressing P2X7 receptors (open circles).
We measured the influx of these two fluorescent ions in cells that were voltage-clamped at 0 mV to remove any net flow of smaller ions. Introduction of a fixed positive charge in the permeation pathway (P2X7[T348K]) increased the influx of the anion FITC and decreased the influx of the cation ethidium (Fig. 4A). Removal of a negative charge in the permeation pathway (P2X7[D352N]) had a similar effect (Fig. 4B). A control substitution that did not change the charge in the permeation pathway (P2X7[D352E]) had no effect on the movement of either dye (Fig. 4B,C), and the loss-of-function mutation P2X7[D352A] showed only the low basal influx observed in cells not expressing P2X7 receptors (Fig. 4B,C). It is possible that some of the reduction in ethidium influx observed may result from the reduced expression level of D352N, T348K, and D352N compared with wild type (Fig. 2E). If this is case, then the increases in FITC uptake that were observed would be correspondingly greater. In either case, it implies a marked loss of selectivity.
Figure 4.
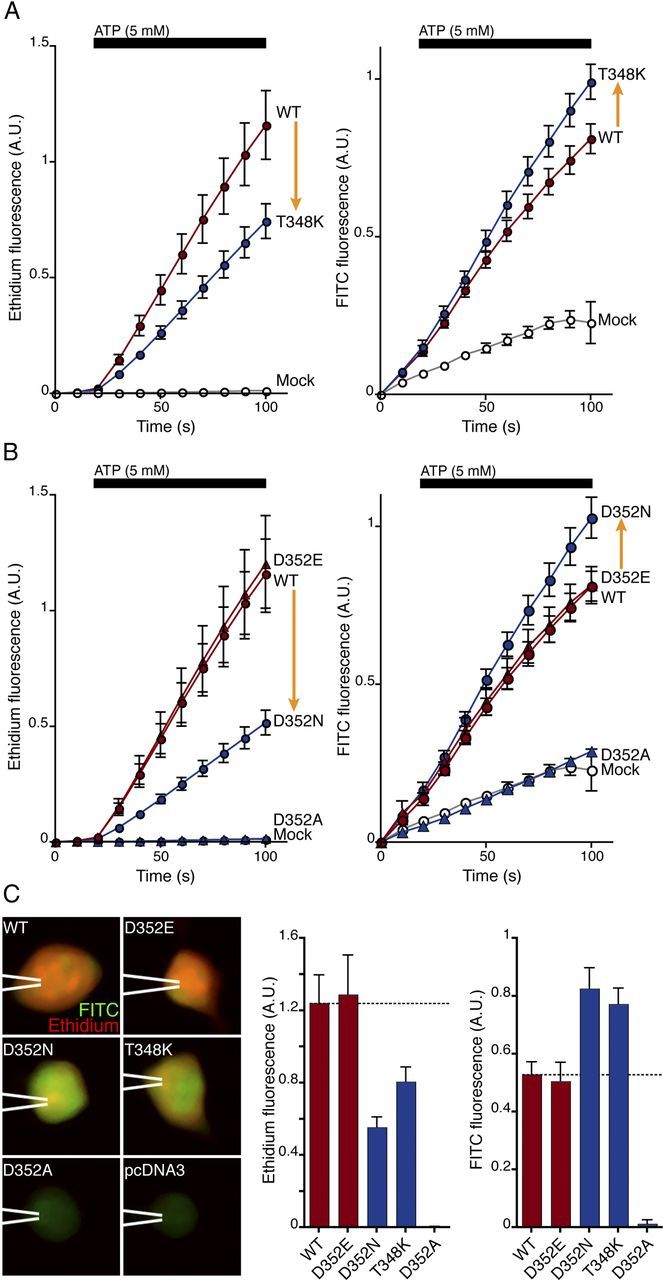
Deep pore mutations change permeability to large dyes. A, B, Simultaneous measurement of ethidium (cationic, left) and FITC (anionic, right) influx evoked by ATP. A, At T348, substitution of positive charge (T to K) decreases cation and increases anion influx (arrows). Mock-transfected cells show no ethidium uptake and only background FITC uptake (open circles). B, At D352, removal of negative charge (D or E to N) decreases cation and increases anion influx (arrows). Cells were held at 0 mV during imaging. C, Left, Merged fluorescence images for ethidium (red) and FITC (green) after ATP application (5 mm, 90 s). pcDNA3 indicates background from mock-transfected cells. Right, Summary of fluorescence intensity changes evoked by ATP (5 mm, 90 s, background signal subtracted). Absolute arbitrary units of ethidium fluorescence and FITC fluorescence were obtained from separate channels (see Materials and Methods); thus, comparisons cannot be made between them. Scale bar, 10 μm. Error bars indicate the SE of the mean for 8–11 cells in each case.
MTSEA-biotin permeates and blocks at an internal engineered cysteine
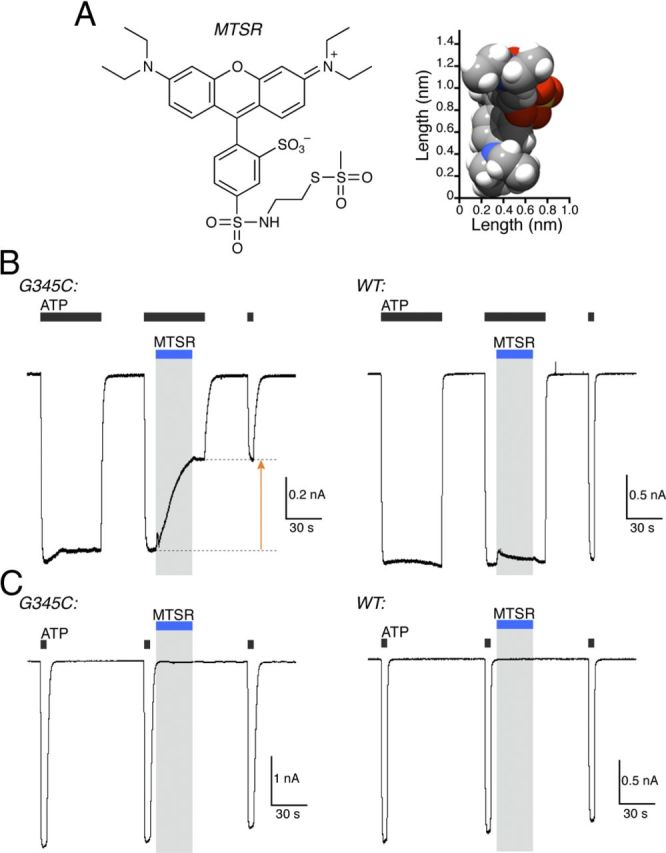
We reasoned that a pore large enough to accommodate ethidium, FITC, and YO-PRO-1 might also be permeable to methanethiosulfonates with bulky side chains, and this might be detected by an irreversible channel-blocking action if they reacted with a cysteine located internal to the narrowest part of the pore. MTSEA-biotin has dimensions of 0.75 × 0.80 × 1.85 nm (Fig. 5A; Table 1). The glycine at position 345 is situated one turn of the TM2 helix internal to the narrowest opening according to our model based on the open zebrafish P2X4 receptor (Hattori and Gouaux, 2012) (Fig. 5B). We therefore first examined the effect of MTSEA-biotin on P2X7[G345C] receptors. In both wild-type and P2X7[G345C] receptors, MTSEA-biotin (1 mm) caused a small, rapid-onset inhibition of the current evoked by ATP (3 mm). This effect was fully reversible on wash out (Fig. 5C), and it was greater at −60 mV (16 ± 3%, n = 5) than at +60 mV (6 ± 1%, n = 5). It was mimicked by MTSEA (−60 mV: 21 ± 4%, n = 5; +60 mV: 10 ± 4%, n = 5). We conclude that this results from reversible channel block rather than covalent modification of the engineered cysteine.
Figure 5.

MTSEA-biotin blocks the open P2X7[G345C] receptor. A, Structures of MTSEA-biotin (left) and MTSEA (right) shown in two-dimensional (top) and three-dimensional (bottom) representations. The space-fill structures are viewed from their smallest two dimensions (as illustrated by the scale bars) with MTSEA-biotin rotated about its glycine linker to show its minimum dimensions. B, View from inside of the closed (left) and open (right) P2X7 pore, showing residues G345 (green), T348 (yellow), and D352 (blue) on the surface of the open permeation path. The β carbons of D352 are 2.7 nm apart in the closed state and 1.7 nm apart in the open state. C, Irreversible open channel block by MTSEA-biotin (1 mm, 30 s, blue bar) at P2X7[G345C] (left) and P2X7[T348C] (middle) receptors, but not wild-type P2X7 receptors (right). Orange arrows indicate irreversible block. The histogram shows the irreversible reduction of current following application of MTSEA-biotin (1 mm, 30 s, gray column) or MTSEA (1 mm, 30 s, white column). D, Block by MTSEA-biotin requires channel opening. MTSEA-biotin (1 mm, blue bar) did not alter currents evoked by ATP (3 mm, 5 s) when applied to the closed channel (i.e., between ATP applications) in cells expressing G345C, T348C, or wild-type receptors. The histogram summarizes the lack of effect of MTSEA-biotin (1 mm, 30 s, gray column) or MTSEA (1 mm, 30 s, white column).
At P2X7[G345C] receptors, application of MTSEA-biotin caused a substantial inhibition of ATP evoked currents (Fig. 5C, orange arrow). A similar effect was observed for T348C receptors, in which the engineered cysteine is positioned one turn of the TM2 helix further into the cell, but there was no irreversible inhibition of the current in wild-type P2X7 receptors (Fig. 5C). In both cases, the action of MTSEA-biotin was mirrored by MTSEA, which is known to permeate open P2X2 receptors (Rassendren et al., 1997). MTSEA-biotin had no effect when applied to closed P2X7 receptors: neither G345C nor T348C receptors showed inhibition of the ATP-evoked current when exposed to MTSEA-biotin without concomitant presence of ATP (Fig. 5D). In all these experiments, the recording electrode contained free cysteine (10 mm).
The rate of entry of ethidium through P2X7[G345C] receptors was also reduced irreversibly by application of MTSEA-biotin. Figure 6 shows ethidium fluorescence (Fig. 6, left) and the rate of change of ethidium fluorescence (Fig. 6, middle) in cells expressing wild-type (black) or G345C receptors (green). In both cases, there was reversible reduction in ethidium entry during application of MTSEA-biotin, which likely resulted from the reversible current block observed (Fig. 5C). However, G345C receptors showed a large irreversible reduction in ethidium uptake resulting from application of MTSEA-biotin. This effect was shared with MTSEA (Fig. 6, right).
Figure 6.

Ethidium entry is blocked by MTSEA-biotin. Ethidium fluorescence rises less rapidly during application of MTSEA-biotin (1 mm, 30 s; left, blue bar). In wild-type receptors (black trace), this recovers on washout; in P2X7[G345C] receptors (green trace), the increase in fluorescence remains suppressed (green trace). Because the ethidium fluorescence is cumulative, this is more readily observed by measuring the first derivative of fluorescence with respect to time (middle). Note the irreversible block on P2X7[G345C] (orange arrow). Fluorescence is normalized to the value at 30 s after beginning ATP application. Right, Summarizes irreversible inhibition of current at wild-type and G345C receptors following application of MTSEA-biotin (1 mm, 30 s, gray columns), and similar results for MTSEA (1 mm, 30 s, white columns). ATP concentration 3 mm.
We performed further control experiments with MTSEA-biotin. It is possible that during activation by ATP the MTSEA-biotin enters the cell through an associated protein, rather than through the central permeation pathway of the P2X7 receptor itself. This seems unlikely, because the free cysteine in the recording pipette would be expected to bind any such diffusing MTSEA-biotin. We tested this in the following way. MTSEA is known to enter cells directly, presumably diffusing across the membrane in its uncharged form (Holmgren et al., 1996). In cells expressing the P2X7[T348C] receptor, but which did not contain any intracellular cysteine, we applied MTSEA (1 mm) to the closed channel. We observed inhibition of the current by 35 ± 4% (n = 5) (Fig. 7), but in cells containing intracellular cysteine there was no significant inhibition (10 ± 3%; n = 5). This implies that the internal cysteine (which was used in all other experiments with methanethiosulfonates) was indeed sufficient to prevent modification from the intracellular aspect of the P2X7 receptor pore.
Figure 7.

MTSEA (1 mm) does not significantly inhibit ATP-evoked currents when applied to closed P2X7[T348C] receptors when the recording pipette contains free cysteine (left). In the absence of free internal cysteine, P2X7[T348C] receptor currents are significantly reduced (right). ATP concentration 3 mm.
To seek corroborative evidence that the MTSEA-biotin passes through the pore of the P2X7 receptor, we measured its attachment to G345C by a biochemical assay. Figure 8 shows that biotinylated P2X7[G345C] receptors were readily detectable in membrane proteins after exposure of the intact cells to extracellular MTSEA-biotin. However, this labeling was seen only after concomitant application of ATP. It was still observed after prior treatment with N-acetylcysteine amide, which is a cell-permeable thiol that might be expected to sequester any MTSEA-biotin that had entered the cells. The finding that labeling was much stronger with P2X7[G345C] than wild-type receptors (Fig. 8, compare lanes e and k, lanes f and l) is most readily explained by MTSEA-biotin reaching G345C by direct permeation of the open channel pore.
Figure 8.

MTSEA-biotin binds to G345C after permeating open P2X7 receptors. HEK293 cells were transfected with empty vector (lanes a, d, g, and j), wild-type P2X7 receptors (lanes b, e, h, and k), or P2X7[G345C] receptors (lanes c, f, i, and l). Cells were then preincubated in the presence (lanes j–l) or absence (lanes a–i) of N-acetylcysteine amide (10 mm, 20 min). ATP was then applied (3 mm, 90 s) in the presence or absence of MTSEA-biotin (300 μm). Biotinylated proteins were purified using neutravidin-agarose beads and separated by SDS-PAGE. P2X7 receptor proteins were revealed using an antibody against the C terminus. MTSEA-biotin bound to wild-type P2X7 receptor protein only when ATP was applied (lanes e and k), and binding was reduced by preincubation with N-acetylcysteine amide (compare lanes e and k). Substantially greater labeling was observed for P2X7[G345C] (lanes f and l), but this was not observed without ATP application (compare lane c).
MTS-rhodamine also permeates and blocks P2X7[G345C] receptors
Sulfo-rhodamine methanethiosulfonate (MTS-rhodamine) is even larger than MTSEA-biotin (Fig. 9A; Table 1), and it carries no net charge. We found that MTS-rhodamine (3 μm) irreversibly inhibited ionic current within a few seconds of application when applied to the open P2X7[G345C] receptor (Fig. 9B). The inhibition was to 0.59 ± 0.02 (n = 8) of the control value. MTS-rhodamine did not change the currents elicited by ATP when it was applied to the closed channel (Fig. 9C) (0.98 ± 0.01, n = 6). In cells expressing wild-type P2X7 receptors, MTS-rhodamine (3 μm) had no effect on ATP-evoked currents whether applied to the closed (0.96 ± 0.02, n = 6) or the open (0.94 ± 0.02, n = 8) channels (Fig. 9B,C). We interpret his observation to indicate that MTS-rhodamine readily permeates the open P2X7 receptor, thiolates the cysteine side chain at position 345, and thereby inhibits ionic current.
Figure 9.
MTS-rhodamine permeates and blocks the open P2X7[G345C] pore. A, Structure of MTS-rhodamine shown in two-dimensional (left) and three-dimensional (right) representations. B, MTS-rhodamine (3 μm, blue bar) strongly inhibits the current evoked by ATP (3 mm, 30 s) in G345C cells when applied to the open channel (i.e., during ATP application). It has no effect on currents evoked by ATP (3 mm, 30 s) in wild-type cells. C, MTS-rhodamine (3 μm, blue bar) did not alter currents evoked by ATP (3 mm, 5 s) when applied to the closed channel (i.e., between ATP applications) in cells expressing G345C or wild-type receptors.
Discussion
More than 30 years ago, extracellular ATP was shown to permeabilize mast cells, allowing the escape of phosphorylated products of intermediary metabolism (Cockcroft and Gomperts, 1979). ATP was subsequently found to cause the uptake of fluorescent dyes with molecular weights of several hundred daltons, such as the cationic dye ethidium by mast cells (Gomperts, 1983) and the anionic dyes Lucifer yellow and 6-carboxyfluorescein by mast cells (Bennett et al., 1981) and macrophages (Steinberg et al., 1987). The receptor involved is considered to be the P2X7 receptor because it is highly expressed in cells of the immune system, and heterologous cells expressing the corresponding cDNA generally respond to ATP with the uptake of fluorescent dyes (Surprenant et al., 1996; North, 2002). There are reasons to suspect that these dyes enter cells by a pathway that is engaged by activated P2X7 receptors, rather than passing directly through the P2X7 receptor itself. First, P2X7 receptors are known to couple to several other intracellular effector molecules (North, 2002), some of which have been implicated in the dye uptake (Donnelly-Roberts et al., 2004). Second, the dye uptake (and the increase in NMDG permeability) is not universally observed in cells where activation of P2X7 receptors causes a typical inward cation current (Petrou et al., 1997) and can be dependent upon expression density (Fujiwara and Kubo, 2004). Third, other potential candidates for the dye uptake pathway have been proposed (Schilling et al., 1999). These include the membrane protein pannexin-1, with which the P2X7 receptor is often associated (Pelegrin and Surprenant, 2006; Locovei et al., 2007).
Fourth, there are discrepancies between the results obtained when YO-PRO-1 uptake and currents carried by NMDG are directly compared (Jiang et al., 2005). Measurement of relative permeability by complete substitution of the extracellular ions (e.g., with NMDG) is commonly used in cellular biophysics. But this can result in complications when removal of the usual small cations (sodium, calcium, magnesium) has effects on the channel protein quite distinct from their permeation (e.g., Armstrong and Miller, 1990). The critical role of extracellular sodium is clearly seen when the P2X7 receptor is activated by agonist in a sodium-free solution: the channel does not close when the agonist is removed, until extracellular sodium (or divalent cations) is also restored (Jiang et al., 2005; Yan et al., 2008; Compan et al., 2012). In contrast to such studies, measurements of dye uptake are typically performed with micromolar concentrations added to a physiological extracellular solution (i.e., normal sodium, calcium and magnesium). We consider that this reports more reliably the properties of the permeation pathway, free of any indirect effects resulting from removal of sodium and/or other external ions. The main purpose of the present study was to probe the permeation of large-molecular-weight dyes in otherwise normal ionic conditions and to test the hypothesis that they pass directly through the P2X7 receptor pore.
The parallel effects of substitutions at T348 and D352 on the permeation of FITC and ethidium and on PCl/PNa support the view that these dyes pass through the same permeation path as small inorganic ions, and indicate that it can reach an effective diameter of at least 1.4 nm. From the change in cell fluorescence observed with application of ATP, it is possible to estimate that FITC enters the cell (volume 1.4 pl) at 2 × 10⁻¹⁹ moles s−1. From the current measurement (typically 10 nA), entry of chloride ions would be 9 × 10⁻¹⁶ moles s−1 (assuming PCl/PNa = 0.01). We do not understand the mechanism by which an altered charge on the wall of the pore selectively changes permeation of a cation or an anion (Cao et al., 2009). Molecules as large as the fluorescent dyes used in the present study would have little bound water, and it may well be that the principal effect of the mutations studied is to change the effective concentration of cation or anion in the vestibular region immediately internal to the narrowest part of the pore (which is presumably at S342, see below). Regardless of the underlying mechanism, the parallel effects of pore mutations on permeation of chloride ions and entry of a negatively charged dye are consistent with ions and dye traversing a very similar pathway.
The experiments with MTSEA-biotin and MTS-rhodamine provide an independent way of estimating a lower limit for the diameter of the open permeation pathway. We selected G345 as the position to test for attachment of these large, neutral sulfydryl-reactive compounds for two reasons. First, we had found that P2X7[G345R] had an increased PCl/PNa relative to wild-type channels, suggesting that the side chain was exposed in the open pore. Second, the residue is situated deeper within the membrane when viewed from the cytoplasmic side, being one and two further turns of the TM2 helix from T348 and D352, respectively. This should make the position less accessible to any MTS-rhodamine that might enter the cell by an alternative pathway. Attachment of either MTSEA-biotin or MTS-rhodamine at this position resulted in a strong inhibition of ionic current that developed with a time constant of a few seconds (Figs. 5C, 9B). The equivalent residue in the P2X2 receptor is G342, positioned at the inner aspect of the closed channel gate (in zebrafish P2X4 this is G350; Kawate et al., 2009) (Fig. 2A). For P2X2 receptors, it has been reported that 2-tripentyl-aminoethl-MTS could penetrate the open pore and block at T339 (equivalent to S342 in the P2X7 receptor; Fig. 2A), whereas Texas Red-MTS (1.10 × 1.25 × 2.00 nm) did not (Li et al., 2010). Our results suggest that the P2X7 receptor, when activated by ATP for several seconds, can achieve a diameter even larger than that of the P2X2 receptor, of at least 1.4 nm (Table 1).
In addition to observing the functional effects of these two large MTS analogs, we demonstrated that G345C could be directly biotinylated by MTSEA-biotin when it was applied to the outside of the cell along with ATP (Fig. 5). None of these observations exclude the possibility that the large MTS compounds are entering the cell by some other pathway (that is also activated by ATP binding to the P2X7 receptor), and diffusing to the inner vestibule of the channel before reacting with G345C. However, we consider this to be unlikely because the cells contained free cysteine at a concentration (10 mm) that was sufficient to block any effect of MTSEA that entered the cell by a mechanism independent of applied ATP (Fig. 7A).
The open channel structure of the zebrafish P2X4 receptor (zfP2X4: Hattori and Gouaux, 2012) indicates a permeation pathway with a constriction of 0.7 nm, provided by side chains of A347 and L351 (these are equivalent to S342 and L346 in the rat P2X7 receptor) (Fig. 2A). There are differences among P2X receptors among the residues that contribute to the narrowest part of the permeation pathway, but there is no reason to suppose that the rat P2X7 pore has a molecular architecture that is otherwise significantly different from zebrafish P2X4. At the narrowest part of the open channel of the zebrafish P2X4 receptor, the Cα atoms of A347 are each 0.64 nm from the central axis (i.e., they lie on a circle with diameter 1.28 nm) (Hattori and Gouaux, 2012). In our model of the rat P2X7 receptor, we found that the equivalent distance for the Cα atoms of S342 is 0.64 nm. Although the structure observed by Hattori and Gouaux (2012) appears large enough to allow permeation of NMDG (0.60 × 0.60 × 1.25 nm), they found that ATP did not evoke any currents in oocytes bathed in an external solution containing 100 mm NMDG (and 0.3 mm calcium, and 1 mm magnesium). More pertinent to the present work, neither the reported zebrafish P2X4 crystal structure nor our own rat P2X7 receptor model derived from it, provide an aperture sufficiently large to allow permeation of the large dyes that we used in the present work. This suggests that the P2X7 receptors can also exhibit a further open state with a considerably wider permeation pathway than that observed in the crystals formed by the truncated zebrafish P2X4 receptor. Such a conformation might be consistent with the helix flexing at G350 (P2X7: G345) that is required to enter the open state (Hattori and Gouaux, 2012). Of interest in this regard is the observation that acid-sensing ion channels, which also form a pore with their three obliquely intersecting TM2 domains, and which can also exhibit dynamic ion selectivity (Lingueglia et al., 1997), have recently been observed to exhibit a narrow and a wide open state depending on the extracellular pH (Baconguis and Gouaux, 2012).
In summary, our results provide direct evidence that large organic dyes can permeate the P2X7 receptor ion channel. The results do not exclude the possibility that other distinct molecular entities can transport dyes in response to P2X7 receptor activation, or that associated molecules such as pannexin-1 are involved in the cell death following prolonged application of BzATP (Gulbransen et al., 2012). They are consistent with other distinct evidence for dynamic selectivity of the P2X receptor permeation pathway (Chaumont and Khakh, 2008; Yan et al., 2008). They renew the question raised 30 years ago (Cockcroft and Gomperts, 1979) as to the physiological significance of the movement of such large molecules across the membranes of immune cells, a question of increasing importance in the nervous system given the widespread expression of P2X7 receptors on microglia, oligodendrocytes, and other astrocytes.
Footnotes
This work was supported by the Wellcome Trust (093,140/Z/10/Z). We thank Rosemary Gaskell for tissue culture.
The authors declare no competing financial interests.
References
- Armstrong CM, Miller C. Do voltage-dependent K+ channels require Ca2+? A critical test employing a heterologous expression system. Proc Natl Acad Sci U S A. 1990;87:7579–7582. doi: 10.1073/pnas.87.19.7579. [DOI] [PMC free article] [PubMed] [Google Scholar]
- Baconguis I, Gouaux E. Structural plasticity and dynamic selectivity of acid-sensing ion channel-spider toxin complexes. Nature. 2012;489:400–405. doi: 10.1038/nature11375. [DOI] [PMC free article] [PubMed] [Google Scholar]
- Bennett JP, Cockcroft S, Gomperts BD. Rat mast cells permeabilized with ATP secrete histamine in response to calcium ions buffered in the micromolar range. J Physiol. 1981;317:335–345. doi: 10.1113/jphysiol.1981.sp013828. [DOI] [PMC free article] [PubMed] [Google Scholar]
- Bo X, Jiang LH, Wilson HL, Kim M, Burnstock G, Surprenant A, North RA. Pharmacological and biophysical properties of the human P2X5 receptor. Mol Pharmacol. 2003;63:1407–1416. doi: 10.1124/mol.63.6.1407. [DOI] [PubMed] [Google Scholar]
- Brake AJ, Wagenbach MJ, Julius D. New structural motif for ligand-gated ion channels defined by an ionotropic ATP receptor. Nature. 1994;371:519–523. doi: 10.1038/371519a0. [DOI] [PubMed] [Google Scholar]
- Browne LE, Cao L, Broomhead HE, Bragg L, Wilkinson WJ, North RA. P2X receptor channels show threefold symmetry in ionic charge selectivity and unitary conductance. Nat Neurosci. 2011;14:17–18. doi: 10.1038/nn.2705. [DOI] [PMC free article] [PubMed] [Google Scholar]
- Cao L, Broomhead HE, Young MT, North RA. Polar residues in the second transmembrane domain of the rat P2X2 receptor that affect spontaneous gating, unitary conductance, and rectification. J Neurosci. 2009;29:14257–14264. doi: 10.1523/JNEUROSCI.4403-09.2009. [DOI] [PMC free article] [PubMed] [Google Scholar]
- Chaumont S, Khakh BS. Patch-clamp coordinated spectroscopy shows P2X2 receptor permeability dynamics require cytosolic domain rearrangements but not Panx-1 channels. Proc Natl Acad Sci U S A. 2008;105:12063–12068. doi: 10.1073/pnas.0803008105. [DOI] [PMC free article] [PubMed] [Google Scholar]
- Chessell IP, Hatcher JP, Bountra C, Michel AD, Hughes JP, Green P, Egerton J, Murfin M, Richardson J, Peck WL, Grahames CB, Casula MA, Yiangou Y, Birch R, Anand P, Buell GN. Disruption of the P2X7 purinoceptor gene abolishes chronic inflammatory and neuropathic pain. Pain. 2005;114:386–396. doi: 10.1016/j.pain.2005.01.002. [DOI] [PubMed] [Google Scholar]
- Clark AK, Staniland AA, Marchand F, Kaan TK, McMahon SB, Malcangio M. P2X7-dependent release of interleukin 1β and nociception in the spinal cord following lipopolysaccharide. J Neurosci. 2010;30:573–582. doi: 10.1523/JNEUROSCI.3295-09.2010. [DOI] [PMC free article] [PubMed] [Google Scholar]
- Cockcroft S, Gomperts BD. ATP induces nucleotide permeability in rat mast cells. Nature. 1979;279:541–542. doi: 10.1038/279541a0. [DOI] [PubMed] [Google Scholar]
- Collo G, North RA, Kawashima E, Merlo-Pich E, Neidhart S, Surprenant A, Buell G. Cloning of P2X5 and P2X6 receptors and the distribution and properties of an extended family of ATP-gated ion channels. J Neurosci. 1996;16:2495–2507. doi: 10.1523/JNEUROSCI.16-08-02495.1996. [DOI] [PMC free article] [PubMed] [Google Scholar]
- Compan V, Ulmann L, Stelmashenko O, Chemin J, Chaumont S, Rassendren F. P2X2 and P2X5 subunits define a new heteromeric receptor with P2X7-like properties. J Neurosci. 2012;32:4284–4296. doi: 10.1523/JNEUROSCI.6332-11.2012. [DOI] [PMC free article] [PubMed] [Google Scholar]
- Davis IW, Leaver-Fay A, Chen VB, Block JN, Kapral GJ, Wang X, Murray LW, Arendall WB, 3rd, Snoeyink J, Richardson JS, Richardson DC. MolProbity: all-atom contacts and structure validation for proteins and nucleic acids. Nucleic Acids Res. 2007;35:W375–W383. doi: 10.1093/nar/gkm216. [DOI] [PMC free article] [PubMed] [Google Scholar]
- Domercq M, Perez-Samartin A, Aparicio D, Alberdi E, Pampliega O, Matute C. P2X7 receptors mediate ischemic damage to oligodendrocytes. Glia. 2010;58:730–740. doi: 10.1002/glia.20958. [DOI] [PubMed] [Google Scholar]
- Donnelly-Roberts DL, Namovic MT, Faltynek CR, Jarvis MF. Mitogen-activated protein kinase and caspase signaling pathways are required for P2X7 receptor (P2X7R)-induced pore formation in human THP-1 cells. J Pharmacol Exp Ther. 2004;308:1053–1061. doi: 10.1124/jpet.103.059600. [DOI] [PubMed] [Google Scholar]
- Duan S, Neary JT. P2X7 receptors: properties and relevance to CNS function. Glia. 2006;54:738–746. doi: 10.1002/glia.20397. [DOI] [PubMed] [Google Scholar]
- Duckwitz W, Hausmann R, Aschrafi A, Schmalzing G. P2X5 subunit assembly requires scaffolding by the second transmembrane domain and a conserved aspartate. J Biol Chem. 2006;281:39561–39572. doi: 10.1074/jbc.M606113200. [DOI] [PubMed] [Google Scholar]
- Färber K, Kettenmann H. Purinergic signaling and microglia. Pflugers Arch. 2006;452:615–621. doi: 10.1007/s00424-006-0064-7. [DOI] [PubMed] [Google Scholar]
- Fujiwara Y, Kubo Y. Density-dependent changes of the pore properties of the P2X2 receptor channel. J Physiol. 2004;558:31–43. doi: 10.1113/jphysiol.2004.064568. [DOI] [PMC free article] [PubMed] [Google Scholar]
- Galzi JL, Devillers-Thiéry A, Hussy N, Bertrand S, Changeux JP, Bertrand D. Mutations in the channel domain of a neuronal nicotinic receptor convert ion selectivity from cationic to anionic. Nature. 1992;359:500–505. doi: 10.1038/359500a0. [DOI] [PubMed] [Google Scholar]
- Gomperts BD. Involvement of guanine nucleotide-binding protein in the gating of Ca2+ by receptors. Nature. 1983;306:64–66. doi: 10.1038/306064a0. [DOI] [PubMed] [Google Scholar]
- Gulbransen BD, Bashashati M, Hirota SA, Gui X, Roberts JA, MacDonald JA, Muruve DA, McKay DM, Beck PL, Mawe GM, Thompson RJ, Sharkey KA. Activation of neuronal P2X7 receptor-pannexin-1 mediates death of enteric neurons during colitis. Nat Med. 2012;18:600–604. doi: 10.1038/nm.2679. [DOI] [PMC free article] [PubMed] [Google Scholar]
- Hattori M, Gouaux E. X-ray structure of the P2X4 receptor-ATP complex defines agonist binding site and mechanism of channel activation. Nature. 2012;485:207–212. doi: 10.1038/nature11010. [DOI] [PMC free article] [PubMed] [Google Scholar]
- Hille B. Ion channels of excitable membranes. Sunderland, MA: Sinauer; 2001. [Google Scholar]
- Holmgren M, Liu Y, Xu Y, Yellen G. On the use of thiol-modifying agents to determine channel topology. Neuropharmacology. 1996;35:797–804. doi: 10.1016/0028-3908(96)00129-3. [DOI] [PubMed] [Google Scholar]
- Jiang LH, Rassendren F, Mackenzie A, Zhang YH, Surprenant A, North RA. N-methyl-D-glucamine and propidium dyes utilize different permeation pathways at rat P2X7 receptors. Am J Physiol Cell Physiol. 2005;289:C1295–C1302. doi: 10.1152/ajpcell.00253.2005. [DOI] [PubMed] [Google Scholar]
- Kawate T, Michel JC, Birdsong WT, Gouaux E. Crystal structure of the ATP-gated P2X4 ion channel in the closed state. Nature. 2009;460:592–598. doi: 10.1038/nature08198. [DOI] [PMC free article] [PubMed] [Google Scholar]
- Keating C, Pelegrin P, Martínez CM, Grundy D. P2X7 receptor-dependent intestinal afferent hypersensitivity in a mouse model of postinfectious irritable bowel syndrome. J Immunol. 2011;187:1467–1474. doi: 10.4049/jimmunol.1100423. [DOI] [PubMed] [Google Scholar]
- Khakh BS, Bao XR, Labarca C, Lester HA. Neuronal P2X transmitter-gated cation channels change their ion selectivity in seconds. Nat Neurosci. 1999;2:322–330. doi: 10.1038/7233. [DOI] [PubMed] [Google Scholar]
- Li M, Kawate T, Silberberg S, Swartz K. Pore-opening mechanism in trimeric P2X receptor channels. Nat Commun. 2010;1:44. doi: 10.1038/ncomms1048. [DOI] [PMC free article] [PubMed] [Google Scholar]
- Lingueglia E, de Weille JR, Bassilana F, Heurteaux C, Sakai H, Waldmann R, Lazdunski M. A modulatory subunit of acid sensing ion channels in brain and dorsal root ganglion cells. J Biol Chem. 1997;272:29778–29783. doi: 10.1074/jbc.272.47.29778. [DOI] [PubMed] [Google Scholar]
- Locovei S, Scemes E, Qiu F, Spray DC, Dahl G. Pannexin 1 is part of the pore forming unit of the P2X7 death complex. FEBS Lett. 2007;581:483–488. doi: 10.1016/j.febslet.2006.12.056. [DOI] [PMC free article] [PubMed] [Google Scholar]
- Matute C, Torre I, Pérez-Cerdá F, Pérez-Samartín A, Alberdi E, Etxebarria E, Arranz AM, Ravid R, Rodríguez-Antigüedad A, Sánchez-Gómez M, Domercq M. P2X7 receptor blockade prevents ATP excitotoxicity in oligodendrocytes and ameliorates experimental autoimmune encephalomyelitis. J Neurosci. 2007;27:9525–9533. doi: 10.1523/JNEUROSCI.0579-07.2007. [DOI] [PMC free article] [PubMed] [Google Scholar]
- Newbolt A, Stoop R, Virginio C, Surprenant A, North RA, Buell G, Rassendren F. Membrane topology of an ATP-gated ion channel (P2X receptor) J Biol Chem. 1998;273:15177–15182. doi: 10.1074/jbc.273.24.15177. [DOI] [PubMed] [Google Scholar]
- North RA. Molecular physiology of P2X receptors. Physiol Rev. 2002;82:1013–1067. doi: 10.1152/physrev.00015.2002. [DOI] [PubMed] [Google Scholar]
- Pelegrín P. Many ways to dilate the P2X7 receptor pore. Br J Pharmacol. 2011;163:908–911. doi: 10.1111/j.1476-5381.2011.01325.x. [DOI] [PMC free article] [PubMed] [Google Scholar]
- Pelegrin P, Surprenant A. Pannexin-1 mediates large pore formation and interleukin-1beta release by the ATP-gated P2X7 receptor. EMBO J. 2006;25:5071–5082. doi: 10.1038/sj.emboj.7601378. [DOI] [PMC free article] [PubMed] [Google Scholar]
- Perregaux D, Gabel CA. Interleukin-1β maturation and release in response to ATP and nigericin. J Biol Chem. 1994;269:15195–15203. [PubMed] [Google Scholar]
- Petrou S, Ugur M, Drummond RM, Singer JJ, Walsh JV., Jr P2X7 purinoceptor expression in Xenopus oocytes is not sufficient to produce a pore-forming P2Z-like phenotype. FEBS Lett. 1997;411:339–345. doi: 10.1016/s0014-5793(97)00700-x. [DOI] [PubMed] [Google Scholar]
- Pettersen EF, Goddard TD, Huang CC, Couch GS, Greenblatt DM, Meng EC, Ferrin TE. UCSF Chimera—a visualization system for exploratory research and analysis. J Comput Chem. 2004;25:1605–1612. doi: 10.1002/jcc.20084. [DOI] [PubMed] [Google Scholar]
- Rassendren F, Buell G, Newbolt A, North RA, Surprenant A. Identification of amino acid residues contributing to the pore of a P2X receptor. EMBO J. 1997;16:3446–3454. doi: 10.1093/emboj/16.12.3446. [DOI] [PMC free article] [PubMed] [Google Scholar]
- Roger S, Pelegrin P, Surprenant A. Facilitation of P2X7 receptor currents and membrane blebbing via constitutive and dynamic calmodulin binding. J Neurosci. 2008;28:6393–6401. doi: 10.1523/JNEUROSCI.0696-08.2008. [DOI] [PMC free article] [PubMed] [Google Scholar]
- Romagnoli R, Baraldi PG, Cruz-Lopez O, Lopez-Cara C, Preti D, Borea PA, Gessi S. The P2X7 receptor as a therapeutic target. Expert Opin Ther Targets. 2008;12:647–661. doi: 10.1517/14728222.12.5.647. [DOI] [PubMed] [Google Scholar]
- Sali A, Blundell TL. Comparative protein modelling by satisfaction of spatial restraints. J Mol Biol. 1993;234:779–815. doi: 10.1006/jmbi.1993.1626. [DOI] [PubMed] [Google Scholar]
- Sanz JM, Di Virgilio F. Kinetics and mechanism of ATP-dependent IL-1β release from microglial cells. J Immunol. 2000;164:4893–4898. doi: 10.4049/jimmunol.164.9.4893. [DOI] [PubMed] [Google Scholar]
- Schilling WP, Wasylyna T, Dubyak GR, Humphreys BD, Sinkins WG. Maitotoxin and P2Z/P2X7 purinergic receptor stimulation activate a common cytolytic pore. Am J Physiol. 1999;277:C766–C776. doi: 10.1152/ajpcell.1999.277.4.C766. [DOI] [PubMed] [Google Scholar]
- Smart OS, Neduvelil JG, Wang X, Wallace BA, Sansom MS. HOLE: a program for the analysis of the pore dimensions of ion channel structural models. J Mol Graph. 1996;14:354–360. 376. doi: 10.1016/s0263-7855(97)00009-x. [DOI] [PubMed] [Google Scholar]
- Steinberg TH, Newman AS, Swanson JA, Silverstein SC. ATP4- permeabilizes the plasma membrane of mouse macrophages to fluorescent dyes. J Biol Chem. 1987;262:8884–8888. [PubMed] [Google Scholar]
- Surprenant A, Rassendren F, Kawashima E, North RA, Buell G. The cytolytic P2Z receptor for extracellular ATP identified as a P2X receptor (P2X7) Science. 1996;272:735–738. doi: 10.1126/science.272.5262.735. [DOI] [PubMed] [Google Scholar]
- Valera S, Hussy N, Evans RJ, Adami N, North RA, Surprenant A, Buell G. A new class of ligand-gated ion channel defined by P2X receptor for extracellular ATP. Nature. 1994;371:516–519. doi: 10.1038/371516a0. [DOI] [PubMed] [Google Scholar]
- Virginio C, MacKenzie A, Rassendren FA, North RA, Surprenant A. Pore dilatation of neuronal P2X receptor channels. Nat Neurosci. 1999a;2:315–321. doi: 10.1038/7225. [DOI] [PubMed] [Google Scholar]
- Virginio C, MacKenzie A, North RA, Surprenant A. Kinetics of cell lysis, dye uptake and permeability changes in cells expressing the rat P2X7 receptor. J Physiol. 1999b;519:335–346. doi: 10.1111/j.1469-7793.1999.0335m.x. [DOI] [PMC free article] [PubMed] [Google Scholar]
- Weisman GA, Camden JM, Peterson TS, Ajit D, Woods LT, Erb L. P2 receptors for extracellular nucleotides in the central nervous system: role of P2X7 and P2Y2 receptor interactions in neuroinflammation. Mol Neurobiol. 2012;46:96–113. doi: 10.1007/s12035-012-8263-z. [DOI] [PMC free article] [PubMed] [Google Scholar]
- Yan Z, Li S, Liang Z, Tomić M, Stojilkovic SS. The P2X7 receptor channel poredilates under physiological ion conditions. J Gen Physiol. 2008;132:563–573. doi: 10.1085/jgp.200810059. [DOI] [PMC free article] [PubMed] [Google Scholar]
- Yan Z, Khadra A, Li S, Tomic M, Sherman A, Stojilkovic SS. Experimental characterization and mathematical modeling of P2X7 channel gating. J Neurosci. 2010;30:14213–14224. doi: 10.1523/JNEUROSCI.2390-10.2010. [DOI] [PMC free article] [PubMed] [Google Scholar]