

Abstract
Background: The previous meal modulates the postprandial glycemic responses to a subsequent meal; this is termed the second-meal phenomenon.
Objective: This study examined the effects of high-protein vs. high-carbohydrate breakfast meals on the metabolic and incretin responses after the breakfast and lunch meals.
Methods: Twelve type 2 diabetic men and women [age: 21–55 y; body mass index (BMI): 30–40 kg/m2] completed two 7-d breakfast conditions consisting of 500-kcal breakfast meals as protein (35% protein/45% carbohydrate) or carbohydrate (15% protein/65% carbohydrate). On day 7, subjects completed an 8-h testing day. After an overnight fast, the subjects consumed their respective breakfast followed by a standard 500-kcal high-carbohydrate lunch meal 4 h later. Blood samples were taken throughout the day for assessment of 4-h postbreakfast and 4-h postlunch total area under the curve (AUC) for glucose, insulin, C-peptide, glucagon, glucose-dependent insulinotropic peptide (GIP), and glucagon-like peptide 1 (GLP-1).
Results: Postbreakfast glucose and GIP AUCs were lower after the protein (17%) vs. after the carbohydrate (23%) condition (P < 0.05), whereas postbreakfast insulin, C-peptide, glucagon, and GLP-1 AUCs were not different between conditions. A protein-rich breakfast may reduce the consequences of hyperglycemia in this population. Postlunch insulin, C-peptide, and GIP AUCs were greater after the protein condition vs. after the carbohydrate condition (second-meal phenomenon; all, P < 0.05), but postlunch AUCs were not different between conditions. The overall glucose, glucagon, and GLP-1 responses (e.g., 8 h) were greater after the protein condition vs. after the carbohydrate condition (all, P < 0.05).
Conclusions: In type 2 diabetic individuals, compared with a high-carbohydrate breakfast, the consumption of a high-protein breakfast meal attenuates the postprandial glucose response and does not magnify the response to the second meal. Insulin, C-peptide, and GIP concentrations demonstrate the second-meal phenomenon and most likely aid in keeping the glucose concentrations controlled in response to the subsequent meal. The trial was registered at www.clinicaltrials.gov/ct2/show/NCT02180646 as NCT02180646.
Keywords: GIP, GLP-1, second-meal phenomenon, type 2 diabetes, postprandial glucose, high carbohydrate, glucagon
Introduction
Research has shown that a prior meal, or lack of, can improve glucose tolerance of a subsequent meal in healthy subjects (1–3) and individuals with type 2 diabetes (T2D)5 (4–6), an effect known as the second-meal phenomenon. Although the second-meal phenomenon has been observed for more than a century (7), the specific mechanism is not well understood and very little research has been conducted examining the occurrence and significance of this response. Previous research has linked the second-meal glucose suppression to a rise in FFA concentrations (4) or to increased rates of muscle glycogen storage (8). An alternative mechanism may be that breakfast acts as a primer to β-cell function allowing for a more effective response to the incretins glucagon-like peptide 1 (GLP-1) and glucose-dependent insulinotropic polypeptide (GIP) at a subsequent meal (6, 9, 10); however, this has not been well studied. Incretins are highly insulinotropic in a glucose-dependent fashion, are important for β-cell integrity, and can be responsible for approximately one-half of the postprandial insulin release (11). Thus, research is needed to determine the role of the incretin hormones in the second-meal phenomenon.
Manipulating the second-meal effect can be performed with meal composition. Previous studies accomplished this by primarily manipulating the carbohydrate composition (1, 12), but more recent research has started to focus on altering the protein content. When a high-protein snack was given 2 h before breakfast to individuals with T2D (4), the postprandial blood glucose AUC was reduced by 40%, an effect possibly attributed to the release of gut-derived signals (13). However, it is unclear if the release of the gut-derived signals (incretins) that increase glucose-induced insulin secretion may impact second-meal glucose responses.
Taken together, there is limited research examining the impact of protein consumption on the second-meal phenomenon and the incretin responses in individuals with T2D. Thus, this study first examined the postprandial glucose and incretin responses to a high-protein vs. a high-carbohydrate breakfast in individuals with T2D and then established if breakfast composition altered these responses to a standard lunch meal (second-meal phenomenon). We hypothesized that a high-protein breakfast would lower blood glucose excursions more so than a high-carbohydrate breakfast, and this response would be associated with enhanced insulin responses induced by increased insulinotropic hormones, GIP and GLP-1. We also speculated that the protein breakfast would diminish the second-meal response of glucose and the incretins. Additionally, we investigated the effects of protein consumption on the postprandial glucagon responses to both meals, because dysregulated glucagon secretion has been reported in individuals with T2D during the postprandial state (14), and a protein-rich breakfast may exacerbate the glucagon response to the subsequent meal.
Methods
Subjects.
The University of Missouri Health Sciences Institutional Review Board approved this study. After providing written informed consent, subjects were screened for study inclusion. Inclusion criteria included individuals aged 21–55 y, BMI of 30–40 kg/m2, fasting glucose of >126 mg/dL, nonsmokers, minimal alcohol consumption, and hemoglobin A1c of 6.5–9.0%. Subjects had to be habitual breakfast consumers (at least 5 breakfasts/wk and consuming >300 kcal). Subjects were excluded if they were on insulin, β-blockers, GLP-1 agonists (e.g., exenatide), or dipeptidyl peptidase inhibitors or experienced recent weight loss. Prescribed medication type or dose was kept constant throughout the study. Medications were stopped the evening before the study morning.
Study design.
Twelve habitual breakfast consumers with T2D completed two 7-d conditions in random order with a washout period of at least 2 wk between study days. They consumed either a high-protein or a high-carbohydrate breakfast for 6 d of acclimatization and on day 7 reported to the lab at 0700-h after an ∼12-h overnight fast. The participants consumed the respective breakfast at ∼0730-h. Four hours postbreakfast subjects consumed a standard lunch meal. Continuous blood sampling was obtained intravenously throughout the 8-h test day via a forearm vein. The BOD POD (COSMED) was used to measure body fat percentage, and the manufacturer's guidelines were followed. Premenopausal women were studied in the early follicular phase.
Test meal.
For 6 consecutive days, the participants were provided with breakfast meals (500 kcal) consisting of waffles and syrup. The protein breakfast contained 45% carbohydrate (26.8 g), 35% protein (43.8 g/26.1 g of egg), and 20% fat, whereas the carbohydrate breakfast was 65% carbohydrate (81.3 g), 15% protein (19.3 g/5.9 g of egg), and 20% fat. The protein and carbohydrate breakfasts were matched for simple sugars (15.3 g), fiber (9.3 g), and fat content (11.0 g). During the testing day, the subjects consumed their respective breakfast at 0800 h with water only (250 mL). Four hours after breakfast, a 500-kcal standardized, high-carbohydrate lunch meal, similar in composition to that of the carbohydrate breakfast meal, was provided. The meal was a turkey sandwich with pretzels and chocolate cake and contained 65% carbohydrate (15.3 g of sugar, 9.3 g of fiber), 15% protein, and 20% fat. Meals were consumed within 10 min.
Dietary records.
On each of the 3 days before the testing day, subjects self-selected their meals and recorded their food intake in dietary records. These records were used in the following trial to replicate the same food consumption on the subsequent study day (15).
Blood collection and analysis.
Blood samples were obtained from the forearm antecubital vein, which was kept patent by a saline drip. Two baseline samples were drawn and after meals, blood samples were drawn frequently (15). Blood samples were transferred into EDTA-coated tubes pretreated with 30 μL of dipeptidyl peptidase IV inhibitor and aprotinin (Millipore).
Blood glucose was measured with the YSI (Yellow Springs Instruments) and plasma FFA concentrations were measured using enzymatic assays (Wako Diagnostics). Plasma hormone concentrations of insulin, C-peptide, glucagon, GLP-1, and GIP were determined using a MILLIPLEX magnetic bead–based quantitative multiplex immunoassay with the MAGPIX instrumentation (Millipore). The CVs for each hormone are as follows: intra-assay CV: C-peptide, 3.4%; GIP, 3.9%; GLP-1, 4.1%; glucagon, 4.7%; insulin, 2.8%; and inter-assay CV: C-peptide, 8.4%; GIP, 8.6%; GLP-1, 10.2%; glucagon, 8.3%; insulin, 4.1%.
Calculations and statistical analysis.
The primary endpoints in this study were the AUC for plasma concentrations of glucose, GLP-1, GIP, and insulin. Before initiating this study, power calculations were conducted (4, 6). On the basis of a 2 × 2 repeated measures design, an anticipated statistical power of 0.80, and an effect size of 0.4, a total sample number of 12 subjects was estimated (G*Power 3 software). The quantitative insulin sensitivity check index was used to determine a surrogate measure of whole-body (presumably mostly muscle) insulin sensitivity (16). The HOMA-IR was used to estimate hepatic insulin resistance (17).
C-peptide concentrations were used to calculate prehepatic insulin secretion rates using the ISEC deconvolution software program (18). Hepatic insulin extraction was estimated by the molar ratio of insulin to C-peptide, as previously described (19).
Postprandial (4 h) breakfast and lunch responses and overall (8 h) responses of all variables were compared using the total AUC, which was calculated using the trapezoidal method (20).
A 2 × 2 ANOVA with repeated measures was used to establish differences in all variables using the SPSS statistical software version 20 (SPSS, Inc.). Main effects of condition (protein vs. carbohydrate), meal order (i.e., breakfast vs. lunch), and condition × meal order interactions are reported. If statistical significance was detected, post hoc multiple pairwise comparisons (Tukey-Kramer) were performed. All tests of significance were set at P ≤ 0.05. All data are presented as mean ± SEM.
Results
Subject characteristics
Twelve subjects with T2D (7 women/5 men) participated. Their mean age was 48.3 ± 2.5 y, BMI was 35.8 ± 1.1 kg/m2, and percent body fat was 41.2% ± 2.3%. Subjects had a fasting glucose of 145 ± 15.7 mg/dL, fasting insulin of 1065 ± 140 pg/mL (protein: 1130 ± 174; carbohydrate: 997 ± 121 pg/mL), and glycated hemoglobin of 7.1 ± 0.25%. Their insulin resistance by HOMA-IR was 5.18 ± 0.78, and their whole-body insulin sensitivity by quantitative insulin sensitivity check index was 0.20 ± 0.01. Of the 12 subjects, 2 were on no medications and 10 took metformin, of whom 1 subject also took glyburide and 1 subject also took glipizide. There was no significant difference in baseline glucose, insulin, C-peptide, GIP, GLP-1, glucagon, or FFA concentrations between study days.
Glucose responses
Both breakfast conditions increased glucose concentrations (P < 0.05), but the overall 8-h glucose AUCs on the protein day were lower than on the carbohydrate day as expected (−10%, P < 0.05; Figure 1A, B). This difference was mostly driven by the attenuated postbreakfast AUC on the protein day compared with the carbohydrate day (−16%, P < 0.05). At 240 min with both meals the glucose concentration was significantly lower than it was before breakfast (P < 0.01) but there was no significant difference by meal composition. There was no difference in the glucose response to the lunch meal between study days (no second-meal phenomenon), but the lunch glucose AUC on the protein day was elevated compared with the postbreakfast response (+17%, P < 0.05).
FIGURE 1.
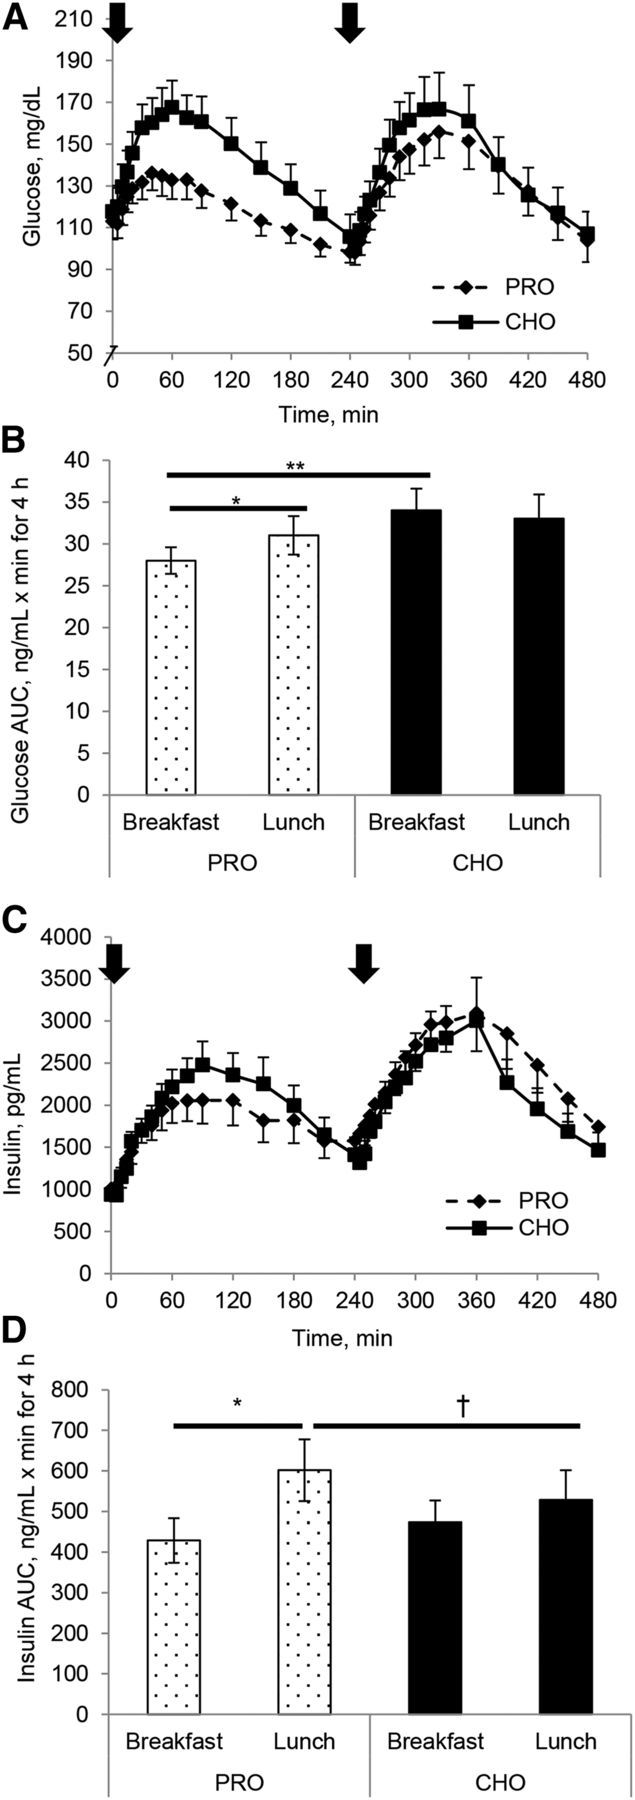
Glucose (A, B) and insulin (C, D) concentration (A, C) and AUC (B, D) responses to either a high-protein or a high-carbohydrate breakfast and a standardized lunch in individuals with T2D. Subjects were studied over an 8-h study day. Arrow indicates when meals were consumed. Values are means ± SEMs, n = 12. *Different between breakfast and lunch, P < 0.05; **Different from corresponding breakfast, P < 0.05; †Different from corresponding lunch, P < 0.05. CHO, carbohydrate breakfast; PRO, protein breakfast; T2D, type 2 diabetes.
Insulin responses
Higher peak insulin concentrations were observed with the carbohydrate breakfast than with the protein breakfast (P < 0.05), but there were no differences in insulin AUC with meal compositions. Postprandial insulin AUC was greater during the second meal (P < 0.01), thus demonstrating the second-meal phenomenon (Figure 1C, D). Closer inspection revealed that the second-meal effect of greater insulin AUC was more pronounced on the protein day, because the postlunch AUC was augmented, compared with the postbreakfast AUC (+29%, P < 0.05), and the breakfast-to-lunch insulin response only increased 11% on the carbohydrate day.
C-peptide responses, hepatic insulin extraction, and insulin secretion
Following a similar pattern as observed with insulin concentrations, there was a significant effect of meal order on C-peptide concentrations (Figure 2A). The postlunch C-peptide AUC was higher than the postbreakfast AUC with both meal compositions (P < 0.05; Figure 2C), primarily because of a 26% increase in postlunch C-peptide AUC compared with the postbreakfast AUC on the protein day (P < 0.05, meal type and order interaction). Postlunch C-peptide AUC only increased ∼8%. Postlunch hepatic insulin extraction was significantly attenuated compared with the postbreakfast AUC for insulin extraction (P < 0.05; Figure 3A). An interaction between meal composition and meal (breakfast vs. lunch) for hepatic insulin extraction approached significance (P = 0.06), indicating that decreased postlunch insulin extraction is mostly attributed to the protein breakfast. The pattern of insulin secretion was similar between the carbohydrate and protein day, and no differences were seen between breakfast and lunch meals (Figure 3C). Total AUC was similar between meal compositions.
FIGURE 2.
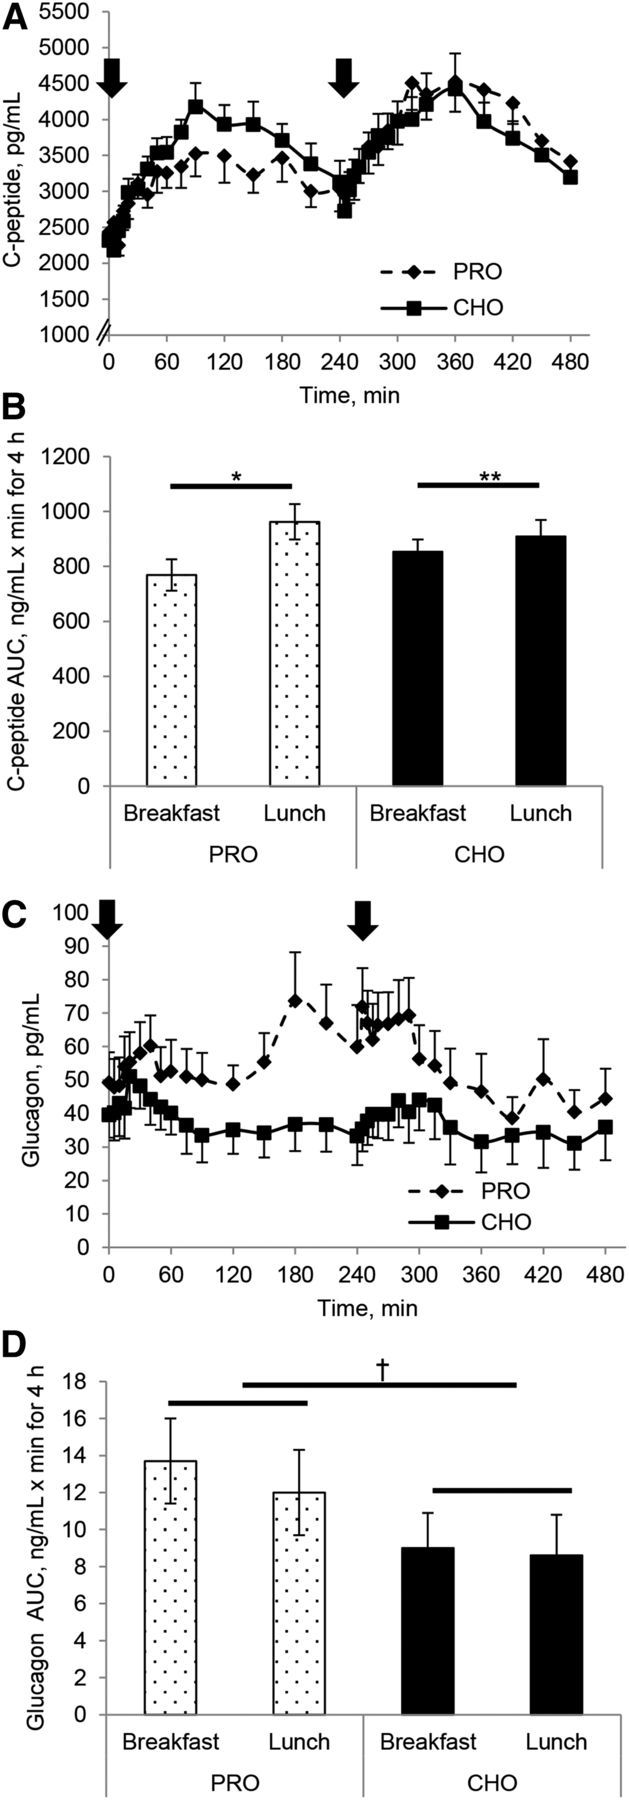
C-peptide concentration (A) and AUC (B) and glucagon concentration (C) and AUC (D) responses to either a high-protein or a high-carbohydrate breakfast and a standardized lunch in individuals with T2D. Arrows indicate when meals were consumed. Values are means ± SEMs, n = 12. *Between breakfast and lunch, P < 0.05; **Different from corresponding lunch, P < 0.05; †Different by meal composition, P < 0.05. CHO, carbohydrate breakfast; PRO, protein breakfast; T2D, type 2 diabetes.
FIGURE 3.
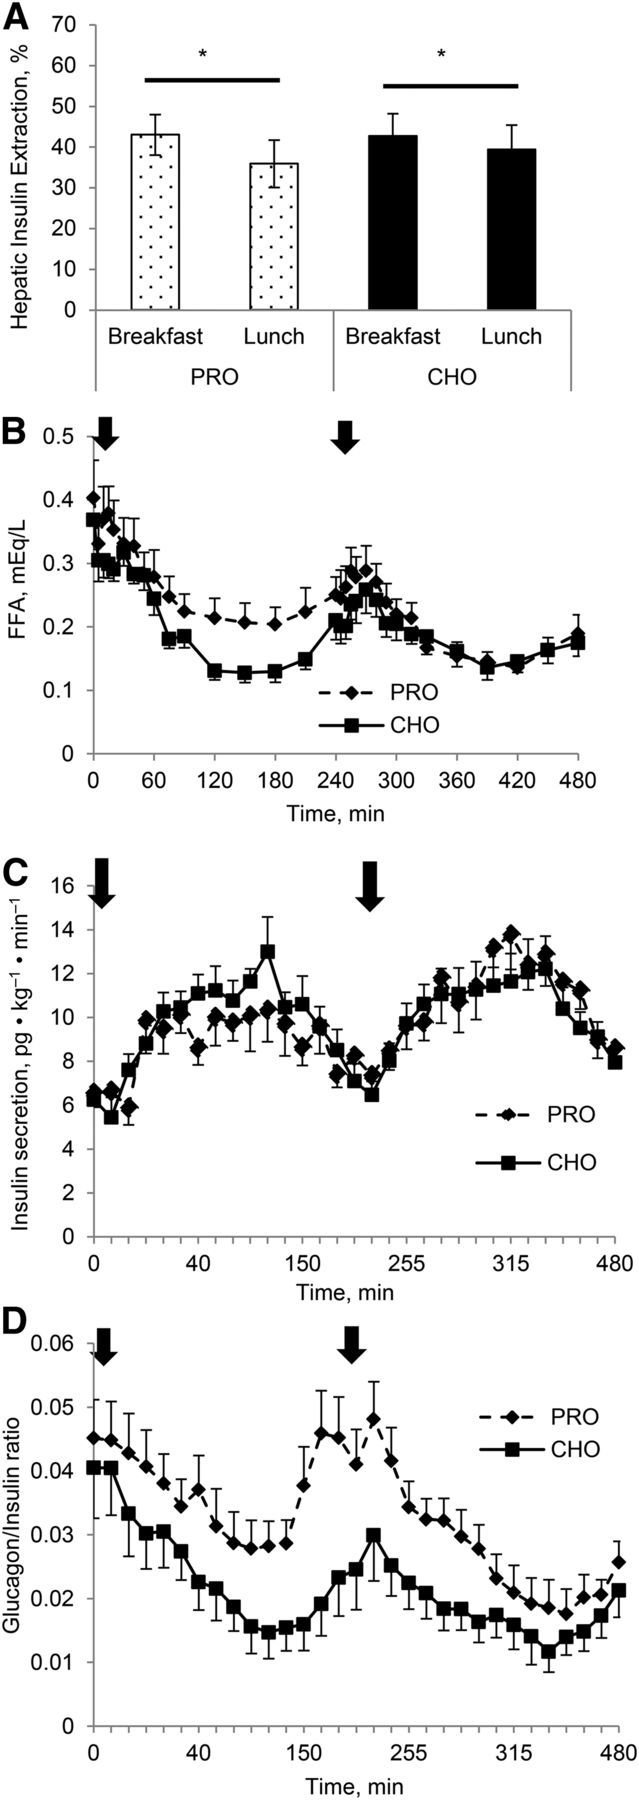
Hepatic insulin extraction AUC (A), FFA concentrations (B), insulin secretion (C), and glucagon/insulin ratio (D) responses to either a high-protein or a high-carbohydrate breakfast and a standardized lunch in individuals with T2D. Arrows indicate when meals were consumed. Values are means ± SEMs, n = 12. *Different between breakfast and lunch, P < 0.05. CHO, carbohydrate breakfast; PRO, protein breakfast; T2D, type 2 diabetes.
Incretin responses
GIP.
Both breakfast conditions increased GIP concentrations significantly (P < 0.05), with a larger increase in GIP AUC with the carbohydrate breakfast (+30%, P < 0.05) than with the protein breakfast. The early GIP response after breakfast was greater on the carbohydrate day than on the protein day (1720 ± 309 pg/mL · min vs. 696 ± 150 pg/mL · min for 60 min, respectively, P < 0.05). Regardless of meal composition, the postlunch GIP AUC was greater than the postbreakfast AUC (protein day: lunch 54% greater; carbohydrate day: lunch 28% greater; P < 0.05; Figure 4A, B), demonstrating a distinct second-meal phenomenon.
FIGURE 4.
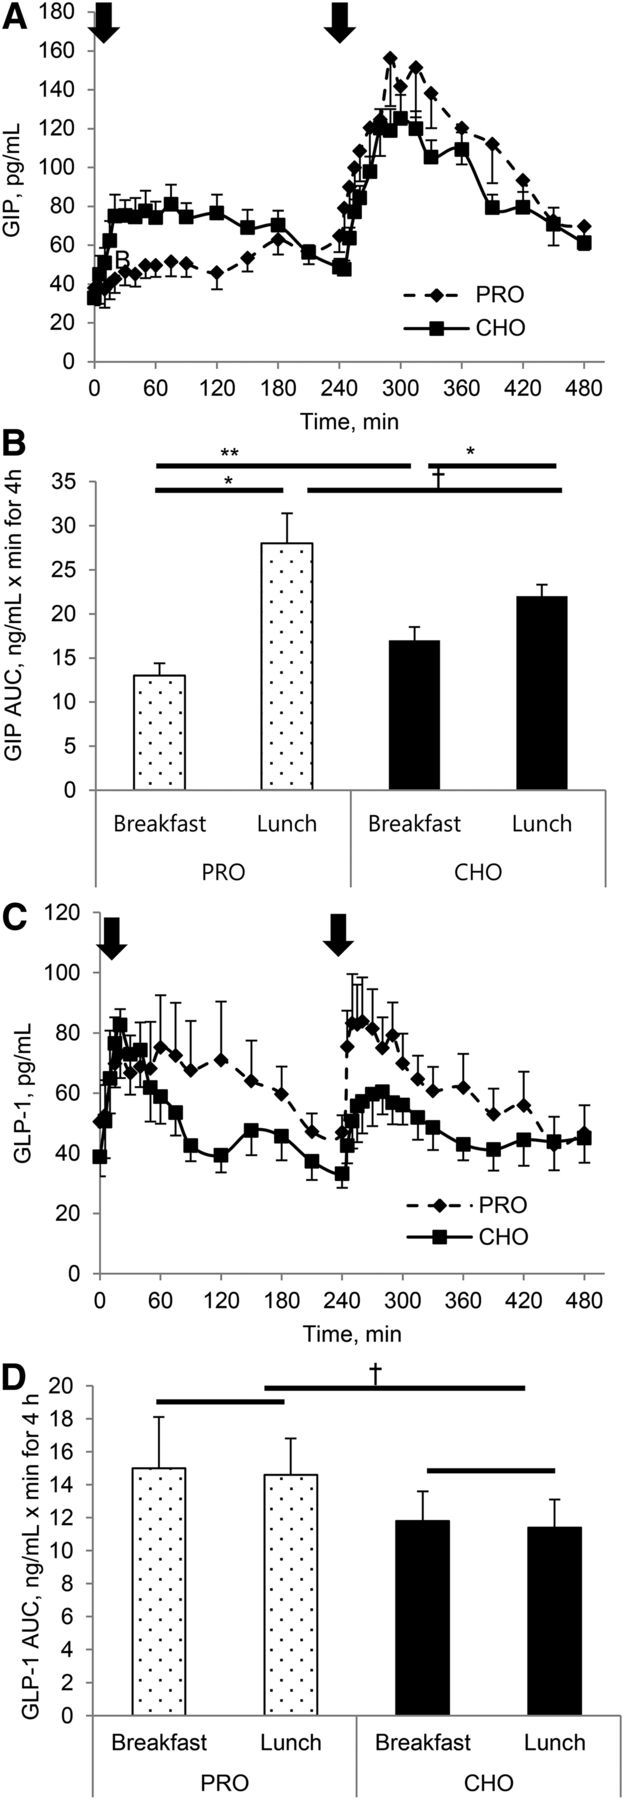
GIP concentration (A) and AUC (B) and GLP-1 concentration (C) and AUC (D) responses to either a high-protein or a high-carbohydrate breakfast and a standardized lunch in individuals with T2D. Arrows indicate when meals were consumed. Values are means ± SEMs, n = 12. *Different between breakfast and lunch, P < 0.05; **Different from corresponding meal compositions, P < 0.05; †Different by meal composition, P < 0.05; ‡Different from corresponding lunch, P = 0.07. CHO, carbohydrate breakfast; GIP, glucose-dependent insulinotropic peptide; GLP-1, glucagon-like peptide 1; PRO, protein breakfast; T2D, type 2 diabetes.
GLP-1.
A significant main effect of meal composition was observed for 8-h GLP-1 AUC. On the protein day, the postprandial GLP-1 AUC was greater than on the carbohydrate day after both breakfast and lunch meals (+27%, P < 0.05; Figure 4C, D). There was no second-meal effect on the GLP-1 AUC.
Glucagon responses
The postmeal glucagon concentrations and AUC were significantly different between the conditions (Figure 2C, D), such that the protein breakfast resulted in a 34% greater glucagon AUC (P < 0.05) than after the carbohydrate breakfast, and the postlunch response was 30% greater after the protein breakfast than after the carbohydrate breakfast. This elevated glucagon response to the breakfast meal started at ∼50 min postbreakfast, declined slightly, and then began to rise again. The augmented glucagon concentrations remained for ∼60 min after the lunch meal, and then decreased considerably. This resulted in a lower late lunch AUC on the protein day than on the carbohydrate day (2990 ± 535 pg/mL · min vs. 2020 ± 655 pg/mL · min for 180 min, respectively; P < 0.05). The glucagon:insulin ratio on the protein day was greater from 40 min postbreakfast until 360 min (2 h after lunch; Figure 3D).
FFA responses
The pattern of response of the FFA to both conditions is shown in Figure 3C. At baseline no differences were observed in the FFA concentrations, but the postprandial FFA concentrations were suppressed more so by the carbohydrate breakfast than by the protein breakfast (P < 0.05). The lowest FFA concentrations were between 120 and 180 min postmeal before beginning to rise again. Similar postprandial changes in the FFA concentrations were observed after the lunch meal.
Discussion
This study identified the postprandial incretin and glucagon responses to a protein-rich breakfast and the subsequent lunch meal in individuals with T2D established if the second-meal phenomenon could be linked to changes in the incretins. The main findings of the study were 1) a protein breakfast attenuated glucose and insulin responses compared with a carbohydrate breakfast and the glucose response to the lunch meal was not magnified after the protein breakfast; 2) GIP and insulin responses were robustly increased at the lunch meal with both meal compositions, demonstrating that a second-meal phenomenon occurred; 3) GLP-1 did not demonstrate a second-meal phenomenon; and 4) glucagon responses were augmented in the late phase of the protein breakfast meal and remained elevated well into the postprandial period of the lunch meal. Thus, in individuals with T2D regardless of the prior meal composition, GIP may contribute to the second-meal phenomenon but GLP-1 does not appear to do so.
Altering meal composition is a clear method for reducing postprandial glycemia and minimizing complications of T2D. In agreement with previous work (21, 22), we observed lower peak glucose concentrations, lower glucose concentrations for a 70-min period, and an attenuated glucose AUC with the protein breakfast compared with the carbohydrate breakfast. Paralleling this were slightly lower insulin concentrations but no difference in insulin secretion or hepatic insulin extraction after the protein breakfast. Likewise, Nuttall et al. (22) and Krezowski et al.(23) showed that ingestion of 50 g of protein with 50 g of carbohydrate reduced glucose AUC 34% compared with ingesting glucose alone; insulin AUC was only modestly greater with glucose alone than protein alone. However, the insulin AUC was considerably greater when glucose was consumed with protein than when glucose or protein was given alone. Likewise, others (21, 24) have demonstrated that the addition of whey protein to meals containing carbohydrates resulted in an insulinotropic effect, thereby reducing glucose concentration. One study (24) demonstrated that augmented insulin concentrations only occurred when 30 g protein was consumed and was more pronounced in those individuals who had medium/high fasting insulin concentrations. In the present study, a 16% lower postprandial glucose response and a 9.5% lower insulin response were observed after a protein breakfast. Thus, discrepancies between our findings and those of prior studies may be because of earlier studies keeping the carbohydrate content constant as they manipulated the protein/fat content, resulting in varying postprandial glucose responses (4, 24, 25), whereas in the present study meals were isocaloric but the protein and carbohydrate content varied.
Prior studies highlight a second-meal phenomenon when breakfast is skipped (5, 6). Recently, Chen et al. (4) showed that a protein snack 2 h before breakfast lowered the glucose AUC by ∼40% in individuals with T2D compared with a morning with no prebreakfast snack. Using a high-dose protein preload (55 g of whey) 30 min before breakfast, Jakubowicz et al. (26) demonstrated attenuated glucose concentrations and augmented insulin concentrations. In the current study, despite differences in breakfast meal composition, a second-meal effect was not observed in the glucose concentrations. Furthermore, despite no lowering of glucose concentrations after lunch, insulin concentrations were elevated after the lunch meal regardless of the breakfast meal composition. Although it appears that both breakfast meals primed the β cells for a robust insulin response to the subsequent meal, improved sensitivity of the tissue is not apparent because the glucose concentrations did not diminish in light of the higher insulin concentrations.
Insulin secretion was similar with both meal compositions and with both meals, whereas hepatic insulin extraction was attenuated in the postlunch response compared with postbreakfast, with a greater reduction in the protein than in the carbohydrate (18% vs. 7%, respectively). One study (24) has suggested that the elevation of insulin concentrations after the protein ingestion may be due to attenuated liver insulin clearance, and another study (27) proposed a GIP-dependent decrease in hepatic insulin extraction would increase peripheral insulin concentrations. Our findings support this because a reduced hepatic insulin extraction was observed simultaneously with increased GIP concentrations and an elevated insulin response.
Growing evidence has demonstrated that a defective incretin response to meals may play a critical role in the progression of insulin resistance (28, 29). The glucose-lowering effect of protein supplementation has been shown to be reduced or absent (30) in individuals with T2D partly because of the lowered release of incretins from intestinal mucosa or the reduced incretin effect on the β cells (11, 31). We demonstrated a robust GIP response to the carbohydrate breakfast meal peaking at ∼30 min, whereas the protein meal resulted in an attenuated GIP response. The insulinotropic impact of GIP is uncertain in individuals with T2D because some research reports a deteriorated secretion and a loss of insulinotropic activity of GIP (28), but this may depend on the degree of metabolic disturbances in individuals with T2D (29). Our data indicate that the meal composition impacts the postprandial GIP response.
Additionally, both breakfast meals increased GLP-1 concentrations to similar peak values. The protein breakfast stimulated an early GLP-1 response and sustained the response postprandially, increasing GLP-1 AUC ∼27% compared with the carbohydrate breakfast. The GLP-1 response to the protein breakfast may have decelerated gastric emptying, which may have helped to lower the postprandial glucose concentrations (32). The sustained GLP-1 release may also assist in suppressing the elevated glucagon concentrations, which may be responding to the lower carbohydrate intake and higher FFA concentrations (33).
This study is novel and is one of the few studies examining the second-meal phenomenon of the incretins. One possible mechanism is that breakfast may act as a primer to the insulin-sensitive tissues either by 1) altering β-cell responses with changed incretin signaling or 2) a change in insulin sensitivity after breakfast. We observed a distinct second-meal effect for GIP concentrations regardless of the breakfast meal composition. This increase mirrors the insulin response during the second meal and it occurred despite our subjects having T2D. Our data indicate that the breakfast meal, regardless of composition, primes the gut, resulting in a profound GIP second-meal effect with the lunch meal. In contrast, GLP-1 does not demonstrate a second-meal effect regardless of the first meal's composition. Both meal compositions increased GLP-1 concentrations in the early phase but the high-protein condition caused a greater late-phase response in GLP-1 concentrations at both meals. Similar to other studies (6, 10) we did not observe a second-meal effect for GLP-1, although the size of the meal and carbohydrate composition of the second meal were similar to that used in our study.
Mixed nutrient meals can simulate increased plasma glucagon concentration (34). We observed that both breakfast compositions elevated the glucagon concentrations initially, but after the carbohydrate meal glucagon concentrations decreased, whereas after the protein breakfast glucagon concentrations rose again late in the postprandial period before the lunch meal and remained elevated for ∼50 min postlunch. No second-meal effect was observed for glucagon responses regardless of the meal composition.
Plasma glucagon concentrations are stimulated to a greater degree by protein meals (35) in individuals with T2D than in nondiabetic controls, regardless of circulating blood glucose concentrations. Despite glucose concentrations in the normal range in individuals with T2D these lower glucose concentrations may be lower than normal, stimulating a glucagon response. Furthermore, the elevated GLP-1 concentrations may decrease glucagon release to prevent hyperglycemia. This dysregulated response is also reflected in the elevated glucagon:insulin ratio. Claessens et al. (36) have also shown in healthy subjects that a carbohydrate drink suppressed the glucagon response but increased when amino acids were added to the drink. This is similar to what we observed in these subjects with T2D. Krebs et al. (37) reported that postprandial amino acid elevation stimulates secretion of insulin and glucagon but does not affect glycemia despite markedly increased gluconeogenesis. They noted that impaired insulin secretion unmasks this direct gluconeogenic effect of amino acids and results in overt hyperglycemia. The lack of glucagon suppression during the postprandial period with relative hyperglycemia has clinical significance and needs further investigation.
One limitation of this study is that we do not have a measure of gastric emptying, and, potentially, there may be differences in gastric emptying with the different meal compositions. Ma et al. (32) demonstrated that whey protein, when given before or with a high-carbohydrate meal, resulted in a reduction in gastric emptying. However, under all conditions there was no difference in emptying by 165 min. In the current study, the protein (egg) was provided with the meal in smaller quantities, and we are confident that the meal was cleared well before the second meal at 240 min. Unfortunately, we did not study healthy individuals to establish if differences would have occurred between groups for the hormonal responses. Additionally, the strength of this study is that the protein was included with the meal and not as a preload (e.g., 30 min or 2 h prebreakfast) as in previous work (4, 26), and the protein quantity was within the range of the recommended daily intake. Furthermore, we provided a 6-d familiarization period for each meal so that we were not studying the acute effect of each diet, respectively.
In conclusion, although we did not see a second-meal effect for glucose, the results of this study are important because they demonstrate that a high-protein breakfast lowers postprandial glucose concentrations and does not magnify the glucose response to the second meal. This first meal appears critical in maintaining glycemic control at the subsequent meal by priming the β cells to increase insulin concentrations and the gut to release GIP, resulting in a second-meal phenomenon. GLP-1 does not show a second-meal phenomenon. Thus, a protein-rich breakfast may be a therapeutic option to reduce the consequences of hyperglycemia in this population.
Acknowledgments
JPT, HJL, and JAK designed research; Y-MP, TDH, YL, LMN, and JAK conducted research; Y-MP, YL, and JAK analyzed data; Y-MP and JAK wrote the paper. JAK had primary responsibility for final content. All authors read and approved the final manuscript.
Abbreviations
- GIP
glucose-dependent insulinotropic peptide
- GLP-1
glucagon-like peptide 1
- T2D
type 2 diabetes
References
- 1. Clark CA, Gardiner J, McBurney MI, Anderson S, Weatherspoon LJ, Henry DN, Hord NG. Effects of breakfast meal composition on second meal metabolic responses in adults with type 2 diabetes mellitus. Eur J Clin Nutr 2006;60:1122–9. [DOI] [PubMed] [Google Scholar]
- 2. Jenkins DJ, Wolever TM, Buckley G, Lam KY, Giudici S, Kalmusky J, Jenkins AL, Patten RL, Bird J, Wong GS, et al. Low-glycemic-index starchy foods in the diabetic diet. Am J Clin Nutr 1988;48:248–54. [DOI] [PubMed] [Google Scholar]
- 3. Wolever TMS, Jenkins DJA, Vuksan V, Jenkins AL, Bucklen GC, Wong GS. Beneficial effect of a low glycemic index diet in type II diabetes. Diabet Med 1992;9:451–8. [DOI] [PubMed] [Google Scholar]
- 4. Chen MJ, Jovanovic A, Taylor R. Utilizing the second-meal effect in type 2 diabetes: practical use of a soya-yogurt snack. Diabetes Care 2010;33:2552–4. [DOI] [PMC free article] [PubMed] [Google Scholar]
- 5. Jovanovic A, Gerrard J, Taylor R. The second-meal phenomenon in type 2 diabetes. Diabetes Care 2009;32:1199–201. [DOI] [PMC free article] [PubMed] [Google Scholar]
- 6. Lee SH, Tura A, Mari A, Ko SH, Kwon HS, Song KH, Yoon KH, Lee KW, Ahn YB. Potentiation of the early-phase insulin response by a prior meal contributes to the second-meal phenomenon in type 2 diabetes. Am J Physiol Endocrinol Metab 2011;301:E984–90. [DOI] [PubMed] [Google Scholar]
- 7. Staub H. Untersuchungen uber den zuckerstoffwechsel des munchen. Z Clin Med 1921;91:44–8. [Google Scholar]
- 8. Jovanovic A, Leverton E, Solanky B, Ravikumar B, Snaar JE, Morris PG, Taylor R. The second-meal phenomenon is associated with enhanced muscle glycogen storage in humans. Clin Sci (Lond) 2009;117:119–27. [DOI] [PubMed] [Google Scholar]
- 9. Munsters MJ, Saris WH. Effects of meal frequency on metabolic profiles and substrate partitioning in lean healthy males. PLoS ONE 2012;7:e38632. [DOI] [PMC free article] [PubMed] [Google Scholar]
- 10. Najjar AM, Parsons PM, Duncan AM, Robinson LE, Yada RY, Graham TE. The acute impact of ingestion of breads of varying composition on blood glucose, insulin and incretins following first and second meals. Br J Nutr 2009;101:391–8. [DOI] [PubMed] [Google Scholar]
- 11. Knop FK, Vilsboll T, Hojberg PV, Larsen S, Madsbad S, Volund A, Holst JJ, Krarup T. Reduced incretin effect in type 2 diabetes: cause or consequence of the diabetic state? Diabetes 2007;56:1951–9. [DOI] [PubMed] [Google Scholar]
- 12. Liljeberg HG, Akerberg AK, Bjorck IM. Effect of the glycemic index and content of indigestible carbohydrates of cereal-based breakfast meals on glucose tolerance at lunch in healthy subjects. Am J Clin Nutr 1999;69:647–55. [DOI] [PubMed] [Google Scholar]
- 13. Knop FK. Comment on: Chen et al. utilizing the second-meal effect in type 2 diabetes: practical use of a soya-yogurt snack. Diabetes Care 2010;33:2552–2554. Diabetes Care 2011;34:e44; author reply e5. [DOI] [PMC free article] [PubMed] [Google Scholar]
- 14. D'Alessio D. The role of dysregulated glucagon secretion in type 2 diabetes. Diabetes Obes Metab 2011;13(Suppl 1):126–32. [DOI] [PubMed] [Google Scholar]
- 15. Heden TD, Liu Y, Kearney ML, Park Y, Dellsperger KC, Thomas TR, Kanaley JA. Prior exercise and postprandial incretin responses in lean and obese individuals. Med Sci Sports Exerc 2013;45:1897–905. [DOI] [PMC free article] [PubMed] [Google Scholar]
- 16. Katz A, Nambi SS, Mather K, Baron AD, Follmann DA, Sullivan G, Quon MJ. Quantitative insulin sensitivity check index: a simple, accurate method for assessing insulin sensitivity in humans. J Clin Endocrinol Metab 2000;85:2402–10. [DOI] [PubMed] [Google Scholar]
- 17. Matthews DR, Hosker JP, Rudenski AS, Naylor BA, Treacher DF, Turner RC. Homeostasis model assessment: insulin resistance and beta-cell function from fasting plasma glucose and insulin concentrations in man. Diabetologia 1985;28:412–9. [DOI] [PubMed] [Google Scholar]
- 18. Hovorka R, Soons PA, Young MA. ISEC: a program to calculate insulin secretion. Comput Methods Programs Biomed 1996;50:253–64. [DOI] [PubMed] [Google Scholar]
- 19. Polonsky KS, Rubenstein AH. C-peptide as a measure of the secretion and hepatic extraction of insulin. Pitfalls and limitations. Diabetes 1984;33:486–94. [DOI] [PubMed] [Google Scholar]
- 20. Pruessner JC, Kirschbaum C, Meinlschmid G, Hellhammer DH. Two formulas for computation of the area under the curve represent measures of total hormone concentration versus time-dependent change. Psychoneuroendocrinology 2003;28:916–31. [DOI] [PubMed] [Google Scholar]
- 21. Frid AH, Nilsson M, Holst JJ, Bjorck IM. Effect of whey on blood glucose and insulin responses to composite breakfast and lunch meals in type 2 diabetic subjects. Am J Clin Nutr 2005;82:69–75. [DOI] [PubMed] [Google Scholar]
- 22. Nuttall FQ, Mooradian AD, Gannon MC, Billington C, Krezowski P. Effect of protein ingestion on the glucose and insulin response to a standardized oral glucose load. Diabetes Care 1984;7:465–70. [DOI] [PubMed] [Google Scholar]
- 23. Krezowski PA, Nuttall FQ, Gannon MC, Bartosh NH. The effect of protein ingestion on the metabolic response to oral glucose in normal individuals. Am J Clin Nutr 1986;44:847–56. [DOI] [PubMed] [Google Scholar]
- 24. Lan-Pidhainy X, Wolever TM. The hypoglycemic effect of fat and protein is not attenuated by insulin resistance. Am J Clin Nutr 2010;91:98–105. [DOI] [PubMed] [Google Scholar]
- 25. Gunnarsson PT, Winzell MS, Deacon CF, Larsen MO, Jelic K, Carr RD, Ahren B. Glucose-induced incretin hormone release and inactivation are differently modulated by oral fat and protein in mice. Endocrinology 2006;147:3173–80. [DOI] [PubMed] [Google Scholar]
- 26. Jakubowicz D, Froy O, Ahren B, Boaz M, Landau Z, Bar-Dayan Y, Ganz T, Barnea M, Wainstein J. Incretin, insulinotropic and glucose-lowering effects of whey protein pre-load in type 2 diabetes: a randomised clinical trial. Diabetologia 2014;57:1807–11. [DOI] [PubMed] [Google Scholar]
- 27. Rudovich NN, Rochlitz HJ, Pfeiffer AF. Reduced hepatic insulin extraction in response to gastric inhibitory polypeptide compensates for reduced insulin secretion in normal-weight and normal glucose tolerant first-degree relatives of type 2 diabetic patients. Diabetes 2004;53:2359–65. [DOI] [PubMed] [Google Scholar]
- 28. Holst JJ. Gastric inhibitory polypeptide analogues: do they have a therapeutic role in diabetes mellitus similar to that of glucagon-like peptide-1? BioDrugs 2002;16:175–81. [DOI] [PubMed] [Google Scholar]
- 29. Vilsbøll T, Krarup T, Madsbad S, Holst JJ. Defective amplification of the late phase insulin response to glucose by GIP in obese type II diabetic patients. Diabetologia 2002;45:1111–9. [DOI] [PubMed] [Google Scholar]
- 30. Pi-Sunyer FX. Glycemic index and disease. Am J Clin Nutr 2002;76:290S–8S. [DOI] [PubMed] [Google Scholar]
- 31. Toft-Nielsen MB, Damholt MB, Madsbad S, Hilsted LM, Hughes TE, Michelsen BK, Holst JJ. Determinants of the impaired secretion of glucagon-like peptide-1 in type 2 diabetic patients. J Clin Endocrinol Metab 2001;86:3717–23. [DOI] [PubMed] [Google Scholar]
- 32. Ma J, Stevens JE, Cukier K, Maddox AF, Wishart JM, Jones KL, Clifton PM, Horowitz M, Rayner CK. Effects of a protein preload on gastric emptying, glycemia, and gut hormones after a carbohydrate meal in diet-controlled type 2 diabetes. Diabetes Care 2009;32:1600–2. [DOI] [PMC free article] [PubMed] [Google Scholar]
- 33. Carr RD, Larsen MO, Winzell MS, Jelic K, Lindgren O, Deacon CF, Ahren B. Incretin and islet hormonal responses to fat and protein ingestion in healthy men. Am J Physiol Endocrinol Metab 2008;295:E779–84. [DOI] [PubMed] [Google Scholar]
- 34. Dunning BE, Gerich JE. The role of alpha-cell dysregulation in fasting and postprandial hyperglycemia in type 2 diabetes and therapeutic implications. Endocr Rev 2007;28:253–83. [DOI] [PubMed] [Google Scholar]
- 35. Raskin P, Aydin I, Yamamoto T, Unger RH. Abnormal alpha cell function in human diabetes: the response to oral protein. Am J Med 1978;64:988–97. [DOI] [PubMed] [Google Scholar]
- 36. Claessens M, Saris WH, van Baak MA. Glucagon and insulin responses after ingestion of different amounts of intact and hydrolysed proteins. Br J Nutr 2008;100:61–9. [DOI] [PubMed] [Google Scholar]
- 37. Krebs M, Brehm A, Krssak M, Anderwald C, Bernroider E, Nowotny P, Roth E, Chandramouli V, Landau BR, Waldhausl W, et al. Direct and indirect effects of amino acids on hepatic glucose metabolism in humans. Diabetologia 2003;46:917–25. [DOI] [PubMed] [Google Scholar]