

Abstract
Synaptic long-term potentiation (LTP) is a key mechanism involved in learning and memory, and its alteration is associated with mental disorders. Shank3 is a major postsynaptic scaffolding protein that orchestrates dendritic spine morphogenesis, and mutations of this protein lead to mental retardation and autism spectrum disorders. In the present study we investigated the role of a new Shank3-associated protein in LTP. We identified the Rho-GAP interacting CIP4 homolog 2 (Rich2) as a new Shank3 partner by proteomic screen. Using single-cell bioluminescence resonance energy transfer microscopy, we found that Rich2-Shank3 interaction is increased in dendritic spines of mouse cultured hippocampal neurons during LTP. We further characterized Rich2 as an endosomal recycling protein that controls AMPA receptor GluA1 subunit exocytosis and spine morphology. Knock-down of Rich2 with siRNA, or disruption of the Rich2-Shank3 complex using an interfering mimetic peptide, inhibited the dendritic spine enlargement and the increase in GluA1 subunit exocytosis typical of LTP. These results identify Rich2-Shank3 as a new postsynaptic protein complex involved in synaptic plasticity.
Introduction
Dendritic spines are the major sites of excitatory glutamatergic synaptic contacts on principal neurons of mammalian brain regions. Learning and memory are associated with a long-term increase in glutamatergic synaptic transmission efficacy, a phenomenon called long-term potentiation (LTP). During LTP, dendritic spines display an increase in their density, head size (Toni et al., 1999), and number of functional postsynaptic AMPA receptors containing GluA1 subunit, thus resulting in stronger synaptic transmission (Malenka and Nicoll, 1999). The cell-surface recruitment of AMPA receptors requires their exocytosis from a reservoir pool of the endosomal-recycling compartment located at the base of the spine (Kelly et al., 2011; Kennedy and Ehlers, 2011).
Dendritic spines display an electron dense structure called postsynaptic density (PSD), which is composed of multidomain proteins forming highly ordered molecular complexes (Sheng and Hoogenraad, 2007). These complexes include scaffolding proteins linking membrane glutamate receptors to intracellular signaling proteins and actin cytoskeleton (Kreienkamp, 2008). The major scaffolding proteins of this complex are the ProSAP/Shank family. They display different binding domains: an ankyrin repeat; a proline-rich region; and SH3, PSD95/disc-large/zona occludens-1 (PDZ), and SAM domains (Naisbitt et al., 1999; Boeckers et al., 2002). Through these domains, Shank interacts with adaptor proteins and assembles glutamate receptors at the postsynaptic membrane (Sheng and Hoogenraad, 2007; Kreienkamp, 2008). Recent work showed that Shank, in combination with the adaptor protein Homer and the endocytic vesicle-associated protein dynamin-3, is required for proper localization of the endocytic zone in close proximity to the PSD (Lu et al., 2007).
Expression of Shank3 induces formation of de novo functional dendritic spines in aspiny cerebellar neurons, whereas knock-down of the protein results in reduced spine density and size in cultured hippocampal neurons (Roussignol et al., 2005). Mutations/deletions of Shank3 have been associated with the 22q13 deletion mental retardation syndrome and autism, thus designating Shank3 as a putative biological substrate for these pathologies (Bonaglia et al., 2006; Durand et al., 2007, 2012). Recent papers reported that deletion of Shank3 induced loss of LTP and decreased surface expression of the AMPA receptor GluA1 subunit in mouse (Bozdagi et al., 2010; Peça et al., 2011; Wang et al., 2011). However, the mechanism of Shank3 action in this phenomenon has not been identified.
In the present study we searched for a Shank3-associated protein that could mediate dendritic spine changes in relation to LTP. We identified a new Rho-GAP protein, Rich2, which interacts with the PDZ domain of Shank3. Rich2 was cloned >10 years ago (Richnau and Aspenström, 2001), but its function has remained largely unknown. Only recently, Rich2 has been shown to tether the CD317 protein in the apical membrane of Caco-2 cells (Rollason et al., 2009).
Here we found that Rich2 is localized at the endosomal recycling compartment in hippocampal neurons. We also showed that induction of LTP triggers Rich2-Shank3 complex formation in dendritic spines and postsynaptic AMPA receptor exocytosis from the recycling compartment, thus supporting the idea that the complex is involved in synaptic plasticity.
Materials and Methods
Peptide affinity chromatography, 2D electrophoresis, and protein identification.
Proteins interacting with the SH3-PDZ domain of rat Shank3 (R539 to D745 residues; accession number Q9JLU4) were isolated in glutathione S-transferase (GST) pull-down assays as previously described (Bécamel et al., 2002). Briefly, solubilized proteins from whole brain of 5- to 6-week-old male Swiss mice (10 mg per assay) were incubated overnight at 4°C with GST fusion proteins (50 μg). After extensive washout, affinity-purified proteins were eluted in isoelectrofocusing medium containing urea (7 m), thiourea (2 m), CHAPS (4%), ampholines (preblended, pI 3.5–9.5, 8 mg/ml; GE Healthcare Europe), dithiothreitol (100 mm), and tergitol NP7 (0.2%; Sigma-Aldrich). They were then resolved onto 2D gels and stained with silver. Gels to be compared were systematically processed and stained in parallel. Stained gels were scanned using a computer-assisted densitometer. Proteins of interest were excised and digested in-gel using trypsin (Gold; Promega). Digested samples were dehydrated in a vacuum centrifuge, solubilized in 10 μl of formic acid (2%) and desalted using C18 ZipTips (elution in 10 μl of 0.1% TFA–50% acetonitrile; Millipore). Analyses were performed using an UltraFlex MALDI-TOF/TOF mass spectrometer (Bruker-Franzen Analytik), as previously described (Thouvenot et al., 2008). Identification of proteins by peptide mass fingerprinting was performed against the Swiss-Prot and TrEMBL databases using the Mascot software package (version 2.1; Matrix Science). The following parameters were used for database interrogation: mass tolerance of 50 ppm; fixed modification, carbamidomethylation of cysteines; variable modification, oxidation of methionines; matching peptides with one missed cleavage were accepted only when they included two consecutive basic residues or when arginine or lysine residues were followed by one or several acidic residues inside the peptide amino acid sequence. Mascot scores >63 or 68 were considered as significant (p < 0.01) for Swiss-Prot or TrEMBL databases interrogation, respectively.
Hippocampal culture and slice preparation.
Neuronal hippocampal cultures were prepared from embryos of either sex of E-17 Swiss mice and grown in Neurobasal medium supplemented with B27 and 10% fetal bovine serum (FBS). Hippocampal neurons were transfected at 9 d in vitro (DIV) with lipofectamine 2000 (Invitrogen) according to the manufacturer's standard protocol. COS-7 cells were plated in DMEM (Gibco-BRL/Life Technology, Invitrogen) supplemented with 4 mm Glutamax, 100 UI/ml penicillin, 100 μg/ml streptomycin, and 10% FBS.
LTP was induced in 18 DIV hippocampal cultures as previously described by Park et al. (2004). Briefly, selective activation of synaptic NMDA receptors was achieved by incubating neurons for 3 min with saturating levels (200 μm) of the co-agonist glycine, in Mg2+-free extracellular medium containing the following (in mm): 150 NaCl, 2 CaCl2, 5 KCl, 10 HEPES, 30 d-glucose, 0.0005 tetrodotoxin (TTX), 0.001 strychnine, 0.02 bicuculline methiodide, pH 7.4, osmolarity 330 mOsm. In some experiments, the NMDA receptor antagonist AP-5 (100 μm) was added to this medium. Neurons were then continuously tested for at least 30 min after the treatment. We will refer to this chemically induced LTP as cLTP.
Miniature excitatory postsynaptic currents (mEPSCs) were recorded in 18 DIV cultured hippocampal neurons, using the whole-cell patch-clamp configuration via an Axopatch 200B amplifier (Molecular Devices). Neurons were perfused with an extracellular recording solution with the following composition (in mm): 140 NaCl, 2 MgCl2, 2 CaCl2, 3 KCl, 10 HEPES, 10 d-glucose, 0.0003 TTX, 0.05 bicuculline, pH 7.4, and osmolarity 330 mOsm. The recording pipettes had a resistance of 3–5 MΩ when filled with the following medium (in mm): 140 KCl, 10 HEPES, 10 d-glucose, pH 7.2, and osmolarity 300 mOsm. Miniature EPSCs were recorded at a holding potential of −65 mV, filtered at 1 kHz and digitized at 3 kHz using the pCLAMP 10 Clampex software (Molecular Devices). Data were then analyzed using the Clampfit software (Molecular Devices). Once >100 events had been collected from a neuron, all the detected events were re-examined and accepted or rejected on the basis of visual examination. The average frequency and amplitude of these events were then measured. Data obtained from the indicated number of cells were expressed as the mean ± SEM and analyzed using the statistical Student's t test.
Hippocampal slices (400 μm thickness) were prepared from 4- to 6-week-old male Sprague Dawley rats and kept at room temperature for at least 1 h in the following Ringer's solution (in mm): before recording, 125 NaCl; 2.5 KCl; 1.3 MgSO4; 1 NaH2PO4; 26.2 NaHCO3; 2.5 CaCl2, and 11 d-glucose, continuously bubbled with 95% O2 and 5% CO2. The slices were then transferred in a recording chamber and continuously perfused with the Ringer's solution at 32°C. Field EPSPs (fEPSPs) were evoked by single pulse stimulation (100 μs) of the Schaffer collateral-commissural afferents, every 30 s, using a bipolar tungsten electrode, and recorded in the CA1 dendritic region by means of a glass micropipette filled with Ringer's solution. Stimulation intensity was adjusted to evoke a half-maximal response. After establishment of stable amplitude fEPSPs, LTP was induced by a high-frequency train electrical stimulation (HFS = 3 trains of 100 pulses at 100 Hz, every 20 s). The initial negative slope of fEPSPs was measured using the pCLAMP 10 Clampfit software. The control value was calculated by averaging the values obtained prior to the HFS. Values measured before and after the HFS were then expressed as percentages of this average value. Data obtained from the indicated number of slices were expressed as mean ± SEM and analyzed using the statistical Student's t test.
Antibodies, DNA constructs, siRNA, and TAT peptides.
A rabbit polyclonal anti-Rich2 antibody was generated by targeting the specific Rich2 sequence: SPDMDPADRRQPEQC. Briefly, cysteine was linked to hemocyanin by SulfoLink according to the manufacturer's protocol (ThermoFisher Scientific) and the complex injected into rabbits using a previously described protocol (Benyamin et al., 1986). The antibody was purified by affinity chromatography using the related peptide coupled to activated-CH Sepharose (GE Healthcare Europe) and characterized as follows. We verified in transfected HEK293 cells that Rich2-GFP fluorescence colocalized with anti-Rich2 immunofluorescence staining. In addition, Western blotting was performed from HEK293 cells transfected with either pCMV-Flag-Rich2 or pCMV-Flag plasmid. The anti-Rich2 antibody revealed a single band at the apparent molecular weight of Rich2 (100 kDa; see Fig. 2A).
Figure 2.

Characterization of the anti-Rich2 antibody and siRNA against Rich2. A, Western blot obtained from HEK293T cells transfected with flag-Rich2 or flag expression plasmids, using a home-made anti-Rich2 antibody, and subjected to SDS-PAGE on 4–12% gels. B, HEK293T cells were transfected with GFP-Rich2 and stained with the anti-Rich2 antibody. The top shows GFP fluorescence, the middle shows Rich2 immunolabeling, and the bottom shows merged images. Scale bar, 10 μm. Note the absence of immunolabeling in nontransfected cells (arrowheads). These images are representative of three independent experiments. C, D, Western blots (top) were obtained from COS-7 cells (C) cotransfected with GFP and flag-Rich2 + either control siRNA (si-control) or siRNA against Rich2 (si-Rich2), and revealed with anti-flag (Rich2-flag lane) and anti-GFP (GFP lane) antibodies. D, Hippocampal neurons were transfected at 9 DIV with either control siRNA (si-control) or si-Rich2. Western blots were performed at 12 DIV and revealed using anti-Rich2 (Rich2 lane) and anti-actin (actin lane) antibodies. The bar graphs (bottom) represent the mean (± SEM, n = 3) immunostaining intensity of Western blots obtained with siRNA control and si-Rich2. Please note the decrease in flag-tagged (C) and endogenous (D) Rich2 obtained with si-Rich2 as compared with control siRNA.
We used a rabbit anti-Shank3 antibody generated as previously described (Proepper et al., 2007) and a rabbit polyclonal anti-Shank3 (Santa Cruz Biotechnology, Tebu-Bio) in immunoprecipitation and immunofluorescence experiments, respectively. Rabbit polyclonal anti-GFP and mouse monoclonal anti-cmyc clone 9E10 antibodies were purchased from Invitrogen and Abcam, respectively. Rabbit polyclonal anti-GluA1-Cter (ref. AB1504) and a mouse monoclonal anti-GluA1-Nter (ref. MAB2263) were purchased from Millipore. For immunofluorescence staining, cells were fixed by 20 min exposure to 4% paraformaldehyde (PFA) in PBS and then washed three times with PBS. In some experiments, cell permeabilization was achieved using PBS supplemented with 2% bovine serum albumin (BSA) and 0.1% Triton X-100. Cells were then incubated for 1 h at room temperature with the appropriate primary antibodies. Mouse or rabbit secondary antibodies coupled to Alexa Fluor 488 (Molecular Probes, Invitrogen) or cyanine 3 (Jackson ImmunoResearch) were added for 1 h at room temperature. Cells were observed under an Axio Imager Z1 Zeiss microscope equipped with ApoTome and appropriate epifluorescence and filters (GFP: 475 ± 40 nm and 530 ± 50 nm; cyanine 3: 545 ± 25 nm and 605 ± 70 nm, for excitation and emission, respectively).
The pEGFP-Shank3, pRK5-cmyc-Shank3, myc-Shank3-ΔPDZ, Rab11-GFP, and Rab11a-S25N plasmids have been described previously (Savina et al., 2002; Roussignol et al., 2005; Tsuriel et al., 2006). The GFP-GluA1 plasmid was obtained from C. Bécamel (Centre National de la Recherche Scientifique (CNRS), Unité Mixte de Recherche (UMR)-5203, Institut de Génomique Fonctionnelle, Montpellier, France), and SEP-GluA1 and SEP-GluA2 from D. Choquet (CNRS, UMR-5297, Institut interdisciplinaire de Neurosciences, Bordeaux, France). Rich2 constructs (Rich2-ΔBAR and Rich2-R291A) were generated from an IMAGE clone of mouse Rich2 (clone 6825221; RZPD German Resource Center for Genome Research, Berlin, Germany). The wild-type and mutant Rich2 cDNAs were cloned in the pCMV-flag2B vector (Stratagene, Agilent Technologies). All mutants were generated by PCR and verified by sequencing. Rich2-Venus used in bioluminescence resonance energy transfer (BRET) experiments was constructed as follows: Venus was inserted in the C terminus of Rich2 between the amino acid sequences 765-STEHPM-770 and 771-VDLDG-775. We verified that the Venus insertion did not modify endosomal localization of the tagged Rich2 protein and its interaction with Shank3 (data not shown). Rluc8-Shank3 was generated by exchange of GFP with Rluc8 on the pEGFP-Shank3 construct.
We generated a specific Rich2 si-RNA (si-Rich2) using the following duplex sequence: 5′-GGUGGCAGCAGACUUCCAA-3′ purchased from Invitrogen. A control siRNA with no significant similarity to mouse, rat, or human gene sequences was also purchased from Invitrogen (ref. AM 4635). This siRNA has been tested by Invitrogen in cell-based screens and proven to have no significant effect on cell proliferation, viability, and morphology. For rescue experiments, we generated an siRNA-resistant Rich2 cDNA mutant (Rich2-mt) with four silent mutations: 5′-gAtggcaAcaAacttcTaa-3′ in pCMV-flag2B-Rich2 plasmid. We first verified the efficacy of the si-Rich2 in COS-7 cells cotransfected with pCMV-Flag-Rich2. The si-Rich2 decreased Rich2 protein expression by >50% (Fig. 2C). Moreover, lysates of 12 DIV hippocampal neurons, transfected with si-Rich2 at 9 DIV, exhibited 54 ± 6.5% decrease in endogenous Rich2 protein expression (Fig. 2D).
The following TAT peptides were purchased from MilleGen: TAT-STAV = YGRKKRRQRRRSPGESMSTAV and TAT-AAA = YGRKKRRQRRRSPGESMSAAA.
Hippocampal cultures were pre-incubated for 15 min and then exposed for the entire duration of the experiment to either one of the TAT peptides (100 nm). Hippocampal slices were pre-incubated in the Ringer's solution containing 250 nm of TAT peptides for 1 h, at room temperature. Slices were then used for electrophysiological recording while continuously perfused with Ringer's solution in the absence of TAT peptide. With a fluorescent version of the peptides, we verified that following the pretreatment, TAT peptides were retained for >1 h in continuously perfused hippocampal slices.
Transferrin-rhodamine pulse-chase experiments.
Transferrin-rhodamine endocytosis and recycling assays were performed as previously described (Park et al., 2006). For the pulse sequence, cultured 12 DIV hippocampal neurons or COS-7 cells were incubated for 30 min at 37°C in a medium containing 20 μg/ml of transferrin-rhodamine (Molecular Probes, Invitrogen). After this period of transferrin-rhodamine uptake, cells were washed twice in PBS and transferrin-rhodamine chased for different periods of time by adding media supplemented with 2 mg/ml of unlabeled transferrin. At the end of the pulse-chase sequence, cells were immediately fixed in ice-cold 4% PFA in PBS, and intracellular remaining rhodamine fluorescence intensity determined with the Safire II fluorometer.
AMPA receptor endocytosis and recycling assays.
GFP-GluA1 surface expression (R1s) was measured using an anti-GFP antibody in nonpermeabilized neurons and expressed as follows: surface GFP immunostaining intensity/total GFP fluorescence intensity. Surface expression of endogenous GluA1 was measured in neurons transfected with GFP as follows. Surface GluA1 subunits were stained in nonpermeabilized neurons using a specific anti-GluA1-Nter antibody (see above). A mask of the portion of analyzed dendrite was created, based on GFP fluorescence, and GluA1 immunostaining intensity was then measured within the limits of the mask. Values were then normalized to total GluA1 immunostaining obtained with a specific anti-GluA1-C-ter antibody after cell permeabilization.
Endocytosis and recycling assays were performed as previously described (Park et al., 2004), with minor modifications. Briefly, for the GFP-GluA1 subunit endocytosis assay, living neurons were pretreated for 30 min with 100 μg/ml leupeptin and then labeled with rabbit anti-GFP antibody for 20 min at 10°C. Internalization of the labeled GFP-GluA1 subunits was then allowed for 30 min by switching temperature to 37°C. After fixation, the remaining surface-labeled GFP-GluA1 subunits were exposed to nonfluorescent anti-rabbit secondary antibody (Sigma-Aldrich) for 12 h at 4°C, to saturate cell-surface anti-GFP antibodies. Cells were then permeabilized and incubated with Cy3-conjugated secondary anti-rabbit antibody for 1 h at room temperature to label internalized GFP-GluA1 subunits labeled with rabbit anti-GFP antibody. GFP-GluA1 endocytosis was calculated according to the following formula: (Ie/It)/R1s, where Ie = intensity of Cy3 immunostaining, It = total GFP fluorescence intensity, and R1s = GFP-GluA1 surface expression calculated as described above.
For AMPA receptor recycling assay, leupeptin-treated living neurons were incubated with rabbit anti-GFP antibody for 20 min at 10°C to label surface GFP-GluA1 subunits. Neurons were then incubated for 30 min at 37°C to allow the subunit internalization. The remaining surface GFP-GluA1 proteins were saturated for 30 min at 10°C with unlabeled anti-rabbit secondary antibody. Neurons were then incubated for an additional 30 min at 37°C to allow recycling of internalized GFP-GluA1 subunits to the plasma membrane. After fixation, GFP-GluA1 proteins reinserted into the plasma membrane were saturated for 12 h at 4°C with nonfluorescent anti-rabbit secondary antibody. Neurons were then permeabilized and incubated with Cy3-conjugated secondary anti-rabbit antibody for 1 h at room temperature. The GFP-GluA1 recycling was calculated according to the following formula: 100 − [(Ir/It × 100)]/(Ie/It), where Ir = intensity of Cy3-immunostaining after recycling, It = total GFP fluorescence intensity, and Ie = intensity of Cy3-immunostaining after endocytosis measured as described above.
All measurements were performed on a given portion of dendrite, after subtraction of background noise fluorescence taken outside the studied neuron.
Colocalization and morphometric analysis of dendritic spines.
Images were acquired using the Axio Imager software (Zeiss) driving a CoolSNAP CCD camera (Photometrics, Roper Scientific). Morphometric and colocalization analyses were performed in different fields from at least three different cultures using the ImageJ software (National Institutes of Health, Bethesda, MD). Spines were defined as dendritic protrusions with a neck and a head. Examples are given in Figure 4D. Dendrites were randomly selected, and spines manually counted over 50 μm length of dendrite. Data were then expressed as density of spines per 10 μm length of dendrite. The same spines were used to measure the area of their head. Each spine was manually traced and the surface calculated using the ImageJ software. All experiments were conducted in a double-blind manner and repeated at least in three different cultures analyzing n >10 dendrites for each condition. Morphometric experiments were performed on fixed cells and live neurons in elapsed time. For colocalization analysis, immunofluorescent images were merged, sorted, and colocalized pixels counted using the ImageJ software.
Figure 4.

Involvement of Rich2 in cLTP-associated spine modifications. A, Example traces of mEPSCs recorded in 18 DIV cultured hippocampal neurons, before (control) and 45 min after cLTP induction, in the same neuron (upper and middle traces, respectively). Similar experiments were performed in a different neuron treated with the NMDA receptor antagonist AP-5 during the cLTP stimulation protocol (lower trace). B, C, mEPSCs mean (± SEM) amplitude (B) and frequency (C) obtained in the conditions of A (n = 5 for each condition, *p < 0.01). D–G, Hippocampal neurons were transfected at 15—17 DIV with GFP alone or in combination with Rich2 or the indicated Rich2 mutants, or si-Rich2 alone or with Rich2-mt, and analyzed 24 h later. D, Illustrates GFP fluorescence in dendrites of live neurons at time t = 0 min, t = 20 min, and t = 40 min after the cLTP induction. The bottom is a magnification of the framed area of the top and illustrates spine morphology and density changes after cLTP induction. Arrows and arrowheads point to spine morphological change and new spine/protrusion after cLTP induction, respectively. Scale bar, 1 μm. E, G, Bar graphs represent mean (± SEM) percentage variations in spine density (E) and size of spine head (G) measured 30 min after cLTP induction. F, Each dot plot represents the size of spine head obtained before (control) and 30 min after the cLTP induction, in the absence and presence of Rich2. The straight line is the mean of the corresponding population of values (control, n = 5; Rich2, n = 4; Rich2-ΔBAR, n = 4; Rich2-R291A, n = 6; si-Rich2, n = 4 and si-Rich2 + Rich2-mt, n = 4 neurons; *p < 0.01).
Fluorescence recovery after photobleaching measurements.
The N terminus of GluA1 and GluA2 subunits was tagged with the pH-sensitive GFP variant super ecliptic pHluorin (SEP-GluA1, SEP-GluA2; Miesenböck et al. 1998). This tagging allows us to distinguish between surface receptors that show green fluorescence to intracellular receptors that display no fluorescence. Thus, it allows monitoring receptor exocytosis during cLTP. Neurons were cotransfected with either SEP-GluA1 or SEP-GluA2 and different Rich2 constructs. Twenty-four hours post-transfection, they were then placed in an open chamber at 37°C, and imaged on an inverted Zeiss LSM780 laser-scanning confocal microscope equipped with appropriated lasers with the definite focus module of Zeiss. The sequence of actions was as follows: (1) first image acquisition, (2) photobleaching, (3) second image acquisition, (4) cLTP induction, and (5) image acquisition every 4 min for 30 min after photobleaching to measure fluorescence recovery. To avoid any interference of fluorescence from lateral unbleached areas during fluorescence recovery after photobleaching (FRAP) measurement, a 30 μm portion of dendrite was photobleached and a 15 μm region at the center of the bleached area was then analyzed. Photobleaching was performed using a 10 s light flash, with a wavelength of 488 nm with 100% power (25 mW). SEP-GluA1 or SEP-GluA2 exocytosis was calculated by measuring FRAP at different times. Values were then expressed as percentage of FRAP relative to the fluorescence (fluo) measured before photobleaching (t0), according to the following equation: % FRAP = fluo(t)/fluo(t0) × 100, where t = time.
Electron microscopy.
Brains from male Sprague Dawley rats were dissected and fixed by immersion with PBS containing 4% PFA and 0.5% glutaraldehyde for 24 h at 4°C. Coronal sections (100 μm) were cut with a vibroslicer. After careful rinsing with PBS, sections were successively incubated: (1) for 48 h at 4°C with the rabbit anti-Rich2 antibody (1:100 dilution) or without antibody (control), (2) for 12 h at 4°C with a peroxidase-linked Fab fragment of goat anti-rabbit IgG (Biosys, 1:1000 dilution), and finally (3) with 0.1% 3,3′-diaminobenzidine diluted in 0.05 m Tris buffer, pH 7.3, in the presence of 0.2% H2O2. Primary and secondary antibodies were diluted in PBS containing 1% BSA and 0.1% saponin. Immunostained sections were rinsed in 0.1 m cacodylate buffer, pH 7.3, postfixed in 1% OsO4 in the same buffer, dehydrated in graded concentrations of ethanol and embedded in Spurr Kit resin (Sigma-Aldrich). Punches of 1 mm diameter were cut into ultrathin sections from the hippocampus and cerebellum, and observed with an electron microscope.
BRET measurements.
BRET measurements in cell population have been previously described (Pfleger and Eidne, 2006). HEK293 cells coexpressing Rluc8 (Rluc8-Shank3, GluA1-Rluc8), Venus (Rich2-Venus, GluA1-Venus), and yellow fluorescent protein (YFP) (YFP-SAP97) constructs were monitored using a spectrophotometric plate reader (MITHRAS LB 940; Berthold Technologies). Rluc8 catalyzes oxidation of coelenterazine H (CoelH), thus leading to light emission and BRET with Venus or YFP. For titration experiment, the BRET signal was plotted as a function of total fluorescence over total luminescence signal. The ratio was used as an index of the concentration of YFP or Venus over Rluc8-tagged proteins. Coexpression of a constant level of Rluc8-tagged proteins with increasing concentrations of Venus-tagged proteins gives rise to a hyperbolical increase in BRET signal, only if the two proteins specifically interact. Saturation of the BRET signal is reached when all donor molecules are linked to the acceptor compounds, thus validating the specificity of the interaction. Conversely, a nonsaturating signal is obtained from random collisions between tagged proteins, thus indicating nonspecific protein–protein interactions.
Single-cell BRET imaging has been previously described (Coulon et al., 2008). Images were obtained at room temperature on a motorized Axiovert 200 Zeiss microscope equipped with a Plan-Apochromat 63×/1.40 Oil M27 objective). Transfected cells were first identified using a mercury light source and appropriate filters to excite YFP (excitation HQ480/40 #44001, emission HQ525/50 #42017, Chroma). The light source was then switched off until the end of the experiment. CoelH (20 μm) was applied 5 min before image acquisition. Images were collected at 480 and 535 nm wavelengths using emission filters (D480/60nm, #61274, Chroma and HQ535/50nm, #63944, Chroma) with a cascade 512B camera (Photometrics) for 40 s sequential acquisitions performed at 5 MHZ, gain: 3950, binning: 1. Pixel-by-pixel ratios were calculated of each image by dividing the absolute pixel fluorescence intensities obtained at 535 nm over 480 nm using MetaMorph software (Molecular Devices). These ratios were translated into a continuous 256 pseudocolor look-up table for visualization. To determine the average intensity and subcellular localization of BRET signals, we calculated the mean intensity and SD of the 535/480 pixel ratios within given square cell regions, using ImageJ software. BRET background unspecific signal (noise) was measured from hippocampal neurons transfected with Rluc8-Shank3 and YFP. A mean value of 0.510 ± 0.016 (n = 3) was obtained and subtracted from measurements (net BRET). However, for better clarity, the BRET background was not subtracted in the BRET images of the following figures.
Statistical analysis.
Values were expressed as mean ± SEM of at least three independent experiments. In bar graphs, they were compared with control using Student's t test except when specified in the legend. FRAP and BRET curves were compared with control using two-way ANOVA test. Values of p < 0.05 were considered as significantly different.
Results
Rich2 is a new brain Rho-GAP protein partner of Shank3
To identify new partners of Shank3, we performed pull-down experiments using a GST fusion protein that includes the SH3 and PDZ domains of Shank3, followed by 2D gel and mass spectrometry analyses (Fig. 1A). We found a new protein, Rich2, whose structure displays a C-terminal PDZ ligand motif (amino acids STAV), one N-BAR and one Rho-GAP domains (Fig. 1B). This protein belongs to the same family as Rich1/Nadrin and the Abl-binding protein 3BP-1 (Richnau and Aspenström, 2001; Tcherkezian and Lamarche-Vane, 2007).
Figure 1.
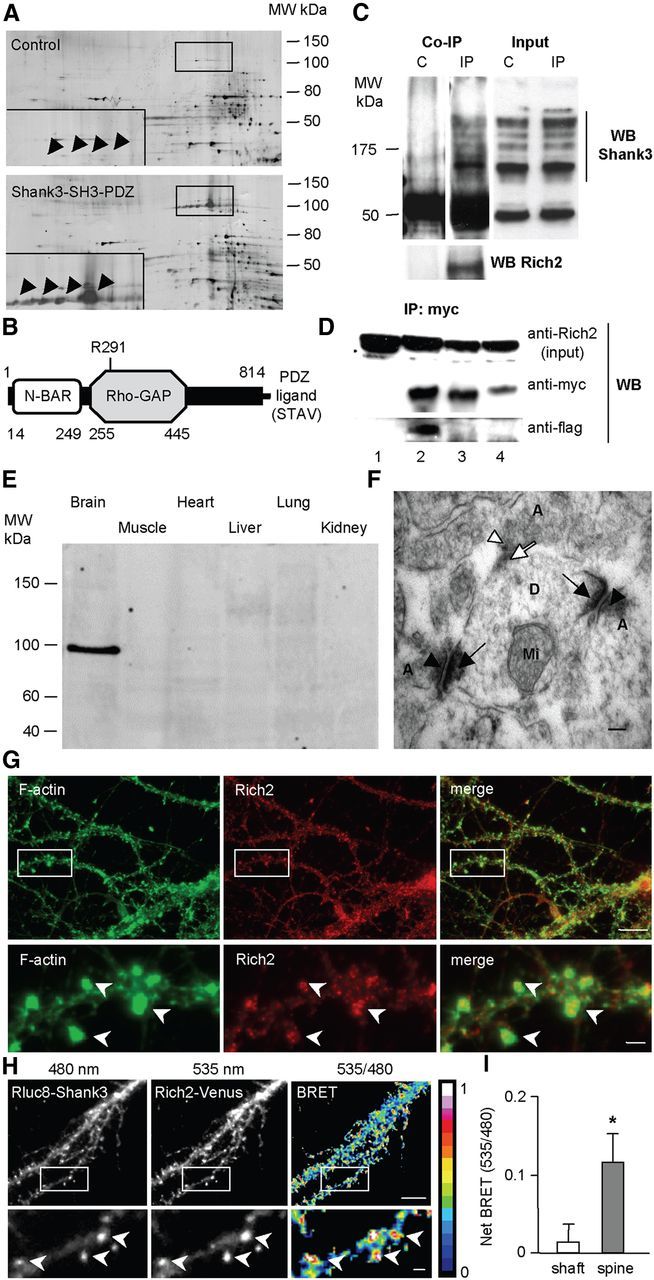
Characterization of the Rich2–Shank3 interaction. A, Silver-stained 2D gels of GST pull-down experiments using GST alone (control) and the Shank3 SH3-PDZ domain fused to GST (Shank3-SH3-PDZ). The images are representative of four independent experiments. The framed area is magnified in the left bottom corner of each gel and corresponds to the position of the Rich2 protein (arrowheads). B, Schematic view of the Rich2 protein structure. It displays an N-terminal BAR domain, a Rho-GAP domain, and a C-terminal PDZ ligand motif (STAV). Numbers indicate the starting and ending amino acids of the respective domains. C, Coimmunoprecipitation experiment performed in brain lysate prepared from E18.5 mice, with and without anti-Rich2 antibody (IP and C lanes, respectively). Immunoprecipitated proteins (Co-IP) and input were subjected to Western blot analysis. Anti-Shank3 (top) and anti-Rich2 (bottom) antibodies revealed specific bands. D, Immunoprecipitation experiments of wild-type and mutant versions of flag-Rich2 and myc-Shank3 performed in transfected COS-7 cells, using an anti-myc antibody. Lane 1: flag-Rich2 + GFP; lane 2: flag Rich2 + myc-Shank3; lane 3: flag-Rich2 + myc-Shank3 ΔPDZ; and lane 4: flag-Rich2AAA + myc-Shank3. Anti-myc and anti-flag antibodies were used for Western blot analysis. Note the absence of immunoprecipitation of flag-Rich2 with the myc-Shank-ΔPDZ mutant, and flag-Rich2-AAA mutant with myc-Shank3. E, Rich2 localization in different tissues from P9 rats. Note that Rich2 was exclusively detected in brain. These data are representative of three independent experiments. F, Electron microscopy image obtained from a P1 newborn rat using an anti-Rich2 antibody. Dark arrows and arrowheads indicate Rich2-immunopositive postsynaptic and presynaptic sites, respectively. White arrows and arrowheads indicate Rich2-immunonegative postsynaptic and presynaptic sites, respectively. A, axon; D, dendrite; Mi, mitochondria. Scale bar, 50 nm. Note the presence of Rich2 at presynaptic and postsynaptic sites. Similar results were obtained from P22 rat. Data are each representative of three independent experiments. G, A representative 18 DIV hippocampal neuron treated with phalloidin-FITC and anti-Rich2 antibody to visualize F-actin and endogenous Rich2, respectively. Note the accumulation of Rich2 in dendritic spines (arrowheads). Scale bars: top, 5 μm; bottom, 1 μm. H–I, BRET images and quantification obtained from 15 DIV hippocampal neurons transfected with Rluc8-Shank3 and Rich2-Venus. Scale bars: left upper, 5 μm; left bottom, 1 μm respectively). Note that highest intensity BRET signals were located in spines (arrowheads), thus suggesting a preferential interaction between the two proteins in spines. The bar graph (I) represents the mean (± SEM) net BRET signal intensity in shafts and spines obtained from seven neurons (*p < 0.01).
To confirm the interaction between Rich2 and Shank3 in vivo, we performed coimmunoprecipitation experiments from embryonic (E18.5) mouse brain extracts, using a specific homemade anti-Rich2 antibody (Fig. 2A,B; Materials and Methods for antibody characterization). We found that Shank3 coimmunoprecipitated with Rich2 (Fig. 1C). In the total extracts, several bands were detected with our Shank3-antibody. Such bands have previously been shown to correspond to several isoforms of Shank3 (Proepper et al., 2007). These results confirmed the formation of a Rich2-Shank3 complex in mouse brain.
The PDZ ligand motif of Rich2 could be responsible for its interaction with Shank3. To confirm this hypothesis in cellulo, we generated a Shank3 mutant deleted of its PDZ domain (myc-Shank3-ΔPDZ) and a Rich2 mutant in which the PDZ ligand motif (STAV) was replaced by three alanine residues (Rich2-AAA). We then cotransfected these tagged mutants, respectively, with flag-Rich2 and myc-Shank3 in COS-7 cells. Rich2 coimmunoprecipitated with Shank3 in cells expressing the wild-type proteins, but not the Rich2-AAA or Shank3-ΔPDZ mutants (Fig. 1D). This result indicated that the PDZ domain of Shank3 and the C terminus of Rich2 are required for the formation of the Rich2-Shank3 complex.
We studied the localization of Rich2 in rat tissues. At postnatal day 9 (P9), Western blot analyses revealed the presence of Rich2 in rat brain, but not in peripheral tissues such as skeletal muscles, heart, liver, lung, and kidney (Fig. 1E). Electron microscopy analyses at P1 (Fig. 1F) and P22 (data not shown) revealed a strong immunolabeling of the protein at both the presynaptic and postsynaptic sites in most CA1 hippocampal synapses (Fig. 1F).
In cultured hippocampal neurons, from 11 to 21 DIV, Rich2 displayed a ubiquitous distribution in both the somatodendritic and axonal compartments (data not shown). This was consistent with the histochemical electron microscopy results (Fig. 1F). In 18 DIV hippocampal neurons, staining of F-actin with FITC phalloidin showed accumulation of Rich2 at the head of dendritic spines, and to a lesser extent in dendritic shafts (Fig. 1G). Endogenous Rich2 extensively colocalized with Shank3-GFP and partially with the presynaptic protein Bassoon (data not shown), suggesting a localization of the protein in both dendritic spines and axon terminals. Here we chose to focus on Rich2 in dendritic spines.
BRET is a very sensitive method to study protein–protein interaction in living cells (for review, seePfleger and Eidne, 2006). In this assay, the efficacy of the energy transfer depends on the close proximity (<10 nm) and orientation of the donor and acceptor entities. The average radius of proteins being 5 nm, the occurrence of resonance energy transfer is taken as a strong indication that the protein attached to the energy donor is in immediate proximity or even in direct contact with the protein attached to the acceptor. We recently adapted the BRET technology to microscopic observation (see Materials and Methods) to monitor subcellular localization of protein–protein interactions in single living cells (Coulon et al., 2008). Here we used single-cell BRET imaging to investigate the subcellular localization of Rich2 and Shank3 interaction in living cultured hippocampal neurons. To this end we fused the energy acceptor protein Venus to an intramolecular domain of Rich2 and the energy donor Renilla luciferase (Rluc8) to the N terminus of Shank3 (see Materials and Methods). Then we established the optimal concentration ratio of Rich2 and Shank3 to be used for BRET measurements in HEK293 cell population, and finally performed single-cell BRET imaging in 15 DIV hippocampal neurons. We found higher net BRET signal intensity in dendritic spines than shaft, thus suggesting a preferential Rich2–Shank3 interaction in spines as compared with the shaft of the dendrite (Fig. 1H,I).
Rich2 is involved in endosomal recycling and controls the recycling of the GluA1 subunit of AMPA receptors to the cell surface
Knowing that N-BAR domains are often associated with membrane curvature (Richnau et al., 2004), namely in endocytotic vesicles (Fütterer and Machesky, 2007), we speculated that Rich2 could be involved in endocytotic/recycling processes. The GTPase Rab11 controls the vesicular transport from recycling endosomes to the plasma membrane (Sönnichsen et al., 2000; Zerial and McBride, 2001). Therefore this protein was taken as a specific marker of the endosomal-recycling compartment.
In 11 DIV hippocampal neurons, transfected Rich2 colocalized with Rab11-GFP- (Fig. 3A), which suggested that Rich2 is involved in endocytosis/recycling processes. To test this hypothesis we used classical rhodamine-labeled transferrin (transferrin-rhodamine) pulse-chase experiments, with a specific Rich2 siRNA (si-Rich2; Fig. 2C,D; si-Rich2 characterization) in neurons. Si-Rich2 decreased transferrin-rhodamine recycling (Fig. 3B). We further studied the role of Rich2 in endosomal recycling in COS-7 cells. Recombinant Rich2, but not Rich2-ΔBAR and Rich2-R291A (which lacks the Rho-GAP activity; Rollason et al., 2009) mutants, increased transferrin-rhodamine recycling (Fig. 3C). These results suggested that Rich2 regulates endosomal recycling and that both its N-BAR and Rho-GAP domains are involved.
Figure 3.
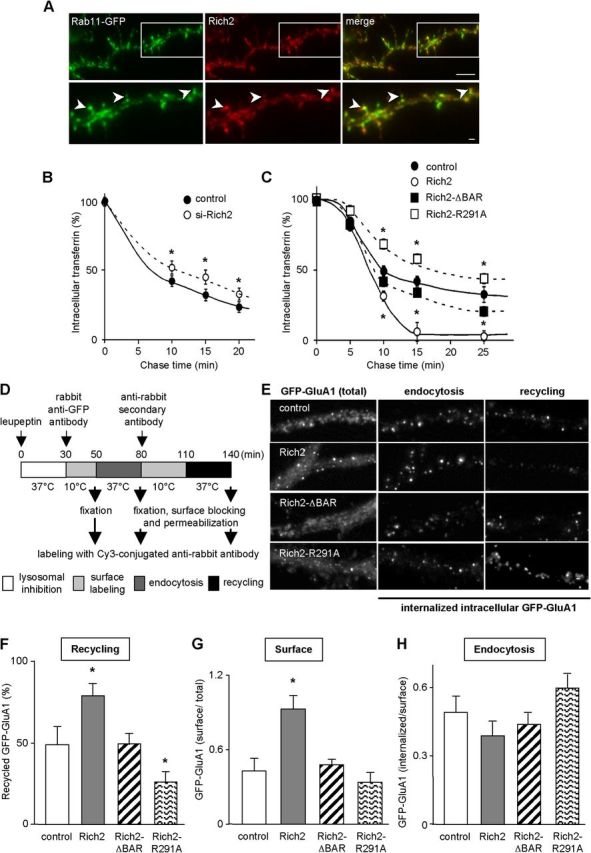
Involvement of Rich2 in endosomal recycling of transferrin and GluA1 subunits. A, Dendritic portion of a hippocampal neuron cotransfected with Rich2 and Rab11-GFP constructs at 11 DIV, and immunostained with anti-Rich2 antibody at 12 DIV. The bottom is a magnification of the framed area of the top. Note the colocalization of the two proteins in spines (arrowheads) Scale bars: upper, 5 μm, bottom, 1 μm. B, Pulse-chase experiments of transferrin-rhodamine performed in 11 DIV hippocampal neurons transfected with control siRNA or Rich2 siRNA (si-Rich2; *p < 0.05, n = 3 experiments). C, Pulse-chase experiments of transferrin-rhodamine performed in the absence (control) and presence of Rich2 or the indicated Rich2 mutants, in COS-7 cells. Each value of the plot represents the mean (± SEM; *p < 0.05, n = 3) percentage of intracellular transferrin-rhodamine fluorescence measured at different times after the pulse (see Materials and Methods). Note the increase and blockade of transferrin-rhodamine recycling (disappearance of intracellular fluorescence) in the presence of Rich2 and Rich2 mutants, respectively. D, Illustration of the protocol used in the following live-cell antibody feeding experiments (E–H). Hippocampal neurons were transfected at 14 DIV with GFP-GluA1 alone (control) or in combination with Rich2, Rich2-ΔBAR, or Rich2-R291A. Live-cell antibody feeding experiments were then performed at 15 DIV. Surface, internalized, and recycled GFP-GluA1 were labeled as illustrated in D and quantitative fluorescence microscopy was monitored as described (see Materials and Methods). E, Left, Total (intracellular + surface) GFP-GluA1 fluorescence. Middle and right illustrate internalized intracellular GFP-GluA1 immunostaining after 30 min endocytosis, and after 30 min recycling, respectively. Note that a decrease in internalized intracellular GFP-GluA1 immunostaining intensity corresponds to an increase in GFP-GluA1 recycling. Scale bar, 1 μm. F, The bar graph represents the mean (± SEM) recycled GFP-GluA1 after 30 min, in the absence (control) and presence of the indicated Rich2 expression plasmids. G, The bar graph in represents the mean (± SEM) surface GFP-GluA1 subunit immunostaining normalized to total GFP fluorescence performed in nonpermeabilized neurons. H, The bar graph represents the mean (± SEM) internalized GFP-GluA1 after 30 min normalized to GFP-GluA1 surface immunostaining (control, n = 15, Rich2, n = 29; Rich2-ΔBAR, n = 13; Rich2-R291A, n = 20 neurons obtained from 3 independent experiments; *p < 0.05).
We then examined whether Rich2 controlled the recycling of AMPA receptors to the cell surface (Fig. 3D–H). Live-cell antibody feeding experiments (see Materials and Methods; Fig. 3D) were performed in 15 DIV hippocampal neurons, 1 d after they were cotransfected with the AMPA receptor GluA1 subunit tagged with GFP on its N-terminal extracellular domain (GFP-GluA1), and Rich2, Rich2-R291A, or Rich2-ΔBAR. Rich2 increased GFP-GluA1 cell-surface recycling as compared with the control condition. The Rich2-R291A mutant had an opposite effect (reduced recycling), while the Rich2-ΔBAR mutant did not significantly alter GFP-GluA1 recycling (Fig. 3E,F). The Rich2-induced enhancement of GFP-GluA1 cell-surface recycling was accompanied by an increase in the AMPA receptor subunit accumulation at the cell surface in steady-state condition (Fig. 3G). On the other hand, none of the Rich2, Rich2-R291A, and Rich2-ΔBAR constructs significantly modify GluA1 endocytosis (Fig. 3E,H). These results indicated that Rich2 could promote exocytosis of GluA1 AMPA receptors from recycling endosomes in hippocampal neurons through its Rho-GAP domain.
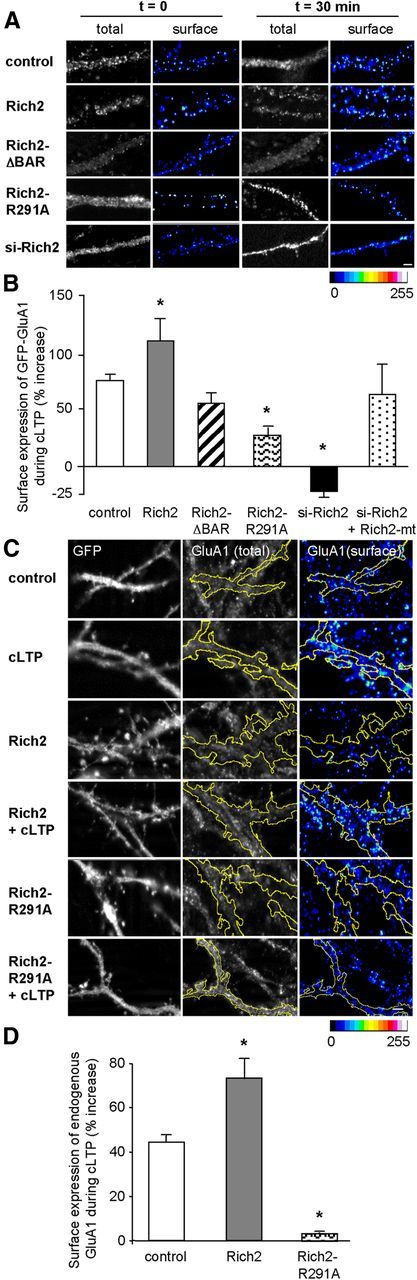
Rich2 is required for LTP expression
Increased surface expression of AMPA receptor GluA1 subunits is a key phenomenon for LTP expression (Park et al., 2004). Our data suggested that Rich2 controls GluA1 cell-surface recycling, thus leading us to investigate the role of Rich2 in LTP. Chemical LTP was induced in 18 DIV hippocampal neurons (see Materials and Methods; Lu et al., 2001) and analyses were performed 45 min after the chemical stimulation. First, we verified that such a protocol effectively potentiated synaptic transmission. The chemical stimulation increased the amplitude and frequency of mEPSCs. Co-application of the NMDA antagonist AP-5 abolished these effects (Fig. 4A–C), thus confirming the efficacy of cLTP induction via an NMDA receptor-mediated mechanism. Second, as previously published (Park et al., 2004, 2006), we found that the cLTP was characterized by an increase in spine density and in the size of the spine head (Fig. 4D–G), as well as by an increase in the number of surface GluA1 subunits (Fig. 5A,B). Transfection of Rich2 significantly increased, whereas si-Rich2 significantly reduced or abolished these effects on density of spines (Fig. 4D,E) and cell-surface GluA1 expression (Fig. 5A,B). Overexpression of the si-RNA-resistant Rich2-mt in si-Rich2-treated neurons rescued the effects of cLTP (Figs. 4E, 5B).
Figure 5.
Effect of Rich2 on cLTP-associated GluA1 surface expression. A, B, Hippocampal neurons were transfected at 15–17 DIV with GFP alone or in combination with Rich2, or the indicated Rich2 mutants, or si-Rich2 alone or si-Rich2 + Rich2-mt, and analyzed 24 h later. A, Total GFP-GluA1 fluorescence and cell-surface GFP-GluA1 immunostaining in dendrites of fixed neurons, before (t = 0) and 30 min after cLTP induction. Surface immunostaining intensity is represented using pseudocolors (same scale bar applies to A and C). B, Shows the mean (± SEM) percentage change in cell-surface GluA1 immunostaining intensity normalized to total GFP fluorescence, measured 30 min after cLTP induction in neurons transfected with the indicated Rich2 expression plasmids (control, n = 29; Rich2, n = 18; Rich2-ΔBAR, n = 19; Rich2-R291A, n = 18; si-Rich2, n = 27; si-Rich2 + Rich2-mt, n = 15 neurons from 3 independent experiments; *p < 0.01). Scale bar, 1 μm. Please note that si-Rich2 abolished the increase in surface GFP-GluA1 induced by the cLTP induction, and this effect was rescued by Rich2-mt overexpression (si-Rich2 + Rich2-mt). C, D, Hippocampal neurons were transfected with GFP alone (control) or in combination with either Rich2 or Rich2-R291A mutant and subjected or not (control) to cLTP induction. GFP fluorescence (left), total GluA1 immunostaining revealed with an antibody directed against the C terminus of GluA1 after neuron permeabilization (middle) and surface GluA1 immunostaining revealed with an antibody directed against the N terminus of GluA1 in nonpermeabilized neurons (right). The yellow lines in the middle and right represent the limits of GFP fluorescence. D, The bar graph was obtained from experiments illustrated in C and represents the mean (± SEM) percentage of surface increase in endogenous GluA1 immunostaining normalized to total GluA1 immunostaining, 30 min after the cLTP induction (control, n = 26; Rich2, n = 24; Rich2-R291A, n = 16 neurons, *p < 0.01). Scale bar, 1 μm.
Spine size analysis showed that overexpression of Rich2 increased the average size of spine head (Fig. 4F, compare open diamonds with open circles). In these neurons, cLTP induction gave rise to a population of spines with larger head than in non-transfected neurons (Fig. 4F, compare crosses with filled squares). Si-Rich2 abolished this effect, which was rescued by the si-RNA-resistant Rich2-mt (Fig. 4G). Together these data showed that Rich2 potentiated spine enlargement and increased surface GluA1 expression during cLTP.
As the Rich2 BAR domain was involved in Rich2 localization in the endosomal recycling compartments (see above), we examined the implication of this domain in cLTP. Deletion of the BAR domain (Rich2-ΔBAR) abolished the effect of Rich2 on spine density, spine size, and GluA1 surface expression during cLTP (Figs. 4D,E,G, 5A,B). Similarly, we tested the role of the Rich2 Rho-GAP domain in cLTP. The Rich2-R291A mutant abolished the increase in spine density and size of spine head, and significantly reduced the increase in surface GluA1 expression associated to cLTP. Similar experiments were performed on endogenous GluA1 subunits. As expected, cLTP induction triggered an increase in the surface expression of endogenous GluA1. Wild-type Rich2 significantly enhanced the increase in GluA1 surface expression during cLTP. On the other hand, the Rich2-R291A mutant abolished this effect (Fig. 5C,D). Altogether these results showed that Rich2 controls cLTP via its Rho-GAP and BAR domains.
We then examined the effect of Rich2 on GluA1 exocytosis during cLTP using the SEP-GluA1 construct in FRAP experiments. Chemical LTP was induced immediately after photobleaching, and fluorescence recovery of SEP-GluA1 was then measured every 4 min (Fig. 6A,B). The amplitude of SEP-GluA1 fluorescence recovery obtained 30 min after stimulation was significantly increased as compared with control (without chemical stimulation: basal recovery; Fig. 6C). To determine whether exocytosis of SEP-GluA1 after the cLTP induction was due to endosomal recycling, hippocampal neurons were transfected with a dominant-negative mutant of Rab11 (Rab11a-S25N) that has been shown to block exocytosis from recycling endosomes (Brown et al., 2007). The Rab11a-S25N mutant significantly decreased the fluorescence recovery of SEP-GluA1, which confirmed that exocytosis of the AMPA receptor subunit resulted from endosomal recycling, rather than cell-surface targeting of newly synthesized subunits (Fig. 6C).
Figure 6.

Involvement of Rich2 on cLTP-associated AMPA receptor exocytosis. A, Illustration of the protocol used in the following FRAP experiments (B–F). Hippocampal neurons were transfected at 15 DIV with SEP-GluA1 or SEP-GluA2 and subjected to FRAP measurement at 16—18 DIV. They were photobleached and then chemically stimulated to induce cLTP. Images were taken every 4 min as indicated in the figure (arrows), to measure SEP-GluA1 or SEP-GluA2 subunit exocytosis. B, Sample images taken at the indicated times. SEP-GluA1 fluorescence represented in pseudocolor obtained in the absence (control) and presence of Rich2 (n = 12) or Rich2-R291A mutant (n = 10), before (t = −5 min) and every 4 min after photobleaching. C, Time course of SEP-GluA1 FRAP obtained in the absence (basal) and after induction of cLTP in non-cotransfected neurons (cLTP) and in neurons expressing Rab11a-S25N (cLTP + Rab11a-S25N) (n = 4). The SEP-GluA1 recovery was significantly increased by cLTP versus basal (p < 0.001, two-way ANOVA, Fisher's LSD test) and decreased by overexpression of Rab11a-S25N versus cLTP (p < 0.001, two-way ANOVA, Fisher's LSD test). D, Time course of SEP-GluA1 FRAP obtained in the absence (control) and presence of transfected Rich2 (n = 12) and Rich2-R291A mutant (n = 10) after induction of cLTP. The SEP-GluA1 recovery was significantly increased by Rich2 versus control (p < 0.05, two-way ANOVA, Fisher's LSD test) and decreased by overexpression of Rich2-R291A versus control (p < 0.001, two-way ANOVA, Fisher's LSD test). E, F, Same legend as in B and C, but for SEP-GluA2 (Rich2, n = 6) and Rich2-R291A mutant (n = 8) after induction of cLTP. The SEP-GluA2 recoveries of Rich2 or Rich2-R291A versus control were not significantly different (two-way ANOVA, Fisher's LSD test). Scale bars: B, E, 1 μm.
We then measured the effects of Rich2 on the increase in SEP-GluA1 exocytosis due to cLTP induction. Cotransfection of Rich2 significantly increased the rate of SEP-GluA1 fluorescence recovery after cLTP induction. On the other hand, the Rich2-R291A mutant was significantly less effective (Fig. 6B,D).
To determine whether the effect of Rich2 was specific to the GluA1 subunit, we performed similar experiments on the SEP-GluA2 subunit. Contrary to SEP-GluA1, neither Rich2 nor Rich2-R291A modified the effect of the cLTP induction on SEP-GluA2 fluorescence recovery (Fig. 6E,F). Altogether these results showed that Rich2 controls the increase in GluA1, but not GluA2 exocytosis in cLTP.
The Shank3–Rich2 complex controls GluA1 exocytosis and LTP
We first examine whether Shank3 PDZ domain was involved in the control of cell-surface recycling of GluA1 AMPA receptor subunit, in hippocampal neurons. Shank3, but not the Shank3-ΔPDZ mutant that does not interact with Rich2, increased GluA1 subunit plasma membrane localization and recycling (Fig. 7A–C). Neither Shank3 nor Shank3-ΔPDZ modified GluA1 subunit endocytosis (Fig. 7A,D). We then analyzed whether the Shank3 PDZ interaction-mediated effects involved interaction with Rich2.
Figure 7.
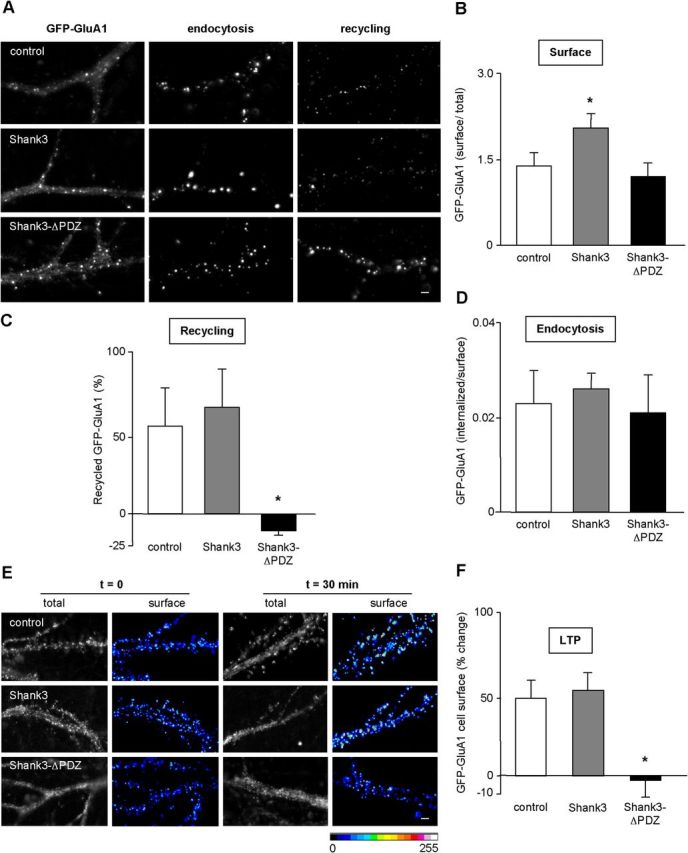
The PDZ domain of Shank3 is required for GluA1 recycling and surface exocytosis during cLTP. Hippocampal neurons were transfected with GFP-GluA1 (control), Shank3, or Shank3-ΔPDZ mutant and used for live-cell antibody feeding experiments in basal (A–D) and cLTP conditions (E, F). A–D, Same legend as in Figure 3, E–H, but with transfected Shank3 and Shank3-ΔPDZ mutant (B, Shank3, n = 22; Shank3-ΔPDZ, n = 20 neurons; C, Shank3, n = 30; Shank3-ΔPDZ, n = 29 neurons; D, Shank3, n = 12; Shank3-ΔPDZ, n = 21 neurons; 3 independent experiments for each condition; *p < 0.01). Scale bar, 1 μm. E, F, Same legend as in Figure 5A, but with transfected Shank3 (n = 16 neurons from 3 independent experiments) and Shank3-ΔPDZ mutant (n = 15 neurons from 3 independent experiments; *p < 0.01. Scale bar, 1 μm.
The Rich2-AAA mutant, which does not interact with Shank3, was weakly tolerated by hippocampal neurons. Indeed the cumulative effect of Rich2-AAA overexpression and long-term treatments that were required for recycling experiments were deleterious for the neurons. Thus, we were only able to examine the effect of Rich2-AAA on GluA1 surface expression, which can be measured more rapidly than endocytosis and recycling. Rich2-AAA did not modify GluA1 levels as compared with Rich2 wild-type (control = 0.4 ± 0.1, n = 21; Rich2 wild-type = 0.89 ± 0.15, n = 19; Rich2-AAA = 0.54 ± 0.10, n = 17).
The effect of Shank3–Rich2 interaction on cLTP was then examined. Thirty minutes after cLTP induction, a similar increase in cell-surface localization of GluA1 was observed in nontransfected and Shank3-transfected neurons. However, no significant increase in GluA1 cell-surface localization was observed in Shank3-ΔPDZ transfected neurons (Fig. 7E,F). These data suggested that Shank3 PDZ interaction controlled the enhancement in exocytosis of GluA1 subunit during cLTP.
In cLTP experiments, the Rich2-AAA mutant, which does not interact with Shank3, inhibited the enlargement of spine head (control = 79.0 ± 2.0% increase, n = 28 vs Rich2-AAA = 20.3% ± 2.6% decrease, n = 30), and increase in spine density (control = 38.6 ± 4.9% increase, n = 28 vs Rich2-AAA = 1.1 ± 4.3% decrease, n = 30). These results suggested that a Rich2 PDZ interaction is involved in cLTP.
We directly measured Rich2–Shank3 interaction in hippocampal neurons using single-cell BRET microscopy during cLTP. Following cLTP induction, Shank3-Rluc8/Rich2-Venus BRET signals increased in spines, but not in dendritic shafts (Fig. 8A,B). In contrast, in the absence of induction of cLTP, Shank3-Rluc8/Rich2-Venus BRET signals remained constant in dendrites over time (data not shown).
Figure 8.

Specificity of the TAT-STAV peptide and its effects on Shank3–Rich2 complex in cLTP. A, B, Eighteen days in vitro hippocampal neurons were transfected with Rluc8-Shank3 and Rich2-Venus expression plasmids for single-cell BRET imaging. A, A portion of dendrite imaged at 480 and 535 nm before (t = 0) and 4, 8, 12, and 16 min after cLTP induction. Pseudocolor images show the 535/480 ratios corresponding to BRET signal. Scale bar, 1 μm. B, The bar graph represents mean (± SEM; n = 9) net BRET signal values after background subtraction in dendritic shaft and spines obtained at t = 0 and t = 16 min following cLTP induction. Values were compared between t = 0 and t = 16, in shafts and spines (NS, nonsignificantly different; *p < 0.01). C, HEK293 cells were cotransfected with a constant concentration of Rluc8-Shank3 and increasing concentrations of Rich2-Venus expression plasmids to measure BRET signals between the two constructs as a function of the Rich2-Venus acceptor expression level, in the presence of inactive TAT-AAA (CT) or active TAT-STAV peptides. Individual readings obtained from three independent experiments were pooled in the same graph. Each plot was fitted using a nonlinear regression equation, thus assuming a single binding site (GraphPadPrism). The Net BRET curve was significantly different by overexpression of TAT-STAV versus control (p < 0.001, two-way ANOVA, Fisher's LSD test). D, BRET signals were measured in hippocampal neurons transfected with Rluc8-Shank3 and Rich2-Venus expression plasmids, before and during application of either TAT-AAA (control) or TAT-STAV peptides. Each value of the bar graph is the mean (± SEM) of BRET signal ratio obtained before and 20 min after application of the TAT peptide, in dendritic spines (for each condition n = 5 neurons, *p < 0.001). E–G, Same legend as in C, but in HEK cells cotransfected with Rluc8-Shank3 and increasing concentrations of GluA1-Venus (E) or GKAP-Venus (F). HEK cells were cotransfected with GluA1-Rluc8 and increasing concentration of YFP-SAP97 (G). The HEK cells were then treated with TAT-AAA (CT) or TAT-STAV peptides for 20 min before BRET signal acquisition. The Net BRET curves were not significantly different by overexpression of TAT-STAV versus control in E–G (two-way ANOVA, Fisher's LSD test), indicating an absence of effect of the TAT-STAV peptide on the tested protein-protein interactions.
We then disrupted the Rich2–Shank3 complex using a mimetic peptide encompassing the last 10 C-terminal amino acids of Rich2, which includes the PDZ ligand motif STAV. The peptide was conjugated to the cell-membrane transduction domain of the HIV-1 TAT protein (TAT-STAV), which allowed the fusion peptide to cross cell membrane. A similar peptide bearing the amino acid SAAA motif instead of the STAV PDZ ligand motif was used as a control (TAT-AAA). In HEK293 cell populations, TAT-STAV (Fig. 8C), but not TAT-AAA (data not shown) decreased Rich2-Shank3 binding. We performed a number of controls to confirm the specificity of action of the peptide, as follows. GluA1 and GKAP are two other proteins that can bind to the PDZ domain of Shank3 (Naisbitt et al., 1999; Uchino et al., 2006). The TAT-STAV peptide did not significantly affect the GluA1-Shank3 or Shank3-GKAP BRET signals (Fig. 8E,F). SAP-97 is a PDZ domain protein that binds GluA1 subunit (Leonard et al., 1998). The TAT-STAV peptide did not alter GluA1-SAP97 BRET signals (Fig. 8G). These results suggested that TAT-STAV competes with Rich2 for binding to the PDZ domain of Shank3 in a specific manner.
Following these control experiments, we tested the effect of the competitive TAT-STAV peptide on Shank3-Rich2 BRET signals in 18 DIV hippocampal neurons. A 20 min treatment of the neurons with the TAT-STAV peptide inhibited the Shank3-Rich2 BRET signals in dendritic spines (Fig. 8D). We then explored the role of Rich2–Shank3 interaction in cLTP-associated spine changes. Neurons treated with the TAT-STAV, but not TAT-AAA peptide, did not exhibit the increase in spine density and size that is normally induced with cLTP in nontransfected neurons (Fig. 9A–C). These results suggested that the endogenous Rich2-Shank3 complex is involved in spine morphological changes associated to cLTP.
Figure 9.
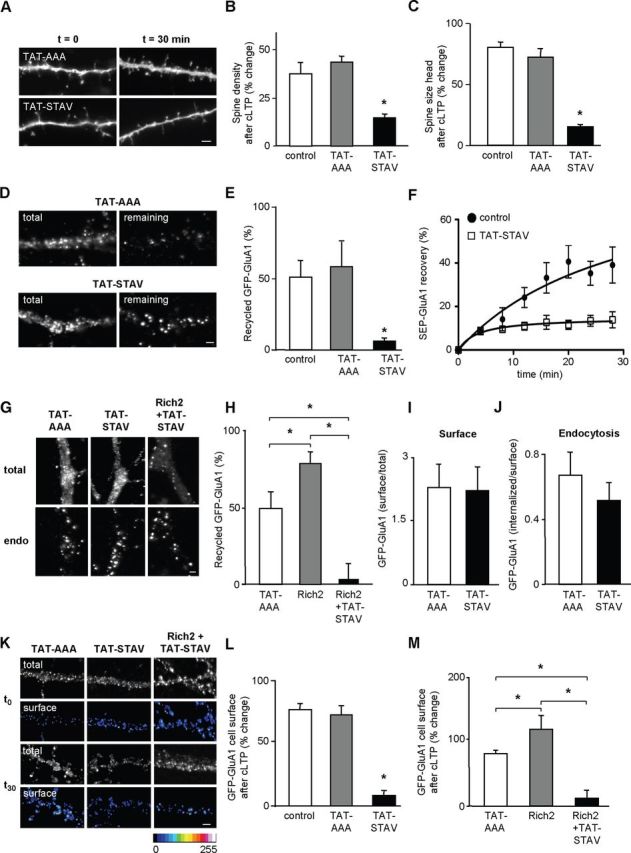
Effects of the TAT-STAV peptide on spine morphology, GFP-GluA1 exocytosis, cell-surface expression, and endocytosis. A–C, Morphological analyses of dendritic spines taken from GFP-transfected neurons before (t = 0) and 30 min after cLTP induction, in the presence of inactive (TAT-AAA) and active (TAT-STAV) TAT peptides. TAT peptides (100 nm) were applied 15 min before the chemical stimulation and throughout the experiment. A, Images of dendritic segments. Scale bar, 1 μm. B, C, Bar graphs represent the mean (± SEM) percentage change in spine density and size of spine head measured 30 min after cLTP induction, in the absence (control) and presence of TAT-AAA (n = 14) or TAT-STAV (n = 10). In these and other parts, values of bar graphs were compared with control, except when specified by horizontal bars (*p < 0.01). D–F, Live-cell antibody feeding assays were performed in hippocampal neurons cotransfected with GFP-GluA1 and Rich2, and subjected or not to 15 min treatment with inactive (TAT-AAA) or active (TAT-STAV) TAT peptides. D, Images of total GFP-GluA1 fluorescence (left) and remaining intracellular GFP-GluA1 immunostaining (right) after receptor construct recycling. E, Represents the mean fluorescence (± SEM) of recycled GFP-GluA1, in the absence (control) or presence of TAT-AAA (n = 11 neurons) or TAT-STAV (n = 14 neurons) peptide (*p < 0.01). F, Represents SEP-GluA1 exocytosis measured in the absence (control) and presence of TAT-STAV peptide (n = 11). The SEP-GluA1 recovery was significantly decreased by overexpression of TAT-STAV versus control (p < 0.005, two-way ANOVA, Fisher's LSD test). G–J, Hippocampal neurons transfected with GFP-GluA1 were subjected to live-cell antibody feeding assays in the presence of TAT-AAA or TAT-STAV peptides. G, Total and intracellular (endo) GFP-GluA1 subunit fluorescence after receptor endocytosis, obtained in a dendrite, in the presence of the TAT peptides. The bar graphs represent the recycled (H, TAT-AAA, n = 11; TAT-STAV, n = 14; Rich2 + TAT-STAV, n = 9), surface over total (I, TAT-AAA, n = 16; TAT-STAV, n = 14), and endocytosed (J, TAT-AAA, n = 7; TAT-STAV, n = 12) GFP-GluA1 mean fluorescence (± SEM, *p < 0.01 for each part). K–M, Cell-surface expression of GFP-GluA1 after cLTP induction in hippocampal neurons transfected or not with Rich2. K, Total GFP-GluA1 fluorescence and cell-surface GFP-GluA1 immunostaining in dendritic segments, obtained before (t0) and 30 min (t30) after cLTP induction, in the presence of inactive (TAT-AAA) and active (TAT-STAV) TAT peptides. Surface GFP-GluA1 immunostaining intensity is shown in pseudocolor scale. L, M, Bar graphs represent the mean (± SEM) percentage change in cell-surface GFP-GluA1 immunostaining intensity measured 30 min after cLTP induction in the absence (control) or presence of TAT-AAA (n = 16), TAT-STAV (n = 13), Rich2 (n = 15), and Rich2 + TAT-STAV (n = 15 neurons, *p < 0.01). Scale bar, 1 μm.
We then tested the effect of the TAT-STAV peptide on GluA1 membrane trafficking. The TAT-STAV, but not TAT-AAA peptide, significantly inhibited the recycling of GFP-GluA1 (Fig. 9D,E) and fluorescence recovery of SEP-GluA1 (Fig. 9F), without significantly affecting surface expression and endocytosis of GFP-GluA1 (Fig. 9G,I,J). The TAT-STAV peptide blocked the effects of Rich2 overexpression on GluA1 recycling (Fig. 9H). Finally, the TAT-STAV, but not TAT-AAA peptide, blocked the enhancement of GluA1 cell-surface expression that is associated with cLTP (Fig. 9K,L), and the potentiating effect of Rich2 on this phenomenon (Fig. 9M). These results showed that disruption of the Rich2–Shank3 interaction interfered with the recycling of GluA1 subunit during cLTP.
We also tested the effect of the TAT-STAV peptide on HFS-induced LTP in acute mouse hippocampal slices. In the absence of TAT peptide or after pretreatment with TAT-AAA for 1 h, HFS produced a stable increase in the initial slope of CA1 fEPSP, thus indicating induction of LTP (Fig. 10A,C; data not shown). Conversely, the HFS-induced LTP was impaired by treatment with TAT-STAV (Fig. 10B,C). Altogether these results suggested that the Rich2–Shank3 complex is involved in LTP.
Figure 10.

TAT-STAV peptide blocks the HFS-induced LTP in hippocampal slices. fEPSPs were evoked by Schaffer-collateral afferent stimulation and recorded in the CA1 dendritic region of mouse hippocampal slices. LTP was induced by HFS (see Materials and Methods; arrowheads) and expressed as a percentage of the mean slope of fEPSP calculated before HFS. A, B, These were obtained from slices treated with either the control TAT-AAAA (n = 6) or active TAT-STAV peptide (n = 8, both at 1 μm), respectively. Dotted lines represent the baseline for LTP experiments. C, The bar graph represents the mean (± SEM, *p < 0.01) percentage increase in fEPSP slope measured 40 min after HFS, in hippocampal slices treated with TAT-AAA (n = 6) and TAT-STAV peptides (n = 8).
Discussion
In the present study, we have identified the protein Rich2 as a new PDZ ligand partner of Shank3. Rich2 is a previously uncharacterized protein that displays both N-BAR and Rho-GAP domains. We show that Rich2 interacts with Shank3 in dendritic spines of cultured hippocampal neurons. It is localized in the endosomal-recycling compartment and regulates GluA1 but not GluA2 AMPA receptor subunit exocytosis through recycling pathways.
We found that the N-BAR domain of Rich2 controls its localization in Rab11-positive/recycling endosomes and its involvement in the Rich2-dependent regulation of the recycling processes. It is worth noting that the N-BAR domain of Rich1/Nadrin, a paralog of Rich2, allows the membrane anchoring of the protein (Blood and Voth, 2006) and/or recognition/formation of membrane curvatures (Blood and Voth, 2006; Hirling, 2009). Furthermore, Rich1 is located in early endosomes and its depletion by RNA interference mimics the effects of Rab13 mutants, suggesting that this Rho-GAP may be involved in membrane transport (Macara and Spang, 2006; Wells et al., 2006). Here we showed that this is also the case for Rich2. Its overexpression promoted transferrin recycling in COS-7 cells and neurons, whereas its depletion by siRNA or mutation of its Rho-GAP domain inhibited transferrin, as well as basal and stimulated GluA1 recycling. The similarity between Rich2 loss of function and the phenotypes described for the dominant-negative Rab11a-S25N mutant is also striking (Park et al., 2004, 2006). As Rich2, Rab11 participates in stimulated endosomal recycling and dendritic spine modifications during cLTP. This suggested that Rich2 could control spine morphology and density by regulating one or several steps involved in the formation and shaping of the spine through recycling pathways.
The Homer protein has been shown to be a morphogenic effector of Shank (Sala et al., 2001). Homer is a multimeric adaptor protein that cross-links metabotropic glutamate receptors mGluR1a/mGluR5 and Shank at the synapse via a proline rich binding domain called EVH1 (Tu et al., 1999). Shank can also functionally link the PSD to actin-based spine plasticity through its interaction with cortactin (Ehlers, 1999) and more directly via SPAR (Pak et al., 2001), a GAP for the Rap family of small GTPases. In addition to these proteins, the Rho-GAP oligophrenin1 can bind Homer and as such can form a complex with Shank. Interestingly, oligophrenin1 is also important for dendritic spine morphogenesis (Govek et al., 2004; Khelfaoui et al., 2007). This protein has been shown to interact with endophilin, an N-BAR-containing protein that is involved in recognition and/or formation of membrane curvature. This complex inhibits synaptic vesicle endocytosis (Govek et al., 2004; Khelfaoui et al., 2007). Oligophrenin1 is also able to regulate postsynaptic AMPA receptor internalization (Khelfaoui et al., 2009) and exocytosis (Nadif Kasri et al., 2009), thus affecting synaptic plasticity (Nakano-Kobayashi et al., 2009). Therefore it appears that different Rho-GAPs can regulate one or more steps of the endocytosis/exocytosis cycle during synaptic plasticity. Our results show that Rich2 is a new Shank interacting Rho-GAP that contributes to LTP and AMPA receptor membrane exocytosis through endosomal recycling-dependent mechanisms.
To date, only few data are available on the function of Shank3 in AMPA receptor trafficking and LTP. Disruption of the dynamin3-Homer-Shank complex uncouples the PSD from the endocytic zone and in turn leads to a loss of functional synaptic AMPA receptors (Lu et al., 2007). In the present study, we showed that depletion of Rich2 by siRNA or mutation of its Rho-GAP domain blocked dendritic spine morphological changes and AMPA receptor GluA1 subunit trafficking during cLTP. Moreover we found that disruption of Rich2–Shank3 interaction, using a Shank3 mutant lacking of its PDZ domain, or a competitive TAT-STAV peptide mimicking the C terminus of Rich2, blocked LTP and AMPA receptor GluA1 subunit exocytosis. These results point out a new function of the Shank3–Rich2 complex in the control of synaptic plasticity.
Our experiments in hippocampal slices treated with the TAT-STAV peptide further demonstrated that the Shank3–Rich2 complex was involved in LTP. This result was consistent with data obtained in heterozygous Shank3 knock-out mice that showed alterations in the maintenance of LTP, associated with a loss of GluA1 AMPA receptors at the cell surface (Bozdagi et al., 2010). Previous studies have shown that synaptic activity could trigger both exocytosis and endocytosis of AMPA receptors in spines, which occurred in exocytic and endocytic zones, respectively, close to the PSD (Kennedy and Ehlers, 2011). Shank proteins could be the functional link between endocytic zone and PSD (Lu et al., 2007), since Shank is a PSD protein that binds to Homer, and Homer binds the endocytic protein dynamin3 (Tu et al., 1999). Here we found that Rich2 interacted with Shank3 and controlled exocytosis of the GluA1 AMPA receptor subunit through endosomal-recycling pathway. Other studies have shown that Shank3 could directly bind to the PDZ ligand motif of GluA1 (Uchino et al., 2006) and this interaction controlled GluA1 exocytosis (Passafaro et al., 2001). Shank3-GluA1 binding could occur during this exocytosis process. Moreover, it has been shown that Shank3 could form a complex with dynamin2 (Okamoto et al., 2001), a protein that is involved in endosomal recycling vesicle formation and exocytosis (Durieux et al., 2010). The physiological roles of these endocytosis/recycling exchanges at the synapse are important for the maintenance of synaptic excitability and synaptic plasticity (Ehlers, 2002). In the present study we showed that Shank3 could interact with Rich2 and this would result in the exocytosis of GluA1 and expression of LTP. We therefore tentatively suggest that binding of Rich2 to Shank3 could control basal AMPA receptor exocytosis/recycling and fine-tuning of neurotransmission efficacy during synaptic plasticity.
Footnotes
This work was supported by the European Community (FP7-Thematic priority HEALTH contract number 222918 REPLACES, L.F.), Agence Nationale de la Recherche (ANR-05-NEURO-035, L.F.), FUI DIATRAL contract (L.F.), and Deutsche Forschungsgemeinschaft (DFG, SFB 497/B8, T.M.B.). MS analyses were performed using facilities of the Functional Proteomics Platform (IBiSA) of Montpellier-Languedoc Roussillon. FRAP and electron microscopy were performed using facilities of the RIO Imaging Platform of Montpellier-Languedoc Roussillon with the help of Chantal Cazevielle, Anne Guillou, and Julien Cau. Peptide synthesis and rabbit immunization were performed using facilities of the Centre de Recherche en Biochimie Macromoléculaire (Montpellier) with the help of Gudi Aldrian.
The authors declare no competing financial interests.
References
- Bécamel C, Alonso G, Galéotti N, Demey E, Jouin P, Ullmer C, Dumuis A, Bockaert J, Marin P. Synaptic multiprotein complexes associated with 5-HT(2C) receptors: a proteomic approach. EMBO J. 2002;21:2332–2342. doi: 10.1093/emboj/21.10.2332. [DOI] [PMC free article] [PubMed] [Google Scholar]
- Benyamin Y, Roustan C, Boyer M. Anti-actin antibodies. Chemical modification allows the selective production of antibodies to the N-terminal region. J Immunol Methods. 1986;86:21–29. doi: 10.1016/0022-1759(86)90260-7. [DOI] [PubMed] [Google Scholar]
- Blood PD, Voth GA. Direct observation of Bin/amphiphysin/Rvs (BAR) domain-induced membrane curvature by means of molecular dynamics simulations. Proc Natl Acad Sci U S A. 2006;103:15068–15072. doi: 10.1073/pnas.0603917103. [DOI] [PMC free article] [PubMed] [Google Scholar]
- Boeckers TM, Bockmann J, Kreutz MR, Gundelfinger ED. ProSAP/Shank proteins - a family of higher order organizing molecules of the postsynaptic density with an emerging role in human neurological disease. J Neurochem. 2002;81:903–910. doi: 10.1046/j.1471-4159.2002.00931.x. [DOI] [PubMed] [Google Scholar]
- Bonaglia MC, Giorda R, Mani E, Aceti G, Anderlid BM, Baroncini A, Pramparo T, Zuffardi O. Identification of a recurrent breakpoint within the SHANK3 gene in the 22q13.3 deletion syndrome. J Med Genet. 2006;43:822–828. doi: 10.1136/jmg.2005.038604. [DOI] [PMC free article] [PubMed] [Google Scholar]
- Bozdagi O, Sakurai T, Papapetrou D, Wang X, Dickstein DL, Takahashi N, Kajiwara Y, Yang M, Katz AM, Scattoni ML, Harris MJ, Saxena R, Silverman JL, Crawley JN, Zhou Q, Hof PR, Buxbaum JD. Haploinsufficiency of the autism-associated Shank3 gene leads to deficits in synaptic function, social interaction, and social communication. Mol Autism. 2010;1:15. doi: 10.1186/2040-2392-1-15. [DOI] [PMC free article] [PubMed] [Google Scholar]
- Brown TC, Correia SS, Petrok CN, Esteban JA. Functional compartmentalization of endosomal trafficking for the synaptic delivery of AMPA receptors during long-term potentiation. J Neurosci. 2007;27:13311–13315. doi: 10.1523/JNEUROSCI.4258-07.2007. [DOI] [PMC free article] [PubMed] [Google Scholar]
- Coulon V, Audet M, Homburger V, Bockaert J, Fagni L, Bouvier M, Perroy J. Subcellular imaging of dynamic protein interactions by bioluminescence resonance energy transfer. Biophys J. 2008;94:1001–1009. doi: 10.1529/biophysj.107.117275. [DOI] [PMC free article] [PubMed] [Google Scholar]
- Durand CM, Betancur C, Boeckers TM, Bockmann J, Chaste P, Fauchereau F, Nygren G, Rastam M, Gillberg IC, Anckarsäter H, Sponheim E, Goubran-Botros H, Delorme R, Chabane N, Mouren-Simeoni MC, de Mas P, Bieth E, Rogé B, Héron D, Burglen L, et al. Mutations in the gene encoding the synaptic scaffolding protein SHANK3 are associated with autism spectrum disorders. Nat Genet. 2007;39:25–27. doi: 10.1038/ng1933. [DOI] [PMC free article] [PubMed] [Google Scholar]
- Durand CM, Perroy J, Loll F, Perrais D, Fagni L, Bourgeron T, Montcouquiol M, Sans N. SHANK3 mutations identified in autism lead to modification of dendritic spine morphology via an actin-dependent mechanism. Mol Psychiatry. 2012;17:71–84. doi: 10.1038/mp.2011.57. [DOI] [PMC free article] [PubMed] [Google Scholar]
- Durieux AC, Prudhon B, Guicheney P, Bitoun M. Dynamin 2 and human diseases. J Mol Med. 2010;88:339–350. doi: 10.1007/s00109-009-0587-4. [DOI] [PubMed] [Google Scholar]
- Ehlers MD. Synapse structure: glutamate receptors connected by the shanks. Curr Biol. 1999;9:R848–850. doi: 10.1016/S0960-9822(00)80043-3. [DOI] [PubMed] [Google Scholar]
- Ehlers MD. Molecular morphogens for dendritic spines. Trends Neurosci. 2002;25:64–67. doi: 10.1016/S0166-2236(02)02061-1. [DOI] [PubMed] [Google Scholar]
- Fütterer K, Machesky LM. “Wunder” F-BAR domains: going from pits to vesicles. Cell. 2007;129:655–657. doi: 10.1016/j.cell.2007.05.006. [DOI] [PubMed] [Google Scholar]
- Govek EE, Newey SE, Akerman CJ, Cross JR, Van der Veken L, Van Aelst L. The X-linked mental retardation protein oligophrenin-1 is required for dendritic spine morphogenesis. Nat Neurosci. 2004;7:364–372. doi: 10.1038/nn1210. [DOI] [PubMed] [Google Scholar]
- Hirling H. Endosomal trafficking of AMPA-type glutamate receptors. Neuroscience. 2009;158:36–44. doi: 10.1016/j.neuroscience.2008.02.057. [DOI] [PubMed] [Google Scholar]
- Kelly EE, Horgan CP, McCaffrey MW, Young P. The role of endosomal-recycling in long-term potentiation. Cell Mol Life Sci. 2011;68:185–194. doi: 10.1007/s00018-010-0516-2. [DOI] [PMC free article] [PubMed] [Google Scholar]
- Kennedy MJ, Ehlers MD. Mechanisms and function of dendritic exocytosis. Neuron. 2011;69:856–875. doi: 10.1016/j.neuron.2011.02.032. [DOI] [PMC free article] [PubMed] [Google Scholar]
- Khelfaoui M, Denis C, van Galen E, de Bock F, Schmitt A, Houbron C, Morice E, Giros B, Ramakers G, Fagni L, Chelly J, Nosten-Bertrand M, Billuart P. Loss of X-linked mental retardation gene oligophrenin1 in mice impairs spatial memory and leads to ventricular enlargement and dendritic spine immaturity. J Neurosci. 2007;27:9439–9450. doi: 10.1523/JNEUROSCI.2029-07.2007. [DOI] [PMC free article] [PubMed] [Google Scholar]
- Khelfaoui M, Pavlowsky A, Powell AD, Valnegri P, Cheong KW, Blandin Y, Passafaro M, Jefferys JG, Chelly J, Billuart P. Inhibition of RhoA pathway rescues the endocytosis defects in Oligophrenin1 mouse model of mental retardation. Hum Mol Genet. 2009;18:2575–2583. doi: 10.1093/hmg/ddp189. [DOI] [PMC free article] [PubMed] [Google Scholar]
- Kreienkamp H-J. Scaffolding proteins at the postsynaptic density: shank as the architectural framework. In: Klussmann E, Scott J, editors. Handbook of experimental pharmacology. Berlin: Springer; 2008. pp. 365–380. [DOI] [PubMed] [Google Scholar]
- Leonard AS, Davare MA, Horne MC, Garner CC, Hell JW. SAP97 is associated with the alpha-amino-3-hydroxy-5-methylisoxazole-4-propionic acid receptor GluR1 subunit. J Biol Chem. 1998;273:19518–19524. doi: 10.1074/jbc.273.31.19518. [DOI] [PubMed] [Google Scholar]
- Lu J, Helton TD, Blanpied TA, Rácz B, Newpher TM, Weinberg RJ, Ehlers MD. Postsynaptic positioning of endocytic zones and AMPA receptor cycling by physical coupling of dynamin-3 to Homer. Neuron. 2007;55:874–889. doi: 10.1016/j.neuron.2007.06.041. [DOI] [PMC free article] [PubMed] [Google Scholar]
- Lu W, Man H, Ju W, Trimble WS, MacDonald JF, Wang YT. Activation of synaptic NMDA receptors induces membrane insertion of new AMPA receptors and LTP in cultured hippocampal neurons. Neuron. 2001;29:243–254. doi: 10.1016/S0896-6273(01)00194-5. [DOI] [PubMed] [Google Scholar]
- Macara IG, Spang A. Closing the GAP between polarity and vesicle transport. Cell. 2006;125:419–421. doi: 10.1016/j.cell.2006.04.011. [DOI] [PubMed] [Google Scholar]
- Malenka RC, Nicoll RA. Long-term potentiation–a decade of progress? Science. 1999;285:1870–1874. doi: 10.1126/science.285.5435.1870. [DOI] [PubMed] [Google Scholar]
- Miesenböck G, De Angelis DA, Rothman JE. Visualizing secretion and synaptic transmission with pH-sensitive green fluorescent proteins. Nature. 1998;394:192–195. doi: 10.1038/28190. [DOI] [PubMed] [Google Scholar]
- Nadif Kasri N, Nakano-Kobayashi A, Malinow R, Li B, Van Aelst L. The Rho-linked mental retardation protein oligophrenin-1 controls synapse maturation and plasticity by stabilizing AMPA receptors. Genes Dev. 2009;23:1289–1302. doi: 10.1101/gad.1783809. [DOI] [PMC free article] [PubMed] [Google Scholar]
- Naisbitt S, Kim E, Tu JC, Xiao B, Sala C, Valtschanoff J, Weinberg RJ, Worley PF, Sheng M. Shank, a novel family of postsynaptic density proteins that binds to the NMDA receptor/PSD-95/GKAP complex and cortactin. Neuron. 1999;23:569–582. doi: 10.1016/S0896-6273(00)80809-0. [DOI] [PubMed] [Google Scholar]
- Nakano-Kobayashi A, Kasri NN, Newey SE, Van Aelst L. The Rho-linked mental retardation protein OPHN1 controls synaptic vesicle endocytosis via endophilin A1. Curr Biol. 2009;19:1133–1139. doi: 10.1016/j.cub.2009.05.022. [DOI] [PMC free article] [PubMed] [Google Scholar]
- Okamoto PM, Gamby C, Wells D, Fallon J, Vallee RB. Dynamin isoform-specific interaction with the shank/ProSAP scaffolding proteins of the postsynaptic density and actin cytoskeleton. J Biol Chem. 2001;276:48458–48465. doi: 10.1074/jbc.M104927200. [DOI] [PMC free article] [PubMed] [Google Scholar]
- Pak DT, Yang S, Rudolph-Correia S, Kim E, Sheng M. Regulation of dendritic spine morphology by SPAR, a PSD-95-associated RapGAP. Neuron. 2001;31:289–303. doi: 10.1016/S0896-6273(01)00355-5. [DOI] [PubMed] [Google Scholar]
- Park M, Penick EC, Edwards JG, Kauer JA, Ehlers MD. Recycling endosomes supply AMPA receptors for LTP. Science. 2004;305:1972–1975. doi: 10.1126/science.1102026. [DOI] [PubMed] [Google Scholar]
- Park M, Salgado JM, Ostroff L, Helton TD, Robinson CG, Harris KM, Ehlers MD. Plasticity-induced growth of dendritic spines by exocytic trafficking from recycling endosomes. Neuron. 2006;52:817–830. doi: 10.1016/j.neuron.2006.09.040. [DOI] [PMC free article] [PubMed] [Google Scholar]
- Passafaro M, Piëch V, Sheng M. Subunit-specific temporal and spatial patterns of AMPA receptor exocytosis in hippocampal neurons. Nat Neurosci. 2001;4:917–926. doi: 10.1038/nn0901-917. [DOI] [PubMed] [Google Scholar]
- Peça J, Feliciano C, Ting JT, Wang W, Wells MF, Venkatraman TN, Lascola CD, Fu Z, Feng G. Shank3 mutant mice display autistic-like behaviours and striatal dysfunction. Nature. 2011;472:437–442. doi: 10.1038/nature09965. [DOI] [PMC free article] [PubMed] [Google Scholar]
- Pfleger KD, Eidne KA. Illuminating insights into protein-protein interactions using bioluminescence resonance energy transfer (BRET) Nat Methods. 2006;3:165–174. doi: 10.1038/nmeth841. [DOI] [PubMed] [Google Scholar]
- Proepper C, Johannsen S, Liebau S, Dahl J, Vaida B, Bockmann J, Kreutz MR, Gundelfinger ED, Boeckers TM. Abelson interacting protein 1 (Abi-1) is essential for dendrite morphogenesis and synapse formation. EMBO J. 2007;26:1397–1409. doi: 10.1038/sj.emboj.7601569. [DOI] [PMC free article] [PubMed] [Google Scholar]
- Richnau N, Aspenström P. Rich, a rho GTPase-activating protein domain-containing protein involved in signaling by Cdc42 and Rac1. J Biol Chem. 2001;276:35060–35070. doi: 10.1074/jbc.M103540200. [DOI] [PubMed] [Google Scholar]
- Richnau N, Fransson A, Farsad K, Aspenström P. RICH-1 has a BIN/Amphiphysin/Rvsp domain responsible for binding to membrane lipids and tubulation of liposomes. Biochem Biophys Res Commun. 2004;320:1034–1042. doi: 10.1016/j.bbrc.2004.05.221. [DOI] [PubMed] [Google Scholar]
- Rollason R, Korolchuk V, Hamilton C, Jepson M, Banting G. A CD317/tetherin-RICH2 complex plays a critical role in the organization of the subapical actin cytoskeleton in polarized epithelial cells. J Cell Biol. 2009;184:721–736. doi: 10.1083/jcb.200804154. [DOI] [PMC free article] [PubMed] [Google Scholar]
- Roussignol G, Ango F, Romorini S, Tu JC, Sala C, Worley PF, Bockaert J, Fagni L. Shank expression is sufficient to induce functional dendritic spine synapses in aspiny neurons. J Neurosci. 2005;25:3560–3570. doi: 10.1523/JNEUROSCI.4354-04.2005. [DOI] [PMC free article] [PubMed] [Google Scholar]
- Sala C, Piëch V, Wilson NR, Passafaro M, Liu G, Sheng M. Regulation of dendritic spine morphology and synaptic function by Shank and Homer. Neuron. 2001;31:115–130. doi: 10.1016/S0896-6273(01)00339-7. [DOI] [PubMed] [Google Scholar]
- Savina A, Vidal M, Colombo MI. The exosome pathway in K562 cells is regulated by Rab11. J Cell Sci. 2002;115:2505–2515. doi: 10.1242/jcs.115.12.2505. [DOI] [PubMed] [Google Scholar]
- Sheng M, Hoogenraad CC. The postsynaptic architecture of excitatory synapses: a more quantitative view. Annu Rev Biochem. 2007;76:823–847. doi: 10.1146/annurev.biochem.76.060805.160029. [DOI] [PubMed] [Google Scholar]
- Sönnichsen B, De Renzis S, Nielsen E, Rietdorf J, Zerial M. Distinct membrane domains on endosomes in the recycling pathway visualized by multicolor imaging of Rab4, Rab5, and Rab11. J Cell Biol. 2000;149:901–914. doi: 10.1083/jcb.149.4.901. [DOI] [PMC free article] [PubMed] [Google Scholar]
- Tcherkezian J, Lamarche-Vane N. Current knowledge of the large RhoGAP family of proteins. Biol Cell. 2007;99:67–86. doi: 10.1042/BC20060086. [DOI] [PubMed] [Google Scholar]
- Thouvenot E, Urbach S, Dantec C, Poncet J, Séveno M, Demettre E, Jouin P, Touchon J, Bockaert J, Marin P. Enhanced detection of CNS cell secretome in plasma protein-depleted cerebrospinal fluid. J Proteome Res. 2008;7:4409–4421. doi: 10.1021/pr8003858. [DOI] [PubMed] [Google Scholar]
- Toni N, Buchs PA, Nikonenko I, Bron CR, Muller D. LTP promotes formation of multiple spine synapses between a single axon terminal and a dendrite. Nature. 1999;402:421–425. doi: 10.1038/46574. [DOI] [PubMed] [Google Scholar]
- Tsuriel S, Geva R, Zamorano P, Dresbach T, Boeckers T, Gundelfinger ED, Garner CC, Ziv NE. Local sharing as a predominant determinant of synaptic matrix molecular dynamics. PLoS Biol. 2006;4:e271. doi: 10.1371/journal.pbio.0040271. [DOI] [PMC free article] [PubMed] [Google Scholar]
- Tu JC, Xiao B, Naisbitt S, Yuan JP, Petralia RS, Brakeman P, Doan A, Aakalu VK, Lanahan AA, Sheng M, Worley PF. Coupling of mGluR/Homer and PSD-95 complexes by the Shank family of postsynaptic density proteins. Neuron. 1999;23:583–592. doi: 10.1016/S0896-6273(00)80810-7. [DOI] [PubMed] [Google Scholar]
- Uchino S, Wada H, Honda S, Nakamura Y, Ondo Y, Uchiyama T, Tsutsumi M, Suzuki E, Hirasawa T, Kohsaka S. Direct interaction of postsynaptic density-95/Dlg/ZO-1 domain-containing synaptic molecule Shank3 with GluR1 alpha-amino-3-hydroxy-5-methyl-4-isoxazole propionic acid receptor. J Neurochem. 2006;97:1203–1214. doi: 10.1111/j.1471-4159.2006.03831.x. [DOI] [PubMed] [Google Scholar]
- Wang X, McCoy PA, Rodriguiz RM, Pan Y, Je HS, Roberts AC, Kim CJ, Berrios J, Colvin JS, Bousquet-Moore D, Lorenzo I, Wu G, Weinberg RJ, Ehlers MD, Philpot BD, Beaudet AL, Wetsel WC, Jiang YH. Synaptic dysfunction and abnormal behaviors in mice lacking major isoforms of Shank3. Hum Mol Genet. 2011;20:3093–3108. doi: 10.1093/hmg/ddr212. [DOI] [PMC free article] [PubMed] [Google Scholar]
- Wells CD, Fawcett JP, Traweger A, Yamanaka Y, Goudreault M, Elder K, Kulkarni S, Gish G, Virag C, Lim C, Colwill K, Starostine A, Metalnikov P, Pawson T. A Rich1/Amot complex regulates the Cdc42 GTPase and apical-polarity proteins in epithelial cells. Cell. 2006;125:535–548. doi: 10.1016/j.cell.2006.02.045. [DOI] [PubMed] [Google Scholar]
- Zerial M, McBride H. Rab proteins as membrane organizers. Nat Rev Mol Cell Biol. 2001;2:107–117. doi: 10.1038/35052055. [DOI] [PubMed] [Google Scholar]