

Abstract
Synapses undergo substantial activity-dependent and independent remodeling over time scales of minutes, hours, and days. Presumably, changes in presynaptic properties should be matched by corresponding changes in postsynaptic properties and vice versa. Wherever measured, presynaptic and postsynaptic molecular properties tend to correlate, yet these correlations are often quite imperfect, raising questions as the origins of such mismatches: Are these the outcome of “single snapshot” analyses of asynchronous remodeling processes? Alternatively, do these indicate that synapses genuinely vary in the “stoichiometries” of their presynaptic and postsynaptic molecular contents? If so, are these “stoichiometries” preserved over time? To address these questions, we followed the matching dynamics of the presynaptic active-zone molecule Munc13-1 and the postsynaptic molecule PSD-95 in networks of cultured cortical mouse neurons. We find that presynaptic and postsynaptic remodeling were generally well correlated, but the degree of this correlation was highly variable, with little and even negative correlation observed at some synapses. No evidence was found that remodeling in one compartment consistently preceded remodeling in the other. Interestingly, even though the Munc13-1 and PSD-95 contents of individual synapses changed considerably over 15–22 h, Munc13-1/PSD-95 ratios, which varied over a fourfold range, were well conserved over these durations. These findings indicate that the “stoichiometries” of presynaptic and postsynaptic molecules can genuinely differ among synapses and that synapses can maintain their specific stoichiometries even in face of extensive presynaptic and postsynaptic remodeling.
Introduction
An ultrastructural hallmark of glutamatergic synapses in the mammalian CNS is the precise juxtaposition of presynaptic and postsynaptic membranal specializations, namely, the presynaptic active zone (AZ) and the postsynaptic density (PSD). Indeed, when quantitative comparisons are made between ultrastructural measures of these features at single synapses, these often correlate quite well (Harris and Stevens, 1989; Schikorski and Stevens, 1997; Murthy et al., 2001). When similar comparisons of molecular and functional features are done, however, correlations between such presynaptic and postsynaptic features, although positive, can be rather imperfect (for example, see Regalado et al., 2006; Tokuoka and Goda, 2008; Micheva et al., 2010; Kay et al., 2011). Although such imperfect correlations might simply reflect measurement inaccuracies, they might also reflect important aspects of synaptic composition and function: First, they might imply that presynaptic and postsynaptic “stoichiometries,” that is, relative quantities of presynaptic and postsynaptic molecules, differ significantly from one synapse to another. A second, more intriguing possibility is that presynaptic and postsynaptic molecular contents fluctuate continuously and asynchronously, as reported for rapid fluctuations of juxtaposed spine and bouton volumes (Umeda et al., 2005); thus, when comparisons are made at single time points (as done in fixed tissue), presynaptic and postsynaptic matching might be underestimated. In line with the latter possibility, recent live imaging studies indicate that synaptic molecules and synaptic vesicles continuously move in, out, and between synapses (for review, see Staras, 2007; Renner et al., 2008; Specht and Triller, 2008; Gerrow and Triller, 2010; Staras and Branco, 2010; Opazo et al., 2012); consequently, contents of individual synapses continuously change in both activity-dependent and independent manners (Yasumatsu et al., 2008; Minerbi et al., 2009; Matz et al., 2010; Fisher-Lavie et al., 2011; Herzog et al., 2011; Zeidan and Ziv, 2012). How well are changes in the molecular contents of one compartment matched with changes in their transsynaptic counterparts? Do such changes occur concurrently or can these occur “out of step”? If so, do changes in one compartment consistently precede changes in the other? Do individual synapses conserve particular “stoichiometries” even when their molecular contents change? If so, how stable are such stoichiometries over long time scales?
To address these questions, we measured, over many hours, the matching dynamics of two prominent presynaptic and postsynaptic proteins, namely Munc13-1 and PSD-95. Specifically, we examined the presynaptic and postsynaptic “stoichiometry” of these molecules at individual synapses, the degree to which changes in presynaptic Munc13-1 contents were matched with concomitant changes in postsynaptic PSD-95 contents, the dynamics of these matching processes, and the degree to which synapses preserved their specific “stoichiometries” over time.
Materials and Methods
Cell culture, DNA constructs, and transduction.
Cortical neuronal cultures were prepared from 0- to 1-d-old postnatal Munc13-1EYFP/EYFP knock-in mice (Kalla et al., 2006) of either sex and grown in 8 mm glass cloning cylinders as described previously (Kalla et al., 2006). Neurons were used for experiments 16–24 d after plating.
PSD-95:mTurq was created by large-scale synthesis (Genscript) of an AgeI-PSD95-mTurquoise-EcoRI fragment based on published sequences for PSD-95 (NM_019621.1) and mTurquoise (Goedhart et al., 2010; http://wwwmc.bio.uva.nl/Joachim/Sequences/pmTurquoise-C1.gb). PSD-95:EGFP in the lentiviral construct FU(PSD-95:EGFP)W (Minerbi et al., 2009) was replaced with the synthesized fragment at the AgeI and EcoRI sites. Viruses were produced in HEK293T cells as described previously (Minerbi et al., 2009). Transduction was performed on day 5 in vitro by adding 3–5 μl of filtered, unconcentrated supernatant to each cloning cylinder.
Long-term imaging.
Automated, multisite time-lapse microscopy was performed using a custom-built confocal laser-scanning microscope controlled by custom-written software (Fisher-Lavie et al., 2011). Images were acquired using an oil-immersion 40×, 1.3 NA Fluar objective. PSD-95:mTurq and Munc13-1:EYFP were excited using the 457 and 514 nm lines of an argon laser (JDS Uniphase), respectively, and emissions read using 467–493 nm and 520–570 bandpass filters, respectively (Semrock, Chroma). A mixture of 95% air, 5% CO2 was continuously streamed into a custom-built enclosure placed over the cells. The objective was heated to 36°C, resulting in temperatures of‘∼35°C in the culture medium. In experiments in which activity was blocked, imaging was performed in the presence of TTX (1 μm; Alomone), CNQX (10 μm; Tocris Bioscience), and AP-5 (50 μm; Sigma).
Time-lapse imaging was performed by averaging 6 frames (640 × 480 pixels, at 12 bits/pixel) at 8–10 focal planes spaced 0.8 μm apart. Data were collected automatically and sequentially from up to nine predefined fields of view using a robotic XY-stage. Focal drift was corrected before collecting each image stack using the systems “autofocus” feature.
Image analysis.
Image analysis was performed using custom-written software (“OpenView”) on maximal intensity projections of z-section stacks. Intensities of fluorescent puncta were measured as mean pixel values in 4 × 4 pixel (∼1 × 1 μm) rectangular regions centered on individual puncta, thus minimizing contamination from neighboring fluorescent objects; comparisons with total fluorescence values for well-separated synapses revealed excellent correlations between the two measures (4 sites, r = 0.89, 0.93, 0.80, 0.92; 34, 41, 39, and 35 puncta, respectively). The rectangular regions were recentered on the same puncta in the time series using OpenView's automatic tracking algorithms. All tracking was verified and, if necessary, corrected manually. Tracking was performed separately for Munc13-1:EYFP/PSD-95:mTurq clusters. Only data from unequivocally tracked Munc13-1:EYFP and PSD-95:mTurq puncta that remained juxtaposed throughout the entire experiments were included. To allow for data pooling and correct for some variability in fluorescent proteins expression levels, fluorescent data were background subtracted and expressed as multiples of mean fluorescence levels measured for all tracked puncta of each neuron. Data analysis was completed using MATLAB (MathWorks) and Microsoft Excel. Final images were prepared using Adobe Photoshop and Microsoft PowerPoint.
Results
The presynaptic AZ and postsynaptic PSD play essential roles in the organization and regulation of synaptic transmission (for review, see Sheng and Kim, 2011; Südhof, 2012). To evaluate the matching dynamics of these synaptic specializations, we followed and compared changes in the synaptic contents of two major AZ and PSD components, namely Munc13-1 and PSD-95. Munc13-1 is a core AZ component that plays critical roles in synaptic vesicle release. PSD-95 is a core postsynaptic scaffolding protein that interacts, directly and indirectly, with glutamate receptors, adhesion molecules, signaling proteins, and other scaffolding molecules and thus controls many aspects of PSD integrity and function. To follow the synaptic contents of these molecules, we prepared primary cultures of cortical neurons from Munc13-1EYFP/EYFP knock-in mice (Kalla et al., 2006; Fisher-Lavie et al., 2011) in which Munc13-1, fused to EYFP, is expressed from the Munc13-1 genomic locus. Prior analysis has shown that synapses in these mice are functionally identical to those of wild-type mice and that Munc13-1:EYFP expression levels are identical to those of Munc13-1 in WT mice (Kalla et al., 2006). As shown in Fig. 1A, Munc13-1:EYFP assumed a punctate pattern previously shown to correspond to functional presynaptic sites (Kalla et al., 2006). To follow changes in PSD-95 content, we used a lentiviral vector to sparsely express mTurquoise-tagged PSD-95 (PSD-95:mTurq; Fig. 1A). As we previously reported, similarly sparse transduction of EGFP-tagged PSD-95 leads to very low overexpression levels and does not perturb network characteristics (Minerbi et al., 2009; Kaufman et al., 2012).
Figure 1.
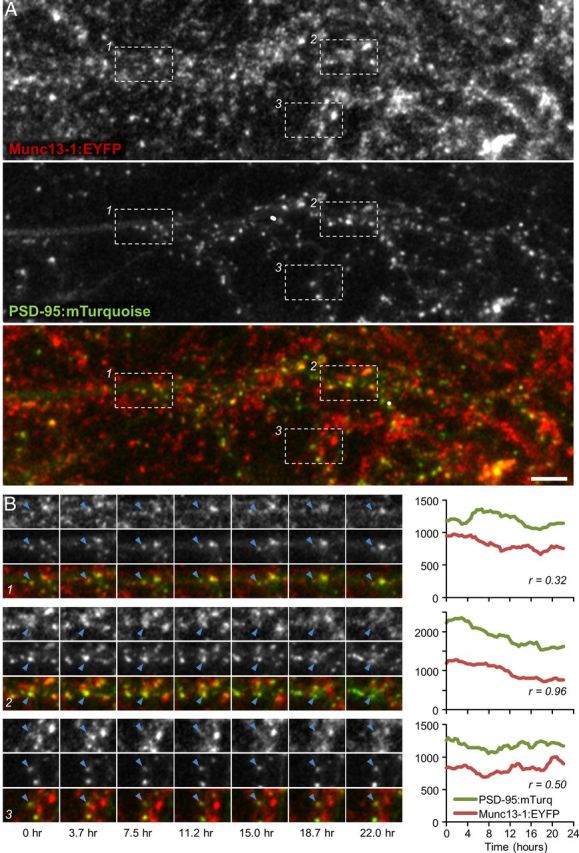
Concurrent remodeling of presynaptic and postsynaptic compartments. A, Cortical neurons in primary culture prepared from Munc13-1:EYFP KI neurons (top), in which sparse expression of PSD95:mTurq was induced (middle). Scale bar, 10 μm. B, Time lapse images of three synapses (blue arrowheads) enclosed within rectangles in A. Fluorescence intensity profiles for Munc13-1:EYFP and PSD-95:mTurq and temporal correlation coefficients (Pearson's r) for these profiles are shown to their right.
To explore the matching dynamics of these molecules, neurons expressing Munc13-1:EYFP and PSD-95:mTurq were mounted on a custom-built confocal microscope and maintained in a sterile atmospheric environment of 5% CO2, 95% air at ∼35°C. Automated time lapse imaging was then performed at 25 min intervals (8–10 sections at each time point) for 15–22 h (Fig. 1B). After the experiments, juxtaposed Munc13-1:EYFP and PSD-95:mTurq puncta were tracked in image time series, and their fluorescence values were quantified. Stringent criteria were used to maximize the likelihood that juxtaposed puncta represented bona fide presynaptic and postsynaptic compartments of the same synapses (for details, see Materials and Methods). All fluorescent data were smoothed with a 5-point low pass filter to minimize measurement noise effects, background subtracted, and normalized to mean fluorescence levels for each neuron (to correct for some variability in tagged protein expression levels), and thereafter expressed as multiples of mean fluorescence.
In agreement with prior studies, synaptic contents of both Munc13-1:EYFP (Fisher-Lavie et al., 2011) and PSD-95:mTurq (Minerbi et al., 2009; Kaufman et al., 2012; Zeidan and Ziv, 2012) changed considerably over time (Fig. 1B). To quantify the temporal covariance of Munc13-1:EYFP and PSD-95:mTurq contents, Pearson correlation was used to calculate the correlation between temporal changes in Munc13-1:EYFP and PSD-95:mTurq fluorescence at the same synapses. As shown in Figure 1B, Pearson's correlation coefficients differed from one synapse to the other. In some synapses, the correlation was very high (e.g., Fig. 1B; synapse 2, r = 0.96), whereas in others it was quite low (e.g., Fig. 1B; synapse 1, r = 0.34). The distribution of correlation coefficients for all 544 synapses (eight neurons) followed in these experiments exhibited a broad distribution, from high correlation coefficients (the majority) through low and even negative correlation coefficients (average r = 0.355; Fig. 2A). Unlike these correlation values that were strongly skewed toward positive values, correlation coefficients calculated for all combinations of presynaptic and postsynaptic sites belonging to unrelated synapses (295,392 combinations) were distributed symmetrically around 0 (Fig. 2A). This indicates, not surprisingly perhaps, that presynaptic Munc13-1:EYFPand postsynaptic PSD-95:mTurq contents covary much beyond what would be expected from chance.
Figure 2.
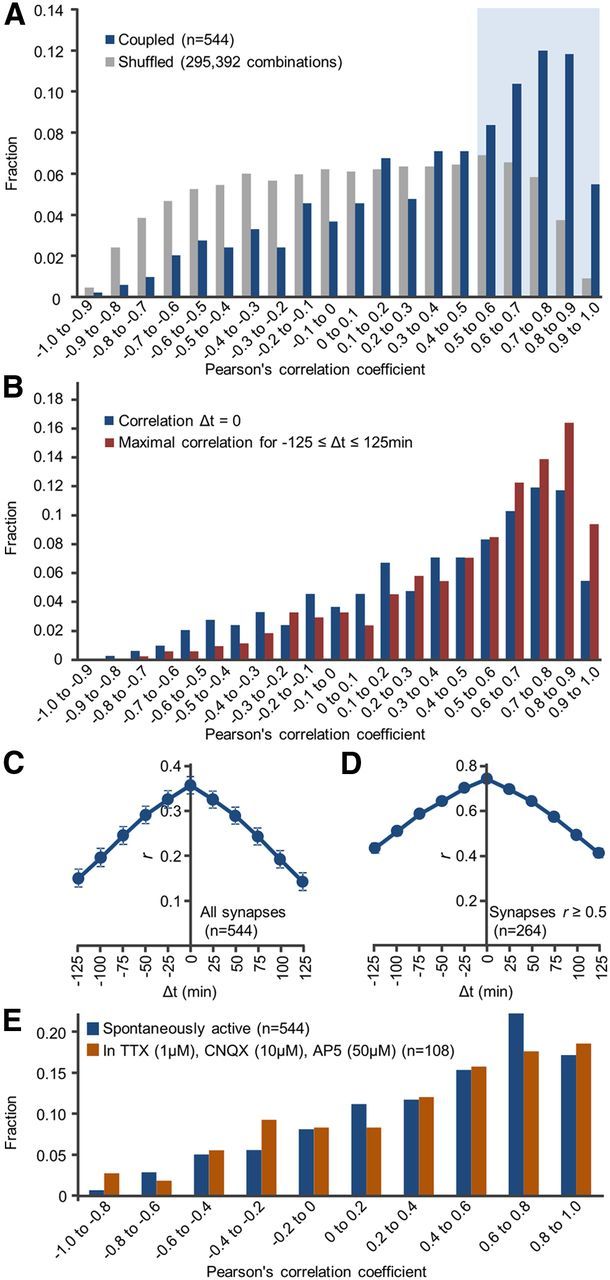
Temporal correlations between Munc13-1:EYFP and PSD95:mTurq at individual synapses. A, Distribution of temporal correlation coefficients for all synapses (“coupled”; red) and for all combinations of unassociated Munc13-1:EYFP and PSD-95:mTurq puncta (“shuffled”; gray, 295,392 combinations). Blue area represents synapses for which r ≥ 0.5. B, Distribution of best correlation coefficients obtainable by temporally offsetting changes in one compartment in respect to other by ±125 min. C, Mean ± SEM cross-correlation values for all synapses. D, Only for synapses for which r ≥ 0.5. E, Distribution of temporal correlation coefficients in the presence of pharmacological agents that block glutamatergic synapses and network activity.
A potential problem with this form of analysis is the assumption that changes in presynaptic and postsynaptic contents occur concurrently. If, however, changes in one compartment lag behind or precede changes in the other compartment, presynaptic and postsynaptic matching fidelity would be underestimated. We thus systematically calculated, for each synapse, the best correlation obtainable when temporally offsetting changes in one compartment in respect to other by −125 to +125 min. Although this procedure increased overall correlation values (as might be expected), it did not qualitatively change the distribution of presynaptic and postsynaptic temporal correlation coefficients (Fig. 2B). Moreover, cross-correlation analysis for all synapses indicated that, on average, the highest degree of correlation was obtained at zero temporal lead/lag (Fig. 2C), negating a systematic tendency for changes in one compartment to precede changes in the other, at least at the time resolution of these experiments.
The finding that changes in Munc13-1:EYFPand PSD-95:mTurq contents were independent or even anticorrelated for some synapses was quite unexpected. This might indicate that matching dynamics of presynaptic and postsynaptic properties can be rather complex (see Discussion). However, they might also indicate that some Munc13-1:EYFP and PSD-95:mTurq puncta assigned to the same synapses were actually unrelated, a possibility that could not be entirely ruled out given the density of Munc13-1:EYFP puncta. Comparisons of temporal correlations for relatively well-separated synapses to those measured for more densely packed synapses in the same fields of view did not reveal statistically significant differences (0.26 ± 0.51 and 0.38 ± 0.45, mean ± SD, p = 0.34, Kolmogorov–Smirnov test, 74 and 154 synapses, respectively; data not shown). Nevertheless, because of inherent limitations of light microscopy in unequivocally matching presynaptic and postsynaptic partners, we repeated the analysis only for synapses for which temporal correlation coefficients were >0.5 (blue area in Fig. 2A). Here, too, the highest degree of correlation was obtained at zero temporal lead/lag (Fig. 2D). Finally, blocking synaptic transmission and network activity (using TTX, CNQX, and AP5; see Materials and Methods) did not significantly change the degree of Munc13-1:EYFP and PSD-95:mTurq fluorescence covariance compared with spontaneously active networks (Fig. 2E; 108 synapses, 3 neurons; p = 0.88, Kolmogorov–Smirnov test).
As mentioned in the Introduction, imperfect correlations between presynaptic and postsynaptic molecular features might stem from single time-point (“single snapshot”) analyses of poorly synchronized presynaptic and postsynaptic matching processes. To illustrate this point, fluorescence values of Munc13-1:EYFP and PSD-95:mTurq were plotted against each other for all synapses at three time points (1, 7.5, and 14 h) from the beginning of the experiments (Fig. 3A). In common with prior studies (see Introduction) correlations between Munc13-1:EYFP and PSD-95:mTurq contents were positive, but correlation coefficients were not high (0.42–0.45). When particular synapses were examined in all three plots, however, it became apparent that their positions in such plots could change considerably over time (illustrated for five synapses in Fig. 3A). Interestingly, in some cases, synapses seemed to preserve particular “stochiometries,” whereas in others, they clearly did not (Fig. 3B).
Figure 3.

Changes in Munc13-1:EYFP/PSD-95:mTurq ratios over time. A, Normalized fluorescence values of Munc13-1:EYFP and PSD-95:mTurq plotted against each other at three different times. Five particular synapses are color coded in all three plots (all from the r ≥ 0.5 population shown in Fig. 2A). Dashed lines indicate unity ratios. B, Changes over time in Munc13-1:EYFP/PSD-95:mTurq ratios (on a Log2 scale) for the same five color-coded puncta. For some synapses, these ratios (“stoichiometries”) were rather stable, whereas for others they were more variable.
The mobility of synapses in such plots raises an intriguing question: What part of parameter space do individual synapses explore over time? Is exploration extensive or is each synapse confined to a much smaller subspace? Importantly, is exploration isotropic or confined to directions that preserve the stoichiometry of each synapse? To examine this question, we plotted, for each synapse and at each time point, its Munc13-1:EYFP against its PSD-95:mTurq normalized fluorescence values, thus obtaining the entire space of Munc13-1:EYFP/PSD-95:mTurq fluorescence combinations measured in these experiments (Fig. 4A). Plotting on the same graph the values for the same five synapses of Figure 3 indicated that these explored a restricted range of Munc13-1:EYFP and PSD-95:mTurq values, which was mainly confined to a “stoichiometry-conserving” imaginary line (i.e., a line along which the ratio of Munc13-1:EYFP to PSD-95:mTurq fluorescence remained approximately constant). Quantification for all synapses (Fig. 4B) indicated that on average, synapses explored ∼3% of this space over 15 h (∼17% of the range for each reporter separately). For synapses with r ≥ 0.5, these values were 3.5% and 19%, respectively. Importantly, most exploration occurred along “stoichiometry-conserving” diagonal lines and only to a lesser extent in directions perpendicular to such lines. This was quantified by dividing, for each synapse, each time step into a component parallel to a “stoichiometry-conserving” line and a component orthogonal to this line, as illustrated in Figure 4C. These components were added up separately for all time steps and used to calculate an orthogonal to parallel travel ratio. The distribution of these ratios was highly skewed toward “parallel” exploration (Fig. 4D), suggesting that individual synapses tend to conserve particular Munc13-1:PSD-95 “stoichiometries” even as they undergo substantial remodeling. It is important to emphasize, however, that the particular stoichiometries preserved by individual synapses varied broadly. The distribution of “stoichiometry-conserving” line slopes, representing the Munc13-1:YFP/PSD-95:mTurq ratios of each synapse, ranged from ∼≤0.5 to ≥2.0 (average = 1.08 ± 0.39; Fig. 4E), approximately a fourfold range. The coefficients of variation of “stoichiometry-preserving” line slopes, when calculated separately for each cell (0.36 ± 0.08, average ± SD) were practically identical to the global coefficient of variation (0.36); thus, this distribution cannot be attributed to variations in Munc13-1:EYFP or PSD-95:mTurq expression levels in different cells.
Figure 4.
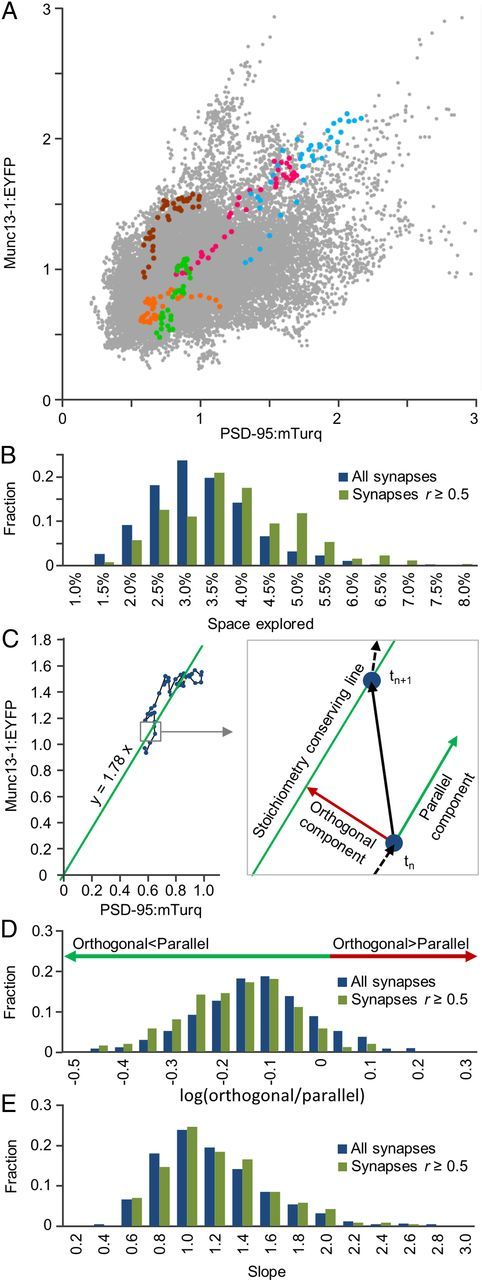
Synapses conserve specific but variable Munc13-1:EYFP/PSD-95:mTurq “stoichiometries.” A, Parameter space of Munc13-1:EYFP/PSD-95:mTurq fluorescence values, obtained by plotting these values for all synapses at all time points. Data for the five synapses of Figure 3 are shown according to same color code. B, Distributions of fractional parameter space area explored by individual synapses. C, Decomposition of exploration into parallel and orthogonal components relative to “stoichiometry-conserving lines.” The slopes of these lines were calculated separately for each synapse by linear regression, forcing the offset constant to zero. D, Distributions of orthogonal/parallel travel ratios. There is a strong bias toward ratios < 1.0. E, Distributions of “stoichiometry-conserving line” slopes.
Discussion
In the current study, we used live imaging to follow the matching dynamics of the AZ molecule Munc13-1:EYFP and the PSD molecule PSD-95:mTurq at individual synapses. Over time scales of hours, synapses exhibited substantial remodeling, during which changes in the synaptic contents of these two molecules were generally well correlated. Interestingly, the specific ratios of Munc13-1:EYFP to PSD-95:mTurq at individual synapses varied over a fourfold range, and these ratios were relatively well conserved even when synapses underwent substantial remodeling. These findings indicate that the remodeling of presynaptic and postsynaptic compartments is generally well coordinated but also indicate that synapses might genuinely vary in terms of presynaptic and postsynaptic molecular “stoichiometries.”
As described in the Introduction, live imaging studies strongly indicate that the molecular contents of individual synapses fluctuate substantially in both activity-dependent and independent manners. These fluctuations have been taken to indicate that the tenacity of individual synapses (their capacity to maintain their particular properties) is inherently limited (Minerbi et al., 2009; Fisher-Lavie et al., 2011). In this respect, it is interesting to consider how correlations between presynaptic and postsynaptic fluctuations would affect synaptic tenacity. Assuming that the contents of synaptic molecules affect presynaptic output/postsynaptic input, the net effect of uncorrelated fluctuations might be, on average, rather small, as presynaptic and postsynaptic fluctuations would often cancel out each other. If, on the other hand, such fluctuations are temporally correlated, as we observed here, their impact on synaptic function would be additive, strengthening previous observations on the inherently limited tenacity of CNS synapses.
As illustrated in Figure 4A, individual synapses explored considerable portions of Munc13-1:EYFP versus PSD-95:mTurq parameter space. Importantly, most of this exploration occurred along the “stoichiometry-conserving” axis of each synapse (which would be expected given the generally positive temporal correlations between Munc13-1:EYFP and PSD-95:mTurq contents). These findings are in good agreement with a recent electrophysiological study performed in rat cortical neurons (Loebel et al., 2013). In this study, paired recordings were performed twice from the same neurons at an interval of 12 h, during which efficacies of synaptic connections between such pairs were found to change over a 10-fold range. By performing compound stimulation paradigms and fitting responses to a model, it was concluded that the changes in synaptic efficacies mainly reflected modifications in the number of presynaptic release sites, which were well matched to corresponding postsynaptic changes, but not with changes in the probability of release (Pr) or quantal size. Based on these findings, the authors predicted that changes in postsynaptic spine size would be tightly associated with comparable changes in presynaptic bouton size. Our findings are perfectly in line with this prediction. Moreover, if matched changes in Munc13-1 and PSD-95 contents correlate with changes in synaptic efficacy, our findings would predict the aforementioned findings of Loebel and colleagues (see also Murthy et al., 2001). On the other hand, it should be noted that intrasynaptic feedback has also been shown to drive homeostatic adaptive processes that compensate for changes occurring across the synaptic cleft (e.g., Frank et al., 2006; Branco et al., 2008, Xu et al., 2013; for review, see Branco and Staras, 2009). Although not directly comparable, such adaptations are more reminiscent of anticorrelated presynaptic and postsynaptic changes or the “orthogonal exploration” illustrated in Figure 4, C and D. Indeed, for a minority of synapses, temporal correlations between Munc13-1:EYFP and PSD-95:mTurq contents were poor or even negative, and many synapses exhibited significant orthogonal exploration. Such dynamics would be in line with compensatory or adaptive processes occurring across the synaptic cleft. Alternatively, such poor or even negative correlations might also indicate that, for some synapses, remodeling across the synaptic gap is poorly coordinated (see also Umeda et al., 2005). Finally, as mentioned above, we cannot rule out the possibility that some of the poor correlations reflect comparisons between synaptic compartments belonging to different synapses.
In conclusion, our findings indicate that imperfect correlations between presynaptic and postsynaptic molecular properties, represented here by Munc13-1:EYFP and PSD-95 contents, cannot be solely attributed to measurement inaccuracies (noise) or to “single snapshot” analyses of asynchronous remodeling processes. The first claim is based on the fact that correlating time-averaged fluorescence measurements of each synapse (average of 37 measurements) does not increase the correlation coefficients of Munc13-1:EYFP and PSD-95:mTurq fluorescence values (r = 0.44 for time averaged fluorescence values compared with 0.46 > r > 0.41 for 37 single time point correlations as in Fig. 3A). The second claim is based on the preferred exploration along “stoichiometry preserving” lines and the fact that temporal changes in Munc13-1:EYFP/PSD-95:mTurq ratios account for only ∼13% of the variance in the synaptic population (or ∼33% of the SD). Our findings thus indicate that imperfect correlations between presynaptic and postsynaptic molecular properties probably reflect genuine heterogeneities in presynaptic and postsynaptic “stoichiometries” (over a fourfold range, in this particular case) yet also demonstrate that individual synapses can maintain their particular stoichiometries remarkably well even in face of extensive remodeling.
Footnotes
This work was supported by the United States Israel Binational Science Foundation (2007425) and the European Union Seventh Framework Programme under Grant Agreement HEALTH-F2–2009-241498 (“EUROSPIN”). We thank Larisa Goldfeld, Michal Stern, and Leonid Odesski for their invaluable technical assistance.
The authors declare no competing financial interests.
References
- Branco T, Staras K. The probability of neurotransmitter release: variability and feedback control at single synapses. Nat Rev Neurosci. 2009;10:373–383. doi: 10.1038/nrn2634. [DOI] [PubMed] [Google Scholar]
- Branco T, Staras K, Darcy KJ, Goda Y. Local dendritic activity sets release probability at hippocampal synapses. Neuron. 2008;59:475–485. doi: 10.1016/j.neuron.2008.07.006. [DOI] [PMC free article] [PubMed] [Google Scholar]
- Fisher-Lavie A, Zeidan A, Stern M, Garner CC, Ziv NE. Use dependence of presynaptic tenacity. J Neurosci. 2011;31:16770–16780. doi: 10.1523/JNEUROSCI.3384-11.2011. [DOI] [PMC free article] [PubMed] [Google Scholar]
- Frank CA, Kennedy MJ, Goold CP, Marek KW, Davis GW. Mechanisms underlying the rapid induction and sustained expression of synaptic homeostasis. Neuron. 2006;52:663–677. doi: 10.1016/j.neuron.2006.09.029. [DOI] [PMC free article] [PubMed] [Google Scholar]
- Gerrow K, Triller A. Synaptic stability and plasticity in a floating world. Curr Opin Neurobiol. 2010;20:631–639. doi: 10.1016/j.conb.2010.06.010. [DOI] [PubMed] [Google Scholar]
- Goedhart J, van Weeren L, Hink AM, Vischer NO, Jalink K, Gadella TW., Jr Bright cyan fluorescent protein variants identified by fluorescence lifetime screening. Nat Methods. 2010;7:137–139. doi: 10.1038/nmeth.1415. [DOI] [PubMed] [Google Scholar]
- Harris KM, Stevens JK. Dendritic spines of CA 1 pyramidal cells in the rat hippocampus: serial electron microscopy with reference to their biophysical characteristics. J Neurosci. 1989;9:2982–2997. doi: 10.1523/JNEUROSCI.09-08-02982.1989. [DOI] [PMC free article] [PubMed] [Google Scholar]
- Herzog E, Nadrigny F, Silm K, Biesemann C, Helling I, Bersot T, Steffens H, Schwartzmann R, Nägerl UV, El Mestikawy S, Rhee J, Kirchhoff F, Brose N. In vivo imaging of intersynaptic vesicle exchange using VGLUT1 Venus knock-in mice. J Neurosci. 2011;31:15544–15559. doi: 10.1523/JNEUROSCI.2073-11.2011. [DOI] [PMC free article] [PubMed] [Google Scholar]
- Kalla S, Stern M, Basu J, Varoqueaux F, Reim K, Rosenmund C, Ziv NE, Brose N. Molecular dynamics of a presynaptic active zone protein studied in Munc13-1-enhanced yellow fluorescent protein knock-in mutant mice. J Neurosci. 2006;26:13054–13066. doi: 10.1523/JNEUROSCI.4330-06.2006. [DOI] [PMC free article] [PubMed] [Google Scholar]
- Kaufman M, Corner MA, Ziv NE. Long-term relationships between cholinergic tone, synchronous bursting and synaptic remodeling. PLoS One. 2012;7:e40980. doi: 10.1371/journal.pone.0040980. [DOI] [PMC free article] [PubMed] [Google Scholar]
- Kay L, Humphreys L, Eickholt BJ, Burrone J. Neuronal activity drives matching of pre- and postsynaptic function during synapse maturation. Nat Neurosci. 2011;14:688–690. doi: 10.1038/nn.2826. [DOI] [PubMed] [Google Scholar]
- Loebel A, Le Bé JV, Richardson MJ, Markram H, Herz AV. Matched pre- and post-synaptic changes underlie synaptic plasticity over long time scales. J Neurosci. 2013;33:6257–6266. doi: 10.1523/JNEUROSCI.3740-12.2013. [DOI] [PMC free article] [PubMed] [Google Scholar]
- Matz J, Gilyan A, Kolar A, McCarvill T, Krueger SR. Rapid structural alterations of the active zone lead to sustained changes in neurotransmitter release. Proc Natl Acad Sci U S A. 2010;107:8836–8841. doi: 10.1073/pnas.0906087107. [DOI] [PMC free article] [PubMed] [Google Scholar]
- Micheva KD, Busse B, Weiler NC, O'Rourke N, Smith SJ. Single-synapse analysis of a diverse synapse population: proteomic imaging methods and markers. Neuron. 2010;68:639–653. doi: 10.1016/j.neuron.2010.09.024. [DOI] [PMC free article] [PubMed] [Google Scholar]
- Minerbi A, Kahana R, Goldfeld L, Kaufman M, Marom S, Ziv NE. Long-term relationships between synaptic tenacity, synaptic remodeling, and network activity. PLoS Biol. 2009;7:e1000136. doi: 10.1371/journal.pbio.1000136. [DOI] [PMC free article] [PubMed] [Google Scholar]
- Murthy VN, Schikorski T, Stevens CF, Zhu Y. Inactivity produces increases in neurotransmitter release and synapse size. Neuron. 2001;32:673–682. doi: 10.1016/S0896-6273(01)00500-1. [DOI] [PubMed] [Google Scholar]
- Opazo P, Sainlos M, Choquet D. Regulation of AMPA receptor surface diffusion by PSD-95 slots. Curr Opin Neurobiol. 2012;22:453–460. doi: 10.1016/j.conb.2011.10.010. [DOI] [PubMed] [Google Scholar]
- Regalado MP, Terry-Lorenzo RT, Waites CL, Garner CC, Malenka RC. Transsynaptic signaling by postsynaptic synapse-associated protein 97. J Neurosci. 2006;26:2343–2357. doi: 10.1523/JNEUROSCI.5247-05.2006. [DOI] [PMC free article] [PubMed] [Google Scholar]
- Renner M, Specht CG, Triller A. Molecular dynamics of postsynaptic receptors and scaffold proteins. Curr Opin Neurobiol. 2008;18:532–540. doi: 10.1016/j.conb.2008.09.009. [DOI] [PubMed] [Google Scholar]
- Schikorski T, Stevens CF. Quantitative ultrastructural analysis of hippocampal excitatory synapses. J Neurosci. 1997;17:5858–5867. doi: 10.1523/JNEUROSCI.17-15-05858.1997. [DOI] [PMC free article] [PubMed] [Google Scholar]
- Sheng M, Kim E. The postsynaptic organization of synapses. Cold Spring Harb Perspect Biol. 2011:a005678. doi: 10.1101/cshperspect.a005678. 3pii. [DOI] [PMC free article] [PubMed] [Google Scholar]
- Specht CG, Triller A. The dynamics of synaptic scaffolds. Bioessays. 2008;30:1062–1074. doi: 10.1002/bies.20831. [DOI] [PubMed] [Google Scholar]
- Staras K. Share and share alike: trading of presynaptic elements between central synapses. Trends Neurosci. 2007;30:292–298. doi: 10.1016/j.tins.2007.04.005. [DOI] [PubMed] [Google Scholar]
- Staras K, Branco T. Sharing vesicles between central presynaptic terminals: implications for synaptic function. Front Synaptic Neurosci. 2010;2:20. doi: 10.3389/fnsyn.2010.00020. [DOI] [PMC free article] [PubMed] [Google Scholar]
- Südhof TC. The presynaptic active zone. Neuron. 2012;75:11–25. doi: 10.1016/j.neuron.2012.06.012. [DOI] [PMC free article] [PubMed] [Google Scholar]
- Tokuoka H, Goda Y. Activity-dependent coordination of presynaptic release probability and postsynaptic GluR2 abundance at single synapses. Proc Natl Acad Sci U S A. 2008;105:14656–14661. doi: 10.1073/pnas.0805705105. [DOI] [PMC free article] [PubMed] [Google Scholar]
- Umeda T, Ebihara T, Okabe S. Simultaneous observation of stably associated presynaptic varicosities and postsynaptic spines: morphological alterations of CA3-CA1 synapses in hippocampal slice cultures. Mol Cell Neurosci. 2005;28:264–274. doi: 10.1016/j.mcn.2004.09.010. [DOI] [PubMed] [Google Scholar]
- Xu W, Tse YC, Dobie FA, Baudry M, Craig AM, Wong TP, Wang YT. Simultaneous monitoring of presynaptic transmitter release and postsynaptic receptor trafficking reveals an enhancement of presynaptic activity in metabotropic glutamate receptor-mediated long-term depression. J Neurosci. 2013;33:5867–5877. doi: 10.1523/JNEUROSCI.1508-12.2013. [DOI] [PMC free article] [PubMed] [Google Scholar]
- Yasumatsu N, Matsuzaki M, Miyazaki T, Noguchi J, Kasai H. Principles of long-term dynamics of dendritic spines. J Neurosci. 2008;28:13592–13608. doi: 10.1523/JNEUROSCI.0603-08.2008. [DOI] [PMC free article] [PubMed] [Google Scholar]
- Zeidan A, Ziv NE. Neuroligin-1 loss is associated with reduced tenacity of excitatory synapses. PLoS One. 2012;7:e42314. doi: 10.1371/journal.pone.0042314. [DOI] [PMC free article] [PubMed] [Google Scholar]