

Abstract
Neural representation of acoustic stimuli in the mammal auditory cortex (AC) has been extensively studied using anesthetized or awake nonbehaving animals. Recently, several studies have shown that active engagement in an auditory behavioral task can substantially change the neuron response properties compared with when animals were passively listening to the same sounds; however, these studies mainly investigated the effect of behavioral state on the primary auditory cortex and the reported effects were inconsistent. Here, we examined the single-unit spike activities in both the primary and nonprimary areas along the dorsal-to-ventral direction of the cat's AC, when the cat was actively discriminating click-trains at different repetition rates and when it was passively listening to the same stimuli. We found that the changes due to task engagement were heterogeneous in the primary AC; some neurons showed significant increases in driven firing rate, others showed decreases. But in the nonprimary AC, task engagement predominantly enhanced the neural responses, resulting in a substantial improvement of the neural discriminability of click-trains. Additionally, our results revealed that neural responses synchronizing to click-trains gradually decreased along the dorsal-to-ventral direction of cat AC, while nonsynchronizing responses remained less changed. The present study provides new insights into the hierarchical organization of AC along the dorsal-to-ventral direction and highlights the importance of using behavioral animals to investigate the later stages of cortical processing.
Introduction
The main function of the auditory cortex (AC) is to extract representative features of different auditory events that provide the foundation for auditory perception. For this reason, the neural encoding of sound parameters has been extensively studied for several decades using various sound stimuli and animals; however, the majority of previous studies recorded neural activities in anesthetized or awake nonbehaving animals just passively listening to sound stimuli. Recently, several studies have shown that active engagement in an auditory behavioral task can substantially change the neuron response properties compared with when animals were passively presented with the same sounds (Fritz et al., 2003; Otazu et al., 2009; Lee and Middlebrooks, 2011; Niwa et al., 2012a). The reported changes due to task engagement were various, such as the suppression of neural responses (Otazu et al., 2009) or increased sensitivity to task-related sound features (Fritz et al., 2003; Lee and Middlebrooks, 2011; Niwa et al., 2012a; for review, see Sutter and Shamma, 2011). These results shed light on the importance of investigating behavioral modulation of auditory representations in AC neurons.
The mammalian AC is considered to hierarchically process sound signals through multiple cortical subdivisions. Although the number and definition of AC subdivisions largely vary among animal species, a broad distinction can be made between tonotopic and nontonotopic areas. Tonotopic areas, such as the primary auditory cortex (AI), contain a systematically organized map of characteristic frequency (CF; the frequency at the lowest sound pressure level that evokes a response), while nontonotopic areas do not have a precise CF map (Hackett et al., 1998; Kaas and Hackett, 2000; Lee et al., 2004; Winer and Lee, 2007). To date, the effects of task engagement on the activity of neurons have been mainly studied in tonotopic areas. How the animal's behavioral state modulates neural representation in nontonotopic areas remains unknown. In an effort to further our understanding of auditory representations among the different areas of the AC, the present study examined neural responses in both tonotopic and nontonotopic AC areas, when cats were engaged in an auditory discrimination task and when they were passively listening to the same stimuli.
We adopted trains of acoustic clicks (click-trains) as stimuli. Click-trains can elicit different percepts depending on the click repetition rate. For human listeners, acoustic events repeated at low rates (10–45 Hz) are heard as distinct fluctuations in loudness known as acoustic flutter, whereas higher repetition rates (50–300 Hz) are heard increasingly as rough continuous sound (Kay, 1982; Joris et al., 2004). Such sounds provide convenient methodological tools to study the representation of timing information in the auditory system. In the present study, we recorded the neural responses of AC to the click-trains at the repetition rate of 12.5 and 50 Hz. We found that the changes of neural activity due to task engagement were more prominent in the nontonotopic AC area than in the tonotopic area. The coding strategy of the click repetition rate also varied among different AC areas.
Materials and Methods
Apparatus.
The behavioral experiments occurred in a custom-built behavioral cage (54 × 44 × 49 cm) that was acoustically transparent and placed in an electrically shielded, sound-attenuated chamber. The cats were able to move freely in the cage, and a video camera and photoelectric sensors were used to monitor the cats' position and movement. Custom-built software in a MATLAB (MathWorks) environment interacted with the apparatus via digital input–output hardware (PCI-6052E; National Instruments). Sound signals were digitally created by custom-built software and generated using the D/A converter at a sampling rate of 100 kHz, then passed through an amplifier (PMA-2000; Denon). Two different speakers were used to deliver the sound stimuli. During behavioral experiments, the sounds were delivered via an earphone (NW-STUDIO PRO W; Ninewave), which was screwed into the earphone holder fixed on the cat's skull during the surgery (see below). The placement of the earphone was adjusted to 1 cm from the ear canal without causing discomfort to the cat. Sound calibration was conducted using a Brüel & Kjaer 1/2 inch condenser microphone with a pre-amplifier 2669 positioned 1 cm in front of the earphone. During anesthetized experiments to examine the CF of AC neurons, the sounds were delivered from a speaker (K1000; AKG) placed 2 cm from the auricle contralateral to the recording site. The system frequency transfer function was flat up to 32 kHz (±6 dB). The pure-tone stimuli were 0.15–32 kHz, and 160 ms long with a 5 ms linear ramp.
Behavioral task.
The cats were trained to use their head to block a photoelectric sensor for at least 2 s to trigger the onset of the sound stimulus. The sound stimuli were periodic click-trains with click repetition rates of either 12.5 Hz or 50 Hz (monopolar, rectangular pulse of 0.2 ms duration; 320 ms train duration). The amplitude of click-trains was adjusted to subjective intensity equal to 60 dB sound pressure level of 4 kHz pure tone. Subjects were required to respond to a 50 Hz click-train (target) by licking a metal pipe during a 0.5–3 s response window following the offset of the sound stimulus, and then obtained a drop of liquid food. When the sound was a 12.5 Hz click-train (nontarget), no food reward was presented, and the subjects were required to wait for the onset of the next trial. The trials of target and nontarget stimuli were randomly presented. Under passive conditions, the same stimuli with the same intertrial interval were presented, but the reward pipe was removed so subjects could not perform the task.
Behavioral training.
Using a method similar to our previous studies (Qin et al., 2009; Liu et al., 2010; Dong et al., 2011; Zhang et al., 2011, 2012), we trained five male cats to perform a Go/No-go task to discriminate different click-trains. Initially, the cats were deprived of food to 80% of their free-feeding body weight, but had access to water ad libitum. The cats were first trained to lick a metal pipe on sound presentation to obtain a drop of liquid food. Cats learned this procedure within 1 week. Then they were trained to use their head to block a photoelectric sensor for at least 3 s to trigger the onset of sound stimulus. Generally, cats needed 2–4 weeks to become familiar with the method to initiate a trial. Next, we used 50 and 12.5 Hz click-trains as target and nontarget stimuli, respectively. Cats were required to lick the metal pipe when a target was presented (hit), and not to lick when a nontarget was presented (correct rejection). There were also two types of error responses: licking when a nontarget was presented (false alarm) and not licking at the presentation of a target (miss). Subjects were positively reinforced only for the hit response. We did not give any punishment, if the subject responded on nontarget stimuli. By gradually decreasing the proportion of target and increasing the proportion of nontarget, the animals learned to not respond to nontarget and wait for a target to obtain rewards more efficiently. Training was conducted continuously 5 d per week. A cat could actively perform 200–300 trials every day, divided into 2–3 sessions.
The subjects' performance in each session was quantified via an “adjusted measure” of the proportion of correct responses: p(correct) = [p(hits) + (1 − p(false alarms))]/2 × 100%. If the subject shows a Go response in all target trials [p(hits) = 100%], but not in any nontarget trials [p(false alarms) = 0], the percentage correct is 100%, indicating perfect discrimination. The ratio of target to nontarget stimuli was initially set at 80:20, and gradually decreased to 50:50 once the cat's percentage correct reached >75%. The cats required from 2–4 months to establish a stable performance (percentage correct ≥75%) to discriminate the target/nontarget stimuli at a ratio of 50:50 for five consecutive sessions. They then received surgery for electrode implantation; therefore, these animals were highly trained before recording experiments. During physiological recording sessions, the ratio of target to nontarget stimuli was always 50:50.
Surgical preparation and electrode implantation.
The surgical procedures were similar to those previously described (Dong et al., 2011; Zhang et al., 2012). Briefly, cats were anesthetized with sodium pentobarbital (30 mg/kg) and fixed to a stereotaxic frame (SN-3N; Narishige). According to stereotaxic coordinates, we marked the positions of the anterior ectosylvian sulcus (AES) and posterior ectosylvian sulcus (PES) on the bone surface. The main part of the cat's AC was located between AES and PES (Winer and Lee, 2007; Lee and Winer, 2008; Mellott et al., 2010). Four small holes were drilled over the occipital bone and fine jeweler's screws were inserted to serve as an anchor for a metal block that was cemented to the skull with dental acrylic. A screw nut was implanted into the cement platform as an earphone holder. After the cement had hardened, the head was held through the metal block and the ear bars were removed. We then drilled several small holes (0.5–1 mm diameter) in the temporal bone above the potential location of AC. A tungsten microelectrode (diameter: 250 μm; impedance: 2–5 MΩ at 1 kHz; FHC) was advanced into the cortex using a micromanipulator to examine the neural responses to tonal stimuli at each site. According to the characteristics of the tonotopic gradient, we identified the locations of AI and the nontonotopic areas ventral to AI. We then implanted a microwire array following the method developed by Jackson and Fetz (2007). The microwire consisted of 12 (2 × 6) Teflon-insulated 50 μm diameter tungsten wires (part #795500; A-M Systems) running inside polyamide guide tubes of 225 μm internal diameter (part #822200; A-M Systems). The tip impedance of each wire was ∼0.5 MΩ at 1 kHz. For implantation, a 5 × 3 mm craniotomy was made at the location of AC with a dental bur. The microwire array was then lowered into position using a custom-made manipulator so that the ends of the guide tubes rested just above the dura mater over AC. Wires were inserted into the cortex until the tips of the electrodes were 1.0–2.0 mm below the dura, while viewing through a microscope and listening to an audio monitor of the recorded signal. The craniotomy was then filled with SILASTIC, a silicone elastomer (World Precision Instruments) and sealed using dental acrylic. Plastic casing was attached with further skull screws and cement.
Physiological recording.
The recording experiment started after 1–2 weeks of postoperative recovery. The physiological recording was conducted while free-moving cats were conducting the discrimination task in the behavioral box. A wireless headstage transmitter (W16; TBSI) was mounted on the skull fixture and connected to the implanted microwires. After pre-amplification, the neural signals were bandpass filtered (0.3–7 kHz) and amplified (×600) by a high bandwidth amplifier and modulated to the 3.2 GHz carrier frequency. The output signals of the wireless transmitter were captured by an analog receiver placed 2 m outside the behavioral box and fed into a digital signal processing module (RX7; TDT). The neural waveforms were digitized and stored on the computer hard disk using OpenEx software of TDT for later analysis. Each day, each microwire was independently advanced to avoid having multiple recording sessions with the same subset of cells. We cannot precisely estimate what cortical laminas were recorded by the implanted wires. Since the microwires were initially inserted 1–2 mm below the dura, then advanced over the course of the recordings, the recordings likely were in the middle and infragranular layers. After the quality of recording deteriorated, microwires were removed and new microwires were implanted into other cortical areas or into the other hemisphere under similar aseptic surgical procedures. Each animal received 3–9 sets of microwires.
At the end of all of the experiments, the animal was deeply anesthetized and perfused with 10% formalin. The cerebral cortex was cut into coronal sections (100 μm slice) and stained with neutral red. The recording sites were confirmed according to the lesions caused by the electrode tips. This report was based on the units from AC between AES and PES.
Data analysis.
Off-line spike sorting using OpenSorter software (TDT) was performed to include only single-unit spikes in the analysis. Spike activities driven by click-trains were aligned along the stimulus onset, constructing a raster plot of each trial (see Fig. 2A). The peristimulus time histogram (PSTH), counting the spikes across target or nontarget trials, was computed in 1 ms bin width (Fig. 2C,D; for visualization purposes, the PSTH was smoothed by Gaussian function with 5 ms SD). To compare neural responses between active and passive conditions, the height of the PSTH was transformed into the “driven rate” by subtracting the background firing rate (firing rate averaged over all trials during the 0.5 s period before a trial was triggered). The mean + 2 SD of the background firing rate across all trials was deemed as the threshold level to identify a significant response. The analysis time window to access a sound-evoked response was set from click-train onset to 50 ms after its offset to include both onset and offset responses. During this time window, a neuron showing a firing rate over the threshold level was designated a click-train responsive neuron. Neurons that did not respond to the click-trains were excluded from further analysis in this paper.
Figure 2.
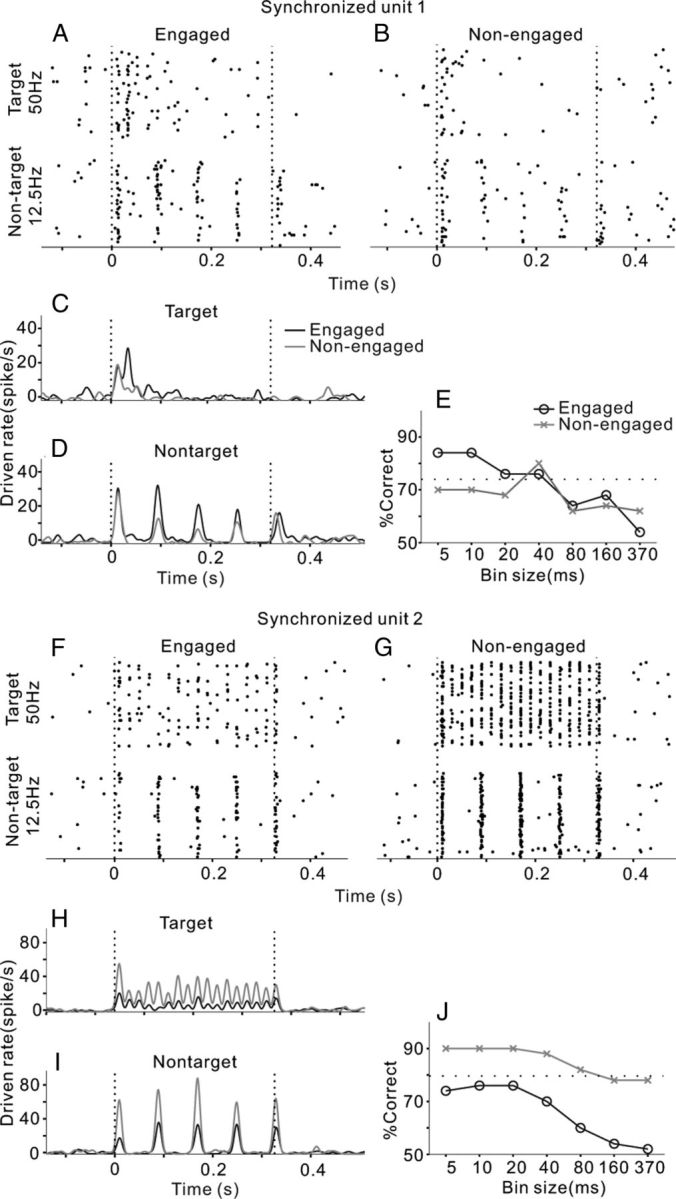
Two examples of single-unit responding to click-trains under engaged and nonengaged conditions. A, F, Raster plots of neural spikes in 50 trials of target and nontarget stimuli (50 and 12.5 Hz) under engaged conditions. Vertical dashed lines indicate the onset and offset of sound stimulus. B, G, Raster plots under the nonengaged condition. C, H, PSTH of the mean driven rate (1 ms bin, smoothed by Gaussian function with 5 ms SD) responding to target stimuli. D, I, PSTH responding to nontarget stimuli. E, J, Percentage correct of click-train discrimination is plotted as a function of the bin size in neurometric analysis. Note that both units exhibited spikes synchronized to the 12.5 Hz click-trains, while one was enhanced and the other was suppressed under the engaged condition relative to the nonengaged condition. Both units were recorded from the dorsal area of AC (distance to MSS was 4.5 and 5.3 mm, respectively).
Vector strength (VS; Goldberg et al., 1969) was used to measure the degree to which the neural response was concentrated in a particular phase of the repetition period of the clicks as seen in the following:
 |
where n is the total number of spikes, ti is the time of spike occurrence, and T is the interclick interval. VS values ranged from zero (spikes evenly distributed throughout the stimulus period) to one (spikes are perfectly aligned to a particular phase of the stimulus period). The VS of each neuron was calculated over the time period starting from 50 ms after stimulus onset to 50 ms after stimulus offset. A neural response was considered to be synchronized to the click if the Rayleigh statistic (RS), 2nVS2, exceeded 13.8 (p < 0.001) (Mardia and Jupp, 2000).
Neurometric analysis based on the spike distance metric was used to test how well the responses of a neuron discriminate the click-trains (Foffani and Moxon, 2004; Narayan et al., 2006; Wang et al., 2007; Dong et al., 2011; Ma et al., 2013). For each neuron, a PSTH of one trial was chosen and removed from the data, referred to as the test trial. The remaining trials were grouped into target and nontarget stimulus sets. A template PSTH of each stimulus was then constructed using the mean of each set of the remaining trials. Next, we examined whether we could determine which stimulus elicited the test PSTH by comparing how similar the test PSTH was to the target and nontarget PSTH templates. For this, we calculated the Euclidian distance (ED) between the test and template PSTH, which is the square root of the sum of squared differences between firing rates at each bin (i).
ED =, where nbin is the total number of bins, and x and y are bin heights.
If the test and template PSTH were similar, then ED would be small. If they were different, then ED would be large. The test PSTH was assigned to be the stimulus that had the most similar PSTH template. This procedure was repeated until each trial of a neuron was considered as test data. The percentage of correct classification (% correct) was calculated as the percentage of the total number of trials in which the correct stimulus was selected. The chance level for classification was 50%, because a PSTH could be equally assigned to the nontarget or target set when there were no response preferences.
This neurometric analysis was conducted during 0–370 ms after the onset of target or nontarget stimulus onset. PSTH during this period was constructed at various bin sizes to explore the temporal precision of neural encoding. All neurons were tested using bin sizes of 5, 10, 20, 40, 80, 160, and 370 ms. The 5 ms bin size retains the most temporal information, whereas the 370 ms bin is equivalent to the mean firing rate.
Results
We successively implanted multiple electrode arrays in both hemispheres of the AC in five adult male cats; in total, 276 (23 sets × 12 channels) electrodes were implanted and 391 single-unit spike activities were recorded. Approximately 50–70% of implanted electrodes could yield stable single-unit recording, and 1–3 units could be collected from each of such electrodes. The recording sites were confirmed to be located between the sulci of AES and PES using the histological method at the end of the experiment. The results of two example cats are illustrated in Figure 1A and B. Filled circles mark the sites from where the unit data in this paper were obtained. Because we focused on the properties of auditory response in this paper, all the units were included in our analysis only if they showed a significant response to the target or nontarget sounds. The following analysis is based on 271 of the 391 collected units. The spike activities were recorded while the cats were in the engaged and nonengaged conditions. All subjects maintained high levels of performance during neural recording sessions; the mean behavioral performance during the trials included in the neural analyses below was 77% correct, suggesting that they tolerated the implants well and were still able to behave at a high level of performance. The data of nonengaged blocks were always collected after completion of the engaged blocks. We confirmed that cats were not attempting to engage in the task during the nonengaged condition with video monitoring. The spike waveforms recording from different blocks were compared using the off-line spike sorting software (OpenSorter; TDT). The spikes with the identical waveforms across recording blocks were analyzed in this paper.
Figure 1.
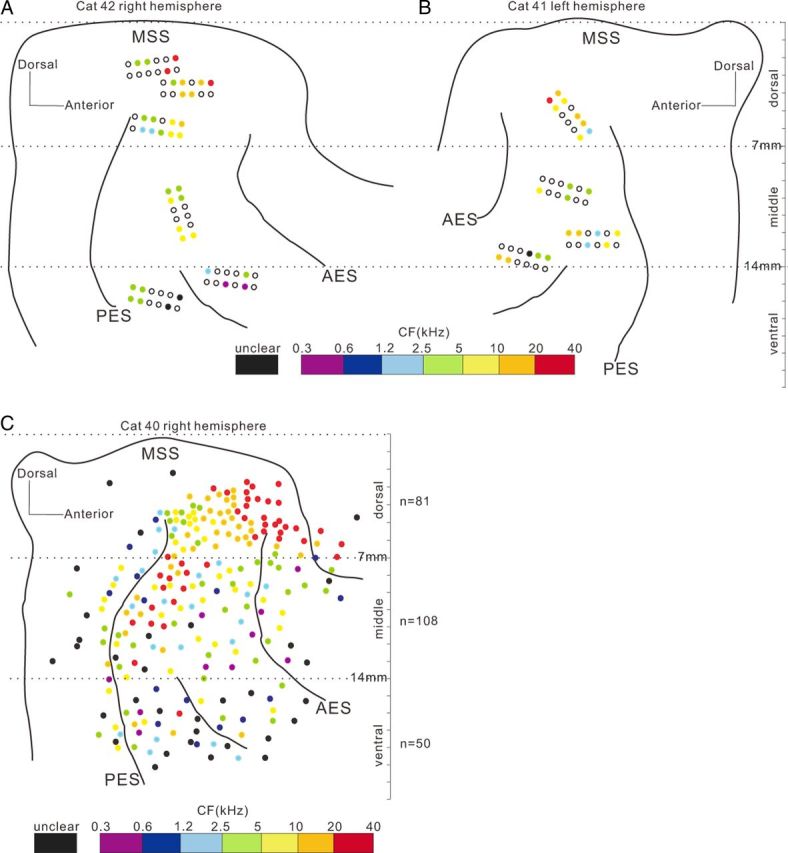
Schematic of the AC shown by the principle sulci. A, B, Spatial distribution of cortical implanted electrodes in two representative cats. Filled circles represent electrode sites at which unit data were obtained. Color shows the CFs (color legend at bottom). Black-outlined and colorless circles represent electrode sites without unit data. Dashed lines are the borders used to divide units into dorsal, middle, and ventral areas. C, Spatial distribution of CF systematically examined through a single electrode on a head-fixed cat, indicating a difference of pure-tone responsiveness among the areas delineated by 7 and 14 mm lines to MSS. Neurons dorsal to the 7 mm line showed a clear gradient of CF along the posterior–anterior direction. Between 7 and 14 mm lines, the CF gradient disappeared. In the area ventral to the 14 mm line, more neurons did not respond to pure tones and the CF was unclear, represented by black dots.
Neural response patterns of individual examples and effects of behavioral state
AC neurons responded to the click-trains with a variety of temporal firing patterns. The effect of task engagement also varied among the recorded units. One unit that we examined (Fig. 2A) fired several bursts of spikes synchronizing to the 12.5 Hz click-train, but only a burst of spikes after the onset of the 50 Hz click-train. We used RS to evaluate the significance of spike synchronization to clicks (see Materials and Methods). RS in this unit was >13.8 (corresponding to p < 0.001 in the Rayleigh test) at 12.5 Hz repetition rates and <13.8 at 50 Hz. When the cat was in the nonengaged condition, the temporal response pattern of this unit remained unchanged (Fig. 2B), but the amplitude of the neural response decreased. To compare the differences in response amplitude under engaged and nonengaged conditions, we plotted the mean PSTHs of the same stimuli together in Figure 2, C and D, showing that the driven rate in the engaged condition (black line) is higher than that in the nonengaged condition (gray line). The mean driven rate (0–370 ms time window) of the engaged trials was significantly higher than that of the nonengaged trials for both the 12.5 and 50 Hz click-trains (t test, p < 0.01). We then calculated the neurometrics to look at whether temporal patterns or firing rate of neural responses can discriminate the sounds, and how task engagement affects the performance of neural discrimination (see Materials and Methods). Figure 2E shows the percentage correct of the neural discriminator as a function of temporal precision (bin size) under engaged and nonengaged conditions (black and gray lines). Under the engaged condition, the performance of the discriminator increased as the temporal resolution of the data became finer (decreased in bin size), suggesting that the different click-trains were better discriminated by the temporal pattern of the response than the mean firing rate. The neural performance at 5–10 ms bin size was even higher than the cat's behavioral performance (dotted line). The neural performance under the nonengaged condition showed a similar function against bin size, but was lower than that under the engaged condition, suggesting that the ability of this unit to discriminate click-trains deteriorated if the subject did not actively discriminate the sounds.
The results of the other synchronized unit are shown in Figure 2F–J. The spike time of this unit significantly synchronized to both the 12.5 and 50 Hz click-trains (RS > 13.8); however, the mean driven rates in nonengaged trials were significantly higher than in the engaged trials (t test, p < 0.01), and the percentage correct of neural discrimination was also higher under the nonengaged condition.
There were also some neurons whose spike time did not significantly synchronize to any of the tested click-trains; two examples are present in Figure 3. One unit showed a vigorous response that continued throughout the entire period of the 50 Hz click-train, but weakly scattered responses to the 12.5 Hz click-train (Fig. 3A). Although the mean PSTH averaged over 50 trials showed a fluctuation (Fig. 3C,D), no significant stimulus-response synchronization was found by the RS with both 12.5 and 50 Hz click-trains. Such a nonsynchronized neuron encodes the click repetition rate by changing the mean firing rate, which has been proposed to have a special role in periodicity perception (Lu et al., 2001; Bendor and Wang, 2007). Neurometric analysis revealed that neural discrimination based on the mean firing rate (370 ms time window) achieved a good performance, which remained unchanged with the increase of temporal precision (Fig. 3E). Thus, the spike time of the nonsynchronized responses did not provide additional information to show the click repetition rate. Furthermore, task engagement largely increased this neuron's driven rate (t test, p < 0.01) and discrimination performance.
Figure 3.
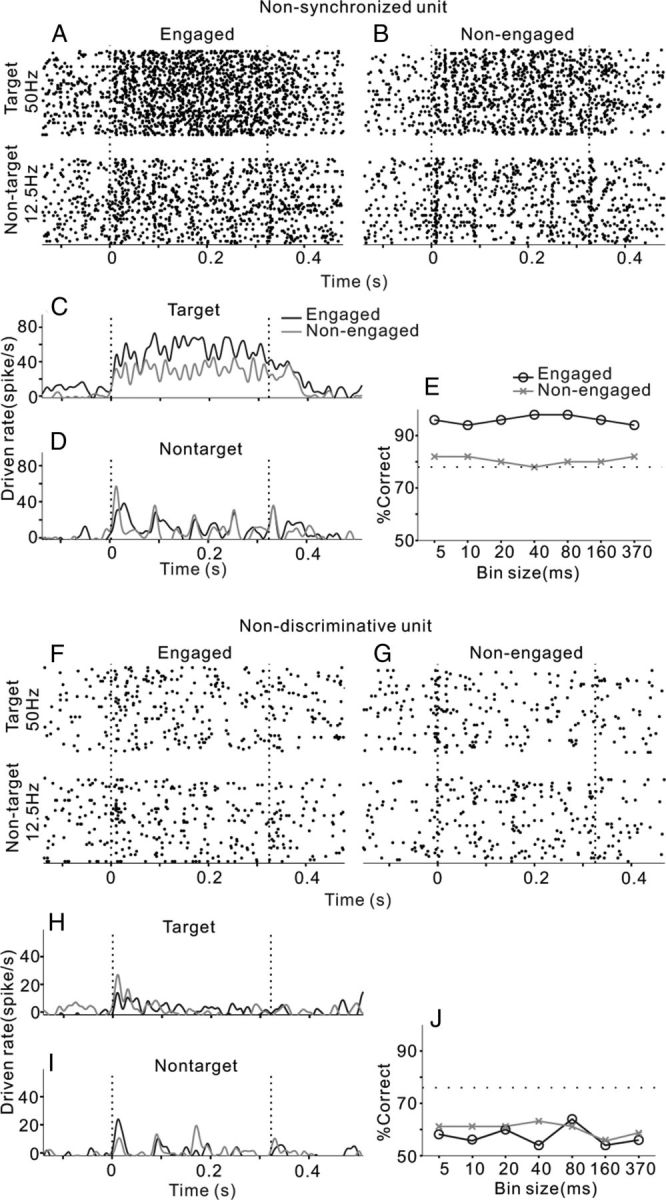
Two example units. One showed a nonsynchronized response to the click-trains (A–E), which was recorded from middle area of AC (distance to MSS was 9.5 mm). The other showed an obscure response that could not provide sufficient information to discriminate target and nontarget stimuli (F–J), which was recorded from ventral area of AC (distance to MSS was 14.5 mm). Same format as Figure 2.
The fourth example unit was weakly driven by 12.5 and 50 Hz click-trains (Fig. 3F). As shown by the mean PSTHs (Fig. 3H,I), the neural response mainly occurred at stimulus onset. There was no significant difference between the mean driven rates of target and nontarget stimuli (t test, p > 0.05). The discrimination performance based on the spike activities of this unit was poor at any bin size (Fig. 3J), suggesting that neither the spike time nor firing rate of this unit can provide sufficient information for discrimination of the click-trains. We thus designated such a neuron as a nondiscriminative neuron. Task engagement did not significantly change the neural driven rates (t test, p > 0.05) and the performance of neural discrimination.
Effect of task engagement on the neural firing rate in different AC areas
The results of the above individual examples indicate that both the effect of the behavioral state and the temporal pattern of neural responses varied among the recorded AC units. We first summarize how the neural firing rates in the different AC areas were modulated by the behavioral state. For this, we divided the recording sites into three areas, dorsal, middle, and ventral, based on the distance to middle suprasylvian sulcus (MSS) in the dorsoventral direction (Fig. 1). The boundaries delineating the three areas were set at 7 and 14 mm ventral to MSS (horizontal line). The specific choice of 7 and 14 mm boundary points was based on our preliminary study on the properties of neural response to pure tone. Before the implantation experiment, we have systematically examined the distribution of CF among the AC areas in two naive cats. The cats were prepared for the chronic recording under head-fixed awake condition, using the methods of our previous studies (Qin et al., 2009; Liu et al., 2010; Zhang et al., 2011). We sampled the AC areas in ∼0.5 mm step through single electrode penetrations, as the cats were passively listening to pure-tone stimuli (128–32,000 Hz). We found a difference of pure-tone responsiveness among the areas delineated by 7 and 14 mm lines. The result of CF distribution of a representative hemisphere is present in Figure 1C. The majority of neurons (96%) within 7 mm to MSS responded to pure tones and the CF distribution showed a clear gradient along the posterior–anterior direction. Between 7 and 14 mm to MSS, the proportion of neurons responding to pure tone was also high (89%), but the CF gradient disappeared. In the area > 14 mm to MSS, the proportion of pure-tone responsive neurons largely decreased (67%). When compared with the maps of histological studies (Winer and Lee, 2007; Lee and Winer, 2008; Mellott et al., 2010), the dorsal, middle, and ventral areas approximately corresponded to the AI, the secondary auditory cortex (AII), and insular cortex (In) and temporal cortex (Te), respectively. It should be noted that the boundaries between different areas may not be so clear. We divided the AC into three areas in this study just for the purpose to illustrate the change of neural response properties along the dorsoventral direction of AC. Among our data of the five cats, the proportion of neuron responding to click-trains under engaged condition was 85% (94/124), 72% (74/103), and 63% (103/164) in dorsal, middle, and ventral areas, respectively.
The spontaneous firing rates in each neuron population are presented by scatter plots comparing engaged and nonengaged firing rates in Figure 4A–C. The spontaneous firing rate in all three populations was slightly but significantly higher in the engaged than the nonengaged condition (paired t test, p < 0.05). The driven rates of nontarget and target sound (spontaneous rate has been subtracted from the firing rate) are shown in Figure 4, E and F and I–K, respectively. The driven rates were significantly different in all the comparisons (paired t test, p < 0.01). It was noteworthy that, in the dorsal area (Fig. 4E,I), task engagement enhanced the driven rate in the majority of units (77% in nontarget and 85% in target), but also suppressed the driven rate in a minority of units (23 and 15%). On moving to the middle (Fig. 4F,J) and ventral groups (Fig. 4G,K), though the percentage of units that showed a higher driven rate in the engaged condition did not obviously change (middle: 73% in nontarget, 81% in target; ventral: 80% in nontarget, 91% in target), the extent of behavioral enhancement increased.
Figure 4.
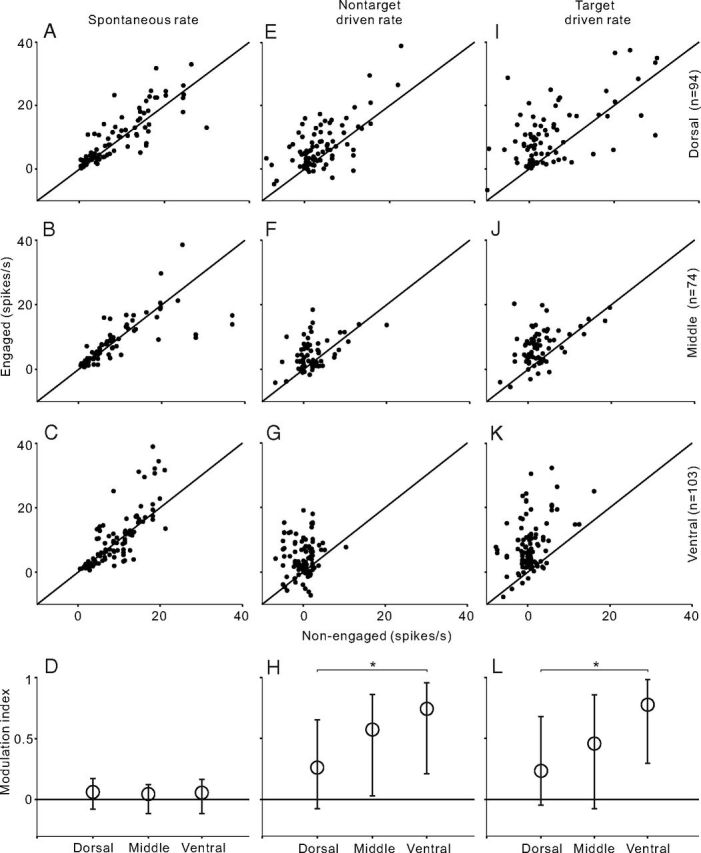
Comparison of firing rates between engaged and nonengaged conditions across neuron populations recorded from different AC areas. A–C, Scatter plot of spontaneous firing rate across the population of dorsal, middle, and ventral AC areas, respectively. E–G, Scatter plot of driven rate of nontarget stimulus. I–K, Scatter plot of driven rate of target stimulus. D, H, L, Modulation index for spontaneous rate and driven rates of nontarget and target stimulus. Circles and bars represent the median and the 25th and 75th percentile in the population of each AC area. Asterisk indicates that the difference of modulation index between dorsal and ventral neurons is statistically significant (p < 0.05, ANOVA followed by post hoc test).
To quantify the extent of behavioral modulation, we calculated a modulation index, defined as (Rateengaged − Ratenonengaged)/(Rateengaged + Ratenonengaged). The modulation index ranges from −1(complete suppression in the engaged condition) to +1 (complete enhancement in the engaged condition). The distribution of the modulation index of spontaneous rate was slightly biased to the positive side in all three unit populations (Fig. 4D, circle represents the median, bars represent 25th and 75th percentile). No significant difference was found among the results of different groups (ANOVA, p > 0.1); however, the distribution of the modulation index of the driven rate largely deviated from 0 and the deviation gradually increased from the dorsal to ventral group (Fig. 4H,L). ANOVA followed by post hoc test revealed that the modulation index of the ventral group was statistically significantly higher than that of the dorsal group (p < 0.05), and the difference between dorsal and middle group was not significant (p > 0.05). These results indicate that engaging in the discrimination task enhanced the sound-evoked response in AC neurons, and this enhancement became more prominent in the ventral part of AC.
Patterns of neural representation of click-trains in different AC areas
We then summarized the patterns of neural responses to reveal how the click-trains are represented in different AC areas. As shown by the individual examples, the sound-evoked responses under the engaged condition can be divided into three types. The first is the synchronized unit, which showed significant synchrony to the click-trains. This type of unit can be subdivided into two groups according to their synchronizing ability. Some synchronized to both 12.5 and 50 Hz click-trains (Fig. 2F), others synchronized only to 12.5 Hz click-train (Fig. 2A). The spike time of all these units carried precise information for the discrimination of click-trains. The second is the nonsynchronized unit, which did not synchronize to the click-trains, but its mean firing rate can be used to discriminate click-trains; see the example shown in Figure 3A–E. The third is the unit in which the mean driven rates of target and nontarget stimuli were not significantly different. The percentage correct of discrimination based on the spike activities was poor (<65%) at any bin size. This type of unit was called a nondiscriminative unit; an example unit is shown in Figure 3F–J.
Figure 5 illustrates the proportions of different unit types in each part of AC under the engaged condition. In the dorsal area (AI), a large number of neurons (57%) showed responses synchronized to the click-trains, including 21% of the neurons had a high synchronizing ability (synchronized to both 12.5 and 50 Hz), and the other 22% of neurons were nonsynchronized, but their mean firing rate can encode the discriminative information of click-trains. In the middle and ventral areas (nontonotopic AC), the percentage of synchronized neurons largely decreased, while that of nonsynchronized neurons increased a little, especially the percentage of neurons with high synchronizing ability decreased to 5 and 4% in the middle and ventral areas, respectively.
Figure 5.

Comparison of the proportion of different types of units in the dorsal, middle, and ventral parts of AC. The synchronized units were subdivided into two groups according to their synchronizing ability: synchronized to both 12.5 and 50 Hz click-trains and only to 12.5 Hz click-train.
Behavioral effect on neurons with different response patterns
We further examined whether synchronized and nonsynchronized neural responses were differentially affected by the change in behavioral states. Because the proportion of neurons with high synchronizing ability was too low in the middle and ventral areas, we did not subdivide the synchronized units in the analysis below. Figure 6 shows the results comparing the neural responses under engaged and nonengaged conditions. In the dorsal area, the mean PSTHs of target and nontarget stimuli were not apparently changed by task engagement in both the synchronized (Fig. 6A,M) and nondiscriminative neuron groups (Fig. 6C,O). The difference between the mean driven rates of engaged and nonengaged conditions was not statistically significant (paired t test, p > 0.05). The 25th, 50th, and 75th percentile of modulation index in each neuron group are present in Figure 6, D and P, to reflect the average response changes on a neuron-by-neuron basis. The modulation indexes of synchronized and nondiscriminative neurons distributed across the 0 level, indicating that the responses were either increased in some neurons or decreased in other neurons. Because the enhanced and suppressed responses can cancel each other out, the change of mean PSTH appeared smaller. However, in the nonsynchronized group, the mean driven rates of both target and nontarget stimuli were significantly increased (paired t test, p < 0.01; Fig. 6B,N) and most of the modulation indexes distributed above 0 (Fig. 6D,P). Therefore, the main effect of task engagement on the nonsynchronized neurons was enhancement.
Figure 6.

Comparison of engaged and nonengaged responses in the different types of units. The left three columns (A, E, I, M, Q, U; B, F, J, N, R, V; and C, G, K, O, S, W) show PSTHs averaged across the populations of different unit types in the dorsal, middle, and ventral parts of AC. Black and white curves represent the mean PSTHs of engaged and nonengaged conditions, respectively. Shaded area represents SE. Vertical dashed lines indicate the onset and offset of stimulus. The right column (D, H, L and P, T, X) shows modulation index for driven rates in the dorsal, middle, and ventral parts of AC. Circles and bars represent the median and the 25th and 75th percentile in the population of each unit type.
In the middle area (Fig. 6E–H,Q–T), all three types of neural responses were significantly increased under the engaged condition compared with the nonengaged condition (paired t test, p < 0.01), but the most obvious change was found in the nonsynchronized response and the smallest change was found in the synchronized response. In the ventral area (Fig. 6I–L,U–X), the increase of the driven rate became more prominent in all three neuron groups and the enhancing effects were equal among the three neuron groups. These results are consistent with those of Figure 4 that sound-evoked responses in the ventral AC were more significantly modulated by the behavioral state.
The other interesting issue is whether the effect of task engagement is related to the neuron's intrinsic preference to click repetition rate. We compared the modulation indexes between the groups of high-rate-preference neurons (the neurons showed a mean driven rate of 50 Hz click-train higher than that of 12.5 Hz click-train under nonengaged condition) and low-rate-preference neurons (mean driven rate of 12.5 Hz higher than that of 50 Hz). However, we did not find any statistically significant difference between the high-rate and low-rate-preference neurons (t test, p > 0.05) in the three AC areas.
Behavioral effect on the neural discriminability of click-trains
Above we showed that the firing rate of AC neurons, especially in the ventral area, was increased by task engagement. We then investigated whether the enhanced responses contribute to the neural discrimination of different sound stimuli. Figure 7 shows the mean and SD of the neural discriminability (percentage correct) of each neuron group under engaged and nonengaged conditions. In synchronized neurons, the percentage correct of neural discrimination increased with the decreasing bin size in neurometric analysis, suggesting that the spike time of these neurons carries more precise information encoding the click repetition rate. Under engaged condition, the neural discrimination of all three AC areas peaks ∼70% correct when the spike time information was read out at 5 ms bin width. There was no significant difference between the best discrimination performances of different areas (ANOVA, p > 0.1). The main difference between areas is that under nonengaged condition the percentage correct based on fine-grained temporal information significantly dropped in the middle and ventral areas, while that of the dorsal area was unchanged. In nonsynchronized neurons, the percentage correct of neural discrimination with a large bin size was similar to that with a small bin size, because the spike time of these neurons carried less information encoding the click repetition rate. Task engagement significantly improved neural discriminability in all three AC areas, and the improvement in the ventral area was the largest. In nondiscriminative neurons, the percentage correct was generally lower than 60% at any bin sizes, and task engagement did not significantly improve the discriminability of neurons in all AC areas.
Figure 7.

A–C, Population neurometric is plotted as a function of bin size for engaged (solid symbols) and nonengaged (open symbols) conditions for different unit types in the dorsal part of AC. Error bar indicates SD. Asterisk indicates that the difference of percentage correct between engaged and nonengaged conditions is statistically significant (p < 0.05, t test). D–F, Population neurometric functions in the middle part of AC. G–I, Population neurometric functions in the ventral part of AC.
We then calculated the average improvement of percentage correct using all the data of synchronized and nonsynchronized neurons at their best bin width to compare the total effect of task engagement between different AC areas. ANOVA followed by post hoc tests revealed that the improvement of percentage correct in the middle and ventral areas (mean ± SD: 7.3 ± 3.6% and 6.5 ± 2.7%) was significantly higher than that in the dorsal area (3.2 ± 2.1%), and there was no significant difference between the middle and ventral areas.
Discussion
Effect of task engagement on the neural response of AC
It has been reported that AC neural activities changed when the experimental subject was engaged in an auditory behavioral task (Fritz et al., 2003; Scott et al., 2007; Otazu et al., 2009; Lee and Middlebrooks, 2011; Niwa et al., 2012a); however, the reported changes between behaving and passive conditions are inconsistent (varying from suppression to no change to enhancement). Otazu et al. (2009) reported that neural responses of rat AC to broadband clicks that precede tones are suppressed when rats are actively detecting the tone. This suppression of evoked responses was not accompanied by any changes in the spontaneous activity preceding stimulus presentation. Scott et al. (2007) founded that both driven and spontaneous firing rates of AI neurons were mostly elevated when monkeys were discriminating binaural cues for sound localization. Additionally, Niwa et al. (2012a) reported that both the evoked and spontaneous firing rates were higher in the behaving compared with the passive condition, but when the appropriate spontaneous rates were subtracted from the firing rate, the spontaneous-adjusted rate was lower in the behaving than the passive condition. This discrepancy may reflect differences in task and stimulus configurations (Sutter and Shamma, 2011). In this study, we found that the spontaneous rate was raised by task engagement, but the stimulus-evoked rate still significantly increased after removing the spontaneous rate. We further compared the behavioral effects on different AC areas. In the dorsal area (primary area), there were still some units in which the driven rate was suppressed under the engaged condition (Fig. 4E,I), suggesting that task engagement had a dual effect on the neural response of dorsal AC; in the ventral area (nonprimary area), task engagement exerted an enhancing effect in the overwhelming majority of neurons (Fig. 4G,K). However, it is still premature to conclude that sensory responses are generally enhanced in the nonprimary areas during behavior. Two recent studies in nonprimary AC using different behaviors have demonstrated sometimes decreased responses to sensory stimuli in humans (Mesgarani and Chang, 2012) and in nonhuman primates (Niwa et al., 2013). Thus, the behavioral effect on the nonprimary areas may be also dependent on the species and task requirement.
Active engagement has also been shown to change the tuning properties of AI neurons (Fritz et al., 2003; Lee and Middlebrooks, 2011). Fritz et al. (2003) found that many AI neurons exhibit facilitative frequency tuning changes when ferrets performed a tone detection task. Spatial tuning of AI neurons was sharpened when cats performed a task that required evaluation of the locations of sounds (Lee and Middlebrooks, 2011). The increase of neural sensitivity observed under behaving conditions might have represented an enhancement of the responses to preferred stimuli or might have resulted from increased suppression of the responses to less preferred stimuli. In this study, we found that the enhancement resulting from engagement was general for both 12.5 and 50 Hz click-trains, but was able to increase neural discriminability of the click repetition rate, that is, the accuracy of neural representation of temporal information is improved. This is consistent with the report that neural sensitivity to amplitude modulation improved due to behavioral engagement (Niwa et al., 2012a); however, Scott et al. (2007) reported that the percentage of monkey AI neurons in which discriminability was improved by behavioral engagement was similar to the percentage of neurons in which discriminability had deteriorated. They therefore suggested that neural activity recorded under passive conditions can validly represent the properties of core AC; this does not conflict with our results. We found that neural discriminability was less changed by the behavioral state in the dorsal area (corresponding to AI), especially for synchronized neurons; however, neural discriminability in the nonprimary AC was largely improved by task engagement. Hence, our result reveals the importance of investigating the neural responses of nonprimary AC under behaving conditions.
One weakness of our experiment is that we always set 50 Hz click-train as target and 12.5 Hz click-train as nontarget. Because the 50 Hz click-train was more frequently associated with active motor response and reward, it is difficult to disentangle the effects of task demands from temporal processing constraints. A study in the behaving ferret (David et al., 2012) has shown that the direction of behaviorally driven changes in AI responses depends on task structure, and that the same discrimination can lead to either enhanced or suppressed responses, depending on how rewards are paired with the task stimuli. Though it remains unclear whether the effects of behavioral training is equivalent across the engaged and nonengaged conditions, because the data of different AC areas were collected under the same experimental conditions, our main findings about the comparison between dorsal and ventral areas are still reasonable.
Neural coding of periodic sounds
Both human speech and animal vocalizations include a quasi-periodical repetition of acoustic events (Rosen, 1992; Singh and Theunissen, 2003). At low repetition rates (10 to ∼45 Hz), each individual stimulus within a sequence is perceived as a separate event. As repetition rates increase up to ∼50 Hz, these events blend together, giving rise to the percept of flutter and then to continuous sound (Kay, 1982; Joris et al., 2004). Previously, we have shown that cats having learned to distinguish 12.5 from 200 Hz click-trains could immediately discriminate repetition rates ≥50 Hz, but not those <50 Hz, from the 12.5 Hz repetition rate (Dong et al., 2011). In this study, we examined the neural responses to 12.5 and 50 Hz click-trains in different AC areas. It was found that some neurons can encode click-trains with phase locking to the clicks (synchronized response), while other neurons respond to click-trains by continuously firing throughout the stimulus period without synchronizing spike timing to the click (nonsynchronized response). Such nonsynchronized responses have been reported by other studies on the AC of monkeys (Lu et al., 2001; Bendor and Wang, 2007; Malone et al., 2007; Yin et al., 2011). Periodicity coding by phase locking (synchronized responses) often accompanies a change in the firing rate. Thus, synchronized neurons may use both temporal and rate codes, while nonsynchronized neurons are thought to use the rate to encode periodicity. There has been some evidence suggesting that the mean firing rate is more tightly correlated to behavior and decisions (Hernández et al., 2000; Lemus et al., 2009; Dong et al., 2011; Niwa et al., 2012b). It may be reasonable to interpret the rate code as a higher level coding strategy extracted from an accurate temporal code.
Functional architecture of cat AC
On the basis of physiological properties, connections to auditory thalamic nuclei (Reale and Imig, 1980; Schreiner and Cynader, 1984; Rouiller et al., 1991), and the effects of behavior-ablation studies (Cranford and Igarashi, 1977), at least 13 areas have been recognized on the cat AC (Imig and Morel, 1983; Lee and Winer, 2005; Winer and Lee, 2007). Among them, five areas have systematically organized maps of CF (Reale and Imig, 1980; Rouiller et al., 1991). Eight adjoining areas contain auditory responsive neurons that are not systematically organized according to CF (Schreiner and Cynader, 1984). By comparing the convergent intrinsic and extrinsic input to each area quantitatively, Lee and Winer (2011) suggests that the cat AC can be divided into families of tonotopic, nontonotopic, multisensory, and limbic-related areas, each with convergent input arising primarily from within its group. In this study, we recorded neural activity in cortical areas between AES and PES for convenience of access and the implantation of electrodes. The dorsal, middle, and ventral parts of our recorded AC corresponded to tonotopic, nontonotopic, and limbic-related areas, respectively.
Acoustic response properties in AI have been studied extensively with regard to frequency tuning, dynamic range, latency, intensity threshold, amplitude modulation rate, frequency modulation rate, and binaural response characteristics. The results suggest that AI may process sound signals in parallel by simultaneously presenting several representations of multiple sound features (Woods et al., 2006; Hackett, 2011). To date, far fewer physiological data are available on nontonotopic and limbic-related areas. Schreiner and Cynader (1948)reported that there is no orderly representation of frequency, sound location, and sharpness of tuning in AII. Our present data show that neurons in the ventral AC were largely modulated by the behavioral state. This may result from the abundant connections between the ventral AC and nonlaminated divisions of the medial geniculate nucleus, amygdaloid nucleus, and medial prefrontal cortex (Shinonaga et al., 1994; Clascá et al.,, 1997; Clascá et al., 2000), which have been proposed to constitute neuronal links in “emotional” and/or “motivational” circuitry in the forebrain (Romanski and LeDoux, 1992; Campeau and Davis, 1995; Morgan and LeDoux, 1999; Boatman and Kim, 2006). This is compatible with the notion that the ventral AC occupies a higher position in the cognitive hierarchy by integrating information about other sensory modalities and emotional and motivational modulation (Lee and Winer, 2011).
Footnotes
This study was supported by the Strategic Research Program for Brain Sciences 08038015 and Grant No. 23700377 from the Japan Ministry of Education, Culture, Sports, Science, and Technology (Y.S. and L.Q.) and the National Nature Science Foundation of China under Grant No. 31171057 (L.Q.). We thank N. Yaguchi for assistance with animal care.
The authors declare no competing financial interests.
References
- Bendor D, Wang X. Differential neural coding of acoustic flutter within primate auditory cortex. Nat Neurosci. 2007;10:763–771. doi: 10.1038/nn1888. [DOI] [PubMed] [Google Scholar]
- Boatman JA, Kim JJ. A thalamo-cortico-amygdala pathway mediates auditory fear conditioning in the intact brain. Eur J Neurosci. 2006;24:894–900. doi: 10.1111/j.1460-9568.2006.04965.x. [DOI] [PubMed] [Google Scholar]
- Campeau S, Davis M. Involvement of subcortical and cortical afferents to the lateral nucleus of the amygdala in fear conditioning measured with fear-potentiated startle in rats trained concurrently with auditory and visual conditioned stimuli. J Neurosci. 1995;15:2312–2327. doi: 10.1523/JNEUROSCI.15-03-02312.1995. [DOI] [PMC free article] [PubMed] [Google Scholar]
- Clascá F, Llamas A, Reinoso-Suárez F. Insular cortex and neighboring fields in the cat: a redefinition based on cortical microarchitecture and connections with the thalamus. J Comp Neurol. 1997;384:456–482. doi: 10.1002/(SICI)1096-9861(19970804)384:3<456::AID-CNE10>3.0.CO;2-H. [DOI] [PubMed] [Google Scholar]
- Clascá F, Llamas A, Reinoso-Suárez F. Cortical connections of the insular and adjacent parieto-temporal fields in the cat. Cereb Cortex. 2000;10:371–399. doi: 10.1093/cercor/10.4.371. [DOI] [PubMed] [Google Scholar]
- Cranford JL, Igarashi M. Effects of auditory cortex lesions on temporal summation in cats. Brain Res. 1977;136:559–564. doi: 10.1016/0006-8993(77)90081-6. [DOI] [PubMed] [Google Scholar]
- David SV, Fritz JB, Shamma SA. Task reward structure shapes rapid receptive field plasticity in auditory cortex. Proc Natl Acad Sci U S A. 2012;109:2144–2149. doi: 10.1073/pnas.1117717109. [DOI] [PMC free article] [PubMed] [Google Scholar]
- Dong C, Qin L, Liu Y, Zhang X, Sato Y. Neural responses in the primary auditory cortex of freely behaving cats while discriminating fast and slow click-trains. PLoS One. 2011;6:e25895. doi: 10.1371/journal.pone.0025895. [DOI] [PMC free article] [PubMed] [Google Scholar]
- Foffani G, Moxon KA. PSTH-based classification of sensory stimuli using ensembles of single neurons. J Neurosci Methods. 2004;135:107–120. doi: 10.1016/j.jneumeth.2003.12.011. [DOI] [PubMed] [Google Scholar]
- Fritz J, Shamma S, Elhilali M, Klein D. Rapid task-related plasticity of spectrotemporal receptive fields in primary auditory cortex. Nat Neurosci. 2003;6:1216–1223. doi: 10.1038/nn1141. [DOI] [PubMed] [Google Scholar]
- Goldberg JM, Brown PB. Response of binaural neurons of dog superior olivary complex to dichotic tonal stimuli: some physiological mechanisms of sound localization. J Neurophysiol. 1969;32:613–636. doi: 10.1152/jn.1969.32.4.613. [DOI] [PubMed] [Google Scholar]
- Hackett TA. Information flow in the auditory cortical network. Hear Res. 2011;271:133–146. doi: 10.1016/j.heares.2010.01.011. [DOI] [PMC free article] [PubMed] [Google Scholar]
- Hackett TA, Stepniewska I, Kaas JH. Subdivisions of auditory cortex and ipsilateral cortical connections of the parabelt auditory cortex in macaque monkeys. J Comp Neurol. 1998;394:475–495. doi: 10.1002/(SICI)1096-9861(19980518)394:4<475::AID-CNE6>3.0.CO;2-Z. [DOI] [PubMed] [Google Scholar]
- Hernández A, Zainos A, Romo R. Neuronal correlates of sensory discrimination in the somatosensory cortex. Proc Natl Acad Sci U S A. 2000;97:6191–6196. doi: 10.1073/pnas.120018597. [DOI] [PMC free article] [PubMed] [Google Scholar]
- Imig TJ, Morel A. Organization of the thalamocortical auditory system in the cat. Annu Rev Neurosci. 1983;6:95–120. doi: 10.1146/annurev.ne.06.030183.000523. [DOI] [PubMed] [Google Scholar]
- Jackson A, Fetz EE. Compact movable microwire array for long-term chronic unit recording in cerebral cortex of primates. J Neurophysiol. 2007;98:3109–3118. doi: 10.1152/jn.00569.2007. [DOI] [PubMed] [Google Scholar]
- Joris PX, Schreiner CE, Rees A. Neural processing of amplitude-modulated sounds. Physiol Rev. 2004;84:541–577. doi: 10.1152/physrev.00029.2003. [DOI] [PubMed] [Google Scholar]
- Kaas JH, Hackett TA. Subdivisions of auditory cortex and processing streams in primates. Proc Natl Acad Sci U S A. 2000;97:11793–11799. doi: 10.1073/pnas.97.22.11793. [DOI] [PMC free article] [PubMed] [Google Scholar]
- Kay RH. Hearing of modulation in sounds. Physiol Rev. 1982;62:894–975. doi: 10.1152/physrev.1982.62.3.894. [DOI] [PubMed] [Google Scholar]
- Lee CC, Middlebrooks JC. Auditory cortex spatial sensitivity sharpens during task performance. Nat Neurosci. 2011;14:108–114. doi: 10.1038/nn.2713. [DOI] [PMC free article] [PubMed] [Google Scholar]
- Lee CC, Winer JA. Principles governing auditory cortex connections. Cereb cortex. 2005;15:1804–1814. doi: 10.1093/cercor/bhi057. [DOI] [PubMed] [Google Scholar]
- Lee CC, Winer JA. Connections of cat auditory cortex: I. Thalamocortical system. J Comp Neurol. 2008;507:1879–1900. doi: 10.1002/cne.21611. [DOI] [PMC free article] [PubMed] [Google Scholar]
- Lee CC, Winer JA. Convergence of thalamic and cortical pathways in cat auditory cortex. Hear Res. 2011;274:85–94. doi: 10.1016/j.heares.2010.05.008. [DOI] [PMC free article] [PubMed] [Google Scholar]
- Lee CC, Schreiner CE, Imaizumi K, Winer JA. Tonotopic and heterotopic projection systems in physiologically defined auditory cortex. Neuroscience. 2004;128:871–887. doi: 10.1016/j.neuroscience.2004.06.062. [DOI] [PubMed] [Google Scholar]
- Lemus L, Hernández A, Romo R. Neural codes for perceptual discrimination of acoustic flutter in the primate auditory cortex. Proc Natl Acad Sci U S A. 2009;106:9471–9476. doi: 10.1073/pnas.0904066106. [DOI] [PMC free article] [PubMed] [Google Scholar]
- Liu Y, Qin L, Zhang X, Dong C, Sato Y. Neural correlates of auditory temporal-interval discrimination in cats. Behav Brain Res. 2010;215:28–38. doi: 10.1016/j.bbr.2010.06.013. [DOI] [PubMed] [Google Scholar]
- Lu T, Liang L, Wang X. Temporal and rate representations of time-varying signals in the auditory cortex of awake primates. Nat Neurosci. 2001;4:1131–1138. doi: 10.1038/nn737. [DOI] [PubMed] [Google Scholar]
- Ma H, Qin L, Dong C, Zhong R, Sato Y. Comparison of neural responses to cat meows and human vowels in the anterior and posterior auditory field of awake cats. PLoS One. 2013;8:e52942. doi: 10.1371/journal.pone.0052942. [DOI] [PMC free article] [PubMed] [Google Scholar]
- Malone BJ, Scott BH, Semple MN. Dynamic amplitude coding in the auditory cortex of awake rhesus macaques. J Neurophysiol. 2007;98:1451–1474. doi: 10.1152/jn.01203.2006. [DOI] [PubMed] [Google Scholar]
- Mardia KV, Jupp PE. Directional statistics. New York: Wiley; 2000. [Google Scholar]
- Mellott JG, Van der Gucht E, Lee CC, Carrasco A, Winer JA, Lomber SG. Areas of cat auditory cortex as defined by neurofilament proteins expressing SMI-32. Hear Res. 2010;267:119–136. doi: 10.1016/j.heares.2010.04.003. [DOI] [PMC free article] [PubMed] [Google Scholar]
- Mesgarani N, Chang EF. Selective cortical representation of attended speaker in multi-talker speech perception. Nature. 2012;485:233–236. doi: 10.1038/nature11020. [DOI] [PMC free article] [PubMed] [Google Scholar]
- Morgan MA, LeDoux JE. Contribution of ventrolateral prefrontal cortex to the acquisition and extinction of conditioned fear in rats. Neurobiol Learn Mem. 1999;72:244–251. doi: 10.1006/nlme.1999.3907. [DOI] [PubMed] [Google Scholar]
- Narayan R, Graña G, Sen K. Distinct time scales in cortical discrimination of natural sounds in songbirds. J Neurophysiol. 2006;96:252–258. doi: 10.1152/jn.01257.2005. [DOI] [PubMed] [Google Scholar]
- Niwa M, Johnson JS, O'Connor KN, Sutter ML. Active engagement improves primary auditory cortical neurons' ability to discriminate temporal modulation. J Neurosci. 2012a;32:9323–9334. doi: 10.1523/JNEUROSCI.5832-11.2012. [DOI] [PMC free article] [PubMed] [Google Scholar]
- Niwa M, Johnson JS, O'Connor KN, Sutter ML. Activity related to perceptual judgment and action in primary auditory cortex. J Neurosci. 2012b;32:3193–3210. doi: 10.1523/JNEUROSCI.0767-11.2012. [DOI] [PMC free article] [PubMed] [Google Scholar]
- Niwa M, Johnson JS, O'Connor KN, Sutter ML. Differences between primary auditory cortex and auditory belt related to encoding and choice for AM sounds. J Neurosci. 2013;33:8378–8395. doi: 10.1523/JNEUROSCI.2672-12.2013. [DOI] [PMC free article] [PubMed] [Google Scholar]
- Otazu GH, Tai LH, Yang Y, Zador AM. Engaging in an auditory task suppresses responses in auditory cortex. Nat Neurosci. 2009;12:646–654. doi: 10.1038/nn.2306. [DOI] [PMC free article] [PubMed] [Google Scholar]
- Qin L, Liu Y, Wang J, Li S, Sato Y. Neural and behavioral discrimination of sound duration by cats. J Neurosci. 2009;29:15650–15659. doi: 10.1523/JNEUROSCI.2442-09.2009. [DOI] [PMC free article] [PubMed] [Google Scholar]
- Reale RA, Imig TJ. Tonotopic organization in auditory cortex of the cat. J Comp Neurol. 1980;192:265–291. doi: 10.1002/cne.901920207. [DOI] [PubMed] [Google Scholar]
- Romanski LM, LeDoux JE. Equipotentiality of thalamo-amygdala and thalamo-cortico-amygdala circuits in auditory fear conditioning. J Neurosci. 1992;12:4501–4509. doi: 10.1523/JNEUROSCI.12-11-04501.1992. [DOI] [PMC free article] [PubMed] [Google Scholar]
- Rosen S. Temporal information in speech: acoustic, auditory and linguistic aspects. Philos Trans R Soc Lond B Biol Sci. 1992;336:367–373. doi: 10.1098/rstb.1992.0070. [DOI] [PubMed] [Google Scholar]
- Rouiller EM, Simm GM, Villa AE, de Ribaupierre Y, de Ribaupierre F. Auditory corticocortical interconnections in the cat: evidence for parallel and hierarchical arrangement of the auditory cortical areas. Exp Brain Res. 1991;86:483–505. doi: 10.1007/BF00230523. [DOI] [PubMed] [Google Scholar]
- Schreiner CE, Cynader MS. Basic functional organization of second auditory cortical field (AII) of the cat. J Neurophysiol. 1984;51:1284–1305. doi: 10.1152/jn.1984.51.6.1284. [DOI] [PubMed] [Google Scholar]
- Scott BH, Malone BJ, Semple MN. Effect of behavioral context on representation of a spatial cue in core auditory cortex of awake macaques. J Neurosci. 2007;27:6489–6499. doi: 10.1523/JNEUROSCI.0016-07.2007. [DOI] [PMC free article] [PubMed] [Google Scholar]
- Shinonaga Y, Takada M, Mizuno N. Direct projections from the nonlaminated divisions of the medial geniculate nucleus to the temporal polar cortex and amygdala in the cat. J Comp Neurol. 1994;340:405–426. doi: 10.1002/cne.903400310. [DOI] [PubMed] [Google Scholar]
- Singh NC, Theunissen FE. Modulation spectra of natural sounds and ethological theories of auditory processing. J Acoust Soc Am. 2003;114:3394–3411. doi: 10.1121/1.1624067. [DOI] [PubMed] [Google Scholar]
- Sutter ML, Shamma SA. The relationship of auditory cortical activity to perception and behavior. In: Winer JA, Schreiner CE, editors. The auditory cortex. New York: Springer; 2011. pp. 617–643. [Google Scholar]
- Wang L, Narayan R, Graña G, Shamir M, Sen K. Cortical discrimination of complex natural stimuli: can single neurons match behavior? J Neurosci. 2007;27:582–589. doi: 10.1523/JNEUROSCI.3699-06.2007. [DOI] [PMC free article] [PubMed] [Google Scholar]
- Winer JA, Lee CC. The distributed auditory cortex. Hear Res. 2007;229:3–13. doi: 10.1016/j.heares.2007.01.017. [DOI] [PMC free article] [PubMed] [Google Scholar]
- Woods TM, Lopez SE, Long JH, Rahman JE, Recanzone GH. Effects of stimulus azimuth and intensity on the single-neuron activity in the auditory cortex of the alert macaque monkey. J Neurophysiol. 2006;96:3323–3337. doi: 10.1152/jn.00392.2006. [DOI] [PubMed] [Google Scholar]
- Yin P, Johnson JS, O'Connor KN, Sutter ML. Coding of amplitude modulation in primary auditory cortex. J Neurophysiol. 2011;105:582–600. doi: 10.1152/jn.00621.2010. [DOI] [PMC free article] [PubMed] [Google Scholar]
- Zhang X, Qin L, Liu Y, Dong C, Sato Y. Cat's behavioral sensitivity and cortical spatiotemporal responses to the sweep direction of frequency-modulated tones. Behav Brain Res. 2011;217:315–325. doi: 10.1016/j.bbr.2010.10.034. [DOI] [PubMed] [Google Scholar]
- Zhang X, Yang P, Dong C, Sato Y, Qin L. Correlation between neural discharges in cat primary auditory cortex and tone-detection behaviors. Behav Brain Res. 2012;232:114–123. doi: 10.1016/j.bbr.2012.03.025. [DOI] [PubMed] [Google Scholar]