

Abstract
Previous imaging studies of congenital blindness have studied individuals with heterogeneous causes of blindness, which may influence the nature and extent of cross-modal plasticity. Here, we scanned a homogeneous group of blind people with bilateral congenital anophthalmia, a condition in which both eyes fail to develop, and, as a result, the visual pathway is not stimulated by either light or retinal waves. This model of congenital blindness presents an opportunity to investigate the effects of very early visual deafferentation on the functional organization of the brain. In anophthalmic animals, the occipital cortex receives direct subcortical auditory input. We hypothesized that this pattern of subcortical reorganization ought to result in a topographic mapping of auditory frequency information in the occipital cortex of anophthalmic people. Using functional MRI, we examined auditory-evoked activity to pure tones of high, medium, and low frequencies. Activity in the superior temporal cortex was significantly reduced in anophthalmic compared with sighted participants. In the occipital cortex, a region corresponding to the cytoarchitectural area V5/MT+ was activated in the anophthalmic participants but not in sighted controls. Whereas previous studies in the blind indicate that this cortical area is activated to auditory motion, our data show it is also active for trains of pure tone stimuli and in some anophthalmic participants shows a topographic mapping (tonotopy). Therefore, this region appears to be performing early sensory processing, possibly served by direct subcortical input from the pulvinar to V5/MT+.
Introduction
In the visually deprived brain, processing of auditory and tactile stimuli evokes activity in the occipital cortex (Weeks et al., 2000; Burton et al., 2002; Burton, 2003; Poirier et al., 2006; Gougoux et al., 2009; Bedny et al., 2010, 2011). This cross-modal reorganization may support supranormal perceptual abilities in the intact sensory domains (Gougoux et al., 2004). The extent and pattern of activation in occipital areas attributable to processing of nonvisual information differs among blind participants, reflecting heterogeneity in the severity of visual impairment and the age at which vision was lost (Burton et al., 2002; Burton, 2003; Bedny et al., 2010). Our investigation limits population heterogeneity by focusing on a small group of individuals with bilateral congenital anophthalmia. In this condition, the eye fails to develop, and, consequently, there can be no stimulation of the visual pathway by either light or endogenous retinal activity. Assuming that even limited stimulation along the visual pathway could initiate mechanisms leading to functional specialization, the anophthalmic brain provides a unique opportunity to uncover the extent to which the development of the processing hierarchies of the brain and functional modules depends on input from this sensory modality (Ricciardi and Pietrini, 2011).
Our previous work showed that anophthalmic subjects activated occipital cortex when listening to either speech or reversed speech stimuli (Watkins et al., 2012). In the lateral occipital cortex, the activity to speech was significantly greater than to reversed speech. However, in the peri-calcarine cortex [corresponding to primary visual cortex (V1) in sighted subjects], there was no difference in the level of activation to speech and reversed speech stimuli. Furthermore, the peri-calcarine cortex showed high interhemispheric correlation of activity at rest, which is typical of early sensory cortical areas. Thus, in anophthalmia, the hierarchy of sensory processing in the “visual” cortex appears maintained for auditory input, with responses in peri-calcarine cortex consistent with low-level sensory processing. We argued that this pattern of activity in anophthalmia is consistent with reorganization at the subcortical level as reported for anophthalmic mice (Chabot et al., 2008). These findings in anophthalmia contrast with those reported in other congenitally blind populations, which show greater activation of peri-calcarine cortex for higher-order language and memory tasks relative to lower-level basic sensory processing (Amedi et al., 2003; Bedny et al., 2011, 2012) and a pattern of corticocortical reorganization (Klinge et al., 2010).
In the current study, we tested directly whether the occipital cortex of anophthalmic subjects responds to low-level auditory stimuli using sparse-sampling functional MRI to measure responses to simple tone stimuli that differed in frequency. We hypothesized that evidence of structure in relation to frequency (i.e., tonotopy) in the early “visual” areas of the occipital cortex of anophthalmic subjects would support direct subcortical input to the occipital cortex.
Materials and Methods
Six participants with bilateral clinical anophthalmia and six sighted controls matched for age and sex were scanned using a 3 T Tim Trio imaging system with a 12-channel head coil. Data in one anophthalmic participant (case 3) were not analyzed because of extensive motion artifact. The anophthalmic group (n = 5) ranged in age from 20 to 33 years (three males). The sighted control group (n = 6) ranged in age from 21 to 31 years (three males). All of the anophthalmic participants have contributed data to previous reports (Bridge et al., 2009, 2012; Watkins et al., 2012); their identities (Cases 1–6) are used consistently.
The study was conducted under ethical approval from the Oxfordshire National Health Service Research Ethics Committee (07/Q1605/20) and in accordance with the Declaration of Helsinki; all participants provided informed written consent. Braille documents were given to the blind group; they were read to Case 1, and his signature was witnessed by a relative.
Using sparse-sampled functional MRI, we measured the blood oxygenation level-dependent (BOLD) response while participants passively listened to short-tone trains in darkness (sighted subjects had their eyes closed). Stimuli were presented over MRI-compatible headphones (Nordic NeuroLabs) at a comfortable listening level. Using MATLAB, 1-s-long trains of stimuli were created comprising pure-tone sine waves at the required frequency with a random duration (50–100 ms, including 10 ms amplitude tapers at each end), separated by silent intervals of random duration (50–100 ms). These 1 s trains were presented during 7 s silent intervals 3 s before the onset of each 2 s acquisition of T2*-weighted echo-planar images (repetition time, 9 s; delay in repetition time, 7 s; echo time, 30 ms). Each echo-planar image volume comprised 33 3-mm axial slices (in-plane resolution, 3 × 3 mm) centered on Heschl's gyrus and covering the occipital cortex, most of the temporal lobes and the inferior portions of the parietal and frontal lobes. Each of the three conditions contained 20 stimulus trains at a unique frequency ranging in 10 Hz steps from 400 to 600 Hz for the low-frequency, 900–1100 Hz for the medium-frequency, and 2900–3100 Hz for the high-frequency conditions, chosen based on previous work (Formisano et al., 2003). Twenty volumes were also acquired after a silent interval with no auditory stimulation.
Functional data from each individual were analyzed using FEAT (FMRI Expert Analysis Tool, version 6.00), part of FSL (FMRIB Software Library; http://www.fmrib.ox.ac.uk/fsl). The images were motion corrected by realignment to the middle time point volume of the 4-D dataset, smoothed using a 6 mm full-width at half-maximum smoothing kernel, and nonlinearly registered via the subject's T1-weighted high-resolution structural image (1 mm3 voxels) to the MNI-152 template. Low-frequency fluctuations were removed using a high-pass filter with a cutoff at 100 s. Time-series statistical analysis was performed using the general linear model with local autocorrelation correction. The three conditions were modeled separately as boxcar functions because there was only one estimate of the BOLD response for each stimulus attributable to the sparse-sampling design. The motion-correction parameters (translations and rotations in x, y, and z) were included as covariates of no interest in the analyses. Group averages and differences between groups were calculated in a second-level analysis using a fixed-effects model, by forcing the random-effects variance to zero in FLAME (FMRIB Local Analysis of Mixed Effects; Woolrich et al., 2004). Images were cluster thresholded at Z > 3.1, and clusters were reported that survived a statistical test for extent using Gaussian random field theory (p < 0.05, k > 108 voxels, corrected for multiple comparisons).
To evaluate the preferred frequency of voxels that were significantly activated by auditory stimuli (average contrast across all frequency bands), the total activity in a voxel was calculated by summing the activation levels (across frequency conditions) that were greater than the average. The proportion of this total that was attributable to each frequency condition was then calculated, averaged, and color coded (from yellow for high, through orange for medium, to red for low). Thus, the intensity of each voxel reflects the frequency band or bands to which it showed the greatest responses. Functional maps were transformed to the subject's structural brain image using a rigid-body transformation (six degrees of freedom) and nearest-neighbor interpolation to preserve the original voxel values in the lower-resolution functional maps.
In a separate behavioral experiment, the five anophthalmic subjects and another group of nine sighted controls (aged 18–23 years; two males) were tested on an auditory pitch-direction discrimination task (Gougoux et al., 2004). Subjects listened to tone pairs (frequency range, 0.5–1 kHz) over headphones at a comfortable listening level and indicated with a button press whether the second tone in a pair was higher in pitch (rising) or lower (falling) than the first tone. Task difficulty was manipulated by parametrically reducing by half either the tone durations (starting duration, 333 ms) or the frequency difference (starting at one-eighth of an octave) between the two tones. The percentage correct score was calculated across all levels of difficulty (total of 72 trials).
Results
When listening to the tone stimuli, all participants showed activation of the auditory cortex centered on the transverse temporal (Heschl's) gyrus bilaterally. A whole-brain analysis comparing the two groups revealed that the magnitude and extent of the auditory-evoked response in the superior temporal cortex bilaterally was significantly reduced in the anophthalmic relative to the control group (Fig. 1). Three clusters showed significantly greater activity in controls than in anophthalmic subjects. These were located in the left superior temporal gyrus [size, 1372 voxels; peak Z statistic, 9.87; coordinates of peak voxel, (−56, −24, 6)], the right superior temporal gyrus [size, 1109; Z = 7.16; coordinates, (62, −28, 16)], and the left parietotemporal junction [size, 478; Z = 10.1; coordinates, (−46, −40, 24)]. In addition, the anophthalmic group showed significantly greater activity than sighted controls in posterior temporal/lateral occipital cortex bilaterally [right cluster: size, 260; Z = 4.36; coordinates, (54, −60, 16); left cluster: size, 184; Z = 5.16; coordinates, (−46, −76, 6); Fig. 1). The location of this anophthalmic-specific activity was entirely overlapped by the probabilistic map of the cytoarchitecturally defined region known as V5/MT+, a visual motion-selective area in the sighted brain (Wilms et al., 2005).
Figure 1.
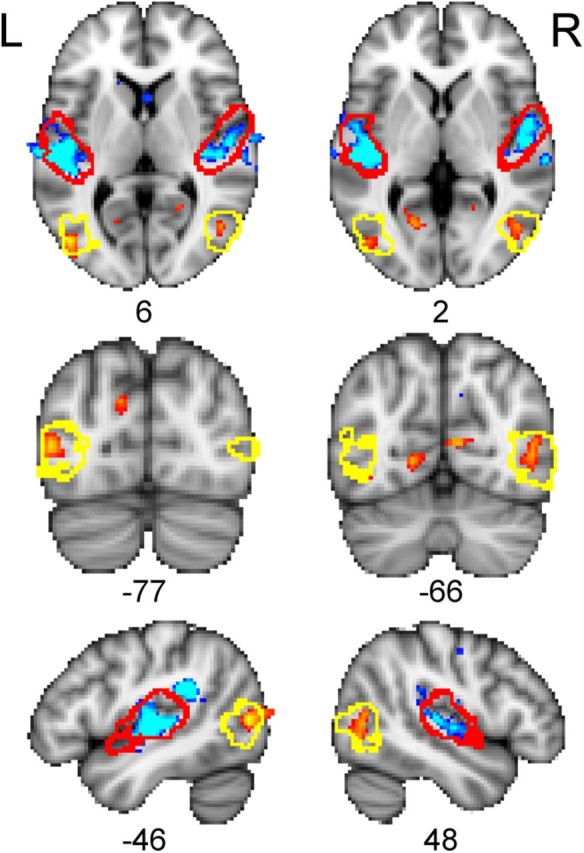
Differences between anophthalmic and control groups in brain activity during listening to tones. Colored statistical maps representing the group comparison are thresholded (voxelwise for visualization, Z > 3.1, p < 0.001, uncorrected; see Results) and overlaid on the MNI-152 T1-weighted image. Orange areas show regions in which the anophthalmic group had greater activity than the sighted control group. Blue areas show regions in which the sighted control group had greater activity than the anophthalmic group. Red outlines indicate location of A1 and yellow outlines indicate area V5/MT+ (see Materials and Methods). L, Left; R, right. The numbers below each slice are the coordinates (in millimeters) in MNI-152 standard space.
Figure 1 also indicates bilateral regions of the anterior calcarine sulcus that show an increased response in the anophthalmic group (upper row and −66 slice on middle row). However, these clusters are not large enough to pass the extent threshold for correction.
To examine the relationship between activity levels in auditory cortex and area V5/MT+ in individual subjects, we extracted the mean percentage BOLD signal change for listening to tones compared with silent baseline for primary auditory cortex (A1) and area V5/MT+ regions of interest. These were derived from the cytoarchitectonic probabilistic maps for A1 (areas TE1.0, TE1.1, and TE1.2 combined) and V5 from the Juelich histological atlas (part of FSL) thresholded at 10% (Morosan et al., 2001; Wilms et al., 2005). We qualitatively assessed the patterns of activation in our anophthalmic subjects and also their relationship with the performance of individual subjects on the auditory pitch-direction discrimination test (Fig. 2). No consistent relationships between activity levels in auditory and occipital cortex were observed, neither was there any obvious relationship between task performance and brain activity.
Figure 2.
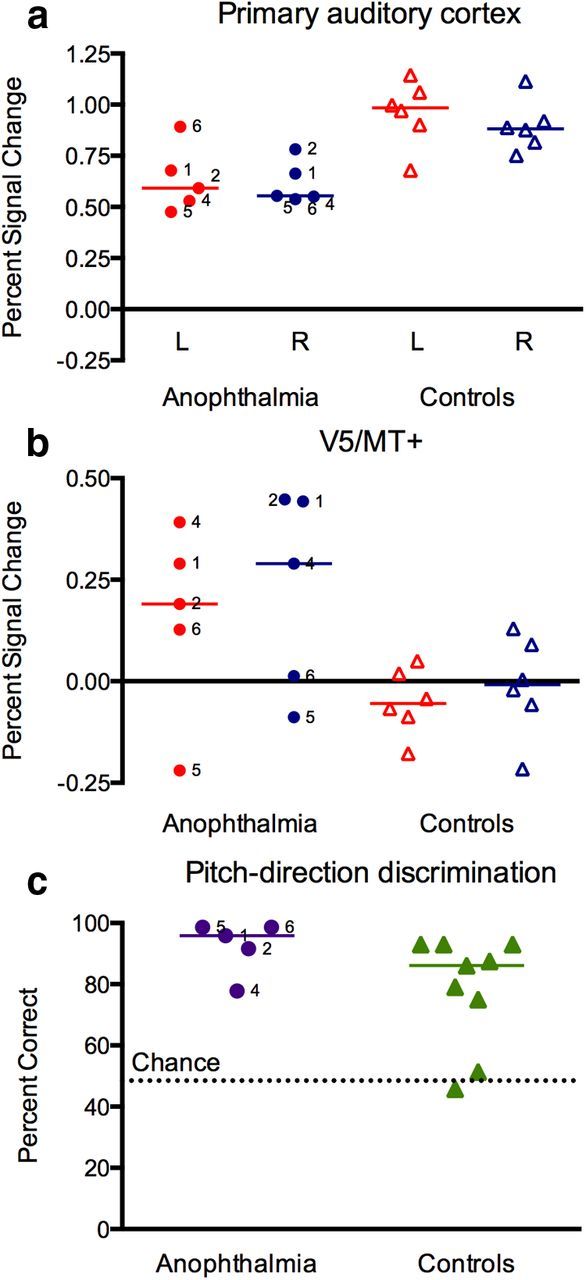
Auditory-evoked activity in A1 and area V5/MT+ and behavioral task performance in individual subjects. Mean percentage BOLD signal change during passive listening to tones relative to the silent baseline is plotted for individual anophthalmic (circles) and sighted control (triangles) subjects for A1 (a) and area V5/MT+ (b). Red, Left hemisphere; blue, right hemisphere. c, Percent correct scores for individual subjects on the auditory discrimination task are plotted. The anophthalmic subjects are labeled with their case number. Colored lines represent the group medians. The controls for the fMRI study (open triangles) and the auditory discrimination task (filled triangles) were different groups.
Next, we examined whether the brain regions active during auditory processing showed structured responses to frequency (tonotopy). This analysis revealed topographic maps on the surface of the superior temporal gyrus bilaterally. The maps were highly variable across subjects; in some, the previously described gradient of high-to-low frequency along the posteromedial to anterolateral axis of Heschl's gyrus (Formisano et al., 2003) was evident. Furthermore, voxels in the occipital cortex that were active during listening to tones also showed tonotopic responses. This was most evident in anophthalmic Cases 1 and 4 and to a lesser extent in Case 2 (Fig. 3). Case 1 had extensive activity in medial and lateral occipital cortex bilaterally. Voxels showing preferred responses to each frequency band were seen in the anterior portion of the calcarine sulcus and in the occipitoparietal fissure on the medial surface. Laterally, voxels in area V5/MT+ in both hemispheres in Case 1 demonstrated tonotopy. Case 1 does not read Braille, and the degree to which this might affect plasticity between auditory and visual modalities is unknown. Similar, though less extensive, patterns of tonotopic activation of area V5/MT+ were seen bilaterally in Case 4 and in the right hemisphere in Case 2 (Fig. 3).
Figure 3.
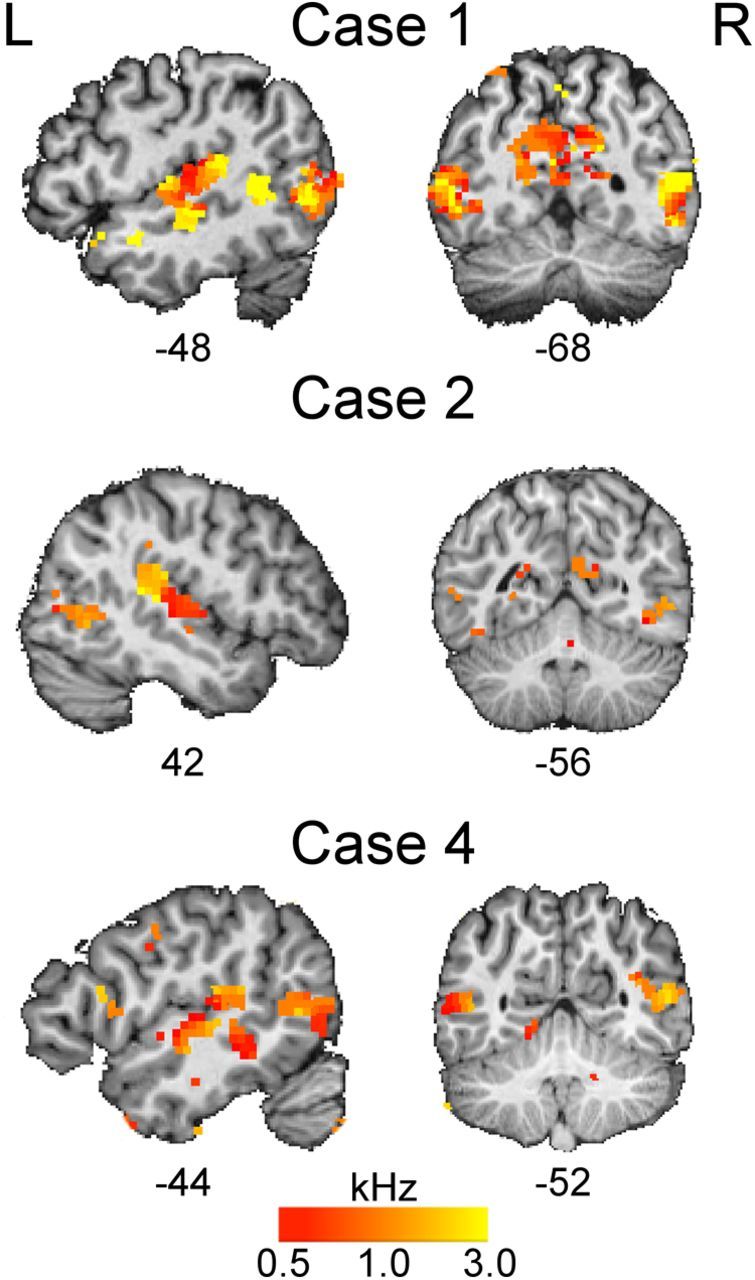
Topographic maps of preferred frequency response in anophthalmic cases. In individual subjects, voxels activated by listening to tones (thresholded Z > 2.3 for visualization) were color coded and overlaid on the subject's T1-weighted image. Voxels were color coded according to the frequency band or bands to which they showed the greatest response (see Materials and Methods): yellow, high (3 kHz); orange, medium (1 kHz); red, low (0.5 kHz). L, Left; R, right. The numbers below each slice are the coordinates (in millimeters) in MNI-152 standard space.
Discussion
Using functional MRI, we found that passive listening to simple tones activates the occipital cortex of people who were blind as a result of congenital anophthalmia. Specifically, area V5/MT+ was significantly more active bilaterally in the anophthalmic compared with the sighted control group. Examination of individual subjects' data revealed robust mean signal change in V5/MT+ for 6 of 10 hemispheres in the anophthalmic group and a weaker but above baseline response in one anophthalmic subject and 2 of 12 hemispheres for the sighted control group. The expected pattern of auditory-evoked activation of the superior temporal cortex bilaterally was observed in both groups, although the magnitude and extent of this activity was significantly lower in the anophthalmic participants. Tonotopic patterns of activity were evident in the superior temporal lobe of both blind and sighted subjects. Tonotopy was also observed in occipital cortex in individual anophthalmic subjects.
Brain areas representing intact senses are reported to show enlarged representations in human subjects who are blind (Sterr et al., 1998; Elbert et al., 2002), as well as in cats and mice deprived of vision (Rauschecker et al., 1992; Korte and Rauschecker, 1993). More recently, however, some functional MRI studies of human subjects who are blind reported reduced activity in the temporal lobes during auditory processing (Gougoux et al., 2009) and attribute this reduction to greater processing efficiency (Stevens and Weaver, 2009). In the current study, we also found reduced temporal lobe activity when our anophthalmic subjects passively listened to simple tones.
To evaluate whether reduced auditory cortex activity might be related to recruitment of occipital cortex, we examined the activity levels in these areas at the single-subject level. It is possible that the reduced activity in auditory cortex or the recruitment of occipital cortex (or perhaps the combination) underlies enhanced auditory perceptual abilities in the blind (Gougoux et al., 2004). To explore this possibility, we tested the anophthalmic subjects on an auditory pitch-direction discrimination test that previously revealed superior performance in a group of early blind people compared with a group of late blind people and sighted controls (Gougoux et al., 2004). Examination of these data failed to reveal consistent relationships between activity levels in occipital and temporal cortex or with auditory task performance. For example, the two anophthalmic subjects with the lowest activity in auditory cortex (Cases 4 and 5) show discrepant performance on the behavioral task (Fig. 2): Case 5 is at ceiling, whereas Case 4 performs below the control group median. Furthermore, Case 4 activates V5/MT+ robustly, whereas this area is not active above baseline in Case 5 (Fig. 2). Overall, the small group of anophthalmic subjects performed at or near ceiling across all levels of the behavioral test and better than controls (two of which showed chance performance; Fig. 2c). However, we cannot conclude that superior auditory performance in our subjects with anophthalmia relates to either the underactivation of auditory cortex or the additional recruitment of area V5/MT+ in occipital cortex.
We hypothesized that the peri-calcarine region receives input from subcortical auditory regions in anophthalmia. Although there was some activity in peri-calcarine cortex in the anophthalmic subjects, this was not extensive enough to pass the statistical threshold. Rather, the region of occipital cortex extensively activated by listening to tones in the anophthalmic group was in lateral occipital/posterior temporal cortex. This region was localized to the area V5/MT+ using the probabilistic histological atlas based on cytoarchitecture in postmortem data, which primarily overlaps the functionally defined the visual motion-selective area in sighted subjects (Wilms et al., 2005). The area is close to, but distinct from, the more caudally located lateral occipital area that was activated by language stimuli in the anophthalmic subjects (Watkins et al., 2012), as shown in Figure 4. Previous studies in blind individuals have shown activation of V5/MT+ during auditory- and tactile-motion processing (Poirier et al., 2006; Ricciardi et al., 2007; Bedny et al., 2010; Matteau et al., 2010; Wolbers et al., 2011). The response of area V5/MT+ to auditory motion is observed in individuals who are congenitally blind but not in the late blind (Bedny et al., 2010) and is direction selective (Wolbers et al., 2011; Strnad et al., 2013). Based on these previous observations, we expect that auditory motion stimuli would activate area V5/MT+ in the anophthalmic subjects also. In the current study, however, the auditory stimuli used were static and conveyed no percept of motion. We propose that the activation of V5/MT+ to these simple auditory tones and the tonotopic pattern of activation observed in the anophthalmic subjects are indicators of early sensory processing that could arise from direct subcortical auditory input.
Figure 4.

Occipital cortex activity in anophthalmic subjects. Colored statistical maps representing the areas in occipital cortex activated in anophthalmic subjects when listening to tones compared with rest (orange) and speech compared with reversed speech (blue) (Watkins et al., 2012). Statistical contrasts showing regions in which activity was greater in the anophthalmic group compared with sighted controls are thresholded (voxelwise for visualization, Z > 3.1) and overlaid on the MNI-152 T1-weighted image. The numbers below each slice are the coordinates (in millimeters) in MNI-152 standard space.
The position of V5/MT+ in the processing hierarchy of the intact visual system is ambiguous because it shares many properties with V1, including early maturation (Bourne and Rosa, 2006), early latencies, and, of particular relevance for our claim, direct input from the thalamus, e.g., the pulvinar (Stepniewska et al., 1999; Warner et al., 2012). In normal development, the V1 input to V5/MT+ comes to dominate but the subcortical input could be maintained and strengthened if the brain were visually deprived.
However, it should be noted that we saw no differences between the anophthalmic and sighted subjects at the subcortical level in this study. This could be because the subcortical auditory regions are small, and therefore the voxel size used in this study is relatively large (27 mm3). Also, activation of subcortical structures is more challenging than evoking cortical responses (De Martino et al., 2013), and therefore the power in this sparse sampling paradigm may not be sufficient to detect any activity. Regardless, we cannot rule out the additional possibility that changes to corticocortical connectivity contribute to the occipital cortex activity observed in anophthalmia. Bidirectional connections between primary sensory cortices are known to exist in primates (Falchier et al., 2002) and other animals. Feedback and feedforward inputs to peri-calcarine cortex and V5/MT+ from heteromodal cortical areas are also likely (Bedny et al., 2010). Visual deprivation may unmask existing connections that either fail to undergo maturational processes normally resulting in their diminution or increase their proliferation through experience-dependent plasticity.
Our current data and previous work (Watkins et al., 2012) indicate that subjects who are congenitally blind as a result of anophthalmia recruit the occipital cortex for processing of auditory inputs in a modular way. Regions of occipital cortex that can be assigned different functional roles in visual processing maintain their modularity in congenital blindness, but their function is reassigned to support processing of auditory input (Renier et al., 2010). This maintenance of hierarchy and modularity in sensory processing has resulted in distinct patterns of occipital cortex activity when anophthalmic subjects process language and tones (Fig. 4). Whether additional auditory modules exist in the occipital cortex remains to be determined.
Footnotes
The research was funded by Medical Research Council Grant G971/397B (A.C.), Royal Society University Research Fellowship UF0760314 (H.B.), Leverhulme Trust Emeritus Fellowship EM/2EM/2010/00 (A.C.), the EPA Cephalosporin Trust (I.A.), and the Academy of Medical Sciences/The Health Foundation Senior Surgical Scientist Award (N.R.). We thank Pascal Belin for providing us with the behavioral task used to test auditory pitch-direction discrimination, Ingrid Johnsrude and Bob Carlyon for suggestions for the auditory stimuli in the functional task, John-Stuart Brittain for assistance with MATLAB, Steve Knight for assistance with scanning, and Ned Jenkinson for helpful comments on this manuscript.
The authors declare no competing financial interests.
References
- Amedi A, Raz N, Pianka P, Malach R, Zohary E. Early “visual” cortex activation correlates with superior verbal memory performance in the blind. Nat Neurosci. 2003;6:758–766. doi: 10.1038/nn1072. [DOI] [PubMed] [Google Scholar]
- Bedny M, Konkle T, Pelphrey K, Saxe R, Pascual-Leone A. Sensitive period for a multimodal response in human visual motion area MT/MST. Curr Biol. 2010;20:1900–1906. doi: 10.1016/j.cub.2010.09.044. [DOI] [PMC free article] [PubMed] [Google Scholar]
- Bedny M, Pascual-Leone A, Dodell-Feder D, Fedorenko E, Saxe R. Language processing in the occipital cortex of congenitally blind adults. Proc Natl Acad Sci USA. 2011;108:4429–4434. doi: 10.1073/pnas.1014818108. [DOI] [PMC free article] [PubMed] [Google Scholar]
- Bedny M, Pascual-Leone A, Dravida S, Saxe R. A sensitive period for language in the visual cortex: distinct patterns of plasticity in congenitally versus late blind adults. Brain Lang. 2012;122:162–170. doi: 10.1016/j.bandl.2011.10.005. [DOI] [PMC free article] [PubMed] [Google Scholar]
- Bourne JA, Rosa MG. Hierarchical development of the primate visual cortex, as revealed by neurofilament immunoreactivity: early maturation of the middle temporal area (MT) Cereb Cortex. 2006;16:405–414. doi: 10.1093/cercor/bhi119. [DOI] [PubMed] [Google Scholar]
- Bridge H, Cowey A, Ragge N, Watkins K. Imaging studies in congenital anophthalmia reveal preservation of brain architecture in “visual” cortex. Brain. 2009;132:3467–3480. doi: 10.1093/brain/awp279. [DOI] [PubMed] [Google Scholar]
- Bridge H, Ragge N, Jenkinson N, Cowey A, Watkins KE. The fate of the oculomotor system in clinical bilateral anophthalmia. Vis Neurosci. 2012;29:193–202. doi: 10.1017/S0952523812000119. [DOI] [PubMed] [Google Scholar]
- Burton H. Visual cortex activity in early and late blind people. J Neurosci. 2003;23:4005–4011. doi: 10.1523/JNEUROSCI.23-10-04005.2003. [DOI] [PMC free article] [PubMed] [Google Scholar]
- Burton H, Snyder AZ, Conturo TE, Akbudak E, Ollinger JM, Raichle ME. Adaptive changes in early and late blind: a fMRI study of Braille reading. J Neurophysiol. 2002;87:589–607. doi: 10.1152/jn.00285.2001. [DOI] [PMC free article] [PubMed] [Google Scholar]
- Chabot N, Charbonneau V, Laramée ME, Tremblay R, Boire D, Bronchti G. Subcortical auditory input to the primary visual cortex in anophthalmic mice. Neurosci Lett. 2008;433:129–134. doi: 10.1016/j.neulet.2008.01.003. [DOI] [PubMed] [Google Scholar]
- De Martino F, Moerel M, van de Moortele PF, Ugurbil K, Goebel R, Yacoub E, Formisano E. Spatial organization of frequency preference and selectivity in the human inferior colliculus. Nat Commun. 2013;4:1386. doi: 10.1038/ncomms2379. [DOI] [PMC free article] [PubMed] [Google Scholar]
- Elbert T, Sterr A, Rockstroh B, Pantev C, Müller MM, Taub E. Expansion of the tonotopic area in the auditory cortex of the blind. J Neurosci. 2002;22:9941–9944. doi: 10.1523/JNEUROSCI.22-22-09941.2002. [DOI] [PMC free article] [PubMed] [Google Scholar]
- Falchier A, Clavagnier S, Barone P, Kennedy H. Anatomical evidence of multimodal integration in primate striate cortex. J Neurosci. 2002;22:5749–5759. doi: 10.1523/JNEUROSCI.22-13-05749.2002. [DOI] [PMC free article] [PubMed] [Google Scholar]
- Formisano E, Kim DS, Di Salle F, van de Moortele PF, Ugurbil K, Goebel R. Mirror-symmetric tonotopic maps in human primary auditory cortex. Neuron. 2003;40:859–869. doi: 10.1016/S0896-6273(03)00669-X. [DOI] [PubMed] [Google Scholar]
- Gougoux F, Lepore F, Lassonde M, Voss P, Zatorre RJ, Belin P. Neuropsychology: pitch discrimination in the early blind. Nature. 2004;430:309. doi: 10.1038/430309a. [DOI] [PubMed] [Google Scholar]
- Gougoux F, Belin P, Voss P, Lepore F, Lassonde M, Zatorre RJ. Voice perception in blind persons: a functional magnetic resonance imaging study. Neuropsychologia. 2009;47:2967–2974. doi: 10.1016/j.neuropsychologia.2009.06.027. [DOI] [PubMed] [Google Scholar]
- Klinge C, Eippert F, Röder B, Büchel C. Corticocortical connections mediate primary visual cortex responses to auditory stimulation in the blind. J Neurosci. 2010;30:12798–12805. doi: 10.1523/JNEUROSCI.2384-10.2010. [DOI] [PMC free article] [PubMed] [Google Scholar]
- Korte M, Rauschecker JP. Auditory spatial tuning of cortical neurons is sharpened in cats with early blindness. J Neurophysiol. 1993;70:1717–1721. doi: 10.1152/jn.1993.70.4.1717. [DOI] [PubMed] [Google Scholar]
- Matteau I, Kupers R, Ricciardi E, Pietrini P, Ptito M. Beyond visual, aural and haptic movement perception: hMT+ is activated by electrotactile motion stimulation of the tongue in sighted and in congenitally blind individuals. Brain Res Bull. 2010;82:264–270. doi: 10.1016/j.brainresbull.2010.05.001. [DOI] [PubMed] [Google Scholar]
- Morosan P, Rademacher J, Schleicher A, Amunts K, Schormann T, Zilles K. Human primary auditory cortex: cytoarchitectonic subdivisions and mapping into a spatial reference system. Neuroimage. 2001;13:684–701. doi: 10.1006/nimg.2000.0715. [DOI] [PubMed] [Google Scholar]
- Poirier C, Collignon O, Scheiber C, Renier L, Vanlierde A, Tranduy D, Veraart C, De Volder AG. Auditory motion perception activates visual motion areas in early blind subjects. Neuroimage. 2006;31:279–285. doi: 10.1016/j.neuroimage.2005.11.036. [DOI] [PubMed] [Google Scholar]
- Rauschecker JP, Tian B, Korte M, Egert U. Crossmodal changes in the somatosensory vibrissa/barrel system of visually deprived animals. Proc Natl Acad Sci USA. 1992;89:5063–5067. doi: 10.1073/pnas.89.11.5063. [DOI] [PMC free article] [PubMed] [Google Scholar]
- Renier LA, Anurova I, De Volder AG, Carlson S, VanMeter J, Rauschecker JP. Preserved functional specialization for spatial processing in the middle occipital gyrus of the early blind. Neuron. 2010;68:138–148. doi: 10.1016/j.neuron.2010.09.021. [DOI] [PMC free article] [PubMed] [Google Scholar]
- Ricciardi E, Pietrini P. New light from the dark: what blindness can teach us about brain function. Curr Opin Neurol. 2011;24:357–363. doi: 10.1097/WCO.0b013e328348bdbf. [DOI] [PubMed] [Google Scholar]
- Ricciardi E, Vanello N, Sani L, Gentili C, Scilingo EP, Landini L, Guazzelli M, Bicchi A, Haxby JV, Pietrini P. The effect of visual experience on the development of functional architecture in hMT+ Cereb Cortex. 2007;17:2933–2939. doi: 10.1093/cercor/bhm018. [DOI] [PubMed] [Google Scholar]
- Stepniewska I, Qi HX, Kaas JH. Do superior colliculus projection zones in the inferior pulvinar project to MT in primates? Eur J Neurosci. 1999;11:469–480. doi: 10.1046/j.1460-9568.1999.00461.x. [DOI] [PubMed] [Google Scholar]
- Sterr A, Müller MM, Elbert T, Rockstroh B, Pantev C, Taub E. Perceptual correlates of changes in cortical representation of fingers in blind multifinger Braille readers. J Neurosci. 1998;18:4417–4423. doi: 10.1523/JNEUROSCI.18-11-04417.1998. [DOI] [PMC free article] [PubMed] [Google Scholar]
- Stevens AA, Weaver KE. Functional characteristics of auditory cortex in the blind. Behav Brain Res. 2009;196:134–138. doi: 10.1016/j.bbr.2008.07.041. [DOI] [PMC free article] [PubMed] [Google Scholar]
- Strnad L, Peelen MV, Bedny M, Caramazza A. Multivoxel pattern analysis reveals auditory motion information in MT+ of both congenitally blind and sighted individuals. PLoS One. 2013;8:e63198. doi: 10.1371/journal.pone.0063198. [DOI] [PMC free article] [PubMed] [Google Scholar]
- Warner CE, Kwan WC, Bourne JA. The early maturation of visual cortical area MT is dependent on input from the retinorecipient medial portion of the inferior pulvinar. J Neurosci. 2012;32:17073–17085. doi: 10.1523/JNEUROSCI.3269-12.2012. [DOI] [PMC free article] [PubMed] [Google Scholar]
- Watkins KE, Cowey A, Alexander I, Filippini N, Kennedy JM, Smith SM, Ragge N, Bridge H. Language networks in anophthalmia: maintained hierarchy of processing in “visual” cortex. Brain. 2012;135:1566–1577. doi: 10.1093/brain/aws067. [DOI] [PubMed] [Google Scholar]
- Weeks R, Horwitz B, Aziz-Sultan A, Tian B, Wessinger CM, Cohen LG, Hallett M, Rauschecker JP. A positron emission tomographic study of auditory localization in the congenitally blind. J Neurosci. 2000;20:2664–2672. doi: 10.1523/JNEUROSCI.20-07-02664.2000. [DOI] [PMC free article] [PubMed] [Google Scholar]
- Wilms M, Eickhoff SB, Specht K, Amunts K, Shah NJ, Malikovic A, Fink GR. Human V5/MT+: comparison of functional and cytoarchitectonic data. Anat Embryol. 2005;210:485–495. doi: 10.1007/s00429-005-0064-y. [DOI] [PubMed] [Google Scholar]
- Wolbers T, Zahorik P, Giudice NA. Decoding the direction of auditory motion in blind humans. Neuroimage. 2011;56:681–687. doi: 10.1016/j.neuroimage.2010.04.266. [DOI] [PubMed] [Google Scholar]
- Woolrich MW, Behrens TE, Beckmann CF, Jenkinson M, Smith SM. Multilevel linear modelling for FMRI group analysis using Bayesian inference. Neuroimage. 2004;21:1732–1747. doi: 10.1016/j.neuroimage.2003.12.023. [DOI] [PubMed] [Google Scholar]