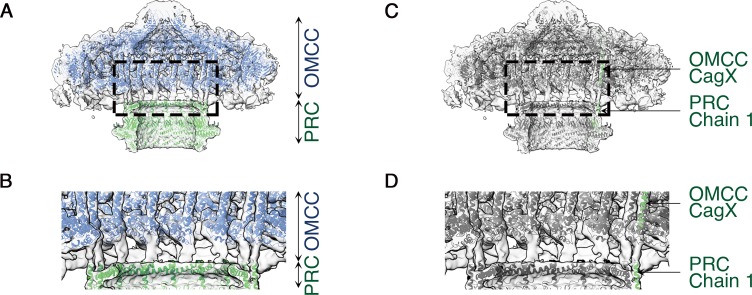
Figure 5. C1 symmetry density map showing connection of the OMCC to the PRC.
(A) Central axial slice view showing refined structures of the OMCC (blue) and PRC (green) fit into the C1 3D map of the Cag T4SS (light gray). The map is contoured at a low level to show less-ordered features. (B) Zoomed-in view of the region delimited by the dashed line in (a) showing the connection region of OMCC and PRC. (C) Central axial slice view showing refined structures of OMCC CagX (top, green) and PRC Chain 1 (bottom, green) fit into the C1 3D map of Cag T4SS complex (light gray). (D) Zoomed-in view of the region delimited by the dashed line in (c) showing candidates for the connection of OMCC and PRC.

