Figure 2.
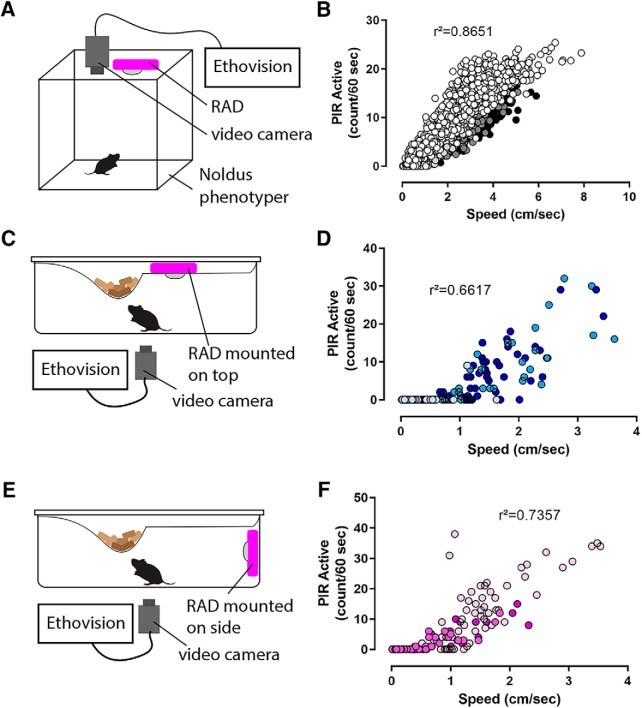
Data recorded by RAD correlates with speed. A, Diagram showing setup of 24-h video-tracking PIR validation experiment in Noldus phenotyper. B, Scatter plot of PIR sensor binned data versus video-tracked distance moved for bins of 60 s showing strong correlation between PIR sensor binned data and tracked mouse speed; R 2 = 0.8651, N = 4 mice, data from each mouse are shaded separately. Diagrams showing setups of home cage video-tracking validation for top (C) and side (E) RAD locations. Scatterplots show correlations between PIR active bouts per minute and distance moved per minute for top-setup (D) and side-setup (F); R 2 = 0.6617 and R 2 = 0.7357 for top and side setup, respectively; N = 3 mice, data from each mouse are shaded separately.

