

Abstract
Concern over persistence, bioaccumulation, and toxicity has led to international regulation and phase-outs of certain perfluorinated compounds and little is known about their replacement products. High resolution mass spectrometry was used to investigate the occurrence and identity of replacement fluorinated compounds in surface water and sediment of the Tennessee River near Decatur, Alabama. Analysis of legacy Per- and polyfluoroalkyl substances (PFASs) revealed a marked increase in concentrations downstream of manufacturing facilities, with the most abundant compounds being perfluorooctane sulfonate (PFOS), perfluorobutane sulfonate (PFBS), and perfluorooctanoic acid (PFOA) as high as 220 ng L−1, 160 ng L−1, and 120 ng L−1, respectively. A series of nine polyfluorinated carboxylic acids was discovered, each differing by CF2CH2. These acids are likely products or byproducts of a manufacturing process that uses 1,1-difluoroethene, which is registered to a manufacturing facility in the area. Two other predominant compounds discovered have structures consistent with perfluorobutane sulfonate and perfluoroheptanoic acid but have a single hydrogen substituted for a fluorine someplace in their structure. A polyfluoroalkyl sulfate with differing mixes of hydrogen and fluorine substitution was also observed. N-methyl perfluorobutane sulfonamidoacetic acid (MeFBSAA) was observed at high concentrations and several other perfluorobutane sulfonamido substances were present as well.
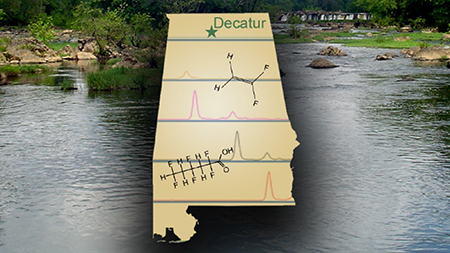
Graphical Abstract
Introduction
Per- and polyfluoroalkyl substances (PFASs), are used in a variety of consumer products and some, such as perfluorooctanoic acid (PFOA) and perfluorooctane sulfonate (PFOS), have been recognized as global contaminants.1 Concern about the persistence, bioaccumulation potential, and toxicity of PFOS and PFOA has led to restrictions on production or phase outs in the U.S.2, 3 and even international restriction via inclusion in the Stockholm Convention.4 Fluorine based surfactants exhibit desirable performance that other chemical structures cannot replicate; therefore, manufacturers have been producing new polyfluorinated materials in place of the more traditional PFASs.5 It is therefore likely that residents in some communities near fluorochemical manufacturing facilities may still be dealing with lingering contamination of legacy PFASs as well as novel fluorochemicals that have replaced the traditional chemistries and about which little is known.
Large amounts of PFASs have been released to air, water, and soil near fluorochemical facilities6 and previous studies have indicated that water in the Decatur, Alabama area has elevated levels of PFASs.7 Decatur is home to several facilities that manufacture or use fluorinated materials.8 These companies are located in close proximity to each other, near the banks of the Tennessee River downstream from downtown Decatur and its drinking water intake (which has not been contaminated with measurable levels of PFOS or PFOA).9 Between 1995 and 2008, biosolids from a local waste water treatment plant (WWTP) that had received waste from these manufacturing facilities were applied to agricultural lands in the area.10 In 2001, PFOS and PFOA were reported at approximately 3,000 and 101–244 μg g−1 in sewage sludge from Decatur and approximately 5,000 and 2,000 ng L−1 in effluent water, respectively.11 In 2011, well and surface water in the area was reported to contain elevated concentrations of PFASs, in particular PFOA (<10–6,410 ng L−1 in wells and <10–11,000 ng L−1 in surface water), and the authors speculate the origin of this contamination to be biosolids applied to agricultural land.10 Offsite migration of waste from the manufacturing facilities may be another source. Measurements of drinking water from 2013–2015 from the EPA’s Unregulated Contaminant Monitoring Rule (UCMR3) program show levels of PFOS and PFOA in drinking water from the West Morgan-East Lawrence Water Authority, which receives its water supply from Wheeler Lake downstream of Decatur, ranged as high as 130 and 100 ng L−1, respectively.12 In 2013, the Agency for Toxic Substances and Disease Registry (ATSDR) reported elevated concentrations of PFOS and PFOA in the blood of 155 residents in the Decatur, AL area who were selected due to their likelihood of having higher non-occupational exposure to PFASs from contaminated drinking water than the average person in the United States.13 Recently, the Environmental Protection Agency (EPA) set drinking water health advisories for PFOS and PFOA, recommending that the sum of the concentrations of the two compounds not exceed 70 ng L−1.14, 15 Shortly after the release of these advisories, the West Morgan-East Lawrence Water Authority advised more than 100,000 customers located south of the Tennessee River and west of Decatur not to drink their tap water due to levels of PFOS and PFOA in the water exceeding the health advisory level.16 Together, these occurrences illustrate the long-standing history of perfluorochemical contamination present in the Decatur area.
While the problems with legacy PFASs such as PFOS and PFOA are still coming to light, little is known about the products that have replaced them. Most of the information about the structures and production volumes of these compounds are withheld as confidential business information. Some of the few known replacement compounds are merely shorter chained perfluorinated homologues of the previous materials. For example in 2000, a major manufacturer in the Decatur area announced that it would phase out production of PFOS2 and shortly thereafter (2002), announced that it was developing a new line of fluorochemical surfactants based on perfluorobutane sulfonate (PFBS).17 Short chained replacements appear to be cleared more quickly from the human body and less toxic in laboratory studies,18, 19 however concerns about their environmental persistence have been voiced by some scientists.20 Furthermore, one study has recently shown that perfluorobutane sulfonamide (FBSA), the short-chain homologue to perfluorooctane sulfonamide (FOSA), is bioaccumulative in several fish species.21 Scarce literature suggests that in other instances, the carbon chain length does not change but some of the fluorine atoms have been replaced with hydrogens or part of the chain has been replaced with oxygens.22, 23 Whether some of these compounds are intentional product replacements, byproducts of the production process, or environmental degradation products remains to be determined. The few novel compounds that have been discovered thus far differ from study to study, affirming that specific companies have their own replacement products.5
Perhaps one of the greatest tool to aid with the identification of new compounds is high resolution mass spectrometry (HRMS).22–25 HRMS allows for the prediction of molecular formulas based on the measured accurate mass of an unknown compound. HRMS limits the combinations of elements whose masses can be summed to equal (within a small range of uncertainty) the accurate mass measured, thereby restricting the number of possible molecular formulas for an observed mass. Further information about the structure can be obtained through fragmentation using tandem mass spectrometry (MS/MS) with a quadrupole time-of-flight (qTOF)24 or through increased in-source fragmentation on a TOF.22 HRMS was used to identify several perfluoroalkyl ether carboxylic acids (PFECAs) and sulfonic acids (PFESAs) near a major point source in the US22 and several new poly- and perfluorinated substances were discovered near manufacturing facilities in China.23 Combining the power of HRMS with sampling near known point sources (e.g. manufacturing facilities) can be a useful approach for the identification of new products and possible environmental contaminants. In this study, we used HRMS to identify novel fluorinated compounds in water and sediment near PFAS manufacturing facilities in Decatur, Alabama as well as report levels of legacy PFASs.
Materials and Methods
Materials
A list of the origin of materials used, including solvents and standards, can be found in the Supporting Information (SI).
Sampling
Sampling was performed on October 1, 2015 at nine sites along the Tennessee River near Decatur, Alabama to cover upstream and downstream areas near suspected PFAS sources. Sampling sites are shown in Figure 1 along with the location of the manufacturing facilities. At each site, the boat was anchored and allowed to drift several meters downstream to minimize chances of sampling in any sediment plumes created by the anchor deployment. One liter or river water was collected ~1 m below the surface in pre-cleaned high-density polyethylene (HDPE) Nalgene bottles using a Van Dorn sampler. Surficial sediment was collected using a petite ponar lowered to the river bottom. Upon retrieval, collected sediment was released into a plastic bucket that had been rinsed thoroughly with water from the river. At each site, 2–3 ponar grabs were mixed in the bucket by hand using nitrile gloves and the resultant slurry poured into the 250 mL HDPE sample bottle for that site. Sediment and water samples were stored at ambient temperature and shipped overnight to EPA facilities in Durham, North Carolina for analysis.
Figure 1 –

Sampling sites along the Tennessee River near Decatur, Alabama.
Analysis
Water samples were treated according to Nakayama et al.26 with some minor modifications. Briefly, sampling water bottles were shaken vigorously for homogenization. One liter of water was measured from the sampling bottle and any remaining (typically less than 50 mL) was discarded. The empty container was rinsed with 10 mL methanol to desorb any PFASs that maybe have sorbed to the container. The methanol was combined with the water sample and the mixture was spiked with 50 ng each of isotopically labeled perfluorohexanoic acid (PFHxA), PFOA, perfluorononanoic acid (PFNA), perfluorodecanoic acid (PFDA), perfluorohexanoic sulfonate (PFHxS), and PFOS. The sample was then filtered through a glass fiber filter. 500 mL of the filtered sample was concentrated on a WAX SPE cartridge (Waters Corp., Milford, MA) using a positive displacement pump. The cartridges were washed with 4 mL acetate buffer (pH 4) followed by 4 mL methanol which was discarded. Acidic PFASs were eluted using 4 mL 0.3% NH4OH in methanol. The eluate was concentrated to 1 mL under a gentle nitrogen stream. 100 μL of sample was taken for analysis and mixed with 300 μL ammonium formate buffer in an LC vial.
Sediment samples were frozen before being lyophilized for 48–72 hours. Dried samples were pulverized and homogenized by mortar and pestle to a fine powder. A 1 g aliquot of dried sediment was spiked with 10 ng each of the same isotopically labeled standards used for water samples, vortexed with 7 mL methanol, and extracted in an ultra-sonic bath for 30 minutes. Samples were centrifuged and the supernatant was poured into a pre-cleaned 3-mL EnviCarb cartridge (Supelco Analytical, Bellefonte, PA). The eluate was collected and evaporated to approximately 1 mL. 100 μL of sample was taken for analysis and mixed with 300 μL ammonium formate buffer in an LC vial.
Legacy PFASs (C4-C10 perfluoroalkyl carboxylic acids, PFBS, PFHxS, and PFOS) were analyzed according to Nakayama et al.26 using a Waters Acquity ultra performance LC with an Acquity UPLC BEH C18 Column (1.7μm, 1.0 × 50 mm; Waters Corp.) interfaced with a Waters Quattro Premier XE triple quadrupole MS (UPLC-MS/MS). For non-targeted analysis, samples were first analyzed using an Agilent 1100 series HPLC interfaced with a 6210 series accurate-mass LC-TOFMS system (Agilent Technologies, Palo Alto, CA) to acquire single MS data according to Strynar et al.22 Chromatographic separation was accomplished using an Eclipse Plus C8 column (2.1 × 50 mm, 3.5 μm; Agilent). Fragmentor voltage was set to 80 V for initial compound discovery work and a subsequent analysis was performed in which the voltage was set to alternate between 80, 125, and 190 V to induce fragmentation for some compounds. To acquire MS/MS data, an Agilent 1200 series LC coupled with a 6520 accurate mass Q-TOF was used. In both the TOF and the QTOF, a reference compound mixture was constantly infused into the ion source consisting of purine (m/z 119.03632) and hexakis (1H, 1H, 3H-tetrafluoropropoxy) phosphazene (m/z 980.016375). A third compound, 4,4,5,5,6,6,7,7,8,8,9,9,9-tridecafluoro-nonanoic acid (m/z 391.0009), was also present in the reference solution and was not used as a lock during the run but rather was checked post-run to ensure accurate mass measurement.
Non-targeted workflow
A similar workflow to that described by Strynar et al. 22 was used for identification of novel fluorinated compounds. In short, Mass Hunter qualitative software (Agilent) was used to extract molecular features from the total ion chromatogram (TIC) of all samples in MS mode. These features were then exported to Mass Profiler software (Agilent) for comparison with an upstream or blank sample. Large molecular features with negative or slightly positive mass defects (approximately −0.2 to 0.05) were selected for further analysis. Mass Hunter was used to predict formulas for selected molecular features after background spectrum subtraction, considering rules outlined by Kind and Fiehn.27 Formulas given a score less than 90% were not considered. We looked for related peaks by adding or subtracting 49.9968 (CF2) or 64.0124 (CH2CF2) from the main peak (Table 1) and by constructing mass defects plots similar to Kendrick mass defect plots.28 Features of most interest were then fragmented on the QTOF instrument to obtain MS/MS data and by increased fragmentor voltage on the TOF to assist with structure elucidation. Literature and internet searches combined with previous knowledge of manufacturing processes were then used to deduce likely structures.
Table 1 –
Summary of novel fluorinated compounds tentatively identified in water downstream of manufacturing facilities near Decatur.
| Protonated Formula | CAS No. | Observed m/z | Protonated Formula | CAS No. | Observed m/z | ||
|---|---|---|---|---|---|---|---|
| Carboxylic Acid | Sulfonate | ||||||
| Series | C4H2F8SO3 | 70259-86-8 | 280.9532 | ||||
| C4H4F4O2 | n/a | 159.0075 | Sulfate | ||||
| C6H6F6O2 | n/a | 223.0204 | C4H6F4SO4 | n/a | 224.9856 | ||
| C8H8F8O2 | n/a | 287.0329 | Perfluorobutane | ||||
| C10H10F10O2 | n/a | 351.0453 | Sulfonamido | ||||
| Substances (PBSAs) | |||||||
| C12H12F12O2 | n/a | 415.0578 | C7H5F9NSO4 (MeFBSAA) | 159381-10-9 | 369.9805 | ||
| C14H14F14O2 | n/a | 479.0700 | C4H2F9NSO2 (FBSA) | 30334-69-1 | 297.9592 | ||
| C16H16F16O2 | n/a | 543.0817 | C4HF9SO2 | 34642-43-8 | 282.9479 | ||
| C18H18F18O2 | n/a | 607.0945 | C6H3F9NSO4 (FBSAA) | 1910057-70-3 | 355.9644 | ||
| C20H20F20O2 | n/a | 671.1066 | C8H8F9NSO4(EtFBSAA) | 68957-33-5 | 383.9958 | ||
| Other Carboxylic | C7H8F9NSO3 (MeFBSE) | 34454-97-2 | 402.0063 | ||||
| Acids | |||||||
| C7H2F12O2 | n/a | 344.9800 | |||||
| C6H4F8O2 | n/a | 259.0015 |
QA/QC
Details of quality assurance/quality control measures and procedures can be found in the SI.
Results and discussion
Legacy PFASs
Concentrations of legacy PFASs are given in Tables S1 and S2 (SI) and displayed graphically in Figure 2. Total legacy PFAS concentrations in water ranged from 32 to 750 ng L−1 and showed a marked increase in concentration at site 3, peaking at site 2, the two sampling locations nearest to the facilities. The increase in water concentrations at sites 2 and 3 maybe be due to runoff from soil or infiltration from groundwater, both of which are known to contain high levels of legacy PFASs. 7, 10 Levels remained elevated further downstream at site 1 compared to upstream samples 4–10 (Figures 1 and 2). The most concentrated compounds in water were PFOS (<10–220 ng L−1), PFBS (<10–160 ng L−1), and PFOA (<10–120 ng L−1). The concentrations of PFOS and PFOA are similar to levels measured in samples from the Tennessee River in roughly the same locations by Hansen et al. in 2002 who reported 16.8–144 ng L−1 for PFOS and <25–598 ng L−1 for PFOA.29
Figure 2 –

Levels of legacy PFASs in water and sediment dry weight (d.w.) in the Tennessee River near Decatur, Alabama. Blue icons represent approximate location of manufacturing facilities near the banks of the river.
Sediment concentrations did not follow the same spatial pattern as water. Sediment concentrations increased dramatically at site 4 and slowly decreased downstream (Figures 1 and 2, Table S2, SI). Total PFAS concentrations ranged from <LOQ- 47 ng g−1 with the predominant compound being PFOS. PFOS comprised the majority of the total PFASs (62–87%) at sites 1–4 and was the only PFAS found upstream of site 4. Sediment concentrations of PFOS at site 4 (32 ng g−1) surpassed all reported concentrations in a 2013 review, which included measurements from the USA, Germany, Austria, Japan, and China, and concentrations of PFOA (12 ng g−1) exceeded 95% of reported measurements from these same countries.30 Sediments represent a longer time period of contamination than water and therefore it is possible that the contamination in the sediment reflects previous releases near site 4 that have now ceased.
Novel Polyfluorinated Compounds
Several novel polyfluorinated compounds were tentatively identified in surface water at sites 1, 2, and 3 (downstream of the manufacturing facilities), the most noteworthy of which include a series of carboxylic acids differing by CF2CH2 units, two other polyfluorinated carboxylic acids, a sulfonate resembling PFBS, and a polyfluorinated sulfate. A table summarizing the masses, molecular formulas, proposed structures, level of identification according to the Schymanski scale31, and predicted physical-chemical properties from Epi Suite™ 4.1132 can be found in the SI (Table S3). A group of previously known compounds, perfluorobutane sulfonamido substances (PBSAs), which are related to perfluoroctane sulfonamido substances, was also observed. From this group, N-methyl perfluorobutane sulfonamidoacetic acid (MeFBSAA) was quantified with a standard exceeding 1 μg L−1 at site 2. None of the novel polyfluorinated compounds were found in sediment despite predicted organic carbon-water partitioning coefficients (Koc) for some compounds exceeding those predicted for PFOS and PFOA (Table S3, SI). There is much uncertainty, though, in both the Koc estimates and the suitability of the extraction and clean up procedure for these compounds as it has not yet been optimized for these compounds. In most cases, the presence of a large peak representing a novel fluorinated compound was accompanied by smaller peaks with a mass difference of 49.9968 (CF2) or 64.0125 (CF2CH2), most likely impurities from the manufacturing process. A summary of novel fluorinated compounds found in the surface water samples is presented in Table 1 and further discussion of the major compounds follows.
A novel series of polyfluorinated carboxylic acids based on 1,1-difluoroethene
A series of chromatographic peaks was observed, which differed by ± 64.0124 amu, corresponding to units of CF2CH2. Further investigation revealed that one particular manufacturing site in the Decatur area has registered 1,1 difluoroethene in the Toxic Substances Control Act (TSCA) registry.33 It is possible that this is being used as a building block for the synthesis of polyfluorinated compounds by similar reactions to those previously used to create perfluorinated oligomers such as PFOA from tetrafluoroethene.34 It is also possible that the observed peaks are byproducts of the production of polyvinylidene difluoride (PVDF). To explore this hypothesis, an adjusted mass defect plot was created in a way outlined by Myers et al.35 and Liu et al. 23 using the mass defect of CF2CH2 (more information on how this plot was created can be found in the SI). Mass defect plots will clearly show homologous series of compounds that have similar mass defects relative to their mass plotted on a horizontal line (Figure S1, SI). For each mass, the Mass Hunter software predicted two oxygens and equal numbers of carbon, hydrogen, and fluorine. The MS/MS spectra of these compounds showed several peaks 20.0066 amu apart consistent with neutral HF losses36 (Figure S2, SI). These losses are indicative of C-F and C-H bonds existing on adjacent carbons, supporting the hypothesis that 1,1-difluoroethene is being used to build repeating units in these structures. Several of the spectra have a peak approximately 63.9961 amu less than the parent peak, indicating a loss of CO2HF. Thus, these compounds are likely carboxylic acids with alternating CF2 and CH2 bonds. Figure 3 shows how 1,1-difluoroethene can replace tetrafluoroethene to produce this polyfluorinated series in a similar reaction to one previously used to synthesize traditional perfluorinated carboxylic acids.
Figure 3 –

The synthesis reaction for the production of a traditional perfluorinated carboxylic acid using tetrafluoroethene (A) and the hypothesized synthesis of the proposed polyfluorinated carboxylic acids using 1,1-difluoroethene (B) where n = 2–10.
Figure 4 shows the extracted ion chromatograms (EIC) for each of the C4-C20 carboxylic acids and their corresponding formulas, most of which produced at least two chromatographic peaks. These peaks share the same accurate mass and produced very similar MS/MS spectra indicating they could be branched and straight-chained isomers or it is possible that these are fragments of a larger molecule. While there are no standards available to quantify these compounds in the water samples, the chromatographic peaks are notably large, surpassing those of the legacy PFASs. Thus it is likely that the concentrations also surpass those of the legacy PFASs, which are already elevated compared to many national measurements (see section on legacy PFASs, Table S1). The most abundant compound in this series when summing all isomers was C6H6F6O2, with nearly 10 times the peak area of PFHxA and PFOA at site 2. This suggests the concentration in water at site 2 of C6H6F6O2 may approach or even exceed 1 μg L−1, if the instrumental response for this carboxylic acid is similar to PFHxA, which we believe to be a reasonable assumption. The next most abundant compound in this series was C10H10F10O2, having about half the peak area of C6H6F6O2. Other compounds ranged from <1–17% of the abundance of C6H6F6O2 (Figure S3, SI).
Figure 4–

Chromatogram of the C2nH2nF2nO2 series for n=2–10. Numbers represent the observed m/z and formulas represent the protonated species.
A novel sulfonate, a sulfate, and a carboxylic acid
The largest single chromatographic peak in the samples was at 280.9532 m/z, for which the software predicted the formula C4H2F8SO3 with a match score of over 99%. This formula is very similar to the formula of PFBS with the exception that one fluorine is replaced with a hydrogen, however the position of this hydrogen is difficult to definitively determine. The MS/MS spectrum of this compound supports the hypothesized formula and gives some clues about the position of the H (Figure 5). An SO3 fragment is observed (79.9580) and a C4F7 fragment (180.9890), which would correspond to a loss of the SO3 followed by a loss of HF. A spectral peak at 130.9922 m/z is 49.9968 amu different than 180.9890, which indicates a loss of CF2. The loss of CF2 is unlikely if the hydrogen is attached to the first position carbon. 1,1,2,2,3,3,4,4-Octafluorobutanesufonate is reported as an impurity in the manufacture of PFBS in a 2011 patent37 so we propose this structure as the most likely candidate structure. This compound is likely an unwanted by-product of the synthesis of PFBS by manufacturers in the Decatur area but also, given that this compound appears to be more abundant than PFBS in the waste stream, it is probably a byproduct of other PFBS related products as well. A sodium dimer was also observed under MS conditions when the ESI voltage was increased to 190 V at 580.8935 m/z. Sodium dimers have been observed previously and used for identification of novel fluorinated compounds.22 Other minor chromatographic peaks believed to be related to this compound were observed at mass intervals of 64.0124 amu corresponding to additions of CH2CF2 units (masses = 344.9656, 408.9780, 472.9904, 537.0028, 601.0152, see discussion above on 1,1-difluoroethene) as well as one peak that was 49.9968 amu below the predominant peak, which indicates a loss of CF2 and corresponds to C3HF6SO3; however these peaks were relatively small and MS/MS spectra could not be obtained.
Figure 5 –

MS/MS spectrum of m/z 280.9520 with proposed structure and fragments.
The chromatographic peak for C4H2F8SO3 was approximately 5 times larger than PFBS, which was quantified at 160 ng L−1 at site 2 (Table S2, SI). No standard could be obtained to properly quantify this newly identified compound; however, if it has a similar instrumental response as PFBS, which we believe can be used as a reasonable estimate, the compound’s concentration may approach 1 μg L−1 at site 2 (closest to the manufacturing facility) and around 150–200 ng L−1 at site 1 (Figure 1).
Amongst the largest chromatographic peaks in the samples and only occurring at sites 1–3, was a feature at 224.9850 m/z. Mass Hunter predicted the formula C4H6F4SO4 with a match score of 98%. The MS/MS analysis revealed spectral peaks at 79.9582 (SO3), 96.9596 (SO4H), 184.9710 (C4H3F2SO4), and 204.9860 (C4H4F3SO4). The presence of both SO4 and SO3 in the spectrum indicates that the structure contains a sulfate and the losses of HF (20.0053) and 2(HF) (40.0150) indicate C-H and C-F bonds on adjacent carbon atoms. This is likely another product synthesized using 1,1-difluoroethene. Liu et al. report discovery of several similar polyfluorinated sulfates containing five to fifteen carbons; however they do not report a four carbon sulfate.23 An MS/MS spectrum of this compound can be found in the SI (Figure S4) along with the only two possible structures for sulfates with this formula that have alternating CH2CF2 units (Figure S5).
A chromatographic peak at 344.9795 m/z was observed and formula prediction generated C7H2F12O2 with a match score of 96%. This formula was recently reported in water samples from China and identified using an HPLC-Orbitrap instrument giving a high degree of certainty in the molecular formula. 23 The authors did not confidently identify the structure of the molecule with regards to the position of the hydrogen, however, they do hypothesize that the presence of C2F5− and C3F7− fragments in the MS/MS spectrum (m/z 118.9920 and 168.9888, respectively) indicate that the C7 and C6 carbons are perfluorinated. We observed a peak at m/z 280.9814 in the spectrum corresponding to a loss of CO2 HF, indicating this compound contains a carboxylic acid. As with the previously discussed novel compounds, no standard exists to quantify this compound, however, using the response of C7 perfluorinated carboxylic acid, we estimate the concentration of this compound to be 80–100 ng L−1 in the most concentrated sample (Site 2) and 20–25 ng L−1 further downstream. Three other peaks believed to be related to this compound are smaller in mass by units of 49.9968, representing shorter chained (C4-C6) carboxylic acids that are perfluorinated except for a single hydrogen, however the C7 compound was the most predominant.
Perfluorobutane sulfonamido substances (PBSAs)
A large peak (> 7,000,000 area counts) was observed at sites 1–3 with an m/z of 369.9812. The structure was elucidated using its MS spectra and increasing the fragmentation voltage to 190 V, which produced ions suggesting its structure (Figure S6, SI). The spectral peak of 218.9870 matched to the formula C4F9 and differences between subsequent spectral peaks corresponded to losses of SO2 (282.9485–218.9864 = 63.9621), NCH3 (311.9751–282.9485 = 29.0266), and CH2CO2 (369.9805–311.9751 = 58.0054). Reconstructing the structure using these pieces, we hypothesized that this peak was N-methyl perfluorobutane sulfonamidoacetic acid (MeFBSAA). Indeed, a standard of this compound was obtained, which allowed for confirmation by matching retention times and mass spectra and quantification by external calibration in samples. The spectra obtained from the site 2 sample and the standard can be seen in Figure S6 (SI). Levels at sites 1, 2, and 3 were 67, 1,250, and 130 ng L−1, respectively.
Sulfonamido substances with eight carbon perfluorinated chains were produced by a major manufacturer in the area until 2003 and could be found in a variety of products including surface treatments, paper protectors, fire-fighting foams, mining surfactants, etc.38 These sulfonamido substances contain various functional groups but only three will be discussed here, each of which can be found with -H, methyl, or ethyl groups substituted on the nitrogen: perfluorooctanesulfonamides (FOSAs), perfluorooctanesulfonamidoethanol (FOSEs), and perfluorooctanesulfonamidoacetate (FOSAAs), respectively. After discovery of MeFBSAA, we sought related perfluorobutane sulfonamido substances. While MeFBSAA was by far the largest peak among these related compounds, the m/z for the following compounds were all present at site 2 (listed in order of descending peak area): perfluorobutane sulfonamide (FBSA), perfluorobutane sulfinic acid, perfluorobutane sulfonamidoacetic acid (FBSAA), N-ethyl perfluorobutane sulfonamidoacetic acid (EtFBSAA), and N-methyl perfluorobutane sulfonamdoethanol (MeFBSE). The structures of all PBSAs can be found in Figure S6 (SI). The presence of FBSA is particularly important in light of new evidence that this short chained compound is bioaccumulative in fish.21 It should also be noted that we have observed very low instrument responses for alcohols previously so the fact that the peak for MeFBSE was the smallest among this group of compounds does not indicate its concentration is the lowest. It is also possible that MeFBSE has been mainly emitted to the air compartment. Furthermore, it is probable that neutral species, such as FBSA and MeFBSE, were lost in the methanol wash of the WAX cartridge which was discarded prior to elution with basic methanol.39 We did not observe the short chain analogues to other alcohols (FOSEs) often associated with the sulfonamido substances such as perfluorobutane sulfonamidoethanol (FBSE) or N- ethyl perfluorobutane sulfonamidoethanol (EtFBSE).
The presence of MeFBSAA was reported once before by Huset et al.40 in landfill leachate at concentrations ranging from 58–440 ng L−1. In 2011, Buck et al. classified perfluoroalkane sulfonamidoacetic acids as intermediate environmental transformation products41 and pathways for the C-8 homologues to degrade from the ethanol to the carboxylic acids are clear.42 However, given the high concentration in close proximity to the manufacturing facilities in Decatur and the significant concentrations found in landfill leachate, MeFBSAA is certainly a significant polyfluoro contaminant. It could be an unintentional byproduct of the production process or an intentional product. In either case, the presence of this compound in high levels along with the presence of all the other related PBSAs and the sulfinic acid is indication that PBSAs are being used in large quantities. It is very probable that the compounds found in this study are part of “a new line of fluorochemical surfactants based on PFBS”17 consisting of sulfonamides based on PFBS chemistry instead of PFOS. If this is true, researchers can expect to find these compounds in widespread use along with other associated sulfonamides that may not have been detected in these samples by our instrumentation such as FBSE and EtFBSE.
Environmental Implications
Concentrations of legacy PFASs such as PFOA and PFOS in the water and sediment of the Tennessee River near Decatur are still elevated even though production of these compounds ceased more than a decade ago. The presence of these compounds is a testament to their persistence and recalcitrance, indicating that they will likely continue to be present in the water and sediment in the area for many more years to come. Sources of these compounds likely include groundwater or runoff from biosolids applied to soil in the area in addition to PFASs bound to sediments contaminated from previous years of output from the facilities.
If these measurements are indicative of current trends, it appears that production of fluorinated compounds in the Decatur area has shifted in two directions - towards shorter chained compounds based on PFBS chemistry and towards polyfluorinated compounds that contain some C-H bonds and sometimes alternating CH2CF2 units. The presence of these novel PFASs in Tennessee River water raises many questions that are not addressed in this study. Given that PFOS and PFOA are present in drinking water originating from the Tennessee River, it is likely these recently identified compounds are as well. However, no toxicological or environmental data are available for most of these compounds nor does data exist on the industrial or commercial uses of these compounds. It is possible that the presence of hydrogen in place of fluorine for some of the compounds provides sites for degradation, as has been observed with one fluorotelomer alcohol43, but this has yet to be comprehensively evaluated. In silico predictions of biotransformation half-lives and probability for rapid biodegradation support this hypothesis as most of the compounds are predicted to be more readily biodegradable by these two measures when compared to PFOS and PFOA (Table S3, SI). Future studies should focus on evaluating the environmental existence, persistence, bioaccumulation, and toxicity of these novel compounds. Standards are not available for most compounds making proper quantification very difficult, however, the size of some chromatographic peaks raises some concern. Our estimates for some of the compounds are around or above 1 μg L−1, more than 10 times the EPA’s drinking water guidelines for PFOS and PFOA.14, 15
Even If the concentrations of these novel compounds are, indeed, higher than the legacy PFASs, perhaps a more pressing concern is that there is no information about the possible uses of these compounds. It is unclear whether they are unintentional byproducts of the synthesis of other compounds or being directly manufactured. If these novel compounds are being synthesized for use in products, the nature of this use has direct implications for human exposure and environmental contamination outside of the Decatur area. Until standards are synthesized and more information about the production and use of these compounds comes to light, we can only speculate about their potential impacts on the environment and human health. If the environmental properties of the novel compounds discussed in this paper are at all similar to the legacy PFASs, the Tennessee River may be facing several more decades of contamination with fluorinated substances.
Supplementary Material
Acknowledgements
The authors would like to thank Mike Hayes, Mingjie Xie, and Xi Chen for providing analytical support with the QTOF. Alix E. Robel and Jennifer Field are greatly acknowledged for providing the MeFBSAA standard.
Footnotes
Disclaimer
This article was reviewed in accordance with the policy of the National Exposure Research Laboratory, U.S. Environmental Protection Agency, and approved for publication. Approval does not signify that the contents necessarily reflect the view and policies of the Agency, nor does mention of trade names or commercial products constitute endorsement or recommendation for use.
Supporting Information
More information about materials, QA/QC, levels of legacy PFAS in water (Table S1) and sediment (Table S2), summary table of observed peaks of interest with proposed structures and other information (Table S3), adjusted mass defect plot calculations, an adjusted mass defect plot (Figure S1), an MS/MS spectrum of C12H12F12O2 carboxylic acid (Figure S2), total area counts of different species in the C2nH2nF2nO2 series (Figure S3), an MS/MS spectrum of the sulfate compound (Figure S4), two possible structures for the sulfate compound (Figure S5), structures of all PBSAs (Figure S6), and are available. This material is available free of charge via the Internet at http://pubs.acs.org/.
References
- 1.Lindstrom AB; Strynar MJ; Libelo EL, Polyfluorinated Compounds: Past, Present, and Future. Environ. Sci. Technol 2011, 45, (19), 7954–7961. [DOI] [PubMed] [Google Scholar]
- 2.United States Environmental Protection Agency, U. E. EPA and 3M Announce Phase Out of PFOS. http://yosemite.epa.gov/opa/admpress.nsf/0/33aa946e6cb11f35852568e1005246b4 (December 12, 2015),
- 3.United States Environmental Protection Agency, U. E. 2010/2015 PFOA Stewardship Program. http://www.epa.gov/assessing-and-managing-chemicals-under-tsca/20102015-pfoa-stewardship-program (January 27, 2015),
- 4.UNEP The Stockholm Convention on Persistent Organic Pollutants. (December 7, 2015),
- 5.Wang Z; Cousins IT; Scheringer M; Hungerbuhler K, Fluorinated alternatives to long-chain perfluoroalkyl carboxylic acids (PFCAs), perfluoroalkane sulfonic acids (PFSAs) and their potential precursors. Environment International 2013, 60, 242–248. [DOI] [PubMed] [Google Scholar]
- 6.Draft Toxicological Profile for Perfluoralkyls. In (USDHHS), U. S. D. o. H. a. H. S, Ed. 2015.
- 7.Washington JW; Yoo H; Ellington JJ; Jenkins TM; Libelo EL, Concentrations, distribution, and persistence of perfluoroalkylates in sludge-applied soils near Decatur, Alabama, USA. Environ. Sci. Technol. 2010, 44, (22), 8390–8396. [DOI] [PubMed] [Google Scholar]
- 8.Paul AG; Jones KC; Sweetman AJ, A first global production, emission, and environmental inventory for perfluorooctane sulfonate. Environ. Sci. Technol 2008, 43, (2), 386–392. [DOI] [PubMed] [Google Scholar]
- 9.Pillion D, North Alabama drinking water contamination: What you need to know. Al.com 2016. [Google Scholar]
- 10.Lindstrom AB; Strynar MJ; Delinsky AD; Nakayama SF; McMillan L; Libelo EL; Neill M; Thomas L, Application of WWTP biosolids and resulting perfluorinated compound contamination of surface and well water in Decatur, Alabama, USA. Environ. Sci. Technol 2011, 45, (19), 8015–8021. [DOI] [PubMed] [Google Scholar]
- 11.3M Environmental Laboratory Environmental Monitoring - Multi-City Study: Water, Sludge, Sediment, POTW Effluent and Landfill Leachate Samples; 2001.
- 12.US EPA, Occurrence Data for the Unregulated Contaminant Monitoring Rule: UCMR 3 (2013–2015) occurrence data. In 2013–2015.
- 13.Exposure Investigation Report: Perfluorochemical Serum Sampling In the vicinity of Decatur, Alabama, Morgan, Lawrence, and Limestone Counties. In Services, U. S. D. o. H. a. H., Ed. 2013. [Google Scholar]
- 14.US EPA, Drinking Water Health Advisory for Perfluorooctane Sulfonate (PFOS). In 2016.
- 15.US EPA, Drinking Water Health Advisory for Perfluorooctanoic Acid (PFOA). In 2016.
- 16.Brooks K, In Alabama, 100,000 people told not to drink water due to contamination. Reuters 2016. [Google Scholar]
- 17.3M, Environmental, Health, Safety, and Regulatory (EHSR) Profile of Perfluorobutane Sulfonate (PFBS). In Technical Data Bulletin, 2002. [Google Scholar]
- 18.DeWitt JC, Toxicological Effects of Perfluoroalkyl and Polyfluoroalkyl Substances. Springer International Publishing: 2015. [Google Scholar]
- 19.Bowman JS, Fluorotechnology is critical to modern life: the FluoroCouncil counterpoint to the Madrid Statement. Environ Health Perspect 2015, 123, (5), A112–A113. [DOI] [PMC free article] [PubMed] [Google Scholar]
- 20.Blum A; Balan SA; Scheringer M; Trier X; Goldenman G; Cousins IT; Diamond M; Fletcher T; Higgins C; Lindeman AE, The Madrid statement on poly-and perfluoroalkyl substances (PFASs). Environ Health Perspect 2015, 123, (5), A107–A111. [DOI] [PMC free article] [PubMed] [Google Scholar]
- 21.Chu S; Letcher RJ; McGoldrick DJ; Backus SM, A New Fluorinated Surfactant Contaminant in Biota: Perfluorobutane Sulfonamide in Several Fish Species. Environmental Science & Technology 2016, 50, (2), 669–675. [DOI] [PubMed] [Google Scholar]
- 22.Strynar M; Dagnino S; McMahen R; Liang S; Lindstrom A; Andersen E; McMillan L; Thurman M; Ferrer I; Ball C, Identification of novel perfluoroalkyl ether carboxylic acids (PFECAs) and sulfonic acids (PFESAs) in natural waters using accurate mass time-of-flight mass spectrometry (TOFMS). Environmental science & technology 2015, 49, (19), 11622–11630. [DOI] [PubMed] [Google Scholar]
- 23.Liu Y; Pereira ADS; Martin JW, Discovery of C5-C17 Poly-and Perfluoroalkyl Substances in Water by In-Line SPE-HPLC-Orbitrap with In-Source Fragmentation Flagging. Analytical chemistry 2015, 87, (8), 4260–4268. [DOI] [PubMed] [Google Scholar]
- 24.Ferrer I; Thurman EM, Liquid chromatography/time-of-flight/mass spectrometry (LC/TOF/MS) for the analysis of emerging contaminants. TrAC Trends in Analytical Chemistry 2003, 22, (10), 750–756. [Google Scholar]
- 25.D’Agostino LA; Mabury SA, Identification of novel fluorinated surfactants in aqueous film forming foams and commercial surfactant concentrates. Environ. Sci. Technol. 2013, 48, (1), 121–129. [DOI] [PubMed] [Google Scholar]
- 26.Nakayama SF; Strynar MJ; Reiner JL; Delinsky AD; Lindstrom AB, Determination of perfluorinated compounds in the Upper Mississippi River Basin. Environ. Sci. Technol. 2010, 44, (11), 4103–4109. [DOI] [PubMed] [Google Scholar]
- 27.Kind T; Fiehn O, Seven golden rules for heuristic filtering of molecular formulas obtained by accurate mass spectrometry. BMC bioinformatics 2007, 8, (1), 105. [DOI] [PMC free article] [PubMed] [Google Scholar]
- 28.Kendrick E, A Mass Scale Based on CH2= 14.0000 for High Resolution Mass Spectrometry of Organic Compounds. Analytical Chemistry 1963, 35, (13), 2146–2154. [Google Scholar]
- 29.Hansen K-J; Johnson H; Eldridge J; Butenhoff J; Dick L, Quantitative characterization of trace levels of PFOS and PFOA in the Tennessee River. Environmental Science & Technology 2002, 36, (8), 1681–1685. [DOI] [PubMed] [Google Scholar]
- 30.Zareitalabad P; Siemens J; Hamer M; Amelung W, Perfluorooctanoic acid (PFOA) and perfluorooctanesulfonic acid (PFOS) in surface waters, sediments, soils and wastewater - A review on concentrations and distribution coefficients. Chemosphere 2013, 91, (6), 725–732. [DOI] [PubMed] [Google Scholar]
- 31.Schymanski EL; Jeon J; Gulde R; Fenner K; Ruff M; Singer HP; Hollender J, Identifying small molecules via high resolution mass spectrometry: communicating confidence. Environmental science & technology 2014, 48, (4), 2097–2098. [DOI] [PubMed] [Google Scholar]
- 32.US EPA Estimation Programs Interface Suite™ for Microsoft® Windows, v 4.11, Washington, DC, USA, 2012. [Google Scholar]
- 33.United States Environmental Protection Agency, U. E. Envirofacts. http://iaspub.epa.gov/enviro/tsca.get chem info?v registry id=110000367567 (November 20, 2015),
- 34.Kissa E, Fluorinated surfactants and repellents. CRC Press: 2001; Vol. 97. [Google Scholar]
- 35.Myers AL; Jobst KJ; Mabury SA; Reiner EJ, Using mass defect plots as a discovery tool to identify novel fluoropolymer thermal decomposition products. Journal of Mass Spectrometry 2014, 49, (4), 291–296. [DOI] [PubMed] [Google Scholar]
- 36.Dimzon IK; Trier X; Fromel T; Helmus R; Knepper TP; de Voogt P, High Resolution Mass Spectrometry of Polyfluorinated Polyether-Based Formulation. Journal of the American Society for Mass Spectrometry 2016, 27, 309–318. [DOI] [PMC free article] [PubMed] [Google Scholar]
- 37.Harada H; Kadota T Fire-resistant polycarbonate compositions, their manufacture, and their moldings. 2011. [Google Scholar]
- 38.Stock NL; Lau FK; Ellis DA; Martin JW; Muir DCG; Mabury SA, Polyfluorinated Telomer Alcohols and Sulfonamides in the North American Troposphere. Environ. Sci. Technol 2004, 38, (4), 991–996. [DOI] [PubMed] [Google Scholar]
- 39.Taniyasu S; Kannan K; So MK; Gulkowska A; Sinclair E; Okazawa T; Yamashita N, Analysis of fluorotelomer alcohols, fluorotelomer acids, and short- and long-chain perfluorinated acids in water and biota. Journal of Chromatography A 2005, 1093, (1–2), 89–97. [DOI] [PubMed] [Google Scholar]
- 40.Huset CA; Barlaz MA; Barofsky DF; Field JA, Quantitative determination of fluorochemicals in municipal landfill leachates. Chemosphere 2011, 82, (10), 1380–1386. [DOI] [PMC free article] [PubMed] [Google Scholar]
- 41.Buck RC; Franklin J; Berger U; Conder JM; Cousins IT; de Voogt P; Jensen AA; Kannan K; Mabury SA; van Leeuwen SP, Perfluoroalkyl and polyfluoroalkyl substances in the environment: terminology, classification, and origins. Integrated environmental assessment and management 2011, 7, (4), 513–541. [DOI] [PMC free article] [PubMed] [Google Scholar]
- 42.Rhoads KR; Janssen EML; Luthy RG; Criddle CS, Aerobic Biotransformation and Fate of N-Ethyl Perfluorooctane Sulfonamidoethanol (N-EtFOSE) in Activated Sludge. Environ. Sci. Technol 2008, 42, (8), 2873–2878. [DOI] [PubMed] [Google Scholar]
- 43.Arakaki A; Ishii Y; Tokuhisa T; Murata S; Sato K; Sonoi T; Tatsu H; Matsunaga T, Microbial biodegradation of a novel fluorotelomer alcohol, 1H,1H,2H,2H,8H,8H-perfluorododecanol, yields short fluorinated acids. Applied Microbiology and Biotechnology 2010, 88, (5), 1193–1203. [DOI] [PubMed] [Google Scholar]
Associated Data
This section collects any data citations, data availability statements, or supplementary materials included in this article.