Abstract
Chickens from lines selected for low (LWS) or high (HWS) body weight (BW) differ in appetite and adiposity. Mechanisms associated with the predisposition to becoming obese are unclear. The objective of the experiment was to evaluate developmental changes in depot-specific adipose tissue during the first 2 wk posthatch. Subcutaneous (SQ), clavicular (CL), and abdominal (AB) depots were collected at hatch (DOH) and days 4 (D4) and 14 (D14) posthatch for histological and mRNA measurements. LWS chicks had decreased SQ fat mass on a BW basis with reduced adipocyte size from DOH to D4 and increased BW and fat mass with unchanged adipocyte size from D4 to D14. HWS chicks increased in BW from DOH to D14 and increased in fat mass in all three depots with enlarged adipocytes in the AB depot from D4 to D14. Meanwhile, CCAAT/enhancer-binding protein-α, neuropeptide Y, peroxisome proliferator-activated receptor-γ, and acyl-CoA dehydrogenase mRNAs differed among depots between lines at different ages. Plasma nonesterified fatty acids were greater in LWS than HWS at D4 and D14. From DOH to D4, LWS chicks mobilized SQ fat and replenished the reservoir through hyperplasia, whereas HWS chicks were dependent on hyperplasia and hypertrophy to maintain adipocyte size and depot mass. From D4 to D14, adipose tissue catabolism and adipogenesis slowed. Whereas LWS fat depots and adipocyte sizes remained stable, HWS chicks rapidly accumulated fat in CL and AB depots. Chicks predisposed to be anorexic or obese have different fat development patterns during the first 2 wk posthatch.
Keywords: adipogenesis, adipose tissue depot, anorexic, chicks, development, obese
INTRODUCTION
Adipose tissue is the primary site in the body for storage of energy in the form of triglycerides (30). Less is known about the regulation of adipose tissue physiology in birds than mammals, with most of the avian research conducted using chickens as the model organism. In humans and rodents, there are two main types of adipose tissue, the white and brown adipose tissue, whereas only white adipose tissue is found in chickens. In humans, white adipose tissue is mainly distributed beneath the skin (subcutaneous, SQ) and around the internal organs (visceral) (33). In chickens and some other avian species, adipose tissue is mainly found in the abdominal (AB) and neck (clavicular, CL) areas, as well as the SQ regions (30, 36). The cellular development and expansion of adipose tissue are consequences of the balance between increases in cell number (hyperplasia) and cell size (hypertrophy). The progenitor cells, which eventually become mature adipocytes through adipogenesis, are regulated through hyperplasia (17), whereas hypertrophy is characterized by enhanced triglyceride storage and associated expansion of existing adipocytes (1). In humans, white adipose tissue expands rapidly after birth through hyperplasia and hypertrophy (13). During chicken embryonic adipose tissue development, preadipocyte hyperplasia dominates, followed by hypertrophy to establish immature adipocytes that can accumulate lipid droplets (19). In both egg (layer) and meat-type (broiler) chickens, hyperplasia is induced in connective tissue in the neck and upper legs between embryonic days 12 (E12) and 14 (E14), followed by slowing rates of hyperplasia until E18 (8). Most adipocytes are unilocular by E14, with a negligible number of multilocular cells (present during the early stages of adipocyte differentiation), indicating that chicken adipocytes undergo rapid maturation during embryonic development (8). In humans, visceral adipose tissue accumulation is positively associated with the onset of metabolic diseases, and hypertrophy is predominant in adulthood obesity because it is observed in all overweight and obese individuals (1). In chickens, adipocyte hyperplasia and hypertrophy increase with age, which is positively correlated with body mass and adipose tissue weight (5). However, the magnitude of contribution of the two processes to the volume and weight of the distinct adipose tissue depots is likely different and not well understood. Although it is reported that AB fat development is more pronounced than SQ or CL fat in broilers during the first 2 wk posthatch (2), in precocial avian species, there is a paucity of knowledge regarding metabolic characteristics of different fat depots.
We have previously reported on adipogenesis and lipid metabolism, as they are affected by long-term genetic selection for low (LWS) or high (HWS) body weight (BW) in chickens. After long-term continuous selection for divergent BW at 56 days of age from a common foundation population, there is a more than 10-fold difference in BW between the lines, accompanied by increased food intake in HWS compared with LWS chickens (11, 16, 25, 48). The LWS chickens are lean and anorexic; however, HWS chickens eat compulsively (12). An earlier study reported that the LWS chicks have lower lipogenic but greater lipolytic activity in adipose tissue than HWS chicks, thus preventing on excessive accumulation of body fat (4). Furthermore, although hypertrophy plays a major role in fat deposition in adult chickens, caloric overconsumption induces hyperplasia in sexually mature LWS and HWS chickens (35). Plasma nonesterified fatty acid (NEFA) concentrations are greater in 5-day-old LWS than HWS (26), and there are greater fatty acid oxidation efficiency and metabolic flexibility in the AB fat of 56-day LWS chickens than their respective HWS counterparts (50). Thus, although LWS chicks have a reduced capacity to accumulate adipose tissue that is likely related to a greater rate of metabolism, the underlying cellular mechanisms are unclear and the developmental regulation of these processes is unknown.
The objective of this study was to evaluate the morphological and molecular changes in depot-specific adipose tissue during the first 2 wk posthatch in chickens from lines selected for low and high BW. Although adipose tissue development under lean and obese states is comprehensively studied using rodent models, it is questionable whether the frequently used perigonadal depot in rodents can mimic the physiology of intra-abdominal/visceral adipose tissue in humans, as 1) humans do not have an analogous perigonadal depot and 2) from rodents one can only harvest a limited quantity of mesenteric adipose tissue, which is considered the most anatomically and physiologically similar to human intra-abdominal adipose tissue (9). Hence, our research using the BW-selected chicken model, in which adipose tissue depots are anatomically similar to humans, will provide further insights on the basis for anatomical differences in adipose tissue expansion and mechanisms underlying the propensity to be lean or obese.
MATERIALS AND METHODS
Animals
All procedures were approved by the Virginia Tech Institutional Animal Care and Use Committee. The LWS and HWS chickens used in this study are the result of long-term selection for low or high BW, respectively, at 56 days of age (16, 43) with details of the selection program described elsewhere (12, 28). The parents of the chicks used in the study were at the same age. After hatch, HWS and LWS lines were group caged in a room at 32 ± 1°C and 50 ± 5% relative humidity. Chicks had free access to water and a mash diet (21.5% crude protein and 3,000 kcal ME/kg). For BW, body composition, and fat depot weight measurements, six chicks were used per line. For plasma NEFA measurements, 12 chicks per line were used for the assay. For all the other experiments, five males and five females were used per line. Sexes were confirmed visually by gonadal inspection during dissection. On day of hatch (DOH), day 4 (D4), and D14 posthatch, chicks were randomly selected from each line to be weighed and euthanized for tissue collection, as described below.
Experiment 1: Body Composition
Fat and lean masses were determined with a minispec LF90 NMR whole body composition analyzer (Bruker, MA). The machine was calibrated with a bottle of 500 g of canola seeds before use as recommended by the manufacturer. Each chick was scanned twice, and the average of the duplicates was used for data analysis. Before the measurements on DOH and D4, yolk sacs were completely removed from the euthanized birds by excision through the navel and weighed. This was necessary to eliminate the confounding effects of residual yolk nutrients on whole body composition.
Experiment 2: Adipose Tissue Depot Weights
Adipose tissue depots were weighed, and weights were converted into a percentage of BW. The three depots included the AB (attached to the gizzard), CL, (discrete mass above the clavicle), and SQ adipose tissue (after peeling back the skin above the cloaca and removing all exposed adipose tissue under the skin).
Experiment 3: Adipose Tissue Histology
Adipose tissue samples were collected as described above. Samples were rinsed in phosphate-buffered saline, submerged in neutral-buffered formalin, and incubated on a rocking platform at 4°C overnight. Samples were dehydrated in a graded ethanol series, paraffin embedded, sectioned at 5 μm, and mounted on slides (1 section was mounted per slide with 2 slides at least 200 μm apart per sample). Slides were stained with hematoxylin and eosin, and images were captured (3 on each section) with a Nikon Eclipse 80i microscope and DS-Ri1 color camera; images were analyzed using NIS-Elements Advanced Research Software (Nikon, Tokyo, Japan). Adipocytes were treated as binary objects with the restriction that measurements must exceed 100 μm2. The area and diameter of every adipocyte within the field of an image were measured under ×20 magnification. The adipocyte size distribution was also determined for each group.
Experiment 4: Total RNA Isolation and Real-Time PCR
Adipose tissue samples were collected and submerged in RNAlater (Qiagen, Valencia, CA). Tissues were homogenized in 1 ml Tri-Reagent (TR 118; Molecular Research Center, Cincinnati, OH) using 5-mm stainless steel beads (Qiagen) and a Tissue Lyser II (Qiagen) for 2 × 2 min at 25 Hz. The manufacturer’s instructions were followed to separate total RNA, and, after the step of addition to 100% ethanol, the RNA and ethanol mixture were transferred to spin columns and further purified with the optional RNase-free DNase I from Direct-zol RNA kits (Zymo Research, Irvine, CA). A high-capacity cDNA Reverse Transcription Kit (Applied Biosystems, Carlsbad, CA) was used to synthesize single-stranded cDNA. Primers for real-time PCR were designed with Primer Express 3.0 software (Applied Biosystems) and validated to have similar (within 5% of reference gene) amplification efficiency before use (Table 1). Real-time PCR was performed as we described (2).
Table 1.
Primers used for real-time PCR
| Gene | Primer Sequence (5′-3′); Forward/Reverse | Accession No. |
|---|---|---|
| β-Actin | GTCCACCGCAAATGCTTCTAA/TGCGCATTTATGGGTTTTGTT | NM_205518.1 |
| ACADL | GACATCGGCACTCGGAAGA/CCTGGTGCTCTCCCTGAAGA | NM_001006511.2 |
| AGPAT2 | GCCAAACACCGAAGGAACAT/CCATGGCATCCCCAGAGTT | XM_015279793.1 |
| ATGL | GCCTCTGCGTAGGCCATGT/GCAGCCGGCGAAGGA | NM_001113291.1 |
| C/EBPα | CGCGGCAAATCCAAAAAG/GGCGCACGCGGTACTC | NM_001031459.1 |
| C/EBPβ | GCCGCCCGCCTTTAAA/CCAAACAGTCCGCCTCGTAA | NM_205253.2 |
| DGAT2 | TTGGCTTTGCTCCATGCAT/CCCACGTGTTCGAGGAGAA | XM_419374.5 |
| FABP4 | CAGAAGTGGGATGGCAAAGAG/CCAGCAGGTTCCCATCCA | NM_204290.1 |
| LPL | GACAGCTTGGCACAGTGCAA/CACCCATGGATCACCACAAA | NM_205282.1 |
| NPY | CATGCAGGGCACCATGAG/CAGCGACAAGGCGAAAGTC | NM_205473.1 |
| NPYR2 | TGCCTACACCCGCATATGG/GTTCCCTGCCCCAGGACTA | NM_001031128.1 |
| PPARγ | CACTGCAGGAACAGAACAAAGAA/TCCACAGAGCGAAACTGACATC | NM_001001460.1 |
| SREBP1 | CATCCATCAACGACAAGATCGT/CTCAGGATCGCCGACTTGTT | NM_204126.1 |
ACADL, acyl-CoA dehydrogenase, long chain; AGPAT2, 1-acylglycerol-3-phosphate O-acyltransferase 2; ATGL, adipose triglyceride lipase; C/EBPα, CCAAT/enhancer-binding protein-α; C/EBPβ, CCAAT/enhancer-binding protein-β; DGAT2, diacylglycerol O-acyltransferase 2; FABP4, fatty acid binding protein 4; LPL, lipoprotein lipase; NPY, neuropeptide Y; NPYR2, NPY receptor 2; PPARγ, peroxisome proliferator-activated receptor-γ; SREBP1, sterol regulatory element-binding transcription factor 1.
Experiment 5: Plasma NEFAs
The procedure was the same as described in our previous study (26). Briefly, ~200 μl of blood were collected from the trunk of each chick via Microvette capillary blood collection tubes (Sarstedt, Germany) immediately following euthanasia and decapitation. After collection, samples were centrifuged at 2,000 g at room temperature to isolate plasma, which was then placed on ice and aliquoted. Plasma NEFA concentrations were measured with a NEFA-HR2 kit (FUJIFILM, Wako Diagnostics, Mountain View, CA) according to the manufacturer’s instructions. Absorbance was measured at 550 nm using an Infinite M200 Pro multi-mode plate reader (Tecan, Männedorf, Switzerland). Sample concentration was calculated using the following formula: sample concentration = standard concentration × (sample absorbance)/(standard absorbance). Units for the concentrations are reported as meq/l.
Statistical Analysis
ANOVA was performed for BW, body composition, adipose tissue depot weight, percent weight, adipocyte area and diameter, relative quantity (RQ) value, and NEFAs using the Fit Model platform of JMP Pro 13 (SAS Institute, Cary, NC). Correlations between yolk sac weight (YSW) and BW, lean and fat mass on DOH and D4 were calculated using the Fit Y by X procedure of JMP Pro 13. The real-time PCR data were analyzed using the ΔΔCT method, where ΔCT = CT target gene − CT actin, and ΔΔCT = ΔCT target sample − ΔCT calibrator (38). The average of SQ fat on DOH from the LWS was used as the calibrator sample. The fold difference (RQ) was calculated as 2-ΔΔCT. Effects involving sex were not significant; thus sex was excluded from the statistical model. The statistical model included the main effects of adipose tissue depot, day of sampling (age), line, and their interactions (only age and line for BW and body composition data). Tukey’s test was used post hoc to separate the means. All data are presented as least squares means ± SE. Differences were considered significant at P < 0.05.
RESULTS
For all results, only the highest-order significant effect for each trait will be discussed. There was a two-way interaction between line and age on BW, in which HWS chicks were heavier than LWS at all of the sampling days (P < 0.0001; Fig. 1).
Fig. 1.
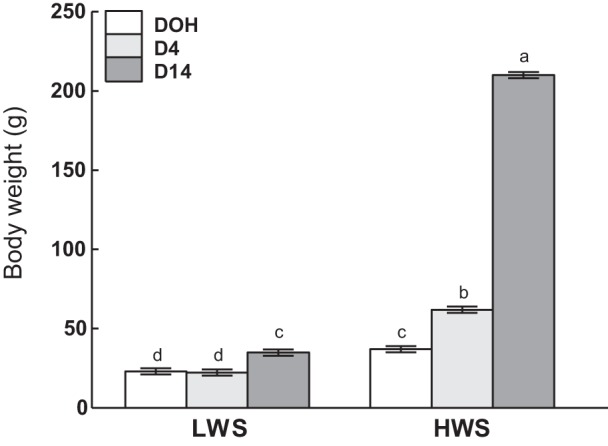
Body weights of low (LWS) and high (HWS) body weight-selected line chicks on day of hatch (DOH), day 4 (D4), and day 14 (D14) posthatch. Values are means ± SE. Means bearing a, b, c, and d differ (P < 0.05; Tukey’s test).
Body Composition
Body composition data are summarized in Table 2. YSW as a percentage of BW decreased from DOH to D4 (P < 0.0001). The absolute fat mass values on DOH were too low to be determined accurately by the instrument; hence the absolute and relative fat mass data on DOH were omitted from the analysis. Relative lean (lean%) masses as a percentage of BW were greater in HWS than LWS (P < 0.0001).
Table 2.
Body composition of body weight-selected line chicks during first 2 wk posthatch
| Effect | YSW, g | YSW, %BW | Fat Mass, g | Fat Mass, %BW | Lean Mass, g | Lean Mass, %BW |
|---|---|---|---|---|---|---|
| Age | ||||||
| DOH | 4.03 | 12.79 | - | - | 24.30c | 62.25 |
| D4 | 0.35 | 0.65 | 5.06 | 6.98 | 45.03b | 61.98 |
| D14 | - | - | 42.96 | 20.52 | 125.86a | 60.23 |
| SE | 0.19 | 0.47 | 0.78 | 0.46 | 1.36 | 0.78 |
| P value | <0.0001 | <0.0001 | <0.0001 | <0.0001 | <0.0001 | 0.16 |
| Line | ||||||
| LWS | 3.12 | 13.03 | 2.73 | 7.32 | 15.85 | 52.93 |
| HWS | 4.95 | 12.55 | 24.01 | 13.75 | 65.06 | 61.49 |
| SE | 0.27 | 0.67 | 0.55 | 0.33 | 0.79 | 0.45 |
| P value | 0.0001 | 0.6201 | <0.0001 | <0.0001 | <0.0001 | <0.0001 |
| A × L | 0.0254 | 0.4911 | <0.0001 | <0.0001 | <0.0001 | 0.07 |
Effects of age [day of hatch (DOH), day 4 posthatch (D4), and day 14 posthatch (D14)], line (low- and high-body weight-selected lines; LWS and HWS, respectively), and the interaction between age (A) and line (L) on absolute yolk sac weight (YSW), lean and fat mass and as a percentage of body weight (%BW) are shown. Values represent least squares means and pooled SE with associated P values for each effect (n = 6). (-) denotes that there was no comparison for the amount of fat on DOH because fat percentages were too low in each line to be determined accurately by the instrument, and on D14 there was no yolk sac remaining. Superscripted letters denote differences at P < 0.05.
There were line-by-age interactions on absolute YSW (P = 0.0254; Fig. 2), absolute fat, lean mass, and fat% (P < 0.0001; Fig. 3). HWS chicks had the greatest YSW on DOH, followed by that of the LWS at the same age, whereas by D4 YSW had decreased to a similar amount in both lines (Fig. 2). Lean mass increased at each age in HWS and was greater in HWS than LWS at each age, whereas, in LWS chicks, lean mass did not change between DOH and D4 but was greater at D14 than D4 (Fig. 3A). Similarly, fat mass, both absolute (Fig. 3B) and as a percentage of BW (Fig. 3C), was greater in HWS than LWS at D4 and D14 and increased to D14 at a greater magnitude in HWS than LWS chicks.
Fig. 2.
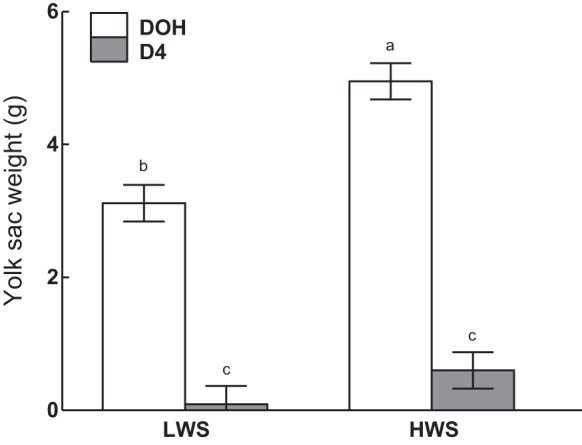
Yolk sac weights of low (LWS) and high (HWS) body weight-selected line chicks on day of hatch (DOH) and day 4 posthatch (D4). Tukey’s test was performed to separate the significant 2-way interactions between age and line. Values are means ± SE. Means bearing a, b, and c differ (P < 0.05).
Fig. 3.
Body composition of low (LWS) and high (HWS) body weight (BW)-selected line chicks on day of hatch (DOH) and days 4 (D4) and 14 (D14) posthatch. Tukey’s test was used to separate the significant 2-way interactions between age and line on lean mass (A), fat mass (B), and fat mass expressed as a percentage of BW (C). Values are means ± SE. Means bearing a, b, c, d, and e differ (P < 0.05).
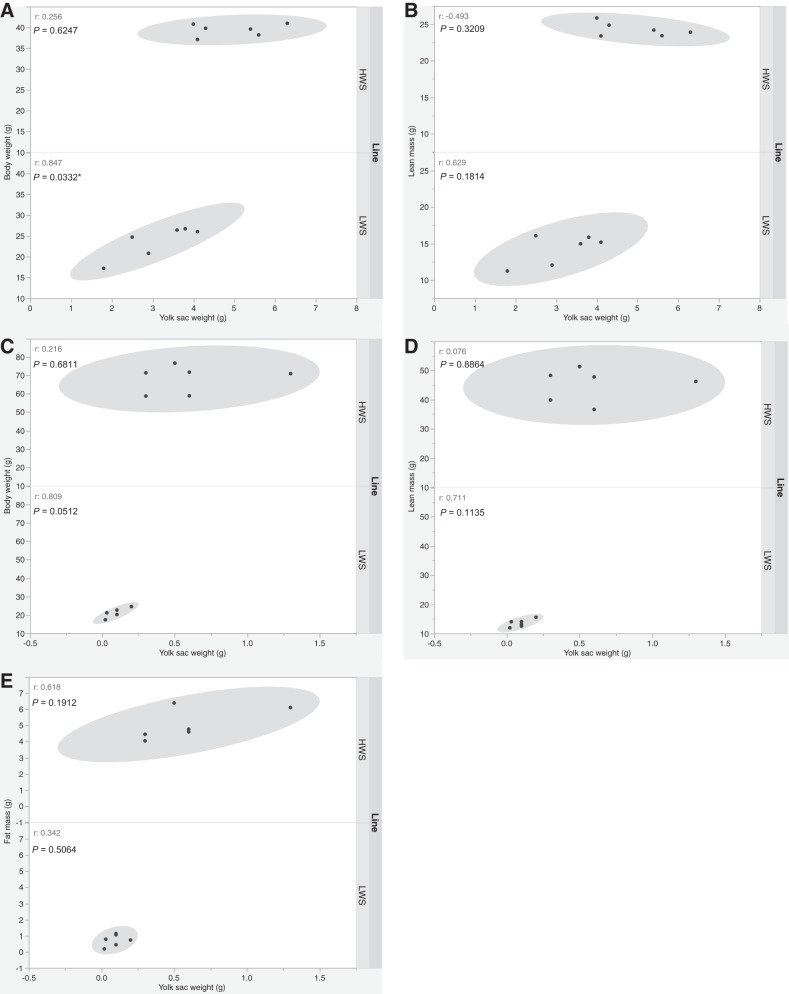
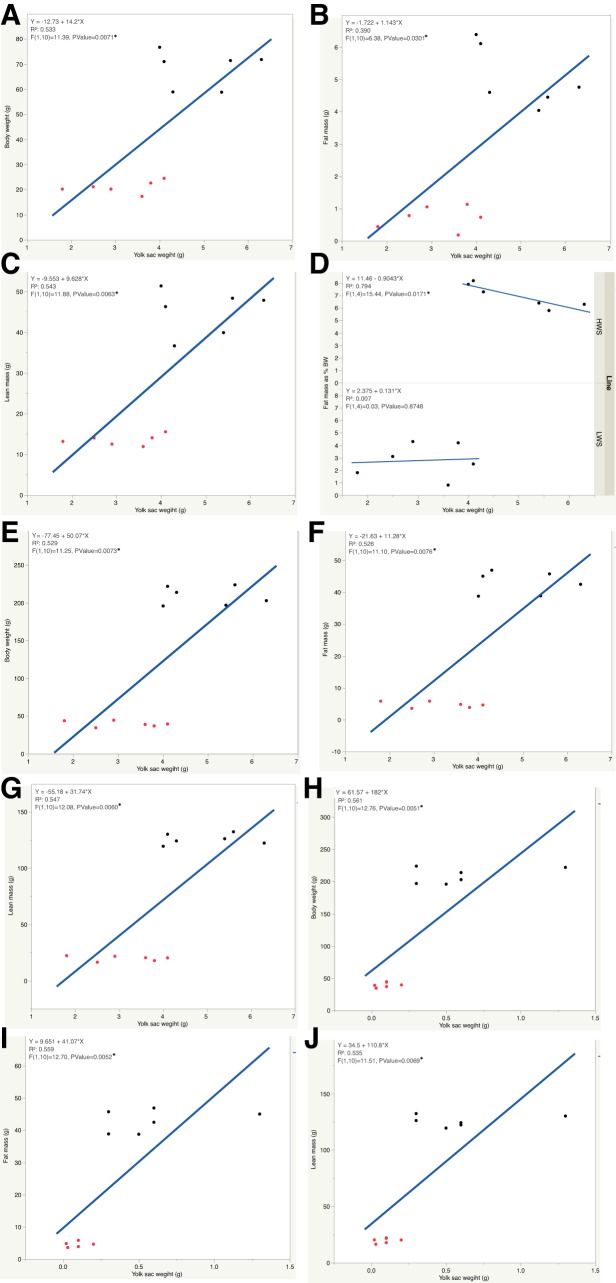
In addition, the relationships between absolute YSW and BW, fat mass, and lean mass were also determined. There were significant correlations between YSW and BW, as well as between YSW and lean mass on both DOH (r = 0.83, P = 0.0008 and r = 0.755, P = 0.0045, respectively) and D4 (r = 0.744, P = 0.0055 and r = 0.721, P = 0.0081, respectively) regardless of line. A correlation between YSW and fat mass on D4 posthatch (r = 0.812, P = 0.0013) was also observed regardless of line. However, within each line, the only correlation was between YSW and BW in LWS chicks on DOH (r = 0.847, P = 0.0332; Fig. 4A), whereas on D4 it approached significance (r = 0.809, P = 0.0512; Fig. 4C). There were also linear relationships between DOH YSW and D4 and D14 BW (P = 0.0071, Fig. 5A and P = 0.0073, Fig. 5E, respectively), fat mass (P = 0.0301, Fig. 5B and P = 0.0076, Fig. 5F, respectively), as well as lean mass (P = 0.0063, Fig. 5C and P = 0.0060, Fig. 5G, respectively) regardless of line. In HWS chicks, there was a linear relationship between DOH YSW and D4 fat% (P = 0.0171, Fig. 5D), whereas no such association was observed in LWS. Moreover, relationships between D4 YSW and D14 BW (P = 0.0051, Fig. 5H), fat mass (P = 0.0052, Fig. 5I), and lean mass (P = 0.0069, Fig. 5J) were observed regardless of line.
Fig. 4.
Correlations between yolk sac weight and body weight, lean mass and fat mass on day of hatch (DOH; A and B) and day 4 posthatch (D4; C–E) in high (HWS) and low (LWS) body weight-selected line chicks. *P < 0.05.
Fig. 5.
Regressions between day of hatch yolk sac weight and day 4 posthatch body weight (A), fat mass (B), and lean mass (C) regardless of line and regression between day of hatch yolk sac weight and day 4 posthatch fat mass in percentage of body weight (fat%) in high (HWS) and low (LWS) body weight-selected line chicks (D) are shown. Regressions between day of hatch yolk sac weight and day 14 posthatch body weight (E), fat mass (F), and lean mass (G) regardless of line are shown. Regressions between day 4 posthatch yolk sac weight and day 14 posthatch body weight (H), fat mass (I), and lean mass (J) are shown. Red dots represent LWS chicks, and black dots represent HWS chicks (*P < 0.05).
Adipose Tissue Depot Weights
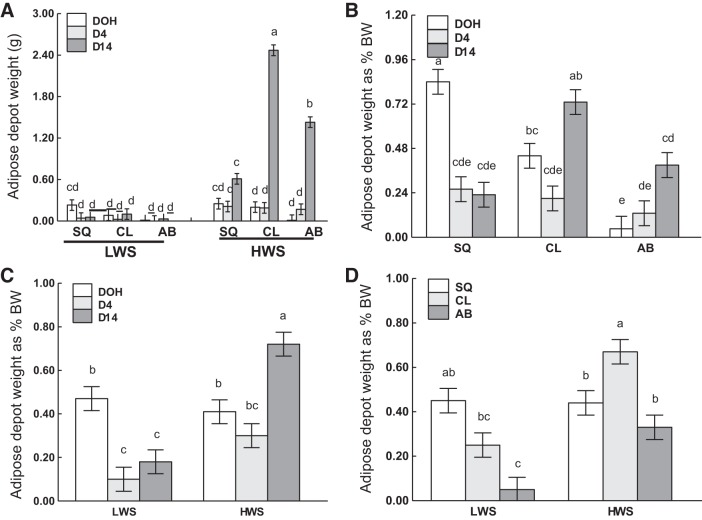
Results for adipose tissue depot weights are summarized in Table 3. There was a three-way interaction of age, adipose tissue depot, and line on absolute depot weights (P < 0.0001; Fig. 6A). Tissue weight was greatest in CL, intermediate in AB, and lowest in SQ of HWS at D14. For other combinations, weights were either similar or lower than that of SQ in HWS at D14. There were no differences among depots and ages within LWS chicks.
Table 3.
Adipose tissue depot weights
| Effect | Weights, g | Weights, %BW |
|---|---|---|
| Age | ||
| DOH | 0.13b | 0.44a |
| D4 | 0.11b | 0.20b |
| D14 | 0.78a | 0.45a |
| SE | 0.031 | 0.039 |
| P value | <0.0001 | <0.0001 |
| Depot | ||
| SQ | 0.23b | 0.44a |
| CL | 0.51a | 0.46a |
| AB | 0.28b | 0.19b |
| SE | 0.031 | 0.039 |
| P value | <0.0001 | <0.0001 |
| Line | ||
| LWS | 0.064 | 0.25 |
| HWS | 0.61 | 0.48 |
| SE | 0.025 | 0.032 |
| P value | <0.0001 | <0.0001 |
| A × D | <0.0001 | <0.0001 |
| A × L | <0.0001 | <0.0001 |
| D × L | <0.0001 | 0.0007 |
| A × D × L | <0.0001 | 0.09 |
Effects of age [day of hatch (DOH), day 4 posthatch (D4), and day 14 posthatch (D14)], adipose tissue depot [subcutaneous (SQ), clavicular (CL), and abdominal (AB)], line (low- and high-body weight-selected lines; LWS and HWS, respectively), and the interactions between age (A), depot (D), and line (L) on adipose tissue weights and weights as a percentage of body weight (%BW) are shown. Values represent least squares means and pooled SE with associated P values for each effect (n = 6). Unique superscripts within an effect are significantly different at P < 0.05. Superscripted letters denote differences at P < 0.05.
Fig. 6.
Adipose tissue depot absolute weight and weight on a body weight basis (%BW) in subcutaneous (SQ), clavicular (CL), and abdominal (AB) depots on the day of hatch (DOH) and days 4 (D4) and 14 (D14) posthatch in low (LWS) and high (HWS) body weight-selected line chicks are shown. Tukey’s test was used to separate the significant 3-way interactions of age, line, and depot (A), and 2-way interactions between age and adipose tissue depot (B), age and line (C), and adipose tissue depot and line (D) are shown. Values are means ± SE. Means bearing a, b, c, d, and e differ (P < 0.05).
There were two-way interactions of age and adipose tissue depot, age and line, as well as adipose tissue depot and line for relative depot weights (P < 0.0001, P < 0.0001, and P = 0.0007, respectively; Fig. 6, B–D). SQ% at DOH and CL% at D14 were greater than other age and depot combinations. Relative depot weights were greater in HWS than other age and line combinations. SQ% in LWS was similar to CL% in HWS, which was greater than the relative weights in other adipose tissue depot and line combinations.
Adipose Tissue Histology
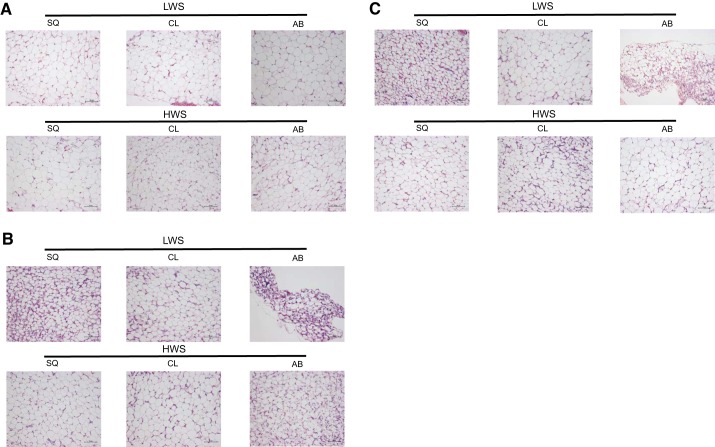
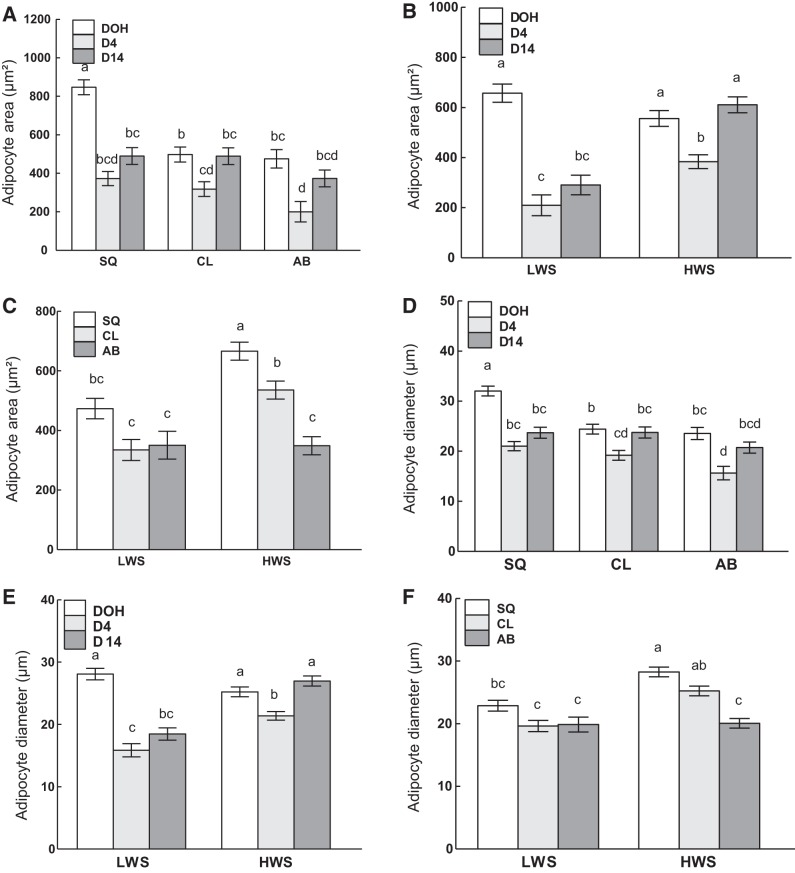
Results for adipocyte measurements are summarized in Table 4, and representative images are shown in Fig. 7. There were interactions of age and depot, age and line, and depot and line on adipocyte areas (P = 0.0003, P < 0.0001, and P = 0.01, respectively; Fig. 8, A, B, and C, respectively) as well as adipocyte diameters (P = 0.005, P < 0.0001, and P = 0.007, respectively; Fig. 8, D, E, and F, respectively). Adipocyte area (Fig. 8A) and diameter (Fig. 8D) of SQ fat at DOH were greater than in other depots at all ages. For both traits, in all depots, there was a decrease from DOH to D14. Adipocyte areas (Fig. 8B) and diameters (Fig. 8E) were greater in both lines at DOH than other ages, as well as in HWS at D14 than other age and line combinations. Adipocyte area (Fig. 8C) and diameter (Fig. 8F) were similar among depots in LWS, whereas in HWS they were greatest in the SQ fat and lowest in the AB fat and greater in the HWS SQ fat than other depot and line combinations.
Table 4.
Adipocyte area and diameter
| Effect | Area, µm2 | Diameter, µm |
|---|---|---|
| Age | ||
| DOH | 606.63a | 26.65a |
| D4 | 296.69c | 18.61c |
| D14 | 450.69b | 22.71b |
| SE | 24.78 | 0.63 |
| P value | <0.0001 | <0.0001 |
| Depot | ||
| SQ | 569.80a | 25.56a |
| CL | 434.87b | 22.44b |
| AB | 349.34b | 19.97c |
| SE | 24.67 | 0.63 |
| P value | <0.0001 | <0.0001 |
| Line | ||
| LWS | 385.92 | 20.79 |
| HWS | 516.75 | 24.52 |
| SE | 20.07 | 0.51 |
| P value | <0.0001 | <0.0001 |
| A × D | 0.0003 | 0.005 |
| A × L | <0.0001 | <0.0001 |
| D × L | 0.01 | 0.007 |
| A × D × L | 0.11 | 0.09 |
Effects of age [day of hatch (DOH), day 4 posthatch (D4), and day 14 posthatch (D14)], adipose tissue depot [subcutaneous (SQ), clavicular (CL), and abdominal (AB)], line (low- and high-body weight-selected lines; LWS and HWS, respectively), and the interactions between age (A), depot (D), and line (L) on adipocyte area and diameter are shown. Values represent least squares means and pooled SE with associated P values for each effect (n = 10). Superscripted letters denote differences at P < 0.05.
Fig. 7.
Representative images from histological evaluation of subcutaneous (SQ), clavicular (CL), and abdominal (AB) adipose tissue depots in low (LWS) and high (HWS) body weight-selected lines of chicks on day of hatch (A), day 4 posthatch (B), and day 14 posthatch (C) are shown. Scale bar = 50 μm. Sections were hematoxylin and eosin stained with images captured by a Nikon Eclipse 80i microscope and DS-Ri1 color camera.
Fig. 8.
Adipocyte area and diameter in subcutaneous (SQ), clavicular (CL), and abdominal (AB) adipose tissue depots of low (LWS) and high (HWS) body weight-selected lines of chicks on day of hatch (DOH) and days 4 (D4) and 14 (D14) posthatch are shown. Tukey’s test was performed to separate the interactions between age and adipose tissue depot (A and D), age and line (B and E), and adipose tissue depot and line (C and F). Values are means ± SE. Means bearing a, b, c, and d differ (P < 0.05).
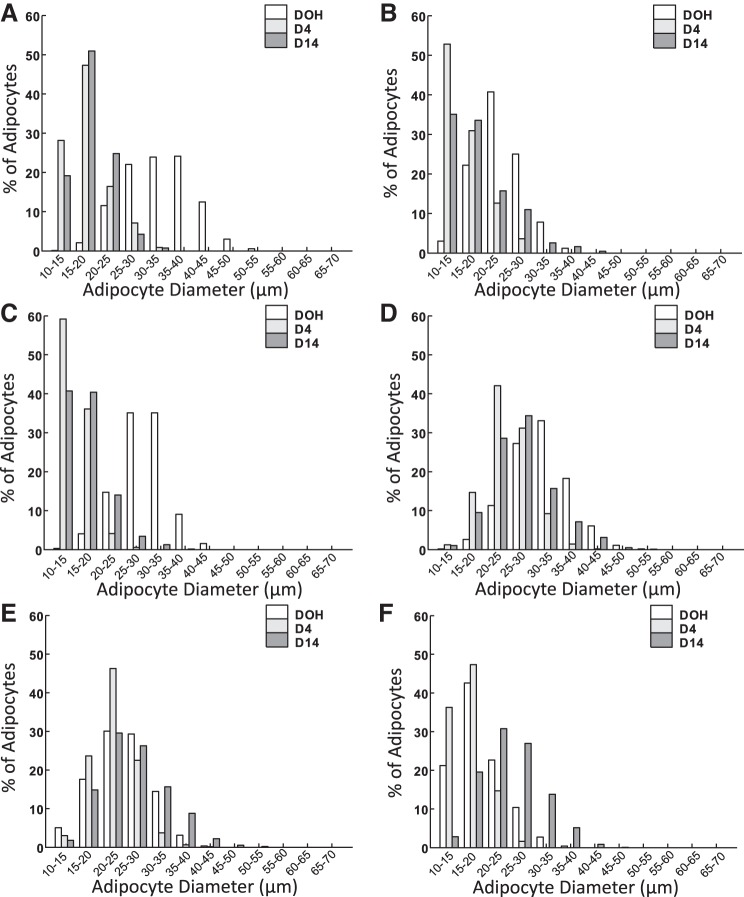
Adipocyte size distributions are shown in Fig. 9. In terms of the distribution of adipocyte diameters, >94%, 95%, and 98% of adipocytes were 20–45 μm (Fig. 9A), 15–40 μm (Fig. 9B), and 15–40 μm (Fig. 9C) in the SQ, CL, and AB fat, respectively, of LWS chicks at DOH. More than 99% (95% in AB fat at D14) of adipocytes were 10–30 μm in the SQ fat of LWS at D4 and D14 and 10–25 μm in the AB fat of LWS at D4 and D14. The distribution was similar in the SQ (Fig. 9D) and CL (Fig. 9E) fat of HWS from DOH to D14. On D4, the diameter of >98% of adipocytes in the AB fat of HWS was <25 μm, whereas the diameter of >45% of adipocytes was >25 μm at D14 (Fig. 9F).
Fig. 9.
Adipocyte size distribution in subcutaneous (SQ) (A), clavicular (CL) (B), and abdominal (AB) (C) adipose tissue depots of low body weight-selected (LWS) and SQ (D), CL (E), and AB (F) depots of high body weight-selected (HWS) line chicks on day of hatch (DOH) and days 4 (D4) and 14 (D14) posthatch are shown.
mRNA Abundance in Adipose Tissue
Results for mRNA abundance are summarized in Table 5. There were no two- or three-way interactions for adipose triglyceride lipase (ATGL) mRNA. Therefore, only the main effects of age, depot, and line on ATGL expression are presented. The mRNA abundance of ATGL increased from DOH to D4 and declined from D4 to D14 to the same level as on DOH. Among the three depots, ATGL expression was greater in CL than AB, whereas expression in SQ did not differ from the other two depots. LWS chicks expressed more ATGL than the HWS chicks.
Table 5.
Adipose tissue mRNA abundance
| Effect | ACADL | AGPAT2 | ATGL | C/EBPα | C/EBPβ | DGAT2 | FABP4 | LPL | NPY | NPYR2 | PPARγ | SREBP1 |
|---|---|---|---|---|---|---|---|---|---|---|---|---|
| Age | ||||||||||||
| 0 | 1.70b | 2.72a | 0.90b | 1.09b | 1.02b | 1.66c | 1.36b | 1.70c | 4.86b | 4.76b | 1.35c | 0.80c |
| 4 | 2.41a | 2.35a | 1.96a | 4.15a | 2.51a | 3.39b | 2.35a | 5.51a | 8.84a | 10.22a | 3.89a | 2.89b |
| 14 | 1.76b | 1.72b | 0.71b | 2.78a | 0.49c | 8.67a | 0.99c | 4.43b | 1.13c | 1.15c | 2.51b | 4.78a |
| SE | 0.12 | 0.16 | 0.10 | 0.43 | 0.13 | 0.46 | 0.11 | 0.30 | 0.49 | 0.65 | 0.17 | 0.20 |
| P value | <0.0001 | <0.0001 | <0.0001 | <0.0001 | <0.0001 | <0.0001 | <0.0001 | <0.0001 | <0.0001 | <0.0001 | <0.0001 | <0.0001 |
| Depot | ||||||||||||
| AB | 1.80b | 2.10 | 0.90b | 2.22 | 1.48 | 4.17b | 1.37b | 2.44c | 6.99a | 8.11a | 2.57 | 2.28b |
| CL | 2.25a | 2.57 | 1.49a | 2.52 | 1.43 | 5.97a | 1.50ab | 5.56a | 4.45b | 3.35b | 2.86 | 3.61a |
| SQ | 1.80b | 2.13 | 1.18ab | 3.27 | 1.11 | 3.57b | 1.84a | 3.64b | 3.40b | 4.68b | 2.32 | 2.59b |
| SE | 0.12 | 0.16 | 0.10 | 0.42 | 0.13 | 0.46 | 0.11 | 0.29 | 0.49 | 0.61 | 0.17 | 0.20 |
| P value | 0.007 | 0.056 | 0.0003 | 0.21 | 0.093 | 0.0009 | 0.006 | 0.00011 | <0.0001 | <0.0001 | 0.072 | <0.0001 |
| Line | ||||||||||||
| LWS | 1.92 | 2.50 | 1.43 | 2.62 | 1.52 | 4.93 | 1.61 | 3.49 | 6.37 | 7.30 | 2.41 | 2.56 |
| HWS | 1.97 | 2.03 | 0.95 | 2.72 | 1.16 | 4.21 | 1.52 | 4.27 | 3.52 | 3.45 | 2.76 | 3.09 |
| SE | 0.094 | 0.13 | 0.081 | 0.34 | 0.10 | 0.38 | 0.087 | 0.24 | 0.40 | 0.49 | 0.14 | 0.16 |
| P value | 0.69 | 0.01 | <0.0001 | 0.84 | 0.01 | 0.18 | 0.47 | 0.03 | <0.0001 | <0.0001 | 0.070 | 0.02 |
| A × D | <0.0001 | <0.0001 | 0.093 | 0.003 | 0.0003 | 0.15 | <0.0001 | 0.002 | 0.0002 | 0.0004 | 0.028 | <0.0001 |
| A × L | 0.006 | 0.32 | 0.20 | 0.78 | 0.38 | 0.007 | 0.0003 | 0.01 | <0.0001 | <0.0001 | 0.035 | <0.0001 |
| D × L | 0.064 | 0.0002 | 0.15 | 0.75 | 0.003 | 0.31 | 0.060 | 0.51 | 0.0095 | 0.0003 | 0.60 | 0.02 |
| A × D × L | <0.0001 | 0.12 | 0.66 | 0.87 | <0.0001 | 0.94 | 0.14 | 0.14 | 0.002 | 0.14 | 0.02 | 0.11 |
Effects of age [day of hatch (DOH), day 4 posthatch (D4), and day 14 posthatch (D14)], adipose tissue depot [subcutaneous (SQ), clavicular (CL), and abdominal (AB)], line (low- and high-body weight-selected lines; LWS and HWS, respectively), the 2-way interactions between age (A) and depot (D), age (A) and line (L), depot (D) and line (L), and the 3-way interactions among age (A), depot (D), and line (L) are shown. Values represent least squares means and pooled SE with associated P values for each effect (n = 10). ACADL; acyl-CoA dehydrogenase, long chain; AGPAT2, 1-acylglycerol-3-phosphate O-acyltransferase 2; ATGL, adipose triglyceride lipase; C/EBPα and C/EBPβ, CCAAT/enhancer-binding protein-α and -β, respectively; DGAT2, diglyceride acyltransferase 2; FABP4, fatty acid-binding protein 4; LPL, lipoprotein lipase; NPY, neuropeptide Y; NPYR2, NPY receptor subtype 2; PPARγ, peroxisome proliferator-activated receptor-γ; SREBP1, sterol regulatory element-binding transcription factor 1. Superscripted letters denote differences at P < 0.05.
Interactions of age and adipose tissue depot.
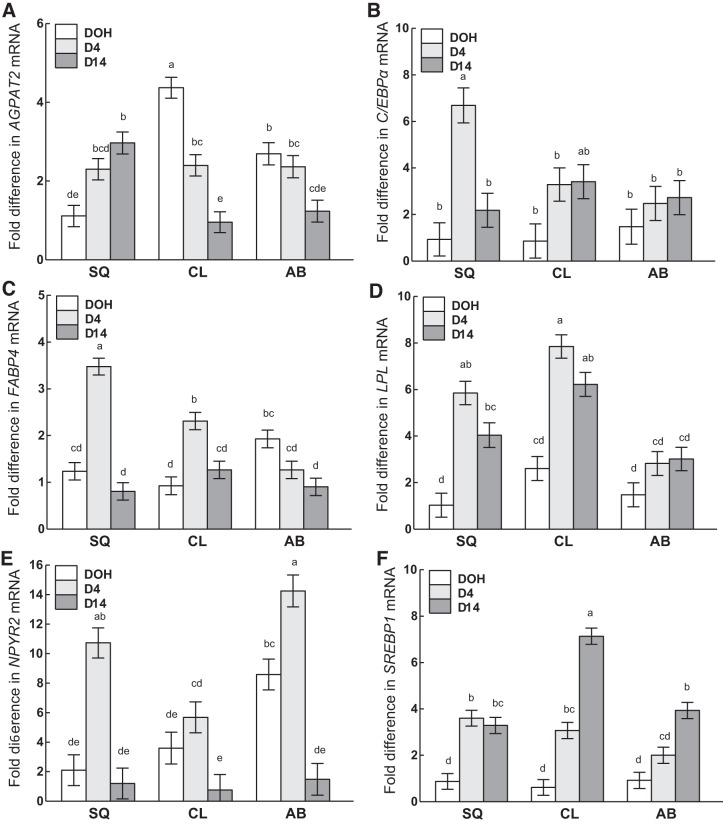
Although the mRNA abundance of 1-acylglycerol-3-phosphate O-acyltransferase 2 (AGPAT2; Fig. 10A) in SQ increased from DOH to D14, that of CCAAT/enhancer-binding protein-α (C/EBPα; Fig. 10B), fatty acid-binding protein 4 (FABP4; Fig. 10C), and neuropeptide Y receptor 2 (NPYR2; Fig. 10E) followed the same pattern from DOH to D14 in SQ, in which expression increased from DOH to D4, then declined back to the same level as DOH on D14. Although the expression of lipoprotein lipase (LPL; Fig. 10D) and sterol regulatory element-binding transcription factor 1 (SREBP1; Fig. 10F) in SQ also increased during this period, their expression was similar between D4 and D14. In the CL depot, expression of AGPAT2 declined from DOH to D4, whereas FABP4, LPL, and SREBP1 increased and C/EBPα and NPYR2 remained similar. From D4 to D14, expression of AGPAT2, FABP4, and NPYR2 decreased in CL, SREBP1 increased, whereas C/EBPα and LPL remained similar. AGPAT2 and FABP4 decreased from DOH to D14 in the AB depot, whereas SREBP1 increased to D14. NPYR2 increased in AB from DOH to D4, then decreased approximately eightfold at D14, to an amount that was even lower than on DOH.
Fig. 10.
Interactions of age and adipose tissue depot on the mRNA abundance of AGPAT2 (A), C/EBPα (B), FABP4 (C), LPL (D), NPYR2 (E), and SREBP1 (F) in subcutaneous (SQ), clavicular (CL), and abdominal (AB) adipose tissue depots on day of hatch (DOH) and days 4 (D4) and 14 (D14) posthatch are shown. Tukey’s test was used to separate the interactions between age and adipose tissue depot. Values are means ± SE. Means bearing a, b, c, d, and e differ (P < 0.05). See main text for description of gene abbreviations.
Interactions of age and line.
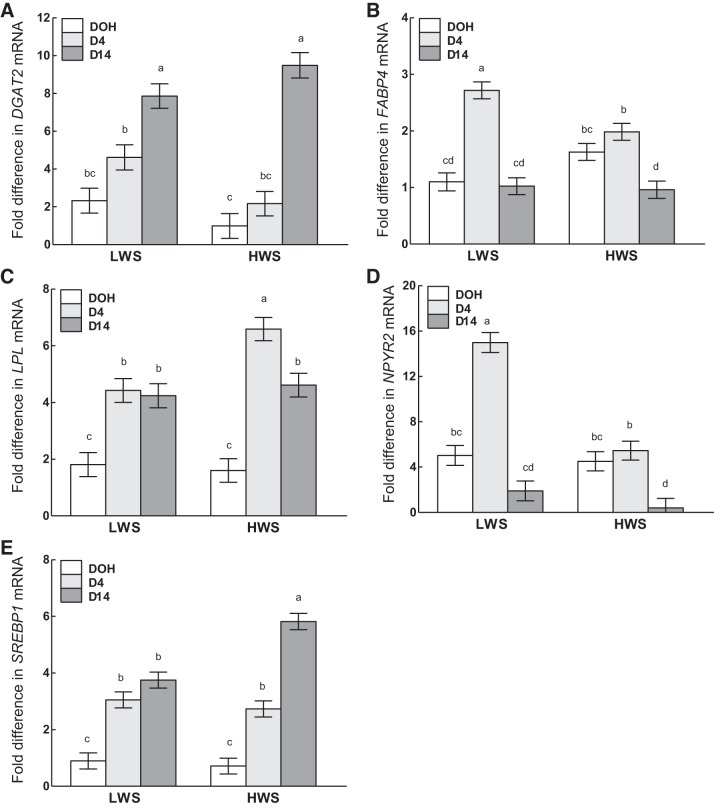
In both lines, diglyceride acyltransferase (DGAT2) was similar at DOH and D4, after which it increased from D4 to D14, with the magnitude of increase from D4 to D14 greater in HWS than LWS (Fig. 11A). Although FABP4, LPL, NPYR2, and SREBP1 all increased from DOH to D4 in LWS, only LPL and SREBP1 followed the same expression pattern in HWS as LWS, whereas FABP4 and NPYR2 were similar at DOH and D4 in HWS (Fig. 11, B–E). From D4 to D14, FABP4 and NPYR2 decreased in both lines, whereas the expression of LPL and SREBP1 was the same in LWS but decreased and increased in the HWS chicks, respectively. The comparison of the mRNA abundance at each time point revealed that more FABP4 and NPYR2 were expressed in LWS than HWS on D4, whereas more LPL and SREBP1 were expressed in HWS than LWS on D4 and D14, respectively. At other time points, the mRNA abundance of these genes was the same between lines.
Fig. 11.
Interactions of age and line on the mRNA abundance of DGAT2 (A), FABP4 (B), LPL (C), NPYR2 (D), and SREBP1 (E) on day of hatch (DOH) and days 4 (D4) and 14 (D14) posthatch in low (LWS) and high (HWS) body weight lines of chicks are shown. Tukey’s test was used to separate the interactions between age and line. Values are means ± SE. Means bearing a, b, c, and d differ (P < 0.05). See main text for description of gene abbreviations.
Interactions of adipose tissue depot and line.
AGPAT2 (Fig. 12A) and SREBP1 (Fig. 12C) mRNAs were expressed similarly among all three depots in LWS. In contrast, in HWS, AGPAT2 was greater in CL than AB, and SREBP1 was greater in CL than SQ and AB. Although the expression of NPYR2 (Fig. 12B) was similar among all depots in HWS, expression was greater in AB than SQ and CL in LWS. The comparison of the mRNA abundance within the same depot between lines revealed that LWS had greater amounts of AGPAT2 and NPYR2 in AB than HWS, whereas HWS had greater expression of SREBP1 in CL than LWS chicks.
Fig. 12.
Interactions of genetic line and adipose tissue depot on the mRNA abundance of AGPAT2 (A), NPYR2 (B), and SREBP1 (C) in subcutaneous (SQ), clavicular (CL), and abdominal (AB) depots of low (LWS) and high (HWS) body weight lines of chicks are shown. Tukey’s test was used to separate the interactions between adipose depot and line. Values are means ± SE. Means bearing a and b differ (P < 0.05).
Interactions of age, adipose tissue depot, and line.
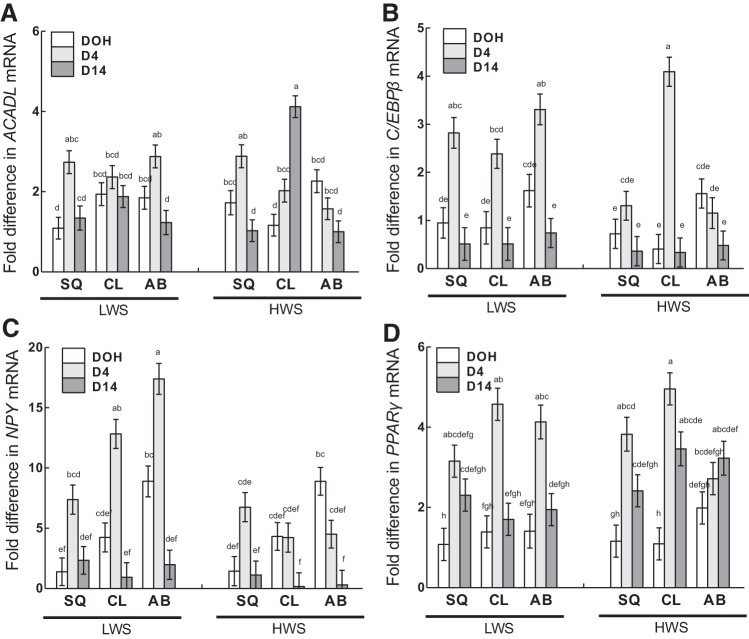
Acyl-CoA dehydrogenase, long chain (ACADL) had greater expression in HWS CL at D14 than in all other line, depot, and age combinations (Fig. 13A). In other depots in both lines, ACADL mRNA was similar or reduced at D14 compared with D4. C/EBPβ mRNA was greatest at D4 in all depots in LWS chicks but only in CL in the HWS (Fig. 13B). In other depots in HWS, C/EBPβ expression was similar among the three ages, whereas, in LWS, expression in all depots was similar between DOH and D14. The mRNA abundance of neuropeptide Y (NPY) was also greater at D4 than other ages within all depots in LWS chicks, with similar expression between DOH and D14 (Fig. 13C). In HWS, NPY expression was similar among ages in SQ and CL and greater at DOH than D14 in AB. Expression of NPY at D4 in both the CL and AB depots was greater in LWS than HWS chicks. Peroxisome proliferator-activated receptor-γ (PPARγ) mRNA was greater at D4 than other ages in the CL and AB of LWS chicks (Fig. 13D). In HWS chicks, expression was greater at D4 than DOH in CL and D4 than DOH in SQ. In LWS chicks, there was a more accentuated difference between D4 and D14 PPARγ expression in CL and AB depots than in HWS chicks.
Fig. 13.
Interactions of age, adipose tissue depot, and genetic line on the mRNA abundance of ACADL (A), C/EBPβ (B), NPY (C), and PPARγ (D) in subcutaneous (SQ), clavicular (CL), and abdominal (AB) depots on day of hatch (DOH) and days 4 (D4) and 14 (D14) posthatch are shown. Tukey’s test was used to separate the 3-way interactions among age, adipose depot, and line. Values are means ± SE. Means bearing a, b, c, d, e, f, g, and h differ (P < 0.05).
Interaction of Age and Genetic Line on Plasma NEFA Concentrations
There was an interaction of age and genetic line (P < 0.0001), in which plasma NEFAs were similar between the lines at DOH but greater in LWS than HWS at D4 and D14 (Fig. 14).
Fig. 14.
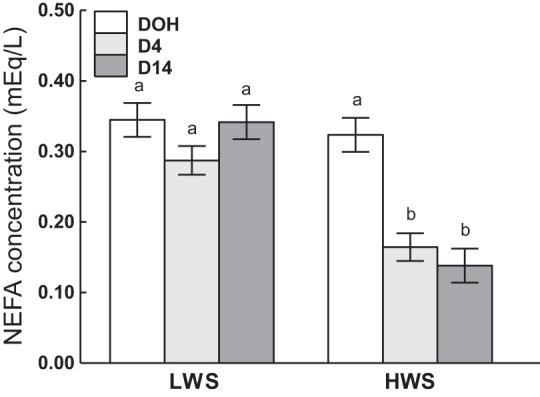
Plasma nonesterified fatty acid (NEFA) concentrations in low (LWS) and high (HWS) body weight-selected line chicks on day of hatch (DOH) and days 4 (D4) and 14 (D14) posthatch are shown. Tukey’s test was used to separate the significant 2-way interaction between age and line. Values are means ± SE. Means bearing a and b differ (P < 0.05).
DISCUSSION
Development from DOH to D4 Posthatch
Yolk, which is predominantly comprised of lipids, is the major energy source during embryonic development of the chick and remains a primary energy source during the first few days posthatch. It accounts for ~20% of the total body weight of chicks at hatch (31), and >50% of yolk absorption occurs during the first 48 h posthatch (6), with the residuals being essentially absorbed within 4 days posthatch (29). Our findings here were consistent with these previous reports. During the first 4 days posthatch, there was a dramatic decline of both absolute and relative YSW regardless of line, indicating a rapid utilization of yolk during this developmental stage. The positive associations between DOH YSW and D4 and D14 BW, fat mass, and lean mass may suggest that higher yolk reserves at hatch provide an important energy source for early posthatch development and thus enhanced growth performance. When analyses were performed within each line, the correlation between YSW and BW was observed in LWS but not HWS chicks, whereas on DOH YSW of HWS chicks had a negative association with D4 fat mass as a percentage of BW. Intrigued by such results, we further analyzed the relationships between D4 YSW and D4 and D14 BW, fat mass, and lean mass, which again showed positive associations regardless of line. Upon within-line analyses, there was a positive correlation between D4 YSW and D4 BW only in LWS chicks. Turro-Vincent et al. (1994) reported that the digestive tract is better developed in the HWS than LWS chicks during the early posthatch stage, and thus the HWS chicks are more efficient in carbohydrate utilization upon feeding, whereas the LWS chicks are more capable of lipid digestion (46). Bhanja et al. (2009) reported that broilers with delayed access to feed posthatch have slower yolk absorption but have higher lipid retention from the yolk (3). In support of such results, our findings indicate that the anorexic LWS and hyperphagic HWS chicks may have different yolk utilization mechanisms. With the presence of feed upon hatch, the HWS chicks may depend less on nutrients from the yolk and rapidly transit to diets rich in carbohydrates to facilitate early development. In contrast, because of the delayed development and loss of appetite, the LWS chicks are more dependent on nutrients provided by yolk residuals.
During the first 4 days posthatch, there was little change in BW, lean mass, or lean mass as a percentage of BW of LWS chicks (data not shown). Although the lean mass as a percentage of BW did not change in HWS chicks, their BW and absolute lean mass increased substantially during this period. These results together with the transition from undetectable to detectable fat mass during the first 4 days posthatch demonstrate that both LWS and HWS accumulated body fat from DOH to D4, with much greater accumulation in HWS to promote the overall increase in BW occurring during that time.
After E12, there is rapid lipid deposition in SQ in chicken embryos, and, at hatch, it is mobilized, providing extra energy to facilitate the hatching process (8). In broilers, from DOH to D4 posthatch, there is a reduction in SQ as a percentage of BW with unchanged SQ weight (49). This is consistent with the observation in LWS during the first 4 days posthatch, whereas neither SQ weight as a proportion of BW nor SQ weight changed in HWS. Also in LWS, the average adipocyte diameter was reduced in all depots from DOH to D4, whereas it remained about the same in HWS. This suggests that the LWS chicks, attributable to their tendency to be hypophagic, may need to utilize more fat reserves and/or replenish the reservoir slower to survive during the early posthatch period.
Indeed, our results show that LWS chicks overall expressed greater amounts of ATGL, FABP4, NPY, and NPYR2 mRNA than HWS and ACADL and C/EBPβ in SQ fat from DOH to D4. In contrast, the HWS had a surge in LPL expression regardless of depots, and, in CL, only HWS chicks increased expression of C/EBPβ in their adipose tissue during the first 4 days posthatch. Both ATGL and hormone-sensitive lipase (HSL) are the major enzymes involved in lipolysis, accounting for >95% of lipolytic activity in murine adipose tissue (39). However, no ortholog of HSL has been identified in the chicken genome (37), suggesting that ATGL may be the primary enzyme responsible for lipolysis in chickens. Because the mobilization of yolk during embryonic development does not require ATGL, its high expression after hatch is thought to exclusively reflect the utilization of fat reserves from adipose tissue (40). FABP4 serves as a marker of mature adipocytes, and in rodents it prohibits lipogenesis through negative feedback on PPAR-γ and enhances lipolysis through activation of HSL (15). It was also observed in chickens that fat males had less FABP4 mRNA in the AB depot than lean ones at 2 wk posthatch, which is also postulated to be related to the enhanced lipolysis induced by greater FABP4 expression although HSL has not been identified in chickens (41). ACADL is an enzyme that catalyzes the first step of the β-oxidation of long-chain fatty acids in the mitochondria (24). Thus expression patterns of ATGL, FABP4, and ACADL reflect greater catabolic activity in the adipose tissue of LWS chicks and more potent fatty acid oxidation in the SQ depot of LWS than HWS chicks. This observation is further confirmed by the plasma NEFA change during the first 4 days, in which the concentrations declined significantly in HWS but not LWS, reflecting reduced lipolytic activity in the HWS adipose tissue. These results here are consistent with a previous report showing that juvenile (56–65 days old) LWS chicks have more metabolic flexibility and fatty acid oxidation efficiency in their adipose tissue than HWS (50).
As a transcription factor, C/EBP-β plays essential roles during adipogenesis, with its functions best understood in mammalian models. It facilitates mitotic clonal expansion during early adipogenesis, which is a prerequisite for its activation of PPAR-γ and C/EBP-α, leading to the terminal transition from a preadipocyte to a mature adipocyte (14, 45). Increased expression of C/EBPβ in the SQ of LWS may indicate that LWS chicks compensated for the mobilization of SQ reservoirs through a potent stimulation of adipogenesis. However, the replenishment of fat reserves may not be sufficient or rapid enough to offset rates of utilization, leading to the overall reduction in SQ% in the LWS chicks. To the contrary, increased C/EBPβ expression in the CL of HWS, together with the upregulation of LPL, which encodes the “gatekeeper” enzyme to facilitate lipid deposition in adipocytes (47), collectively suggests that HWS chicks replenished their CL fat reserves through a combination of hyperplasia and hypertrophy to maintain CL% and size. On the other hand, the smaller adipocytes in LWS chicks reflect reduced lipid deposition capacity compared with the HWS. The reduction in AB adipocyte size exclusively in the LWS may indicate that there is mobilization from the AB depot as well although AB fat is negligible in LWS at hatch and changes very little with age during the first 2 wk posthatch. Interestingly, gene expression changes in AB fat are suggestive of an induction of adipogenesis in LWS chicks, specifically the greater expression of C/EBPβ and PPARγ in LWS than HWS, despite the fact that the depot does not increase in weight with age in LWS chicks.
NPY is a potent orexigenic factor in both mammals (10, 23, 34) and chickens (21). It also promotes adipogenesis in adipocyte progenitor cells in mammals (22) and chickens (42, 51) in vitro, most likely through NPYR2 (22). Both NPY and NPYR2 expression sharply increased in LWS from DOH to D4 regardless of depot, whereas neither changed in the HWS chicks. This suggests that NPY, together with transcription factors, promotes adipogenesis in LWS during the early posthatch period to help replenish and offset the high consumption of fat reserves. However, because of the low lipid deposition capacity, the new adipocytes are relatively small and not as receptive to lipid accumulation as in HWS chicks.
Development from D4 to D14 Posthatch
From D4 to D14, both lines increased in BW, which was attributable to both fat and lean mass deposition. Body fat percentage increased >10% regardless of line, whereas lean percentage did not change, indicating that fat deposition was the predominant factor that promoted BW increase during this developmental phase. However, not one of the three adipose tissue depots that we measured changed in absolute or relative mass, nor was there any change in adipocyte size in the LWS chicks. It should be noted that, although adipose tissue is the primary site for fat deposition, the three major depots measured here together with sartorial and mesenteric depots contribute ~20% to total body fat mass, whereas the rest of the carcass (e.g., other adipose depots, intestine, and muscles) and skeleton contribute ~55%, and the liver, skin and feathers contribute ~20% in the broilers (30). Therefore, the results herein indicate that other fat-rich organs such as the brain, which contains over 60% fat (7, 32), and liver and skeletal muscle, which are essential for ectopic fat deposition (44), may have contributed more to the overall fat mass increase in LWS chicks.
In contrast, mass increased in HWS chicks in all three depots from D4 to D14, although the adipocytes only increased in size in AB but not CL or SQ. In 14-day-old broilers, the adipocyte size difference among depots was CL > SQ > AB (2), whereas adipocytes in HWS at the same age showed no difference among depots. Such differences, together with the observation that the mRNA expression of ACADL decreased in SQ whereas it increased in CL from D4 to D14 in HWS chicks, suggests that HWS chicks mobilized less of their energy reserves in SQ but catabolized more in CL than broilers during this period of development. However, thereafter at 56 days of age, the adipocyte size difference among depots in male HWS birds is CL > AB > SQ because of continuous lipid deposition in CL and AB depots as they approach sexual maturity (50). From D4 to D14, decreased expression of C/EBPβ, PPARγ, and NPY mRNAs was observed in almost all depots of LWS chicks, whereas, except for C/EBPβ in CL, expression remained the same in all other depots of HWS. These results, together with the increased expression of SREBP1, a master regulator of fatty acid synthesis (20), and DGAT2, which catalyzes the terminal step of triacylglycerol synthesis (18), suggest that the general expansion of adipose depots in HWS was likely a result of both hyperplasia and hypertrophy, the same as in broilers from D4 to D14 posthatch (2). Moreover, the increase in CL% but not size and the increase in AB% with enlarged adipocytes suggest that the expansion of the CL depot is mainly through hyperplasia, whereas AB depot expansion occurs predominantly through hypertrophy in HWS chicks.
In LWS chicks, most genes involved in adipogenesis had reduced expression, whereas the maintenance of depot mass and adipocyte size suggest that there was a balance between utilization and replenishment, indicating a slower catabolism of fat reserves with sufficient replenishment of the reservoir from D4 to D14 posthatch. This balance was likely supported by reduced fatty acid oxidation (ACADL) and increased fatty acid synthesis (DGAT2). It is worth noting that throughout the first 2 wk posthatch, although the genes were differentially expressed between lines, most mRNAs measured in our study were expressed similarly between LWS and HWS within the same depot and/or at the same age. This begs the question why under such conditions the overall fat masses and adipocyte sizes are smaller in LWS than HWS. Except for the more potent catabolism, another explanation could be that cellular processes like apoptosis and necrosis somehow halted adipogenesis either at an early stage to prohibit the maturation of adipocytes or at a later stage to limit the deposition of lipids in the adipocytes in LWS chicks.
We conclude from the data that LWS and HWS chicks have dramatic differences in their physiological development during the first 2 wk of life, with the HWS having a much more accentuated BW gain and accumulation of adipose tissue independent of the yolk residuals during this time. From DOH to D4, there is rapid absorption of yolk sac and intense mobilization of fat reserves accompanied by potent hyperplasia and hypertrophy to replenish the reservoirs of energy. LWS chicks are mainly dependent on hyperplasia instead of increasing pre-existing adipocyte size attributable to their lower cellular lipid deposition capacity, whereas HWS balance utilization and replenishment through hyperplasia and hypertrophy to maintain adipocyte size and support increases in depot mass. From D4 to D14, rates of adipose tissue catabolism and adipogenesis decelerate. Whereas LWS have balanced mobilization and lipid replenishment, HWS rapidly accumulate fat in their CL and AB regions.
Perspectives and Significance
Our results indicate that the slower development of LWS, which are predisposed to be anorexic, limited their food intake and/or utilization of exogenous feed for early development and thus resulted in the higher dependence on yolk and intensive catabolism of the body fat reserves, whereas the HWS are capable of utilizing feed for growth and deposit lipid efficiently to promote the expansion of adipose tissue depots. These results provide further insights on the understanding of different physiological mechanisms underlying early depot-specific adipose tissue development in chickens predisposed to be anorexic or obese. These data may also shed light on the mechanism of adipose tissue expansion that underlies a propensity to be lean or obese in humans because of the anatomical similarities between the two species. It should be noted that our study only focused on the major adipose tissue depots in chickens, whereas fat is also a critical component of tissues including brain, liver, and skeletal muscle. Therefore, the depot changes may not necessarily reflect the overall changes in body fat mass. Further study of the fat mass changes in other tissues may compliment and provide better understanding of contributions from each component to the overall body fat mass during early development. Meanwhile, further research at the cellular level could identify differences between these two lines at different cell developmental stages (progenitor vs. adipocyte) and whether apoptosis/necrosis plays an inhibitory role in adipose tissue expansion in LWS.
GRANTS
This project was supported by Agriculture and Food Research Initiative Competitive Grant no. 2015-67015-23359 from the USDA National Institute of Food and Agriculture. This project was also supported by the Virginia Agricultural Experiment Station and the Hatch Program of the National Institute of Food and Agriculture, U.S. Department of Agriculture.
DISCLAIMERS
The funding bodies did not play a role in the design of the study or in the collection, analysis, and interpretation of data or in writing the manuscript.
DISCLOSURES
No conflicts of interest, financial or otherwise, are declared by the authors.
AUTHOR CONTRIBUTIONS
M.A.C., P.B.S., and E.R.G. conceived and designed research; G.W., M.E.G., M.D., M.A.C., Y.X., and E.R.G. performed experiments; Y.X., G.W., M.E.G., S.W., and M.D. analyzed data; Y.X., G.W., M.E.G., S.W., M.D., M.A.C., P.B.S., and E.R.G. interpreted results of experiments; Y.X., M.E.G., and S.W. prepared figures; Y.X. drafted manuscript; Y.X., M.A.C., P.B.S., and E.R.G. edited and revised manuscript; Y.X., G.W., M.E.G., M.A.C., P.B.S., and E.R.G. approved final version of manuscript.
REFERENCES
- 1.Ailhaud G, Hauner H. Development of white adipose tissue. In: Handbook of Obesity, edited by Bray AG, Bouchard C, James WPM. New York: Marcel Dekker, 2003, p. 481–514. [Google Scholar]
- 2.Bai S, Wang G, Zhang W, Zhang S, Rice BB, Cline MA, Gilbert ER. Broiler chicken adipose tissue dynamics during the first two weeks post-hatch. Comp Biochem Physiol A Mol Integr Physiol 189: 115–123, 2015. doi: 10.1016/j.cbpa.2015.08.002. [DOI] [PubMed] [Google Scholar]
- 3.Bhanja SK, Devi CA, Panda AK, Sunder GS. Effect of post hatch feed deprivation on yolk-sac utilization and performance of young broiler chickens. Asian-Australas J Anim Sci 22: 1174–1179, 2009. doi: 10.5713/ajas.2009.80528. [DOI] [Google Scholar]
- 4.Calabotta DF, Cherry JA, Siegel PB, Jones DE. Lipogenesis and lipolysis in fed and fasted chicks from high and low body weight lines. Poult Sci 64: 700–704, 1985. doi: 10.3382/ps.0640700. [DOI] [PubMed] [Google Scholar]
- 5.Cartwright AL. Adipose cellularity in Gallus domesticus: investigations to control body composition in growing chickens. J Nutr 121: 1486–1497, 1991. doi: 10.1093/jn/121.9.1486. [DOI] [PubMed] [Google Scholar]
- 6.Chamblee TN, Brake JD, Schultz CD, Thaxton JP. Yolk sac absorption and initiation of growth in broilers. Poult Sci 71: 1811–1816, 1992. doi: 10.3382/ps.0711811. [DOI] [PubMed] [Google Scholar]
- 7.Chang CY, Ke DS, Chen JY. Essential fatty acids and human brain. Acta Neurol Taiwan 18: 231–241, 2009. [PubMed] [Google Scholar]
- 8.Chen P, Suh Y, Choi YM, Shin S, Lee K. Developmental regulation of adipose tissue growth through hyperplasia and hypertrophy in the embryonic Leghorn and broiler. Poult Sci 93: 1809–1817, 2014. doi: 10.3382/ps.2013-03816. [DOI] [PubMed] [Google Scholar]
- 9.Chusyd DE, Wang D, Huffman DM, Nagy TR. Relationships between rodent white adipose fat pads and human white adipose fat depots. Front Nutr 3: 10, 2016. doi: 10.3389/fnut.2016.00010. [DOI] [PMC free article] [PubMed] [Google Scholar]
- 10.Clark JT, Kalra PS, Crowley WR, Kalra SP. Neuropeptide Y and human pancreatic polypeptide stimulate feeding behavior in rats. Endocrinology 115: 427–429, 1984. doi: 10.1210/endo-115-1-427. [DOI] [PubMed] [Google Scholar]
- 11.Dunnington EA, Honaker CF, McGilliard ML, Siegel PB. Phenotypic responses of chickens to long-term, bidirectional selection for juvenile body weight—historical perspective. Poult Sci 92: 1724–1734, 2013. doi: 10.3382/ps.2013-03069. [DOI] [PubMed] [Google Scholar]
- 12.Dunnington EA, Siegel PB. Long-term divergent selection for eight-week body weight in white Plymouth rock chickens. Poult Sci 75: 1168–1179, 1996. doi: 10.3382/ps.0751168. [DOI] [PubMed] [Google Scholar]
- 13.Gregoire FM, Smas CM, Sul HS. Understanding adipocyte differentiation. Physiol Rev 78: 783–809, 1998. doi: 10.1152/physrev.1998.78.3.783. [DOI] [PubMed] [Google Scholar]
- 14.Guo L, Li X, Tang QQ. Transcriptional regulation of adipocyte differentiation: a central role for CCAAT/enhancer-binding protein (C/EBP) β. J Biol Chem 290: 755–761, 2015. doi: 10.1074/jbc.R114.619957. [DOI] [PMC free article] [PubMed] [Google Scholar]
- 15.Hotamisligil GS, Bernlohr DA. Metabolic functions of FABPs—mechanisms and therapeutic implications. Nat Rev Endocrinol 11: 592–605, 2015. doi: 10.1038/nrendo.2015.122. [DOI] [PMC free article] [PubMed] [Google Scholar]
- 16.Jambui M, Honaker CF, Siegel PB. Selection for juvenile body weight in chickens: standardizing for scaling. Poult Sci 96: 2562–2568, 2017. doi: 10.3382/ps/pex080. [DOI] [PubMed] [Google Scholar]
- 17.Jang H, Kim M, Lee S, Kim J, Woo DC, Kim KW, Song K, Lee I. Adipose tissue hyperplasia with enhanced adipocyte-derived stem cell activity in Tc1(C8orf4)-deleted mice. Sci Rep 6: 35884, 2016. doi: 10.1038/srep35884. [DOI] [PMC free article] [PubMed] [Google Scholar]
- 18.Ji B, Ernest B, Gooding JR, Das S, Saxton AM, Simon J, Dupont J, Métayer-Coustard S, Campagna SR, Voy BH. Transcriptomic and metabolomic profiling of chicken adipose tissue in response to insulin neutralization and fasting. BMC Genomics 13: 441, 2012. doi: 10.1186/1471-2164-13-441. [DOI] [PMC free article] [PubMed] [Google Scholar]
- 19.Jo J, Gavrilova O, Pack S, Jou W, Mullen S, Sumner AE, Cushman SW, Periwal V. Hypertrophy and/or hyperplasia: dynamics of adipose tissue growth. PLOS Comput Biol 5: e1000324, 2009. doi: 10.1371/journal.pcbi.1000324. [DOI] [PMC free article] [PubMed] [Google Scholar]
- 20.Khesht FA, Hassanabadi A. Effects of sterol regulatory element-binding protein (SREBP) in chickens. Lipids Health Dis 11: 20, 2012. doi: 10.1186/1476-511X-11-20. [DOI] [PMC free article] [PubMed] [Google Scholar]
- 21.Kuenzel WJ, Douglass LW, Davison BA. Robust feeding following central administration of neuropeptide Y or peptide YY in chicks, Gallus domesticus. Peptides 8: 823–828, 1987. doi: 10.1016/0196-9781(87)90066-0. [DOI] [PubMed] [Google Scholar]
- 22.Kuo LE, Kitlinska JB, Tilan JU, Li L, Baker SB, Johnson MD, Lee EW, Burnett MS, Fricke ST, Kvetnansky R, Herzog H, Zukowska Z. Neuropeptide Y acts directly in the periphery on fat tissue and mediates stress-induced obesity and metabolic syndrome. Nat Med 13: 803–811, 2007. doi: 10.1038/nm1611. [DOI] [PubMed] [Google Scholar]
- 23.Levine AS, Morley JE. Neuropeptide Y: a potent inducer of consummatory behavior in rats. Peptides 5: 1025–1029, 1984. doi: 10.1016/0196-9781(84)90165-7. [DOI] [PubMed] [Google Scholar]
- 24.Li P, Liu Y, Zhang Y, Long M, Guo Y, Wang Z, Li X, Zhang C, Li X, He J, Liu G. Effect of non-esterified fatty acids on fatty acid metabolism-related genes in calf hepatocytes cultured in vitro. Cell Physiol Biochem 32: 1509–1516, 2013. doi: 10.1159/000356588. [DOI] [PubMed] [Google Scholar]
- 25.Lillie M, Sheng ZY, Honaker CF, Andersson L, Siegel PB, Carlborg Ö. Genomic signatures of 60 years of bidirectional selection for 8-week body weight in chickens. Poult Sci 97: 781–790, 2018. doi: 10.3382/ps/pex383. [DOI] [PubMed] [Google Scholar]
- 26.Liu L, Wang G, Xiao Y, Shipp SL, Siegel PB, Cline MA, Gilbert ER. Peripheral neuropeptide Y differentially influences adipogenesis and lipolysis in chicks from lines selected for low or high body weight. Comp Biochem Physiol A Mol Integr Physiol 213: 1–10, 2017. doi: 10.1016/j.cbpa.2017.08.001. [DOI] [PubMed] [Google Scholar]
- 28.Márquez GC, Siegel PB, Lewis RM. Genetic diversity and population structure in lines of chickens divergently selected for high and low 8-week body weight. Poult Sci 89: 2580–2588, 2010. doi: 10.3382/ps.2010-01034. [DOI] [PubMed] [Google Scholar]
- 29.Moran ET., Jr Nutrition of the developing embryo and hatchling. Poult Sci 86: 1043–1049, 2007. doi: 10.1093/ps/86.5.1043. [DOI] [PubMed] [Google Scholar]
- 30.Nir I, Nitsan Z, Keren-Zvi S. Fat deposition in birds. In: Leanness in Domestic Birds, edited by Leclercq B, Whitehead CC. London, UK: Butterworth, 1988, p. 141–174. [Google Scholar]
- 31.Noy Y, Sklan D. Energy utilization in newly hatched chicks. Poult Sci 78: 1750–1756, 1999. doi: 10.1093/ps/78.12.1750. [DOI] [PubMed] [Google Scholar]
- 32.O’Brien JS, Sampson EL. Lipid composition of the normal human brain: gray matter, white matter, and myelin. J Lipid Res 6: 537–544, 1965. [PubMed] [Google Scholar]
- 33.Park A, Kim WK, Bae KH. Distinction of white, beige and brown adipocytes derived from mesenchymal stem cells. World J Stem Cells 6: 33–42, 2014. doi: 10.4252/wjsc.v6.i1.33. [DOI] [PMC free article] [PubMed] [Google Scholar]
- 34.Pau MY, Pau KY, Spies HG. Characterization of central actions of neuropeptide Y on food and water intake in rabbits. Physiol Behav 44: 797–802, 1988. doi: 10.1016/0031-9384(88)90065-0. [DOI] [PubMed] [Google Scholar]
- 35.Robey WW, Cherry JA, Siegel PB, Van Krey HP. Hyperplastic response of adipose tissue to caloric overconsumption in sexually mature chickens. Poult Sci 67: 800–808, 1988. doi: 10.3382/ps.0670800. [DOI] [PubMed] [Google Scholar]
- 36.Saarela S, Hissa R, Pyörnilä A, Harjula R, Ojanen M, Orell M. Do birds possess brown adipose tissue? Comp Biochem Physiol A Mol Integr Physiol 92: 219–228, 1989. doi: 10.1016/0300-9629(89)90157-6. [DOI] [Google Scholar]
- 37.Sato K, Seol HS, Kamada T. Tissue distribution of lipase genes related to triglyceride metabolism in laying hens (Gallus gallus). Comp Biochem Physiol B Biochem Mol Biol 155: 62–66, 2010. doi: 10.1016/j.cbpb.2009.10.001. [DOI] [PubMed] [Google Scholar]
- 38.Schmittgen TD, Livak KJ. Analyzing real-time PCR data by the comparative CT method. Nat Protoc 3: 1101–1108, 2008. doi: 10.1038/nprot.2008.73. [DOI] [PubMed] [Google Scholar]
- 39.Schweiger M, Schreiber R, Haemmerle G, Lass A, Fledelius C, Jacobsen P, Tornqvist H, Zechner R, Zimmermann R. Adipose triglyceride lipase and hormone-sensitive lipase are the major enzymes in adipose tissue triacylglycerol catabolism. J Biol Chem 281: 40236–40241, 2006. doi: 10.1074/jbc.M608048200. [DOI] [PubMed] [Google Scholar]
- 40.Serr J, Suh Y, Lee K. Regulation of adipose triglyceride lipase by fasting and refeeding in avian species. Poult Sci 88: 2585–2591, 2009. doi: 10.3382/ps.2009-00265. [DOI] [PubMed] [Google Scholar]
- 41.Shi H, Wang Q, Zhang Q, Leng L, Li H. Tissue expression characterization of chicken adipocyte fatty acid-binding protein and its expression difference between fat and lean birds in abdominal fat tissue. Poult Sci 89: 197–202, 2010. doi: 10.3382/ps.2009-00397. [DOI] [PubMed] [Google Scholar]
- 42.Shipp SL, Cline MA, Gilbert ER. Promotion of adipogenesis by neuropeptide Y during the later stages of chicken preadipocyte differentiation. Physiol Rep 4: e13006, 2016. doi: 10.14814/phy2.13006. [DOI] [PMC free article] [PubMed] [Google Scholar]
- 43.Siegel PB. Selection for body weight at eight weeks of age: 1. Short term response and heritabilities. Poult Sci 41: 954–962, 1962. doi: 10.3382/ps.0410954. [DOI] [Google Scholar]
- 44.Stefan N, Kantartzis K, Machann J, Schick F, Thamer C, Rittig K, Balletshofer B, Machicao F, Fritsche A, Häring HU. Identification and characterization of metabolically benign obesity in humans. Arch Intern Med 168: 1609–1616, 2008. doi: 10.1001/archinte.168.15.1609. [DOI] [PubMed] [Google Scholar]
- 45.Tang QQ, Otto TC, Lane MD. Mitotic clonal expansion: a synchronous process required for adipogenesis. Proc Natl Acad Sci USA 100: 44–49, 2003. doi: 10.1073/pnas.0137044100. [DOI] [PMC free article] [PubMed] [Google Scholar]
- 46.Turro-Vincent I, Nitsan Z, Picard M, Dunnington EA, Siegel PB. Removal of residual yolk at hatch influences food choice and feeding activity in lines of chickens selected for high or low juvenile body weight. Reprod Nutr Dev 34: 449–460, 1994. doi: 10.1051/rnd:19940506. [DOI] [PubMed] [Google Scholar]
- 47.Zechner R, Strauss J, Frank S, Wagner E, Hofmann W, Kratky D, Hiden M, Levak-Frank S. The role of lipoprotein lipase in adipose tissue development and metabolism. Int J Obes Relat Metab Disord 24, Suppl 4: S53–S56, 2000. doi: 10.1038/sj.ijo.0801506. [DOI] [PubMed] [Google Scholar]
- 48.Zelenka DJ, Dunnington EA, Cherry JA, Siegel PB. Anorexia and sexual maturity in female white rock chickens. I. Increasing the feed intake. Behav Genet 18: 383–387, 1988. doi: 10.1007/BF01260938. [DOI] [PubMed] [Google Scholar]
- 49.Zhang J, Suh Y, Choi YM, Chen PR, Davis ME, Lee K. Differential expression of cell cycle regulators during hyperplastic and hypertrophic growth of broiler subcutaneous adipose tissue. Lipids 50: 965–976, 2015. doi: 10.1007/s11745-015-4032-x. [DOI] [PubMed] [Google Scholar]
- 50.Zhang S, McMillan RP, Hulver MW, Siegel PB, Sumners LH, Zhang W, Cline MA, Gilbert ER. Chickens from lines selected for high and low body weight show differences in fatty acid oxidation efficiency and metabolic flexibility in skeletal muscle and white adipose tissue. Int J Obes 38: 1374–1382, 2014. doi: 10.1038/ijo.2014.8. [DOI] [PubMed] [Google Scholar]
- 51.Zhang W, Bai S, Liu D, Cline MA, Gilbert ER. Neuropeptide Y promotes adipogenesis in chicken adipose cells in vitro. Comp Biochem Physiol A Mol Integr Physiol 181: 62–70, 2015. doi: 10.1016/j.cbpa.2014.11.012. [DOI] [PubMed] [Google Scholar]


