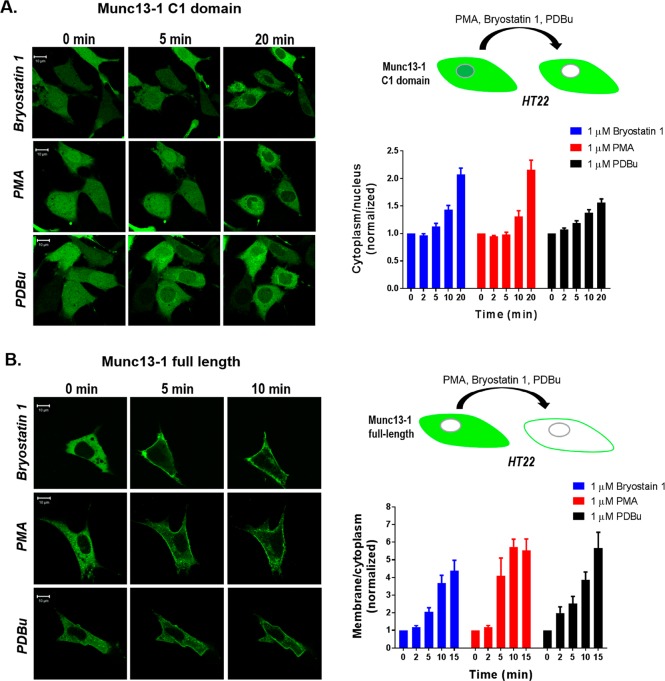
Figure 7.
Translocation in response to PMA, bryostatin 1, and PDBu of (A) the GFP-tagged Munc13-1 C1 domain and (B) the full-length Munc13-1 protein in living HT22 cells. Cells expressing the GFP-tagged Munc13-1 C1 domain and the full-length Munc13-1 were treated with 1 μM bryostatin 1, PMA, and PDBu. The living cells were imaged by confocal microscopy as a function of time after addition of bryostatin 1, PMA, and PDBu. The images are representative of three independent experiments, and the ratios of the intensities for the cytoplasm to the nucleus (Munc13-1 C1 domain, 11–16 cells/treatment, A) or the membrane to the cytoplasm (Munc13-1 full-length, 5–9 cells/treatment, B) were calculated and normalized to the time zero values. An increase in the cytoplasm/nucleus or membrane/cytoplasm ratio indicates translocation. Values represent the mean of the three independent experiments. Bars indicate the SEM.

