

Abstract
The neocortex is comprised of six neuronal layers that are generated in a defined temporal sequence. While extrinsic and intrinsic cues are known to regulate the sequential production of neocortical neurons, how these factors interact and function in a coordinated manner is poorly understood. The proneural gene Neurog2 is expressed in progenitors throughout corticogenesis, but is only required to specify early-born, deep-layer neuronal identities. Here, we examined how neuronal differentiation in general and Neurog2 function in particular are temporally controlled during murine neocortical development. We found that Neurog2 proneural activity declines in late corticogenesis, correlating with its phosphorylation by GSK3 kinase. Accordingly, GSK3 activity, which is negatively regulated by canonical Wnt signaling, increases over developmental time, while Wnt signaling correspondingly decreases. When ectopically activated, GSK3 inhibits Neurog2-mediated transcription in cultured cells and Neurog2 proneural activities in vivo. Conversely, a reduction in GSK3 activity promotes the precocious differentiation of later stage cortical progenitors without influencing laminar fate specification. Mechanistically, we show that GSK3 suppresses Neurog2 activity by influencing its choice of dimerization partner, promoting heterodimeric interactions with E47 (Tcfe2a), as opposed to Neurog2–Neurog2 homodimer formation, which occurs when GSK3 activity levels are low. At the functional level, Neurog2–E47 heterodimers have a reduced ability to transactivate neuronal differentiation genes compared with Neurog2–Neurog2 homodimers, both in vitro and in vivo. We thus conclude that the temporal regulation of Neurog2–E47 heterodimerization by GSK3 is a central component of the neuronal differentiation “clock” that coordinates the timing and tempo of neocortical neurogenesis in mouse.
Introduction
Temporal cues play a fundamental role in generating cellular diversity in the neocortex, with distinct neuronal populations generated at different developmental times (Pearson and Doe, 2004; Dehay and Kennedy, 2007). In mouse, neocortical pyramidal neurons are derived from cortical progenitor cells in the dorsal telencephalon between embryonic day 10.5 (E10.5) and E17 (Caviness, 1982; Caviness et al., 1995; Takahashi et al., 1999). In the first wave of neurogenesis, preplate neurons differentiate (prospective layer I and subplate neurons), followed by the sequential production of pyramidal neurons that form the cortical plate, beginning with deep layer VI and ending with upper layers II/III (Smart and Smart, 1977; Supèr et al., 1998). To sequentially generate these neurons, cortical progenitors undergo temporal changes in their identities, which are controlled by both intrinsic (Shen et al., 2006; Gaspard et al., 2008) and extrinsic mechanisms (McConnell and Kaznowski, 1991; Fukumitsu et al., 2006). These temporal identity transitions are reflected by alterations in progenitor cell morphologies and developmental potential. Specifically, cortical progenitors begin as neuroepithelial cells that line the ventricular zone (VZ), undergoing symmetric proliferative divisions that expand the progenitor pool (Kriegstein and Noctor, 2004). With the onset of neurogenesis at E10.5, neuroepithelial cells give rise to radial glial cells (RGCs), which undergo asymmetric neurogenic divisions to form the earliest-born cortical neurons (Götz and Huttner, 2005). Beginning at ∼E11.5, a subset of RGCs then generate intermediate neuronal progenitors (INPs), which lose their apical contacts and migrate outward to form a more basally located subventricular zone (SVZ) (Haubensak et al., 2004; Miyata et al., 2004; Noctor et al., 2004). INPs have a more limited proliferative potential, undergoing symmetric neurogenic divisions after one to three cell divisions (Noctor et al., 2004; Götz and Huttner, 2005; Farkas et al., 2008).
Neurogenin 2 (Neurog2) encodes a class II basic helix-loop-helix (bHLH) transcription factor that is expressed in cortical progenitor cells throughout the neurogenic period (Fode et al., 2000; Schuurmans et al., 2004). Despite its continual expression, loss-of-function studies have demonstrated that Neurog2 is only required to specify the identities of early-born, deep-layer neurons (Fode et al., 2000; Schuurmans et al., 2004). We speculated that temporally regulated posttranslational modifications may modify Neurog2 proneural activity at different developmental times. We focused on phosphorylation, which regulates the activities of several bHLH proteins, including Neurog2 (Marcus et al., 1998; Moore et al., 2002; Ohkawara et al., 2004; Hand et al., 2005; Ge et al., 2006; Ma et al., 2008; Ali et al., 2011). Here, we show that the ability of Neurog2 to induce rapid neurogenesis is dramatically reduced in mid-corticogenesis. We attribute the temporal decline in Neurog2 proneural activity to its phosphorylation by GSK3 (Ma et al., 2008), which increases at later developmental stages as canonical Wnt signaling declines. Mechanistically, GSK3 interferes with Neurog2 transcriptional and proneural activity, slowing down the tempo of neurogenesis, without affecting laminar fate specification. GSK3 interference occurs at least in part by promoting Neurog2–E12/E47 heterodimerization as opposed to Neurog2–Neurog2 homodimerization, revealing that the choice of dimerization partner is a critical determinant of proneural bHLH function.
Materials and Methods
Animal breeding and maintenance.
All animal procedures were compliant with the Guidelines of the Canadian Council of Animal Care and were approved by the University of Calgary Animal Care Committee under animal protocol M08003. CD1 (outbred) mice were intercrossed to generate timed pregnancies for in utero electroporation experiments. Embryos were staged by taking the date of the vaginal plug as E0.5. Embryos of either sex were used throughout the study.
Generation of expression and reporter constructs.
For electroporation, cDNA were cloned into pCIG2, a bicistronic expression vector that includes an internal ribosome entry site (IRES)-GFP cassette as described previously (Mattar et al., 2008). Human GSK3β (96% identical with mouse) containing a constitutively activating S9A mutation (Stambolic and Woodgett, 1994) and a kinase-dead, dominant-negative rat GSK3β (100% identical with mouse) were previously described (Dominguez et al., 1995). To generate Neurog2∼Neurog2 and Neurog2∼E47 tethered constructs, the following oligos were annealed, leaving PstI ends that were used to generate Neurog2∼Neurog2 or Neurog2∼E47: 5′-GGGGGTTCCGGCGGGGGTTCTGGAGGTGGGAGCGGCGGAGGGTCCGGCGGAGGAACTGCA-3′; 5′-GTTCCTCCGCCGGACCCTCCGCCGCTCCCACCTCCAGAACCCCCGCCGGAACCCCCTGCA-3′. E47 cDNA was PCR amplified from pCDNA3-E47 (Perez-Moreno et al., 2001) with the primers 5′-GCTCGAGATGATGATGAACCAGTCT-3′ (forward) and 5′-ATAGAATTCTCACAGGTGCCCG-3′ (reverse) and subcloned via XhoI and EcoRI into pCIG2. To generate Neurog2 truncation alleles, truncated fragments with EcoRI ends were generated by PCR. Primers used to amplify N-terminal truncations introduced a translational start codon in-frame with the truncated Neurog2 CDS. Primers for C-terminal truncations introduced a translational stop codon in-frame with the truncated Neurog2 CDS. Amplified fragments were digested with EcoRI and cloned into pBluescriptII SK+ (Clontech). To generate pGex2T-Neurog2, the Neurog2 open reading frame was excised from pCIG2-Neurog2 using EcoR1, and ligated into the EcoR1 site of pGex2T (GE Healthcare).
Cell culture and luciferase/renilla assays.
Postnatal day 19 (P19) embryonic carcinoma cells (ATCC CRL-1825) were maintained in Minimum Essential Medium α Medium supplemented with 10% fetal bovine serum and 10 U/ml penicillin. DNA for transfection was prepared using a QIAGEN Plasmid Plus Maxi Kit as described by the manufacturer. The pNeuroD1kb (Huang et al., 2000), Rnd2 (Heng et al., 2008), and Dll1 (Castro et al., 2006) luciferase reporters were previously described. Transfections were performed using 0.1 μg of each plasmid and 0.15 μg of the Renilla plasmid (transfection control) and Lipofectamine Plus reagent (Invitrogen) according to the manufacturer's protocol. Luciferase and Renilla activity were measured using the Dual-Luciferase Reporter Assay System Kit (Promega) according to manufacturer's instructions, using a TD 20/20 Luminometer (Turner Designs) to detect the light reaction.
In utero electroporation.
Endotoxin-free plasmid DNA for electroporation was generated using a column-based purification system (QIAGEN). In utero electroporation was performed as previously described (Dixit et al., 2011). Briefly, DNA (3 μg/μl) mixed with Fast Green FCF dye (1:200) was injected into the telencephalic (i.e., lateral) ventricles at defined embryonic stages using pulled borosilicate needles and a Femtojet microinjector. Next, seven pulses of 42–55 mV were applied within a 1 s interval to the uterus surrounding the head of the embryo using a BTX electroporator. The uterus was replaced in the body cavity, the peritoneum was sutured, and skin was stapled, and embryos were allowed to develop until the designated stage of analysis.
Tissue processing and RNA in situ hybridization.
Whole brains were dissected in cold PBS and then fixed for 24 h at 4°C in 4% paraformaldehyde/1× PBS. Tissues were washed in 1× PBS and then cryoprotected overnight (O/N) at 4°C in 20% sucrose/1× PBS. For electroporated brains, fixation and cryoprotection were performed in the dark to avoid GFP degradation. Tissues were then embedded in OCT (Tissue-Tek) and stored at −80°C. The 10 μm coronal sections were collected on Superfrost/Plus slides (Thermo Fisher Scientific) using a Leica cryostat. RNA in situ hybridization using digoxygenin-labeled probes was performed as described previously (Alam et al., 2005). Templates used to generate probes have been described previously: Neurog2 (Gradwohl et al., 1996), GSK3α (IMAGE: 6336089), GSK3β (IMAGE: 4022374), GFP (Mattar et al., 2008), Bhlhe22 (Xu et al., 2002), Robo1 (Anselmo et al., 2003), Fezf2 (Hirata et al., 2004), Etv1 (Arber et al., 2000), RORβ (Schaeren-Wiemers et al., 1997), Slc17a6 (Fremeau et al., 2001), Neurod1 (Lee et al., 1995), and Tbr1 (Hevner et al., 2001).
Immunohistochemistry.
Sections were blocked for 1 h in 10% horse serum/1× PBS with 0.1% Triton X-100 (PBST) at room temperature (RT). Briefly, primary antibodies were diluted in blocking solution and applied to sections overnight at 4°C. Sections were then washed three times in PBST, and then secondary antibodies were appropriately diluted in blocking solution and applied to the sections for 1 h at RT in the dark. Sections were washed three times in PBST, incubated 5 min with DAPI (4′,6-diamidino-2-phenylindole) (Sigma-Aldrich) diluted 1/10,000 in PBS, washed three times in PBS, and mounted using Aqua Polymount (Polysciences). Primary antibodies included mouse anti-Neurog2 (1:4) (Lo et al., 2002), rabbit anti-Tbr1 (1:800; Millipore Bioscience Research Reagents), goat anti-Bhlhb5 (1:300; Santa Cruz Biotechnology), mouse anti-NeuN (1:500; Millipore Bioscience Research Reagents), rabbit anti-Pax6 (1:350; Cedarlane), rabbit anti-Tbr2 (1:500; Abcam), mouse anti-Tuj1 (neuronal III β-tubulin; 1:500; Covance), rabbit anti-phospho-Akt Ser-473 (1:500; Cell Signaling Technology), rabbit anti-pGSK3α/β-S21/S9 (1:100; New England Biolabs), rabbit anti-GFP (1:500; Millipore Bioscience Research Reagents), rabbit anti-Cux1/2 (Cutl1; 1/500; Abcam), and rabbit anti-Ctip2 (1/500; Abcam). Secondary antibodies were conjugated to Cy3, Alexa 350, or Alexa 488 (Invitrogen).
Chromatin immunoprecipitation.
Chromatin immunoprecipitation experiments were performed as previously described with some modifications (Demers et al., 2007). Cells from transfected NIH-3T3 cells were dissociated in 0.05% trypsin–EDTA (Invitrogen; 25300-054) for 10 min at 37°C. The cells were crosslinked at room temperature for 10 min with 1% (w/w, final) formaldehyde. Sonication was performed with a Bioruptor (Diagenode) at high power for 30 cycles (30 s on/30 s off). Immunoprecipitations with rabbit anti-Neurog2 (Abcam) were performed with 500 μg of chromatin per assay. qPCR was performed with a Bio-Rad DNA Engine Opticon 2 real-time PCR detection systems and a QuantiFast SYBR Green Kit for quantification (QIAGEN).
Protein half-life assays and in vitro kinase assays.
Protein half-life assays were performed in rabbit reticulocyte lysates as previously described (Nguyen, 2006). For kinase assays, 100–200 μg of protein was diluted to 500 μl in immunoprecipitation (IP) buffer (0.020 m sodium phosphate, 0.1% SDS, 0.5% NP-40, 0.15 m NaCl, 0.06% sodium azide with 1 mm PMSF, 5 mm NaF, 1 mm NaOV3, and 1× Complete protease inhibitor mixture (Roche Diagnostics). The lysates were precleared in 20 μl of protein A/G-PLUS agarose beads (Calbiochem), for 1 h at 4°C with rocking. To each precleared lysate, 4 ml of anti-GSK3β antibody was added and incubated with rocking for 1 h at 4°C before adding 20 μl of protein A/G-PLUS agarose beads and incubating at 4°C with rocking overnight. Beads were then washed three times in IP buffer. For GSK3 kinase assays, beads were further washed two times in Kinase Assay Buffer (0.1 m HEPES, pH 7.4, 1 mm EDTA, 1 mm EGTA, 1 mm DTT, 1 mm PMSF, 5 mm NaF, 1 mm NaOV3, and 1× Complete protease inhibitor mixture). Beads were then incubated with 5 μl of myelin basic protein (MBP) (2 mg/ml stock) and 5 ml of [γ-32P]ATP for 30 min at 30°C. Alternatively, recombinant GSK3β (Active; SignalChem) was used. The GST fusion proteins were generated and purified from Escherichia coli as described by Gradwohl et al. (1996). The samples were then diluted in 4× SDS-PAGE loading buffer and run on 15% SDS-PAGE gels. The gels were equilibrated in 25% ethanol/3% glycerol and dried before exposing to x-ray film for autoradiography.
Coimmunoprecipitation and Western blotting.
Cultured cells or dissected tissues were lysed on ice in NP-40 lysis buffer [0.05 m Tris, pH 7.5, 0.15 m NaCl, 1% NP-40, 0.001 m EDTA, 50 mm NaF, 0.2 mm Na3VO4, 2 mm PMSF, 0.05 mm N-benzyloxycarbonyl-leucyl-leucyl-leucinal (MG132), 1× Complete tablet], incubated for 30 min on ice, and clarified by centrifuging at 20,000 for 15 min. One hundred micrograms of protein lysates from transfected HEK293 cells were adjusted to 500 μl using IP100 buffer [25 mm Tris, pH 8, 5 mm MgCl2, 10% glycerol, 0.1 m KCl, 0.01% NP-40, 3 mm DTT, 50 mm NaF, 0.2 mm Na3VO4, 2 mm PMSF, 0.05 mm MG132, 1× Complete protease inhibitor tablet (Roche)]. Protein lysates were mixed with 20 μl of anti-FLAG agarose beads (Sigma-Aldrich), and mixed at 4°C O/N. Beads were washed four times with 500 μl of IP100 buffer for 15 min. The beads were then pelleted and resuspended in 20 μl of diluted SDS-PAGE sample buffer, heated in 100°C for 5 min, and subjected to SDS-PAGE and Western blotting. For Western blotting, proteins were transferred to PVDF membrane in transfer buffer (25 mm Tris, 192 mm glycine, 20% methanol, pH 8.3) at 75 V for 1 h on ice. PVDF membranes are blocked 1 h at RT on a rocker, using TBST (25 mm Tris, 3 mm KCl, 140 mm NaCl, pH 7.4, 0.1% Tween 20) containing 50 mg/ml dried milk powder. Next, the membrane was incubated in primary antibodies diluted in the blocking solution for 1 h at room temperature, or overnight at 4°C. After six 5 min washes in TBST, the membranes were exposed to species-specific HRP-coupled secondary antibody diluted 1/50,000 for 1 h at RT. Membranes were washed six times for 5 min each time and developed using ECL Plus Western Blotting Reagent Pack (GE Healthcare) and x-ray film. Antibodies used in Western blots included the following: rabbit α-pNeurog2 (S231, S234) (Ma et al., 2008), mouse anti-GSK3β (1 μg/IP of 100 μg; 1/1000 for Western; BD Biosciences Transduction Laboratories), rat anti-HA (1/500; Roche Diagnostics), mouse anti-FLAG (M2) (1 μg/IP of 100 μg; 1/1000 for Western; Sigma-Aldrich), rabbit anti-Tcfe2a (E12/E47) (1/500; Santa Cruz Biotechnology), rabbit anti-Neurog2 (1/1000; Millipore Bioscience Research Reagents), and rabbit anti-β-actin (1/10,000; Abcam).
Preparation of nuclear extracts and gel filtration chromatography.
Nuclear extracts were prepared from dorsal telencephalons dissected from ∼90 E12.5 and ∼40 E14.5 mouse embryos. Seven milliliters of lysis buffer (10 mm HEPES, pH 7.9, 1.5 mm MgCl2, 10 mm KCl, 1 mm DTT, 0.5% NP-40, 50 mm NaF, 0.2 mm Na3VO4, 2 mm PMSF, 0.05 mm MG132, 1× Complete protease inhibitor tablet) was added to mouse brains, which were then dounced 12 times with a 15 glass Wheaton homogenizer. Lysates were centrifuged at 1500 rpm for 5 min to pellet nuclei. The supernatant, which contains cytoplasmic protein, was removed, and 20 μl of protease inhibitors (2 mm PMSF, 0.05 mm MG132, 1× Complete tablet) was added to nuclei, which were then dounced 12 times with a 15 glass Wheaton homogenizer. Lysates were centrifuged at 1500 rpm in 20 mm KCl, 0.2 mm EDTA, 1 mm DTT, 25% glycerol, 50 mm NaF, 0.2 mm Na3VO4, 2 mm PMSF, and 1× Complete tablet by gentle mixing. The extraction was pelleted again at 3000 rpm for 5 min. The pellet was resuspended in 2 ml of low salt buffer, and then 2 ml of high salt buffer was added (20 mm HEPES, pH 7.9, 1.5 mm MgCl2, 1 m KCl, 0.2 mm EDTA, 1 mm DTT, 25% glycerol, 50 mm NaF, 0.2 mm Na3VO4, 2 mm PMSF, 0.05 mm MG132, 1× Complete tablet). The extract was mixed at 4°C for 3 h to O/N and then spun at 14,500 rpm for 30 min in the Beckman ultracentrifuge (JA20 rotor). The supernatant was dialyzed overnight and concentrated using Millipore concentration columns. Separation of proteins by gel filtration was performed on a Superdex 200 HR 10/300 column (manufacturer exclusion limit, 600 kDa) interfaced with AKTA FPLC (GE Healthcare). The column was equilibrated and run with high salt buffer (see above) at 4°C. A volume of 500 μl of the sample was injected on the column and run at a flow rate of 0.25 ml/min, with detection at 280 nm. The 500 μl fractions were collected and concentrated before analysis by Western blot.
Quantitative and statistical analysis.
For the analysis of luciferase assays, luciferase data were normalized by dividing raw light readings by the corresponding Renilla values. Reported n values correspond to the number of individual experiments performed, each composed of three replicates per sample. For in vivo experiments, brains from at least three independent experiments, and at least three sections for each brain, were processed (n values refer to number of brains analyzed). Comparisons between control and experimental conditions were performed using a two-tailed Student's t test (to compare two values), while comparisons between multiple samples were performed by applying a one-way ANOVA (ANOVA-1) and Tukey's multiple-comparison test using GraphPad Prism software (GraphPad Software). Statistical variation was determined using the SEM.
Results
Neurog2 proneural activity is higher in early-versus later-stage cortical progenitors
Neurog2 is expressed in cortical progenitors throughout the neurogenic period (Gradwohl et al., 1996; Britz et al., 2006), extending from E10.5 to E17, but is only required to specify the identities of early-born (<E14.5) and not late-born (>E14.5) neocortical neurons (Fode et al., 2000; Schuurmans et al., 2004; Britz et al., 2006). These data suggest that Neurog2 may be temporally regulated, altering its functions in different cellular contexts at discrete developmental times. To test this model, we asked whether cortical progenitors at different developmental stages had an altered ability to respond to Neurog2 proneural activity. We used in utero electroporation to misexpress Neurog2 in E12.5, E13.5, and E14.5 cortical progenitors, using a pCIG2 expression vector with an IRES2-EGFP cassette so that the zonal distribution and neuronal differentiation of GFP+ transfected cells could be monitored.
Compared with E12.5→E13.5 control electroporations of pCIG2 (Fig. 1A–B″,M), when Neurog2 was misexpressed, more GFP+ cells left the VZ and migrated into the SVZ (VZ, p < 0.001; SVZ, p < 0.01; Fig. 1C–D″,M), consistent with previous reports (Miyata et al., 2004; Hand et al., 2005; Ge et al., 2006). Notably, the transition of RGC progenitors in the VZ to INPs in the SVZ is a normal maturation step during neocortical development (Götz and Huttner, 2005). Similar effects were observed in E13.5→ E14.5 transfections, with Neurog2 accelerating the VZ to SVZ transition compared with pCIG2 (VZ, p < 0.001; SVZ, p < 0.01; Fig. 1E–F″,G–H″,N). Conversely, in E14.5→E15.5 electroporations, the zonal distribution of GFP+ cells was similar in control and Neurog2 transfections (p > 0.05; VZ, SVZ, IZ; Fig. 1I–J″,K–L″,O). Thus, while Neurog2 rapidly promotes the apical (VZ) to basal (SVZ) transition of early stage cortical progenitors (E12.5–E13.5), late-stage cortical progenitors (E14.5) no longer rapidly transit in response to Neurog2.
Figure 1.

Temporal change in Neurog2 proneural activity during neocortical development. Comparison of E12.5→E13.5 (A–D″), E13.5→E14.5 (E–H″), and E14.5→E15.5 (I–L″) transfections of pCIG2 control (A–B″, E–F″, I–J″) and pCIG2-Neurog2 (C–D″, G–H″, K–L″) analyzed for the expression of NeuN and GFP epifluorescence. B″, D″, F″, H″, J″, and L″ display GFP epifluorescence, where the signal overlapping with NeuN staining is false-colored red, and the non-overlapping signal is false-colored blue. M–O, Quantitation of zonal distribution of GFP+ cells in E12.5→E13.5 (M), E13.5→E14.5 (N), and E14.5→E15.5 (O) transfections. P, Percentage of GFP+ cells that express NeuN. The asterisk (*) indicates significantly different versus all other means, p < 0.05, n = 3. Error bars indicate SEM. CP, Cortical plate; IZ, intermediate zone.
We also assessed the effects of Neurog2 on neuronal differentiation with the same assay, using NeuN as a pan-neuronal marker. In E12.5→E13.5 electroporations, 2.2-fold more GFP+ cells overexpressing Neurog2 initiated NeuN expression compared with control transfections (p < 0.001; Fig. 1A–B″,C–D″,P). Similarly, in E13.5→E14.5 transfections, Neurog2 promoted a 1.9-fold increase in neuronal number compared with controls (p < 0.0001; Fig. 1E–F″,G–H″,P). However, in E14.5→E15.5 transfections, similar ratios of GFP+NeuN+/total GFP+ cells were detected in control and Neurog2 transfections (Fig. 1I–J″,K–L″,P). Similarly, when Neurog2 was misexpressed at E14.5, and cortices were analyzed 24 h later, GFP and Neurog2-overexpressing cells were detected in the VZ, SVZ, and cortical plate (see Fig. 3O,P). However, in these E14.5 electroporations, Neurog2 did not induce the precocious expression of neocortical neuronal markers in the VZ; instead, Neurod1, Bhlhe22, Slc17a6, and Tbr1 transcripts were only detected in the cortical plate, in their normal expression domain (n = 5; 24 h after electroporation; see Fig. 3P–T). In contrast, we previously showed that Neurog2 can induce the ectopic expression of Neurod1, Bhlhe22, Slc17a6, and Tbr1 in the VZ in E12.5→E13.5 transfections (Mattar et al., 2008). These data further support the idea that Neurog2 can promote rapid, precocious neurogenesis in E12.5 and not E14.5 cortical progenitors.
Figure 3.

Temporal regulation of Neurog2 proneural activity by GSK3β. E12.5→E13.5 (A–K) and E14.5→E15.5 (L–V) neocortical electroporations with pCIG2 (A, B, L, M), Neurog2 (C, D, N, O), Neurog2+GSKCA (E, F), GSKDN (P, Q), and Neurog2+GSKDN (G, H, R, S), showing GFP+, transfected cells and NeuN immunolabeling. GFP+ cells that differentiated into NeuN+ neuronal cells are marked by arrows. The asterisks in photomicrographs mark nonspecific staining of blood vessels. I, T, The percentage of GFP+ transfected cells that expressed NeuN (I, T), Pax6 (J, U), and Tbr2 (K, V) was enumerated at E12.5 and E14.5. I, The asterisks indicate the following: *p < 0.001 versus pCIG2 or GSKCA and p < 0.05 versus GSKCA+Neurog2; **p < 0.01 versus GSKCA or pCIG2. T, The asterisks indicate the following: *p < 0.001 versus pCIG2, p < 0.01 versus Neurog2, p < 0.05 versus GSKDN+Neurog2. **p < 0.001 versus pCIG2 or Neurog2. The p values in J, K, U, and V were all relative to pCIG2 and are denoted as follows: *p < 0.05, **p < 0.001, ***p < 0.0001. O–T, E14.5→E15.5 Neurog2 transfection analyzed for the expression of GFP (O), Neurog2 (P), Neurod1 (Q), Bhlhe22 (R), Slc17a6 (S), and Tbr1 (T). U–Z, E14.5→E15.5 GSKDN transfection analyzed for the expression of GFP (U), GSK3β (V), Neurog2 (W), Bhlhe22 (X), Neurod6 (Y), and Tbr1 (Z). Error bars indicate SEM.
Thus, based on two independent measurements (i.e., progenitor maturation and neuronal differentiation), Neurog2 proneural activity progressively declines between E12.5 and E14.5. Together, these data support a model in which Neurog2 is sensitive to temporal cues and cellular context in the developing neocortex.
GSK3β activity levels and Neurog2 phosphorylation increase over developmental time in the neocortex
We speculated that Neurog2 proneural activity may be downregulated at later stages of cortical development due to contextual changes, such as the onset of signaling through an inhibitory pathway (Fig. 2A). In a screen for signaling pathways that may be temporally regulated, we analyzed canonical Wnt signaling by monitoring β-galactosidase activity in TCF/Lef::LacZ transgenic embryos (Mohamed et al., 2004). At E12.5, canonical Wnt activity was high in the dorsal telencephalon, which is the neocortical anlage, but decreased dramatically by E15.5 (Fig. 2B,B′,C,C′), in line with previous reports (Machon et al., 2007; Mutch et al., 2009).
Figure 2.
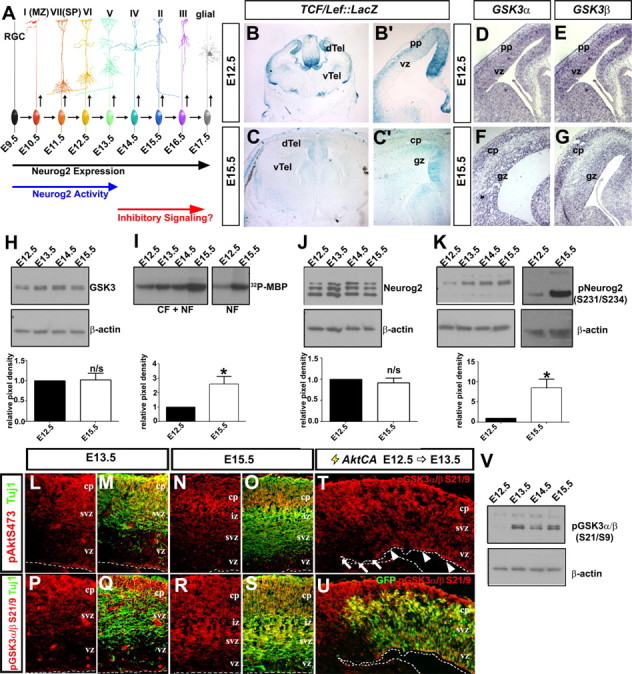
Temporal change in GSK3β kinase activity and Neurog2 phosphorylation during neocortical development. A, Extrinsic model of posttranscriptional inactivation of Neurog2 during late stages of neocortical development. B, C, β-Galactosidase histochemical stain of E12.5 (B, B′) and E15.5 (C, C′) TCF/Lef-LacZ transgenic cortices. D–G, Distribution of GSK3α (D, F) and GSK3β (E, G) transcripts in E12.5 (D, E) and E15.5 (F, G) neocortices. H, Expression analysis of GSK3 protein from E12.5 to E15.5 neocortical lysates normalized against β-actin (loading control) protein levels. I, GSK3β kinase activity, assayed via P-32 phosphorylation of a myelin basic protein substrate by GSK3β immunoprecipitated from E12.5 to E15.5 neocortical cellular fraction (CF) or nuclear fraction (NF) protein extracts. J, K, Western blot analysis of total Neurog2 (J) or pNeurog2 (S231/234; K) expression from E12.5 to E15.5, normalized against β-actin (loading control). L–S, Coexpression of pAkt (S473, red) and Tuj1 (green) (L–O) and pGSK3α/β (S21/9, red) and Tuj1 (green) (P–S) in E13.5 and E15.5 neocortical sections. T, U, E12.5→E13.5 electroporation of AktCA promotes phosphorylation of GSK3α/β (S21/9) in GFP+ VZ progenitors (arrowheads), but not in adjacent GFP− cells (arrows). V, Western blot analysis of GSK3α/β (S21/9) in E12.5 to E15.5 cortical lysates. The asterisk (*) indicates significantly different, p < 0.05. Error bars indicate SEM. cp, Cortical plate; dTel, dorsal telencephalon; gz, germinal zone; pp, preplate; svz, subventricular zone; vTel, ventral telencephalon; vz, ventricular zone.
Given that many bHLH transcription factors, including Neurog2, are directly and/or indirectly regulated by phosphorylation (Marcus et al., 1998; Moore et al., 2002; Hand et al., 2005; Ma et al., 2008), we focused on GSK3, which is sequestered to membrane-bound multivesicular bodies during canonical Wnt signaling, reducing its activity in the cytoplasm and nucleus (Hur and Zhou, 2010; Taelman et al., 2010). Consequently, we predicted that GSK3 activity would be low in early corticogenesis when canonical Wnt signaling was elevated, and vice versa at later stages. We first showed that both GSK3α and GSK3β transcripts were detected throughout the progenitor zones and neuronal layers of the neocortex at E13.5 and E15.5 (Fig. 2D–G). We also demonstrated by Western blotting of cortical lysates that bulk GSK3 protein levels did not change over developmental time (E12.5-to-E15.5 ratio, 1.02 ± 0.16; n = 4; Fig. 2H). To next measure GSK3 activity, we performed in vitro kinase assays, immunoprecipitating GSK3β from E12.5, E13.5, E14.5, and E15.5 cortical lysates and using MBP as an exogenous substrate. Activity levels of the GSK3β kinase steadily increased between E12.5 and E15.5 (2.69-fold increase; n = 7; p = 0.03; Fig. 2I). Furthermore, in vitro kinase assays performed using E12.5 and E15.5 nuclear extracts revealed that GSK3 was also more active in the nucleus at later developmental stages, where Neurog2 is located (Fig. 2I).
The high basal activity of GSK3 is subject to several inhibitory inputs in addition to canonical Wnt signaling (Hur and Zhou, 2010). For example, PI3K signaling triggers activated kinase in thymoma (Akt)-mediated phosphorylation of GSK3β on S9 and GSK3α on S21 (Cross et al., 1995), which inactivates these kinases. We found that active pAkt (S473) and inactive pGSK3 (S21/S9) were expressed at low to undetectable levels in E13.5 and E15.5 progenitors in the cortical VZ, but were elevated in the neuronal layers (Fig. 2L–O,P–S). By Western blot analysis, overall levels of pGSK3α/β (S21/9) also increased over developmental time (Fig. 2V), but we attribute this to an increase in neuronal number. This contrasts to previous reports, which suggested that Akt activity was high in cortical progenitors, a conclusion that was reached based on immunolabeling with an Akt phosphorylation consensus site antibody (Faedo et al., 2008; Oishi et al., 2009). To confirm that GSK3 was present in cortical progenitors, but not normally phosphorylated by Akt, we misexpressed constitutively active Akt (AktCA) in E12.5 cortical progenitors, and 24 h later, observed robust and ectopic phosphorylation of endogenous GSK3α/β on S21/S9 in the cortical VZ (Fig. 2T,U). GSK3 is thus expressed in cortical progenitors, but it is not normally phosphorylated by Akt in these cells and hence remains in an active state, at least with respect to this repressive mark. We therefore attribute differences in GSK3 activity at early and late stages of cortical development to the reduction in canonical Wnt signaling.
Finally, to determine whether the increase in GSK3 activity resulted in enhanced phosphorylation of Neurog2, we performed Western blot analyses using an antibody that specifically recognizes Neurog2 phosphorylated on S231/S234, which are GSK3 phosphoacceptor sites (Ma et al., 2008). While bulk Neurog2 levels did not change over developmental time (0.92-fold difference at E15.5 vs E12.5; n = 4; p > 0.05; Fig. 2J), pNeurog2 (S231/S234) levels increased dramatically between E12.5 and E15.5 (8.47-fold increase; p = 0.006; n = 4; Fig. 2K).
Our data thus support the idea that an increase in GSK3 activity, which is likely mediated by a reduction in canonical Wnt signaling, culminates in the enhanced phosphorylation of Neurog2 on S231/S234 in later-stage cortical progenitors.
Neurog2 proneural activity is inhibited by GSK3 kinase activity
Given that GSK3 activity and Neurog2-S231/S234 phosphorylation increased while the proneural activity of Neurog2 declined over developmental time, we speculated that GSK3 might negatively regulate Neurog2 function. To test this, E12.5 cortices were electroporated with a GSK3β construct with high basal activity and resistance to PI3K-mediated inactivation (GSKS9A; hereafter GSKCA) (Fang et al., 2000). In E12.5→E13.5 electroporations, Neurog2 promoted a 1.62-fold increase in the ratio of GFP+ cortical cells that expressed the neuronal marker NeuN compared with pCIG2 control electroporations (p < 0.05; n = 3; Fig. 3A,A′,B,B′,E). Conversely, GSKCA did not alter the GFP+NeuN+/GFP+ ratio (p > 0.05; n = 3 each; Fig. 3E). However, in E12.5→E13.5 coelectroporations of GSKCA and Neurog2, neuronal differentiation was reduced 1.34-fold compared with Neurog2 single transfections (p < 0.05; n = 3; Fig. 3B,B′,C,C′,E). GSK3 can thus inhibit the proneural activity of exogenous Neurog2 at E12.5, whereas endogenous neurogenesis is resistant to GSK3 inhibition at this stage.
Cortical progenitor cell transitions depend on the coordinated activation of distinct genetic programs, with RGC identity controlled by the homeodomain transcription factor Pax6 (Estivill-Torrus et al., 2002; Quinn et al., 2007), while INP identity is controlled by the T-box transcription factor Tbr2 (Englund et al., 2005; Arnold et al., 2008; Sessa et al., 2008; Kowalczyk et al., 2009). To confirm that GSKCA did not influence E12.5 cortical progenitors, we also analyzed the RGC marker Pax6 and the INP marker Tbr2. In E12.5→E13.5 electroporations, Neurog2 reduced the number of transfected cells that expressed Pax6 (1.64-fold decrease; n = 3; p < 0.05; Fig. 3F), while increasing Tbr2 expression (1.63-fold increase; p < 0.0001; n = 5; Fig. 3G), consistent with a role for Neurog2 in promoting progenitor maturation (Miyata et al., 2004). Conversely, GSKCA had no effect on the expression of Pax6 (n = 3) or Tbr2 (n = 5) in E12.5→E13.5 electroporations (Fig. 3F,G).
To next test whether GSK3 was required to inhibit Neurog2 proneural activity, we examined the effects of reducing GSK3 activity in cortical progenitors, electroporating a kinase-dead and dominant-negative form of GSK3β (hereafter GSKDN) (Dominguez et al., 1995) into E12.5 and E14.5 cortices. Consistent with the idea that endogenous GSK3 activity is low and not normally suppressive at E12.5, GSKDN did not enhance the ability of Neurog2 to promote NeuN expression and neuronal differentiation in E12.5→E13.5 coelectroporations (Neurog2+GSKDN vs Neurog2; p > 0.05; n = 3; Fig. 3D,D′,E). In striking contrast, in E14.5→E15.5 transfections, at a stage when Neurog2 was not able to induce neuronal differentiation (Fig. 3H,H′,I,I′,L), GSKDN overexpression significantly increased the GFP+NeuN+/GFP+ ratio compared with controls (GSKDN vs pCIG2; p < 0.001, n = 3; Fig. 3J,J′,L). Moreover, in E14.5→E15.5 cotransfections of GSKDN and Neurog2, the proneural activity of Neurog2 was unmasked, with neuronal differentiation approaching the levels obtained in E12.5 transfections (GSKDN vs GSKDN+Neurog2; p < 0.05, n = 3; Fig. 3K,K′,L). Neuronal columns were also observed in the cortical VZ following the E14.5 electroporation of GSKDN (n = 2 of 4) and GSKDN+Neurog2 (n = 3 of 7; Fig. 3J′,K′), indicative of premature neurogenesis. Accordingly, transcriptional targets of Neurog2-mediated differentiation, including Bhlhe22, Neurod6, and Tbr1, were ectopically expressed in the cortical VZ when GSKDN (n = 2 of 4; Fig. 3U–Z) or GSKDN+Neurog2 (n = 3 of 7; data not shown) were electroporated at E14.5 and analyzed 24 h later, further indicative of ectopic and precocious neuronal differentiation. Conversely, in E14.5 electroporations of GSKCA, more cortical progenitor cells expressed the RGC marker Pax6 (1.65-fold increase; p < 0.001; n = 3; Fig. 3M), while fewer cells transited to the Tbr2+ INP stage (1.37-fold decrease; p < 0.0001; n = 3; Fig. 3N), consistent with a block in progenitor maturation.
We thus conclude that GSK3 is necessary and sufficient to inhibit Neurog2 proneural activity, reducing neuronal differentiation and inhibiting cortical progenitor maturation at E14.5. Conversely, E12.5 cortical progenitors are resistant to the inhibitory effects of GSK3, except when Neurog2 is overexpressed.
GSK3β controls the timing of neocortical neurogenesis without affecting laminar identity
The timing of cell cycle exit is coupled to laminar fate specification in the neocortex. We thus asked whether the more rapid neuronal differentiation induced by inhibiting GSK3 activity in E14.5 cortical progenitors influenced laminar fate. In E14.5→P7 electroporations, when neurogenesis and neuronal migration are complete, a significant proportion of GSKDN (Fig. 4B,E,H,K,N,Q,T,W) and GSKDN+Neurog2 (Fig. 4C,F,I,L,O,R,U,X) electroporated cells migrated aberrantly, with many transfected cells remaining in the germinal zones (VZ/SVZ) and deep layers. This was in contrast to pCIG2 control electroporations (data not shown) (Langevin et al., 2007) and Neurog2 (Fig. 4A,D,G,J,M,P,S,V) transfected cells, which predominantly migrated to layers II–IV by P7. Despite their migration defects, the mislocalized GSKDN and GSKDN+Neurog2 electroporated cells acquired layer identities appropriate to their E14.5 birthdate, as evidenced by the expression of upper-layer markers Bhlhe22/Beta3 (layers II–V; Fig. 4K,L,Y–Y″,Z–Z″), Rorb (layers II–IV; Fig. 4N,O), and Cux1/2 (layers II–IV) (data not shown). In contrast, lower layer markers, including Etv1 (Fig. 4P–R), Fezf2 (Fig. 4S–U), Robo1 (Fig. 4V–X), Tbr1 (data not shown), and Ctip2 (data not shown) were not ectopically expressed in the Neurog2-transfected patch, or in the mislocalized GSKDN and GSKDN+Neurog2 electroporated cells.
Figure 4.
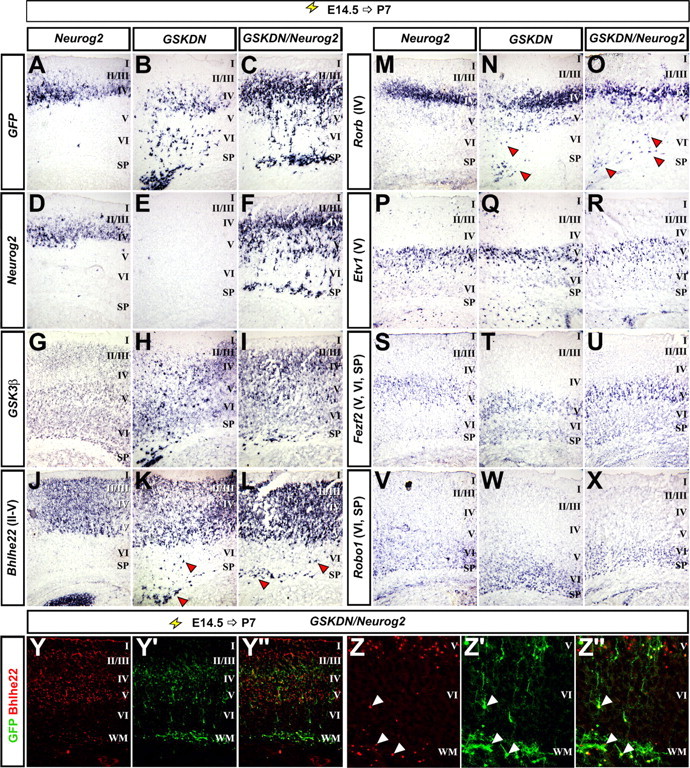
GSKDN perturbs neuronal migration, but not layer fate specification. E14.5→P7 electroporations of Neurog2 (A, D, G, J, M, P, S, V), GSKDN (B, E, H, K, N, Q, T, W), and Neurog2+GSKDN (C, F, I, L, O, R, U, X–Z″) analyzed for the expression of GFP (A–C), Neurog2 (D–F), GSK3β (G–I), Bhlhe22 (J–L), Rorb (M–O), Etv1 (P–R), Fezf2 (S–U), and Robo1 (V–X). GSKDN/Neurog2 transfections were additionally analyzed for the expression of Bhlhe22 protein (Y–Z″). The arrowheads indicate ectopic expression. I, Layer 1; II/III, layer 2/3 (fused in mouse); IV, layer 4; V, layer 5; VI, layer 6; SP, subplate; WM, white matter.
Blocking GSK3 activity therefore increases the rate of neuronal differentiation and affects migration, but does not influence the acquisition of laminar-specific molecular properties.
GSK3β interferes with Neurog2 transcriptional activity through the bHLH domain
To determine whether GSK3β inhibits Neurog2 proneural function by interfering with its transcriptional activity, we performed reporter assays using three direct Neurog2 transcriptional targets; Neurod1 (Huang et al., 2000; Talikka et al., 2002), Dll1 (Castro et al., 2006), and Rnd2 (Heng et al., 2008). Reporter assays were conducted in P19 embryonal carcinoma cells, which differentiate into neurons in response to Neurog2 (Farah et al., 2000). Neurog2 transactivated all three reporters above control levels (34.22-, 6.2-, 92.69-fold increases for Neurod1, Dll1, Rnd2, respectively; n = 3 for all; Fig. 5A–C). Strikingly, while GSK3 had no effect on these transcriptional reporters when expressed alone, it significantly suppressed the ability of Neurog2 to transactivate each reporter (1.38-, 1.28-, 1.48-fold decreases for Neurod1, Dll1, Rnd2, respectively; n = 3 for all; Fig. 5A–C). We thus conclude that GSK3 inhibits the transcriptional activity of Neurog2 on multiple target genes, at least in vitro.
Figure 5.

GSK3β inhibits Neurog2-mediated promoter transactivation. A–C, Effects of GSK3β activity on Neurog2-dependent transactivation of Neurod1 (A), Dll1 (B), and Rnd2 (C) promoters in P19 embryonal carcinoma cells. D, Phosphorylation of Neurog2 at S231/234 by GSK3β in HEK293 cells, and abrogation by S231A/S234A point mutations. E, GSK3β-mediated reduction of Neurog2-mediated Neurod1 promoter transactivation persists when the S231/234 phosphoacceptor residues are mutated to alanines. F, Schematic of Neurog2 deletion constructs. TAD, Transactivation domain; b, basic domain; HLH, helix-loop-helix domain. G, Effect of GSK3β on Neurog2 deletion construct-mediated transactivation of the Neurod1 promoter. The p values are denoted as follows: *p < 0.05, **p < 0.001, ***p < 0.0001. H, Half-life analysis of mutated Neurog2 proteins over a 5 h timeframe. Protein ladder is marked at the left of each panel (red line, 60 kDa). Lanes are labeled with the hour each protein sample was removed from the degradation reaction. I, Quantification of protein half-lives based on autoradiography and densitometry. Error bars indicate SEM.
We next asked whether GSK3 inhibited Neurog2 transcriptional activity through direct phosphorylation. By using a phosphospecific antibody that recognizes Neurog2 phosphorylated on S231/S234, we first confirmed that wild-type Neurog2, and not a mutant version containing serine-to-alanine mutations of these two sites (hereafter Neurog2SA), was phosphorylated by GSK3 (Fig. 5D), consistent with previous reports (Ma et al., 2008). In addition, it was previously suggested that GSK3 may also phosphorylate Neurog2 on some of the seven additional SP sites that are recognized by proline-directed serine/threonine kinases, including GSK3 (Ma et al., 2008; Ali et al., 2011). These additional GSK3 phosphoacceptor sites would not be recognized by the phospho-Neurog2 antibody that we used. Consistent with the idea that additional Neurog2 sites may be phosphorylated by GSK3, GSK3 repressed Neurog2SA-mediated transactivation of a Neurod1 reporter to the same extent as wild-type Neurog2 (1.60- and 1.58-fold decreases, respectively; n = 3; Fig. 5E). However, we cannot rule out the possibility that GSK3 represses Neurog2 transcriptional activity through indirect means.
To better understand how GSK3 represses Neurog2, we generated a panel of four C-terminal and five N-terminal deletions of Neurog2, all of which retained the bHLH domain (Fig. 5F). In Neurod1 reporter assays, the transcriptional activities of all N-terminal truncants [Neurog2-(amino acids 16–264), Neurog2-(amino acids 32–264), Neurog2-(amino acids 64–264), Neurog2-(amino acids 87–264), Neurog2-(amino acids 110–264)] and two of the C-terminal truncants [Neurog2-(1–217) and Neurog2-(1–244)], were not significantly different from wild-type Neurog2 (n = 3; p > 0.05; Fig. 5G). Notably, Neurog2-(amino acids 1–217) lacked the S231/S234 GSK3 phosphoacceptor sites, suggesting that these sites are not necessary for Neurog2 transcriptional activity. In contrast, Neurog2-(amino acids 1–165) and Neurog2-(amino acids 1–185) did not transactivate the Neurod1 reporter, even though they retained their bHLH domains, translocated to the nucleus, and had longer rather than shorter half-lives than wild-type Neurog2 (Fig. 5H,I). We thus suggest that the Neurog2 transactivation domain (TAD) may fall between amino acids 185 and 217, as the predicted N-terminal TADs were dispensable for transcriptional activation in our assay (Fig. 5F,G).
Strikingly, all of the transcriptionally active forms of Neurog2 were suppressed by GSK3 in Neurod1 reporter assays (1.33- to 1.79-fold decreases; Fig. 5G). GSK3 also significantly repressed the abilities of Neurog1 (p < 0.05; n = 9), Neurod4 (p < 0.05; n = 9), and Neurod1 (p < 0.05; n = 6) to transactivate the Neurod1 promoter (data not shown). We thus conclude that GSK3 functions as a general inhibitor of bHLH-mediated transactivation, and suggest that it may act on the bHLH domain, as this was the only region conserved among the truncated alleles.
Differences in the transcriptional activation of distinct Neurog2 target genes
The bHLH domain consists of a basic DNA binding domain and a HLH domain, the latter mediating homodimerization, or promoting heterodimerization with ubiquitous class I bHLH proteins or with tissue-specific class II bHLH proteins (Massari and Murre, 2000; Bertrand et al., 2002). To determine whether GSK3 might suppress Neurog2 transcriptional activity by regulating the availability and/or recruitment of class I cofactors, we first examined how the class I E-proteins encoded by Tcf4, Tcf12, and Tcfe2a (gives rise to E12 and E47 isoforms) were expressed in cortical progenitors. By RNA-in situ hybridization, Tcfe2a, Tcf4, and Tcf12 were all expressed in the dorsal telencephalon, with higher levels in VZ and SVZ progenitors compared with postmitotic neurons at both E12.5 and E15.5 (Fig. 6A–F). Furthermore, Western blot analysis suggested that E47 protein levels did not change dramatically over developmental time (Fig. 6G). We thus conclude that Neurog2 should have access to all three heterodimerization partners throughout development, raising the question of which partner would be selected.
Figure 6.

The class I bHLH cofactor Tcfe2a suppresses Neurog2 transcriptional activity. A–F, Expression of Tcfe2a (A, D), Tcf4 (B, E), and Tcf12 (C, F) on E12.5 and E15.5 cortices. G, Western blot analysis of E47 protein levels in E12.5–E15.5 cortical lysates. H–J, Effect of coexpression of the class I cofactors Tcfe2a (E12 and E47), Tcf4, and Tcf12 on Neurog2-mediated transactivation of the Neurod1 (H), Dll1 (I), and Rnd2 (J) promoters in P19 cells. K, Effect of E47 shRNA on Neurod1 promoter transactivation by combinations of E47 and Neurog2 constructs. Error bars indicate SEM. *p < 0.05, **p < 0.001, ***p < 0.0001.
To address this question, we first asked whether the different E-proteins differentially influenced the transcriptional activity of Neurog2 on Neurod1, Dll1, and Rnd2 transcriptional reporters. When expressed alone, E12, E47, Tcf4, and Tcf12 were not able to transactivate the Neurod1, Dll1, or Rnd2 reporters (Fig. 6H–J). However, when cotransfected with Neurog2, both E12 and E47 strongly repressed transactivation of the Neurod1 reporter (E12, 2.93-fold decrease; p < 0.001, n = 4; E47, 2.65-fold decrease; p < 0.001; n = 4; Fig. 6H). This effect was specific, as the suppressive activity of E47 was abolished by an E47 shRNA construct, and not a scrambled control (Fig. 6K). E12 similarly repressed Neurog2 function on the Dll1 reporter (1.22-fold decrease; p < 0.001; n = 3; Fig. 6I), while conversely, E47 increased the ability of Neurog2 to transactivate Dll1 (1.44-fold increase; p < 0.0001; n = 3; Fig. 6I). In contrast, neither E12 nor E47 influenced the ability of Neurog2 to transactivate Rnd2 (Fig. 6J). This suggests that the effects of individual class I bHLH proteins on Neurog2 transcriptional activity is selective for different target genes. Nevertheless, we can make the general conclusion that, with one exception, E12 and E47 either inhibit Neurog2-mediated transactivation or fail to enhance the activity of this transcription factor on its target genes, at least in this in vitro system.
In direct contrast to E12/E47, both Tcf4 and Tcf12 strongly enhanced the transactivation strength of Neurog2 on transcriptional reporters for Dll1 (E12, 2.93-fold increase; p < 0.001; n = 3; E47, 2.65-fold increase; p < 0.001; n = 4; Fig. 6I) and Rnd2 (E12, 2.93-fold increase; p < 0.001; n = 3; E47, 2.65-fold increase; p < 0.001; n = 3; Fig. 6J). Conversely, neither Tcf4 nor Tcf12 increased Neurog2 transactivation on the Neurod1 reporter (p > 0.05; n = 3; Fig. 6H). We thus conclude that, in general, Tcf4 and Tcf12 have a more positive effect on Neurog2 transcriptional activity compared with E12/E47. Because our previous experiments had shown that GSK3 inhibits Neurog2 function through its bHLH domain, we asked whether the inhibitory effects of E12/E47 were regulated by GSK3.
GSK3β suppresses Neurog2 function by regulating its associations with class I cofactors
In myoblast lineages, E47 is phosphorylated by p38MAPK, which promotes heterodimerization with MyoD, a class II bHLH protein and skeletal muscle determinant (Lluís et al., 2005). We thus speculated that, in cortical progenitors, GSK3 may act similarly, promoting the formation of Neurog2–E47 heterodimers, which may be less transcriptionally active than other Neurog2 protein pairs. To test whether E47 was indeed phosphorylated by GSK3, we generated a GST-E47 fusion protein and used it as a substrate in in vitro kinase assays along with GST-Neurog2 (positive control) and GST (negative control). When combined with recombinant GSK3, both GST-E47 and GST-Neurog2 (and not GST) were phosphorylated, as was GSK3 itself, due to autophosphorylation (Cole et al., 2004) (Fig. 7A,B). To ask whether the phosphorylation of Neurog2 and/or E47 influenced Neurog2/E47 heterodimerization, we used two assays. First, E47 and FLAG-Neurog2 were transcribed and translated in vitro, and one-half of the product was phosphorylated with recombinant GSK3 alone. Different combinations of phosphorylated and unphosphorylated Neurog2 and E47 were then mixed, followed by anti-FLAG immunoprecipitation. In coimmunoprecipitation experiments, FLAG-Neurog2 brought down more E47 when both Neurog2 and E47 were phosphorylated (Fig. 7C). Finally, we also transfected NIH-3T3 cells with expression constructs for FLAG-Neurog2, FLAG-Neurog2SA, E47, and GSK3. In FLAG-Neurog2 pull-downs, both wild-type Neurog2 and Neurog2SA brought down more E47 protein in the presence of GSKCA (Fig. 7D). We thus conclude that GSK3 may negatively regulate Neurog2 by promoting interactions between Neurog2 and E47.
Figure 7.

GSK3β regulates Neurog2 cofactor associations. A, B, P-32 phosphorylation of purified GST-E47 or GST-Neurog2, by GSK3β in vitro. C, Western blot of in vitro-transcribed/translated E47 coimmunoprecipitated with FLAG-Neurog2, after additional P-32 phosphorylation by GSK3β as indicated. The blue arrow indicates specific band. D, Assessment of the association between E47 and FLAG-Neurog2 via coimmunoprecipitation from cell extracts cotransfected with combinations of pCS2 (empty vector control), FLAG-Neurog2, FLAG-Neurog2-SA (S231/234A), E47, or HA-GSKCA as indicated. The red asterisks denote enhanced association. E, Assessment of Neurog2 dimerization via coimmunoprecipitation of HA-Neurog2 with FLAG-Neurog2 from cell extracts cotransfected with combinations of pCIG2 (empty vector control), FLAG-Neurog2, HA-Neurog2, HA-GSKCA, or GSKDN as indicated. The red asterisks denote decreased association. The red and green arrows indicate the specific bands for Neurog2 and GSK3β, respectively. F, Western analysis of tethered Neurog2∼Neurog2 or Neurog2∼E47 forced dimer constructs. G, Degradation time course of in vitro-transcribed/translated, S35-labeled forced dimer constructs. H, Comparison of Neurod1 promoter transactivation by forced dimer constructs. I, Analysis of FLAG-Neurog2 occupancy on the Neurod1 promoter when coexpressed with combinations of E47 or GSK3 constructs as indicated. J, Model of GSK3-mediated suppression of Neurog2 by phosphorylation-induced cofactor association. The p values are denoted as follows: *p < 0.05, **p < 0.001, ***p < 0.0001. Error bars indicate SEM.
If GSK3 was promoting Neurog2–E47 heterodimerization, we questioned what the dimerization status of Neurog2 might be when GSK3 activity was low, as observed in the early neocortex. We speculated that Neurog2 may form homodimers in the absence of GSK3 signaling. To test this, NIH-3T3 cells were transfected with FLAG-Neurog2 and HA-Neurog2 expression constructs, either with or without activated HA-GSK3CA or GSKDN. When GSKCA was present, less HA-Neurog2 was brought down in a FLAG-Neurog2 IP, whereas GSKDN did not reduce the amount of Neurog2 that was pulled down (Fig. 7E). We thus conclude that GSK3 promotes Neurog2–E47 associations, while also inhibiting the formation of Neurog2–Neurog2 homodimers.
To test the functional significance of these different complexes, we generated Neurog2∼Neurog2 and Neurog2∼E47 tethered fusion proteins, joining the bHLH proteins with a flexible linker that promotes intramolecular dimerization (Fig. 7F). A similar approach was used previously to dissect apart the roles of Twist homodimers and heterodimers in Drosophila mesoderm (Castanon et al., 2001) and mouse limb development (Neuhold and Wold, 1993; Firulli et al., 2007). In protein degradation assays, Neurog2∼Neurog2 homodimers had half-lives of <30 min (Fig. 7G), similar to our previous measurements of Neurog2 monomers (Nguyen et al., 2006). In contrast, Neurog∼E47 heterodimers were more stable, with half-lives of >5 h (Fig. 7G), consistent with previous reports that E47 stabilizes Neurog2 (Vosper et al., 2007). However, despite the enhanced stability of Neurog∼E47 heterodimers, they were less efficient at transactivating a Neurod1 reporter compared with the less stable Neurog2∼Neurog2 homodimers (Fig. 7H).
To ask why Neurog2∼E47 might be less transcriptionally active, we tested whether E47 and GSK3 influenced Neurog2 binding to target promoters by performing anti-Neurog2 chromatin immunoprecipitation experiments in transfected cell lines. Indeed, less Neurog2 was bound to the Neurod1 promoter when Neurog2 was transfected along with E47 and/or GSK3 (Fig. 7I). We thus conclude that GSK3 promotes Neurog2∼E47 heterodimerization and suggest that these heterodimers are less transcriptionally active than Neurog2∼Neurog2 homodimers, in part due to their decreased ability to bind DNA (Fig. 7J).
Delayed transactivation of Neurog2 target genes in the late cortex correlates with Neurog2–E47 coelution
Our working model at this point suggested that GSK3 would promote Neurog2–E47 heterodimerization in the late cortex, reducing the efficiency of neuronal target gene transactivation. If this model were correct, we reasoned that Neurog2 transcriptional reporters would be less efficiently activated in the late versus early cortex. To test this, we performed in vivo luciferase assays on lysates from E12.5→E13.5 and E14.5→E15.5 cortical progenitors electroporated with Neurod1 and Rnd2 reporters (and a Renilla control for transfection efficiency; Fig. 8A). Strikingly, the activities of both the Neurod1 (1.77-fold reduction; n = 6 at E12.5, n = 3 at E14.5; p < 0.001) and Rnd2 (19.85-fold reduction; n = 3 at E12.4, n = 2 at E14.5; p < 0.05) reporters were sharply reduced in E14.5 versus E12.5 cortical lysates (Fig. 8A). Thus, the transcription of Neurog2 target genes is reduced in the E14.5 cortex.
Figure 8.

A Neurog2/E47/GSK3β complex suppresses differentiation in cortical progenitors at late stages. A, Neurod1 and Rnd2 promoter activity in vivo, ascertained by in utero electroporation of luciferase constructs at E12.5 compared with E14.5. B, Effect of E47 coexpression on Neurog2-mediated transcactivation of a Neurod1 reporter in dissociated E14.5 cortical progenitors. C, Scheme illustrating marker expression of radial glial cells, intermediate progenitors, and pyramidal neurons. D–L, Effects of pCIG2 (control) or E47 transfections on progenitor maturation and neurogenesis in E12.5 cortical progenitors. GFP+ cells were monitored 24 h after electroporation for the coexpression of Tbr1 (neurons; D–F), Tbr2 (intermediate progenitors; G–I), or Pax6 (radial glia; J–L). M, N, Fractionation of native protein from cortical nuclear extracts by gel filtration, and analysis of Neurog2, phospho-Neurog2-S231/234, GSK3β, and E47 protein distribution at E12.5 (M) or E15.5 (N). O, P, Model of the change in Neurog2 cofactor association and function mediated by GSK3 during early (O) and late (P) stages of corticogenesis. The p values are denoted as follows: *p < 0.05, **p < 0.001, ***p < 0.0001. Error bars indicate SEM. cp, Cortical plate; pyr, pyramidal neurons.
We next asked whether the model of GSK3-induced Neurog2–E47 heterodimerization applied in vivo, first examining whether E47 inhibited Neurog2 transcriptional activity in primary E14.5 cortical cells. While Neurog2 efficiently transactivated the Neurod1 reporter in dissociated cortical cells (9.08-fold increase vs control; p < 0.0001; n = 3), this activity was sharply reduced by E47 (2.17-fold decrease; p < 0.001; n = 3; Fig. 8B). Next, we asked whether E47 inhibited cortical progenitor maturation and neurogenesis when introduced into E12.5 cortical progenitors in vivo (Fig. 8C). Twenty-four hours after electroporation, E47 reduced the number of cortical cells that expressed the neuronal marker Tbr1 (7.3-fold decrease; p < 0.0001; n = 3; Fig. 8D–F), and the INP marker Tbr2 (1.44-fold decrease; p < 0.001; n = 3; Fig. 8G–I). Conversely, more E47-transfected cells expressed the RGC marker Pax6 (1.72-fold increase; p < 0.0001; n = 3; Fig. 8J–L). E47 is thus sufficient to block progenitor maturation and neuronal differentiation of E12.5 cortical progenitors.
As a final test of our model, we asked whether Neurog2–E47 heterodimerization predominated in later stage cortical progenitors in vivo. To compare Neurog2 complex formation in E12.5 and E15.5 cortices, we performed gel filtration assays to size fractionate native, nuclear protein complexes. At E12.5, Neurog2 primarily eluted in later fractions with a lower molecular weight, and not in the earlier, higher molecular weight fractions, where GSK3β and E47 were detected (Fig. 8M). Conversely, at E15.5, a significant amount of Neurog2 eluted in larger molecular weight fractions, with pNeurog2 (S231/S234) coeluting in the same fractions as GSK3β and E47 (Fig. 8N). While not definitive, these experiments are consistent with the idea that Neurog2 may homodimerize in early cortical progenitors, and heterodimerize with E47 in later-stage progenitors, when GSK3 levels are elevated (Fig. 8O,P).
In summary, we have uncovered a novel mode of Neurog2 regulation, demonstrating that its choice of dimerization partner is regulated by GSK3 and that Neurog2 dimerization status changes over developmental time.
Discussion
We previously showed that the proneural gene Neurog2 is required to specify the identities of neocortical neurons born before E14.5, but not after this time (Schuurmans et al., 2004). Conversely, we show here that, while Neurog2 rapidly promotes neuronal differentiation in early-stage cortical progenitors, it loses this capacity later, prompting us to search for the underlying mechanism(s). We found that GSK3 activity increases in the embryonic neocortex over time, resulting in the progressive phosphorylation of Neurog2 on GSK3 phosphoacceptor sites, and correlating with a decline in Neurog2 proneural activity. Consistent with a functional linkage, forced activation of GSK3 abrogates the proneural activity of exogenous Neurog2 in early-stage cortical progenitors, while conversely, blocking GSK3 activity at later stages results in precocious neurogenesis. Mechanistically, we show that GSK3 modifies Neurog2 by influencing cofactor associations, promoting heterodimerization with the class I bHLH cofactors E12/E47 (Tcfe2a isoforms) and preventing Neurog2–Neurog2 homodimerization. Together, these data suggest that the increase in GSK3 activity that occurs in cortical progenitors at later stages underlies the diminished proneural activity of Neurog2. We thus suggest that GSK3 acts as a molecular “clock” to control the transition between early and late stages of neurogenesis by regulating Neurog2 proneural activity, thereby setting the tempo of neuronal differentiation.
Temporal regulation of Neurog2 activity by GSK3 phosphorylation
We found that canonical Wnt signaling declines dramatically between early and late stages of neocortical development, in line with previous reports (Machon et al., 2007; Mutch et al., 2009). Recently, it was found that Wnt signaling reduces GSK3 activity in the cell by sequestering it to membrane-bound endosomes (Hur and Zhou, 2010; Taelman et al., 2010). Accordingly, we found that both cytoplasmic and nuclear levels of GSK3 activity were low in the early neocortex, and increased dynamically later in development. This led us to hypothesize that GSK3 may be a negative regulator of Neurog2 proneural activity at later developmental stages. Consistent with this idea, GSK3 negatively regulates X-Neurod1 in Xenopus and NeuroAB in chick (Marcus et al., 1998; Moore et al., 2002; Ohkawara et al., 2004).
GSK3 is a proline-directed serine-threonine kinase that recognizes SP or TP phosphoacceptor sites, similar to the Cdks and MAPKs. In a previous report in Xenopus, the combined effects of mutating each of the nine SP sites in Neurog2 progressively led to enhanced Neurog2 binding to E-boxes in EMSA assays, suggesting that SP phosphorylation functions as a negative rheostat to control the levels of Neurog2 binding to DNA (Ali et al., 2011). Our data provide further support for this model. First, some of the nine SP sites in Neurog2, including S231 and S234, are phosphorylated by GSK3 (Ma et al., 2008). Second, we found that, by increasing GSK3 levels, less Neurog2 bound to the Neurod1 promoter, a complementary result to that reported by Ali et al. (2011). Finally, we found that GSK3 inhibits Neurog2-mediated neurogenesis in the cortex, which is opposite to the effect of mutating the SP sites, which enhanced the ability of Neurog2 to promote neurogenesis in Xenopus (Ali et al., 2011). GSK3 is thus another regulator of the Neurog2 rheostat, which we suggest exists in vivo in the embryonic neocortex. We also add a level of complexity to this regulatory mechanism, demonstrating that GSK3 regulates the choice of Neurog2 heterodimerization partner (see below, Regulation of Neurog2 dimerization).
Contrary to our results in the neocortex, and the results of Ali et al. (2011) in Xenopus, bHLH phosphorylation may also positively influence bHLH proteins, such as Olig2 (Sun et al., 2011), Ascl1 (Oishi et al., 2009), and Neurog2 (Ma et al., 2008). Indeed, in the embryonic spinal cord, GSK3-mediated phosphorylation of Neurog2 on Ser231/Ser234 results in the recruitment of the adaptor protein Ldb1 and the LIM homeodomain proteins Isl1 and Lhx3 into a complex that initiates motor neuron-specific gene expression (Ma et al., 2008). In this regard, it is interesting that Ldb1 and the LIM protein Lmo4 form a complex with Neurog2 that promotes neocortical neurogenesis, and that defects in neocortical neurogenesis are observed in Lmo4 mutants (Asprer et al., 2011). Currently, it is not known whether GSK3 plays a similar role in promoting Neurog2–Ldb1–Lmo4 complex formation in cortical progenitors. If so, the enhanced ability of the Neurog2–Ldb1–Lmo4 complex to promote neocortical neurogenesis would be in striking contrast to the inhibitory effects that GSK3 has on Neurog2-mediated neocortical neurogenesis in our hands. Future studies are required to examine how Neurog2–Ldb1–Lmo4 interactions are regulated in the embryonic neocortex in vivo.
Our results are also at first glance difficult to reconcile with the phenotype of GSK3α/β double mutants, which exhibit a severe hyperproliferation phenotype in the neocortex, and a corresponding reduction in neuronal differentiation (Kim et al., 2009). These data suggest that GSK3 is required to promote neuronal differentiation, but we suggest instead that GSK3 may act differently at early versus later stages of neocortical development. For instance, Wnt gain-of-function experiments in the developing neocortex, which reduce GSK3 activity, yield a strikingly similar hyperproliferative phenotype (Chenn and Walsh, 2002), but only when Wnt is activated at early stages, before the onset of neurogenesis (∼E8.5), and not when introduced later (E11.5), when neurogenesis has begun (Backman et al., 2005). Conversely, the ectopic activation of Wnt signaling at later stages of neocortical development promotes neuronal differentiation (Hirabayashi et al., 2004), further highlighting the important temporal changes in the response of cortical progenitors to signals that affect GSK3 activity over time.
Regulation of Neurog2 dimerization
Our data support a model whereby Neurog2 homodimerizes in the early cortex, allowing for maximal target gene transactivation, while at later stages, GSK3 promotes Neurog2–E47 heterodimerization, thereby reducing the efficiency of Neurog2 target gene activation. While E-proteins are in general ubiquitously expressed, it is becoming evident that they are not functionally equivalent and that they independently influence target gene selection in different cell lineages (Flora et al., 2007; Welinder et al., 2011). For instance, in the embryonic cerebellum, the proneural bHLH factor Math1 preferentially interacts with Tcf4 to control development of the pontine nucleus, which is derived from the rhombic lip (Flora et al., 2007). In this study, the authors similarly found that each of the E-proteins had different effects on Math1 transcriptional activity in reporter assays, and furthermore, that these effects were different in individual cell lines (Flora et al., 2007). Their study thus supports the idea that different E-proteins have distinct cellular functions, a finding also supported in hematopoietic lineages (Jones and Zhuang, 2011; Yang et al., 2011). Furthermore, in skeletal muscle, E12/E47 have been implicated in regulating the bHLH genes MyoD and Myf5 during proliferation, while Tcf12 functions during differentiation (Londhe and Davie, 2011). We suggest a similar model in the cortex, where Neurog2 heterodimerization regulates the choice of downstream target genes.
One possibility is that GSK3 controls the choice of Neurog2 transcriptional target, thereby changing how Neurog2 functions at different developmental stages. Indeed, Neurog2 function is not lost, but rather modified in the late cortex, when it is no longer required to control neuronal fate specification, but rather controls events such as cortical progenitor transitions, neuronal migration, and neuronal morphogenesis (Hand et al., 2005; Britz et al., 2006; Ge et al., 2006; Heng et al., 2008). Other events also change over the same developmental window. For instance, the length of G1 phase of the cell cycle increases over developmental times, as does the number of cortical progenitors that undergo neurogenic as opposed to proliferative divisions (Dehay and Kennedy, 2007). Consistent with a functional link between G1 length and the mode of cell division, the artificial lengthening of G1 promotes precocious neurogenesis (Calegari and Huttner, 2003). Mechanistically, the increase in cell cycle length is thought to provide progenitor cells with a longer time to integrate differentiative signals, which they respond to by exiting the cell cycle (Dehay and Kennedy, 2007). Conversely, when cell cycle length is shorter, progenitors have insufficient time to respond to environmental signals, and hence, they continue cycling (Burdon et al., 2002). An inherent assumption in this regulatory logic is that the genes that promote neuronal differentiation must also be temporally controlled so that they function at the correct times in development. We suggest that GSK3-mediated regulation of Neurog2 proneural activity contributes to these developmental transitions.
In summary, our data support a model in which changing GSK3 activity levels serves as a molecular clock to switch off a rapid, Neurog2-mediated neuronal differentiation program during late phases of corticogenesis. This switching does not abrogate Neurog2 function, but merely blunts it, allowing Neurog2 to activate its neuronal target genes more slowly in accordance with the requirement for much longer neuronal precursor maturation times at later developmental stages, or alternatively, differentially biases Neurog2-mediated activation of different target genes. In this way, dynamic GSK3 activity may control the relative size of neuronal cohorts destined for specific lamina. Indeed, GSK3 has previously been shown to play an analogous role in the Xenopus retina (Moore et al., 2002), and phosphoinositol-3 kinase signaling, which directly inhibits GSK3 function, likewise controls the timing of neuronal determination in the Drosophila retina independently of fate (Bateman and McNeill, 2004).
Footnotes
This work was supported by Canadian Institutes of Health Research (CIHR) Operating Grant MOP-44094 (C.S.). C.S. is an Alberta Innovates Health Solutions (AIHS) Senior Scholar. J.A.C. is an AIHS Clinical Investigator. P.M., S.L., and C.K. were supported by a CIHR Training Grant in Genetics, Child Development and Health, and P.M. was supported by a Heart and Stroke Foundation Studentship, an Alberta Heritage Foundation for Medical Research (AHFMR) Studentship, a CIHR Canada Graduate Scholarship, a Killam Trust Award, and a Lionel E. McLeod Health Research Scholarship (AHFMR). We thank F. Guillemot, A. Gossler, M. J. Tsai, T. Franke, R. Kageyama, C. Logan, Y. Ma, A. Nagafuchi, S. Pfaff, F. Polleux, J. Drouin, S. Sokol, S. Morton, F. Vaccarino, J. Cross, N. Jing, and J. Woodgett for generously providing reagents; Jacques Drouin, Frédéric Charron, Magdalena Götz, and Monica Vetter for insightful discussions; and Salma Shivji, Lisa Marie Langevin, and Natasha Klenin for technical support.
The authors declare no competing financial interests.
References
- Alam S, Zinyk D, Ma L, Schuurmans C. Members of the Plag gene family are expressed in complementary and overlapping regions in the developing murine nervous system. Dev Dyn. 2005;234:772–782. doi: 10.1002/dvdy.20577. [DOI] [PubMed] [Google Scholar]
- Ali F, Hindley C, McDowell G, Deibler R, Jones A, Kirschner M, Guillemot F, Philpott A. Cell cycle-regulated multi-site phosphorylation of Neurogenin 2 coordinates cell cycling with differentiation during neurogenesis. Development. 2011;138:4267–4277. doi: 10.1242/dev.067900. [DOI] [PMC free article] [PubMed] [Google Scholar]
- Anselmo MA, Dalvin S, Prodhan P, Komatsuzaki K, Aidlen JT, Schnitzer JJ, Wu JY, Kinane TB. Slit and robo: expression patterns in lung development. Gene Expr Patterns. 2003;3:13–19. doi: 10.1016/s1567-133x(02)00095-9. [DOI] [PubMed] [Google Scholar]
- Arber S, Ladle DR, Lin JH, Frank E, Jessell TM. ETS gene Er81 controls the formation of functional connections between group Ia sensory afferents and motor neurons. Cell. 2000;101:485–498. doi: 10.1016/s0092-8674(00)80859-4. [DOI] [PubMed] [Google Scholar]
- Arnold SJ, Huang GJ, Cheung AF, Era T, Nishikawa S, Bikoff EK, Molnár Z, Robertson EJ, Groszer M. The T-box transcription factor Eomes/Tbr2 regulates neurogenesis in the cortical subventricular zone. Genes Dev. 2008;22:2479–2484. doi: 10.1101/gad.475408. [DOI] [PMC free article] [PubMed] [Google Scholar]
- Asprer JS, Lee B, Wu CS, Vadakkan T, Dickinson ME, Lu HC, Lee SK. LMO4 functions as a co-activator of neurogenin 2 in the developing cortex. Development. 2011;138:2823–2832. doi: 10.1242/dev.061879. [DOI] [PMC free article] [PubMed] [Google Scholar]
- Backman M, Machon O, Mygland L, van den Bout CJ, Zhong W, Taketo MM, Krauss S. Effects of canonical Wnt signaling on dorso-ventral specification of the mouse telencephalon. Dev Biol. 2005;279:155–168. doi: 10.1016/j.ydbio.2004.12.010. [DOI] [PubMed] [Google Scholar]
- Bateman JM, McNeill H. Temporal control of differentiation by the insulin receptor/tor pathway in Drosophila. Cell. 2004;119:87–96. doi: 10.1016/j.cell.2004.08.028. [DOI] [PubMed] [Google Scholar]
- Bertrand N, Castro DS, Guillemot F. Proneural genes and the specification of neural cell types. Nat Rev Neurosci. 2002;3:517–530. doi: 10.1038/nrn874. [DOI] [PubMed] [Google Scholar]
- Britz O, Mattar P, Nguyen L, Langevin LM, Zimmer C, Alam S, Guillemot F, Schuurmans C. A role for proneural genes in the maturation of cortical progenitor cells. Cereb Cortex. 2006;16:i138–i151. doi: 10.1093/cercor/bhj168. [DOI] [PubMed] [Google Scholar]
- Burdon T, Smith A, Savatier P. Signalling, cell cycle and pluripotency in embryonic stem cells. Trends Cell Biol. 2002;12:432–438. doi: 10.1016/s0962-8924(02)02352-8. [DOI] [PubMed] [Google Scholar]
- Calegari F, Huttner WB. An inhibition of cyclin-dependent kinases that lengthens, but does not arrest, neuroepithelial cell cycle induces premature neurogenesis. J Cell Sci. 2003;116:4947–4955. doi: 10.1242/jcs.00825. [DOI] [PubMed] [Google Scholar]
- Castanon I, Von Stetina S, Kass J, Baylies MK. Dimerization partners determine the activity of the Twist bHLH protein during Drosophila mesoderm development. Development. 2001;128:3145–3159. doi: 10.1242/dev.128.16.3145. [DOI] [PubMed] [Google Scholar]
- Castro DS, Skowronska-Krawczyk D, Armant O, Donaldson IJ, Parras C, Hunt C, Critchley JA, Nguyen L, Gossler A, Göttgens B, Matter JM, Guillemot F. Proneural bHLH and Brn proteins coregulate a neurogenic program through cooperative binding to a conserved DNA motif. Dev Cell. 2006;11:831–844. doi: 10.1016/j.devcel.2006.10.006. [DOI] [PubMed] [Google Scholar]
- Caviness VS., Jr Neocortical histogenesis in normal and reeler mice: a developmental study based upon [3H]thymidine autoradiography. Brain Res. 1982;256:293–302. doi: 10.1016/0165-3806(82)90141-9. [DOI] [PubMed] [Google Scholar]
- Caviness VS, Jr, Takahashi T, Nowakowski RS. Numbers, time and neocortical neuronogenesis: a general developmental and evolutionary model. Trends Neurosci. 1995;18:379–383. doi: 10.1016/0166-2236(95)93933-o. [DOI] [PubMed] [Google Scholar]
- Chenn A, Walsh CA. Regulation of cerebral cortical size by control of cell cycle exit in neural precursors. Science. 2002;297:365–369. doi: 10.1126/science.1074192. [DOI] [PubMed] [Google Scholar]
- Cole A, Frame S, Cohen P. Further evidence that the tyrosine phosphorylation of glycogen synthase kinase-3 (GSK3) in mammalian cells is an autophosphorylation event. Biochem J. 2004;377:249–255. doi: 10.1042/BJ20031259. [DOI] [PMC free article] [PubMed] [Google Scholar]
- Cross DA, Alessi DR, Cohen P, Andjelkovich M, Hemmings BA. Inhibition of glycogen synthase kinase-3 by insulin mediated by protein kinase B. Nature. 1995;378:785–789. doi: 10.1038/378785a0. [DOI] [PubMed] [Google Scholar]
- Dehay C, Kennedy H. Cell-cycle control and cortical development. Nat Rev Neurosci. 2007;8:438–450. doi: 10.1038/nrn2097. [DOI] [PubMed] [Google Scholar]
- Demers C, Chaturvedi CP, Ranish JA, Juban G, Lai P, Morle F, Aebersold R, Dilworth FJ, Groudine M, Brand M. Activator-mediated recruitment of the MLL2 methyltransferase complex to the beta-globin locus. Mol Cell. 2007;27:573–584. doi: 10.1016/j.molcel.2007.06.022. [DOI] [PMC free article] [PubMed] [Google Scholar]
- Dixit R, Lu F, Cantrup R, Gruenig N, Langevin LM, Kurrasch DM, Schuurmans C. Efficient gene delivery into multiple CNS territories using in utero electroporation. J Vis Exp. 2011;2011:2957. doi: 10.3791/2957. pii. [DOI] [PMC free article] [PubMed] [Google Scholar]
- Dominguez I, Itoh K, Sokol SY. Role of glycogen synthase kinase 3 beta as a negative regulator of dorsoventral axis formation in Xenopus embryos. Proc Natl Acad Sci U S A. 1995;92:8498–8502. doi: 10.1073/pnas.92.18.8498. [DOI] [PMC free article] [PubMed] [Google Scholar]
- Englund C, Fink A, Lau C, Pham D, Daza RA, Bulfone A, Kowalczyk T, Hevner RF. Pax6, Tbr2, and Tbr1 are expressed sequentially by radial glia, intermediate progenitor cells, and postmitotic neurons in developing neocortex. J Neurosci. 2005;25:247–251. doi: 10.1523/JNEUROSCI.2899-04.2005. [DOI] [PMC free article] [PubMed] [Google Scholar]
- Estivill-Torrus G, Pearson H, van Heyningen V, Price DJ, Rashbass P. Pax6 is required to regulate the cell cycle and the rate of progression from symmetrical to asymmetrical division in mammalian cortical progenitors. Development. 2002;129:455–466. doi: 10.1242/dev.129.2.455. [DOI] [PubMed] [Google Scholar]
- Faedo A, Tomassy GS, Ruan Y, Teichmann H, Krauss S, Pleasure SJ, Tsai SY, Tsai MJ, Studer M, Rubenstein JL. COUP-TFI coordinates cortical patterning, neurogenesis, and laminar fate and modulates MAPK/ERK, AKT, and beta-catenin signaling. Cereb Cortex. 2008;18:2117–2131. doi: 10.1093/cercor/bhm238. [DOI] [PMC free article] [PubMed] [Google Scholar]
- Fang X, Yu SX, Lu Y, Bast RC, Jr, Woodgett JR, Mills GB. Phosphorylation and inactivation of glycogen synthase kinase 3 by protein kinase A. Proc Natl Acad Sci U S A. 2000;97:11960–11965. doi: 10.1073/pnas.220413597. [DOI] [PMC free article] [PubMed] [Google Scholar]
- Farah MH, Olson JM, Sucic HB, Hume RI, Tapscott SJ, Turner DL. Generation of neurons by transient expression of neural bHLH proteins in mammalian cells. Development. 2000;127:693–702. doi: 10.1242/dev.127.4.693. [DOI] [PubMed] [Google Scholar]
- Farkas LM, Haffner C, Giger T, Khaitovich P, Nowick K, Birchmeier C, Pääbo S, Huttner WB. Insulinoma-associated 1 has a panneurogenic role and promotes the generation and expansion of basal progenitors in the developing mouse neocortex. Neuron. 2008;60:40–55. doi: 10.1016/j.neuron.2008.09.020. [DOI] [PubMed] [Google Scholar]
- Firulli BA, Redick BA, Conway SJ, Firulli AB. Mutations within helix I of Twist1 result in distinct limb defects and variation of DNA binding affinities. J Biol Chem. 2007;282:27536–27546. doi: 10.1074/jbc.M702613200. [DOI] [PMC free article] [PubMed] [Google Scholar]
- Flora A, Garcia JJ, Thaller C, Zoghbi HY. The E-protein Tcf4 interacts with Math1 to regulate differentiation of a specific subset of neuronal progenitors. Proc Natl Acad Sci U S A. 2007;104:15382–15387. doi: 10.1073/pnas.0707456104. [DOI] [PMC free article] [PubMed] [Google Scholar]
- Fode C, Ma Q, Casarosa S, Ang SL, Anderson DJ, Guillemot F. A role for neural determination genes in specifying the dorsoventral identity of telencephalic neurons. Genes Dev. 2000;14:67–80. [PMC free article] [PubMed] [Google Scholar]
- Fremeau RT, Jr, Troyer MD, Pahner I, Nygaard GO, Tran CH, Reimer RJ, Bellocchio EE, Fortin D, Storm-Mathisen J, Edwards RH. The expression of vesicular glutamate transporters defines two classes of excitatory synapse. Neuron. 2001;31:247–260. doi: 10.1016/s0896-6273(01)00344-0. [DOI] [PubMed] [Google Scholar]
- Fukumitsu H, Ohtsuka M, Murai R, Nakamura H, Itoh K, Furukawa S. Brain-derived neurotrophic factor participates in determination of neuronal laminar fate in the developing mouse cerebral cortex. J Neurosci. 2006;26:13218–13230. doi: 10.1523/JNEUROSCI.4251-06.2006. [DOI] [PMC free article] [PubMed] [Google Scholar]
- Gaspard N, Bouschet T, Hourez R, Dimidschstein J, Naeije G, van den Ameele J, Espuny-Camacho I, Herpoel A, Passante L, Schiffmann SN, Gaillard A, Vanderhaeghen P. An intrinsic mechanism of corticogenesis from embryonic stem cells. Nature. 2008;455:351–357. doi: 10.1038/nature07287. [DOI] [PubMed] [Google Scholar]
- Ge W, He F, Kim KJ, Blanchi B, Coskun V, Nguyen L, Wu X, Zhao J, Heng JI, Martinowich K, Tao J, Wu H, Castro D, Sobeih MM, Corfas G, Gleeson JG, Greenberg ME, Guillemot F, Sun YE. Coupling of cell migration with neurogenesis by proneural bHLH factors. Proc Natl Acad Sci U S A. 2006;103:1319–1324. doi: 10.1073/pnas.0510419103. [DOI] [PMC free article] [PubMed] [Google Scholar]
- Götz M, Huttner WB. The cell biology of neurogenesis. Nat Rev Mol Cell Biol. 2005;6:777–788. doi: 10.1038/nrm1739. [DOI] [PubMed] [Google Scholar]
- Gradwohl G, Fode C, Guillemot F. Restricted expression of a novel murine atonal-related bHLH protein in undifferentiated neural precursors. Dev Biol. 1996;180:227–241. doi: 10.1006/dbio.1996.0297. [DOI] [PubMed] [Google Scholar]
- Hand R, Bortone D, Mattar P, Nguyen L, Heng JI, Guerrier S, Boutt E, Peters E, Barnes AP, Parras C, Schuurmans C, Guillemot F, Polleux F. Phosphorylation of Neurogenin2 specifies the migration properties and the dendritic morphology of pyramidal neurons in the neocortex. Neuron. 2005;48:45–62. doi: 10.1016/j.neuron.2005.08.032. [DOI] [PubMed] [Google Scholar]
- Haubensak W, Attardo A, Denk W, Huttner WB. Neurons arise in the basal neuroepithelium of the early mammalian telencephalon: a major site of neurogenesis. Proc Natl Acad Sci U S A. 2004;101:3196–3201. doi: 10.1073/pnas.0308600100. [DOI] [PMC free article] [PubMed] [Google Scholar]
- Heng JI, Nguyen L, Castro DS, Zimmer C, Wildner H, Armant O, Skowronska-Krawczyk D, Bedogni F, Matter JM, Hevner R, Guillemot F. Neurogenin 2 controls cortical neuron migration through regulation of Rnd2. Nature. 2008;455:114–118. doi: 10.1038/nature07198. [DOI] [PubMed] [Google Scholar]
- Hevner RF, Shi L, Justice N, Hsueh Y, Sheng M, Smiga S, Bulfone A, Goffinet AM, Campagnoni AT, Rubenstein JL. Tbr1 regulates differentiation of the preplate and layer 6. Neuron. 2001;29:353–366. doi: 10.1016/s0896-6273(01)00211-2. [DOI] [PubMed] [Google Scholar]
- Hirabayashi Y, Itoh Y, Tabata H, Nakajima K, Akiyama T, Masuyama N, Gotoh Y. The Wnt/beta-catenin pathway directs neuronal differentiation of cortical neural precursor cells. Development. 2004;131:2791–2801. doi: 10.1242/dev.01165. [DOI] [PubMed] [Google Scholar]
- Hirata T, Suda Y, Nakao K, Narimatsu M, Hirano T, Hibi M. Zinc finger gene fez-like functions in the formation of subplate neurons and thalamocortical axons. Dev Dyn. 2004;230:546–556. doi: 10.1002/dvdy.20068. [DOI] [PubMed] [Google Scholar]
- Huang HP, Liu M, El-Hodiri HM, Chu K, Jamrich M, Tsai MJ. Regulation of the pancreatic islet-specific gene BETA2 (neuroD) by neurogenin 3. Mol Cell Biol. 2000;20:3292–3307. doi: 10.1128/mcb.20.9.3292-3307.2000. [DOI] [PMC free article] [PubMed] [Google Scholar]
- Hur EM, Zhou FQ. GSK3 signalling in neural development. Nat Rev Neurosci. 2010;11:539–551. doi: 10.1038/nrn2870. [DOI] [PMC free article] [PubMed] [Google Scholar]
- Jones ME, Zhuang Y. Stage-specific functions of E-proteins at the beta-selection and T-cell receptor checkpoints during thymocyte development. Immunol Res. 2011;49:202–215. doi: 10.1007/s12026-010-8182-x. [DOI] [PubMed] [Google Scholar]
- Kim WY, Wang X, Wu Y, Doble BW, Patel S, Woodgett JR, Snider WD. GSK-3 is a master regulator of neural progenitor homeostasis. Nat Neurosci. 2009;12:1390–1397. doi: 10.1038/nn.2408. [DOI] [PMC free article] [PubMed] [Google Scholar]
- Kowalczyk T, Pontious A, Englund C, Daza RA, Bedogni F, Hodge R, Attardo A, Bell C, Huttner WB, Hevner RF. Intermediate neuronal progenitors (basal progenitors) produce pyramidal-projection neurons for all layers of cerebral cortex. Cereb Cortex. 2009;19:2439–2450. doi: 10.1093/cercor/bhn260. [DOI] [PMC free article] [PubMed] [Google Scholar]
- Kriegstein AR, Noctor SC. Patterns of neuronal migration in the embryonic cortex. Trends Neurosci. 2004;27:392–399. doi: 10.1016/j.tins.2004.05.001. [DOI] [PubMed] [Google Scholar]
- Langevin LM, Mattar P, Scardigli R, Roussigné M, Logan C, Blader P, Schuurmans C. Validating in utero electroporation for the rapid analysis of gene regulatory elements in the murine telencephalon. Dev Dyn. 2007;236:1273–1286. doi: 10.1002/dvdy.21126. [DOI] [PubMed] [Google Scholar]
- Lee JE, Hollenberg SM, Snider L, Turner DL, Lipnick N, Weintraub H. Conversion of Xenopus ectoderm into neurons by NeuroD, a basic helix-loop-helix protein. Science. 1995;268:836–844. doi: 10.1126/science.7754368. [DOI] [PubMed] [Google Scholar]
- Lluís F, Ballestar E, Suelves M, Esteller M, Muñoz-Cánoves P. E47 phosphorylation by p38 MAPK promotes MyoD/E47 association and muscle-specific gene transcription. EMBO J. 2005;24:974–984. doi: 10.1038/sj.emboj.7600528. [DOI] [PMC free article] [PubMed] [Google Scholar]
- Lo L, Dormand E, Greenwood A, Anderson DJ. Comparison of the generic neuronal differentiation and neuron subtype specification functions of mammalian achaete-scute and atonal homologs in cultured neural progenitor cells. Development. 2002;129:1553–1567. doi: 10.1242/dev.129.7.1553. [DOI] [PubMed] [Google Scholar]
- Londhe P, Davie JK. Sequential association of myogenic regulatory factors and E proteins at muscle-specific genes. Skelet Muscle. 2011;1:14. doi: 10.1186/2044-5040-1-14. [DOI] [PMC free article] [PubMed] [Google Scholar]
- Ma YC, Song MR, Park JP, Henry Ho HY, Hu L, Kurtev MV, Zieg J, Ma Q, Pfaff SL, Greenberg ME. Regulation of motor neuron specification by phosphorylation of neurogenin 2. Neuron. 2008;58:65–77. doi: 10.1016/j.neuron.2008.01.037. [DOI] [PMC free article] [PubMed] [Google Scholar]
- Machon O, Backman M, Machonova O, Kozmik Z, Vacik T, Andersen L, Krauss S. A dynamic gradient of Wnt signaling controls initiation of neurogenesis in the mammalian cortex and cellular specification in the hippocampus. Dev Biol. 2007;311:223–237. doi: 10.1016/j.ydbio.2007.08.038. [DOI] [PubMed] [Google Scholar]
- Marcus EA, Kintner C, Harris W. The role of GSK3beta in regulating neuronal differentiation in Xenopus laevis. Mol Cell Neurosci. 1998;12:269–280. doi: 10.1006/mcne.1998.0713. [DOI] [PubMed] [Google Scholar]
- Massari ME, Murre C. Helix-loop-helix proteins: regulators of transcription in eucaryotic organisms. Mol Cell Biol. 2000;20:429–440. doi: 10.1128/mcb.20.2.429-440.2000. [DOI] [PMC free article] [PubMed] [Google Scholar]
- Mattar P, Langevin LM, Markham K, Klenin N, Shivji S, Zinyk D, Schuurmans C. Basic helix-loop-helix transcription factors cooperate to specify a cortical projection neuron identity. Mol Cell Biol. 2008;28:1456–1469. doi: 10.1128/MCB.01510-07. [DOI] [PMC free article] [PubMed] [Google Scholar]
- McConnell SK, Kaznowski CE. Cell cycle dependence of laminar determination in developing neocortex. Science. 1991;254:282–285. doi: 10.1126/science.254.5029.282. [DOI] [PubMed] [Google Scholar]
- Miyata T, Kawaguchi A, Saito K, Kawano M, Muto T, Ogawa M. Asymmetric production of surface-dividing and non-surface-dividing cortical progenitor cells. Development. 2004;131:3133–3145. doi: 10.1242/dev.01173. [DOI] [PubMed] [Google Scholar]
- Mohamed OA, Dufort D, Clarke HJ. Expression and estradiol regulation of Wnt genes in the mouse blastocyst identify a candidate pathway for embryo-maternal signaling at implantation. Biol Reprod. 2004;71:417–424. doi: 10.1095/biolreprod.103.025692. [DOI] [PubMed] [Google Scholar]
- Moore KB, Schneider ML, Vetter ML. Posttranslational mechanisms control the timing of bHLH function and regulate retinal cell fate. Neuron. 2002;34:183–195. doi: 10.1016/s0896-6273(02)00666-9. [DOI] [PubMed] [Google Scholar]
- Mutch CA, Funatsu N, Monuki ES, Chenn A. β-Catenin signaling levels in progenitors influence the laminar cell fates of projection neurons. J Neurosci. 2009;29:13710–13719. doi: 10.1523/JNEUROSCI.3022-09.2009. [DOI] [PMC free article] [PubMed] [Google Scholar]
- Neuhold LA, Wold B. HLH forced dimers: tethering MyoD to E47 generates a dominant positive myogenic factor insulated from negative regulation by Id. Cell. 1993;74:1033–1042. doi: 10.1016/0092-8674(93)90725-6. [DOI] [PubMed] [Google Scholar]
- Nguyen L, Besson A, Heng JI, Schuurmans C, Teboul L, Parras C, Philpott A, Roberts JM, Guillemot F. p27kip1 independently promotes neuronal differentiation and migration in the cerebral cortex. Genes Dev. 2006;20:1511–1524. doi: 10.1101/gad.377106. [DOI] [PMC free article] [PubMed] [Google Scholar]
- Noctor SC, Martínez-Cerdeño V, Ivic L, Kriegstein AR. Cortical neurons arise in symmetric and asymmetric division zones and migrate through specific phases. Nat Neurosci. 2004;7:136–144. doi: 10.1038/nn1172. [DOI] [PubMed] [Google Scholar]
- Ohkawara T, Shintani T, Saegusa C, Yuasa-Kawada J, Takahashi M, Noda M. A novel basic helix-loop-helix (bHLH) transcriptional repressor, NeuroAB, expressed in bipolar and amacrine cells in the chick retina. Brain Res Mol Brain Res. 2004;128:58–74. doi: 10.1016/j.molbrainres.2004.06.004. [DOI] [PubMed] [Google Scholar]
- Oishi K, Watatani K, Itoh Y, Okano H, Guillemot F, Nakajima K, Gotoh Y. Selective induction of neocortical GABAergic neurons by the PDK1-Akt pathway through activation of Mash1. Proc Natl Acad Sci U S A. 2009;106:13064–13069. doi: 10.1073/pnas.0808400106. [DOI] [PMC free article] [PubMed] [Google Scholar]
- Pearson BJ, Doe CQ. Specification of temporal identity in the developing nervous system. Annu Rev Cell Dev Biol. 2004;20:619–647. doi: 10.1146/annurev.cellbio.19.111301.115142. [DOI] [PubMed] [Google Scholar]
- Perez-Moreno MA, Locascio A, Rodrigo I, Dhondt G, Portillo F, Nieto MA, Cano A. A new role for E12/E47 in the repression of E-cadherin expression and epithelial-mesenchymal transitions. J Biol Chem. 2001;276:27424–27431. doi: 10.1074/jbc.M100827200. [DOI] [PubMed] [Google Scholar]
- Quinn JC, Molinek M, Martynoga BS, Zaki PA, Faedo A, Bulfone A, Hevner RF, West JD, Price DJ. Pax6 controls cerebral cortical cell number by regulating exit from the cell cycle and specifies cortical cell identity by a cell autonomous mechanism. Dev Biol. 2007;302:50–65. doi: 10.1016/j.ydbio.2006.08.035. [DOI] [PMC free article] [PubMed] [Google Scholar]
- Schaeren-Wiemers N, Andre E, Kapfhammer JP, Becker-Andre M. The expression pattern of the orphan nuclear receptor RORbeta in the developing and adult rat nervous system suggests a role in the processing of sensory information and in circadian rhythm. Eur J Neurosci. 1997;9:2687–2701. doi: 10.1111/j.1460-9568.1997.tb01698.x. [DOI] [PubMed] [Google Scholar]
- Schuurmans C, Armant O, Nieto M, Stenman JM, Britz O, Klenin N, Brown C, Langevin LM, Seibt J, Tang H, Cunningham JM, Dyck R, Walsh C, Campbell K, Polleux F, Guillemot F. Sequential phases of cortical specification involve Neurogenin-dependent and -independent pathways. EMBO J. 2004;23:2892–2902. doi: 10.1038/sj.emboj.7600278. [DOI] [PMC free article] [PubMed] [Google Scholar]
- Sessa A, Mao CA, Hadjantonakis AK, Klein WH, Broccoli V. Tbr2 directs conversion of radial glia into basal precursors and guides neuronal amplification by indirect neurogenesis in the developing neocortex. Neuron. 2008;60:56–69. doi: 10.1016/j.neuron.2008.09.028. [DOI] [PMC free article] [PubMed] [Google Scholar]
- Shen Q, Wang Y, Dimos JT, Fasano CA, Phoenix TN, Lemischka IR, Ivanova NB, Stifani S, Morrisey EE, Temple S. The timing of cortical neurogenesis is encoded within lineages of individual progenitor cells. Nat Neurosci. 2006;9:743–751. doi: 10.1038/nn1694. [DOI] [PubMed] [Google Scholar]
- Smart IH, Smart M. The location of nuclei of different labelling intensities in autoradiographs of the anterior forebrain of postnatial mice injected with [3H]thymidine on the eleventh and twelfth days post-conception. J Anat. 1977;123:515–525. [PMC free article] [PubMed] [Google Scholar]
- Stambolic V, Woodgett JR. Mitogen inactivation of glycogen synthase kinase-3 beta in intact cells via serine 9 phosphorylation. Biochem J. 1994;303:701–704. doi: 10.1042/bj3030701. [DOI] [PMC free article] [PubMed] [Google Scholar]
- Sun Y, Meijer DH, Alberta JA, Mehta S, Kane MF, Tien AC, Fu H, Petryniak MA, Potter GB, Liu Z, Powers JF, Runquist IS, Rowitch DH, Stiles CD. Phosphorylation state of Olig2 regulates proliferation of neural progenitors. Neuron. 2011;69:906–917. doi: 10.1016/j.neuron.2011.02.005. [DOI] [PMC free article] [PubMed] [Google Scholar]
- Supèr H, Soriano E, Uylings HB. The functions of the preplate in development and evolution of the neocortex and hippocampus. Brain Res Brain Res Rev. 1998;27:40–64. doi: 10.1016/s0165-0173(98)00005-8. [DOI] [PubMed] [Google Scholar]
- Taelman VF, Dobrowolski R, Plouhinec JL, Fuentealba LC, Vorwald PP, Gumper I, Sabatini DD, De Robertis EM. Wnt signaling requires sequestration of glycogen synthase kinase 3 inside multivesicular endosomes. Cell. 2010;143:1136–1148. doi: 10.1016/j.cell.2010.11.034. [DOI] [PMC free article] [PubMed] [Google Scholar]
- Takahashi T, Goto T, Miyama S, Nowakowski RS, Caviness VS., Jr Sequence of neuron origin and neocortical laminar fate: relation to cell cycle of origin in the developing murine cerebral wall. J Neurosci. 1999;19:10357–10371. doi: 10.1523/JNEUROSCI.19-23-10357.1999. [DOI] [PMC free article] [PubMed] [Google Scholar]
- Talikka M, Perez SE, Zimmerman K. Distinct patterns of downstream target activation are specified by the helix-loop-helix domain of proneural basic helix-loop-helix transcription factors. Dev Biol. 2002;247:137–148. doi: 10.1006/dbio.2002.0677. [DOI] [PubMed] [Google Scholar]
- Vosper JM, Fiore-Heriche CS, Horan I, Wilson K, Wise H, Philpott A. Regulation of neurogenin stability by ubiquitin-mediated proteolysis. Biochem J. 2007;407:277–284. doi: 10.1042/BJ20070064. [DOI] [PMC free article] [PubMed] [Google Scholar]
- Welinder E, Mansson R, Mercer EM, Bryder D, Sigvardsson M, Murre C. The transcription factors E2A and HEB act in concert to induce the expression of FOXO1 in the common lymphoid progenitor. Proc Natl Acad Sci U S A. 2011;108:17402–17407. doi: 10.1073/pnas.1111766108. [DOI] [PMC free article] [PubMed] [Google Scholar]
- Xu ZP, Dutra A, Stellrecht CM, Wu C, Piatigorsky J, Saunders GF. Functional and structural characterization of the human gene BHLHB5, encoding a basic helix-loop-helix transcription factor. Genomics. 2002;80:311–318. doi: 10.1006/geno.2002.6833. [DOI] [PubMed] [Google Scholar]
- Yang Q, Esplin B, Borghesi L. E47 regulates hematopoietic stem cell proliferation and energetics but not myeloid lineage restriction. Blood. 2011;117:3529–3538. doi: 10.1182/blood-2010-07-297689. [DOI] [PMC free article] [PubMed] [Google Scholar]