

Abstract
Genetic disorders arising from copy number variations in the ERK (extracellular signal-regulated kinase) MAP (mitogen-activated protein) kinases or mutations in their upstream regulators that result in neuro-cardio-facial-cutaneous syndromes are associated with developmental abnormalities, cognitive deficits, and autism. We developed murine models of these disorders by deleting the ERKs at the beginning of neurogenesis and report disrupted cortical progenitor generation and proliferation, which leads to altered cytoarchitecture of the postnatal brain in a gene-dose-dependent manner. We show that these changes are due to ERK-dependent dysregulation of cyclin D1 and p27Kip1, resulting in cell cycle elongation, favoring neurogenic over self-renewing divisions. The precocious neurogenesis causes premature progenitor pool depletion, altering the number and distribution of pyramidal neurons. Importantly, loss of ERK2 alters the intrinsic excitability of cortical neurons and contributes to perturbations in global network activity. These changes are associated with elevated anxiety and impaired working and hippocampal-dependent memory in these mice. This study provides a novel mechanistic insight into the basis of cortical malformation which may provide a potential link to cognitive deficits in individuals with altered ERK activity.
Introduction
The ERK (extracellular signal-regulated kinase) MAP (mitogen-activated protein) kinases, ERK1 and ERK2, are the central elements of a prominent signaling pathway governing neural development (Samuels et al., 2009). Chromosomal duplications/deletions of 16p11.2, which includes the MAPK3 gene encoding ERK1, are the most common genetic cause of autism (Campbell et al., 2008; Fernandez et al., 2010). Moreover, Saitta and others identified a cohort of patients with a 1 Mb microdeletion on chromosome 22, which encompasses the MAPK1 (ERK2) gene (Saitta et al., 2004). These individuals exhibit neurodevelopmental deficits indistinguishable from classical DiGeorge syndrome. Similarly, gain or loss of function mutations of upstream elements of the ERK signaling pathway lead to a number of clinically related disorders termed neuro-cardio-facial-cutaneous (NCFC) syndromes (Tidyman and Rauen, 2008). Affected children exhibit overlapping phenotypes including deficits in brain, heart, face, and skin development and high incidence of cognitive and psychiatric impairment. Thus, mutations affecting ERK signaling are a significant genetic cause of neurodevelopmental disorders in humans. To elucidate the precise mechanisms underlying the structural and functional deficits resulting from perturbations in the ERK signaling, we developed murine models of NCFC and related syndromes in which ERKs are genetically inactivated within the developing dorsal telencephalon.
The events coordinating the temporal and spatial organization of the developing cortex are tightly coupled to cell cycle dynamics. The size of the cortex is determined by strict control of progenitor divisions. The total cell cycle length, G1 length, and the number of cells exiting the cycle increase as neurogenesis proceeds (Rakic and Caviness, 1995). Huttner and colleagues demonstrated that elongation of G1 favors neurogenic divisions (Lange et al., 2009). Two potent G1 regulators are directly controlled by the ERKs: cyclin D1 and p27Kip1. Cyclin D1 is highly expressed in the proliferative zones and transcriptionally controlled by the ERKs (Glickstein et al., 2007). p27Kip1, a Cdk inhibitor, modulates the G1-to-S phase transition and is phosphorylated by the ERKs, allowing cell cycle progression (Sherr and Roberts, 1999).
Little is known about the exact roles of ERK1 and ERK2 during cortical development. We previously reported progenitor proliferation deficits when ERK2 was inactivated at midneurogenesis (Samuels et al., 2008). However, ERK activity strongly mirrors the neurogenic gradient in the ventricular zone during early development. Therefore, we targeted its deletion to this specific and pivotal time to examine its exact function and mechanism of action within the developing cortex. We generated a novel mouse model in which ERK2 is inactivated using Emx1-cre on wild type [conditional knock-out (CKO)] or an ERK1-null background [double knock-out (DKO)]. We report (1) that loss of ERK2 results in microcephaly with perturbations in the number of projection neurons; (2) that these deficits arise from ERK-dependent dysregulation of progenitor generation and proliferation; (3) that altered cytoarchitecture disrupts cortical circuitry and network dynamics; (4) that loss of ERK2 alters the intrinsic excitability of cortical neurons; and (5) that these effects are associated with anxiety and cognitive deficits. Thus, we suggest that loss of ERK activity may underlie the broad spectrum of clinical deficits associated with NCFC syndromes, distal 22q11 deletion syndrome, and autism.
Materials and Methods
Mice.
All mice were bred on C57BL/6J background as previously described (Samuels et al., 2008). Emx1-cre mice (Jackson Laboratory) were crossed with ERK2 floxed mice. The Emx-1 allele induces recombination in progenitors and stem cells of the dorsal telencephalon by E9.5 (Gorski et al., 2002). The day of vaginal plug was designated as 0.5 (E0.5). Experiments were performed in accordance with the Case Western Reserve University Institutional Animal Care and Use Committee.
Immunohistochemistry.
Postnatal mouse brains were fixed in 4% PFA in 1× PBS at 4°C overnight, whereas embryonic brains were dissected in PBS and immersion fixed in 4% PFA for 1 h. Ten micron cryostat sections were rehydrated in PBS and antigen retrieval using 1× Reveal Decloaker (Biocare Medical) was performed for 10 min at 95°C. Next, sections were blocked in 10% (embryonic) and 2% (postnatal) normal goat or donkey serum for 1 h at room temperature with 0.1% (v/v) Triton X-100 in PBS. Slides were incubated with primary antibodies overnight at 4°C, washed, and incubated with appropriate secondary antibodies for 1–2 h at room temperature. The primary antibodies used were as follows: polyclonal rabbit anti-pERK (1:100, Cell Signaling Technology), rabbit polyclonal anti-Pax6 (1:300, Covance), mouse monoclonal anti-Pax6 (1:100, Developmental Studies Hybridoma Bank, University of Iowa), rat-anti-BrdU (1:100, Abcam), mouse anti-BrdU (1:100, BD Biosciences), mouse anti-NeuN (1:500, Millipore Bioscience Research Reagents), mouse anti-PH3 (1:250, Millipore), rabbit anti-PH3 (1;500, Millipore), rabbit anti-Tbr1 (1:1000, Millipore Bioscience Research Reagents), rabbit anti-Tbr2 (1:300), goat anti-Brn1 (1:50, Santa Cruz Biotechnology), rat anti-Ctip2 (1:500, Abcam), rabbit anti-Cux1 (1:100, Santa Cruz Biotechnology), mouse anti-SatB2 (1:100, Abcam), and rabbit anti-caspase 3 (1:200, Cell Signaling Technology). Secondary antibodies used were Alexa Fluor 488 (1:1000), 546, or 593 (1:1000) conjugated to goat or donkey anti-mouse, anti-rabbit, or anti-goat (Invitrogen). DNA was stained with 4′,6′-diamidino-2-phenylindole (DAPI) for 5 min (DAPI, Invitrogen).
Western analysis.
Cortices of E14.5 brains were washed with ice-cold HBSS and sonicated in lysis buffer (20 mm Tris, pH 7.5, 150 mm NaCl, 1% NP-40, 10% glycerol, 1 mm EDTA, 1.5 mm MgCl2, 20 mm NaF, and 20 mm β-glycerophosphate) in the presence of protease inhibitors (1 μg/ml leupeptin, 1 μg/ml aprotinin, 1 mm PMSF, and 1 mm Na3VO4). Lysates were centrifuged, and protein concentration was calculated using the bicinchoninic acid assay (Pierce) with BSA as a standard. Equal amounts of protein were boiled in sample buffer, separated by SDS-PAGE gels, and transferred to Immobilon-P polyvinylidene difluoride membranes (Millipore). Membranes were blocked in 3% BSA [or 5% skim-milk powder for β-tubulin (Santa Cruz Biotechnology) in TBS and 0.1% Tween 20 (TBS-T)] for 2 h at room temperature and incubated with primary antibodies overnight at 4°C. The primary antibodies used were as follows: rabbit anti-pERK (1:1000, Cell Signaling Technology), mouse anti-ERK2 (1:3000, BD Biosciences), mouse anti-ERK1 (1:1000, Zymed Laboratories), and anti-β-tubulin (1:5000; Santa Cruz Biotechnology). Membranes were washed with TBS-T, incubated with HRP-conjugated secondary antibodies: goat anti-mouse or anti-rabbit (1:5000, GE Healthcare) in TBS-T with 5% milk for 2 h at room temperature. Detection was performed using either Millipore chemiluminescence or BioMax MR x-ray film (Eastman Kodak). Densitometry was performed using Adobe Photoshop histogram function, and statistical analysis was done with GraphPad Prism software.
BrdU analysis.
Timed pregnant dams were given BrdU (50 mg/kg body weight, Sigma-Aldrich B5002) by intraperitoneal injection and processed for BrdU immunohistochemistry. Standard BrdU labeling was used with an addition of antigen retrieval (10 min in sodium citrate buffer). For pulse-chase labeling of deep cortical neurons, pregnant dams were given a single BrdU injection at E12.5 and embryos were fixed and colabeled with a lamina-specific marker at postnatal day 2 (P2) and P10. Superficial cortical neurons were pulsed with BrdU at E14.5 and colabeled with a layer-specific marker at P2 and P10. Cell cycle exit was analyzed by injecting pregnant mice at E13.5 and fixing embryos at E14.5.
Quantification.
Anatomically matched sections of littermate control and mutant mice were analyzed. At least three sections per animal were analyzed alongside the rostrocaudal axis of the telencephalon. Embryonic coronal sections were evaluated at the level of the midganglionic eminences and analyzed at medial and lateral positions by counting all cells in designated 100 μm-wide boxes. In postnatal brains, coronal sections were used to count cells in 400 μm boxes in somatosensory cortex.
Behavioral analysis.
All tests were performed in conjunction with the Case Western Reserve University Rodent Behavior Core. Three-month-old male mice were evaluated using standardized behavioral tests: elevated plus maze, place preference, open field, continuous alterations and delayed T maze, rotarod, and contextual-fear and cued-fear conditioning. Tests were performed in the order listed above. All testing was completed in the same room during the light cycle between 9:00 A.M. and 6:00 P.M. Mice were single housed with ad libitum access to food and water with a 12 h light/dark cycle. All equipment used was sterilized with 70% ethanol after each use to remove odor cues. The elevated plus maze test was conducted first to avoid its sensitivity to prior experience. Each test was performed at least 48 h apart, so the mice could rest. The tester was blinded to the genotype of each animal.
The elevated plus maze.
The two open and two closed arms forming a cross were placed ∼1 m above the floor and fitted with infrared grid and video tracking system (Med Associates). Individual mice were placed in the center facing the open arm and their activity was analyzed for 5 min. The total time spent in open versus closed arms and the number of entries into each arm were analyzed. The number of head dips and frequency of urination/defecation were noted.
The place preference test.
Two square chambers with dark gray flooring were used. The translucent, lit chamber (20 × 20 cm) was illuminated with 100 W light placed 40 cm above the floor. The dark chamber (15 × 15 cm) had a dark cover. Each mouse was placed in the open chamber facing away from the dark chamber. The movement was recorded for 5 min. Latency to enter into the dark chamber and the number of reentries into light were scored.
The open field test.
A box (40 × 40 cm) was placed in a dimly lit environment. EthoVision XT 5.0 (Noldus Information Technology) was used to digitally subdivide the box area into a 20 × 20 cm center area and a periphery. The peripheral area was further divided into a middle area (inner 10 cm) and an outer area (outer 10 cm) to determine thigmotaxic behavior. Mice were placed in the center and allowed to explore the area freely for 15 min. Locomotor parameters, such as total distance moved, velocity, angular velocity, and heading degrees, were measured to determine basic locomotor activity and presence of stereotypies. Frequency and duration in the center, periphery, and outer quadrants were collected to determine anxiety-like behavior. In addition, data were nested into 5 min bins and distance moved during each of these three periods was recorded to evaluate habituation differences across groups.
Continuous alteration and delayed T maze.
A T-shaped box was marked with different tape designs. The entry arm was perpendicular to the other two arms. All experiments were recorded with EthoVision XT 5.0. For continuous alteration test, the percentage of alterations was recorded for each animal during a 3 min interval. Each mouse was placed in the entry arm not facing the other two arms. For delayed T maze, the mice were habituated to the environment for two consecutive days. The closed arm was chosen at random for each animal. Time in novel arm, number of entries, and total number of entries were scored for each mouse.
Cortical slice preparation.
Parasaggital thalamocortical slices (350 μm) from somatosensory cortex were prepared as described previously (Agmon and Connors, 1991) using young (P13–P18) C57BL/6 wild-type mice and ERK2 CKO mice. Mice were anesthetized with isoflurane and then decapitated using a guillotine. The brain was cut on a vibratome (Leica VT1200) while immersed in ice-cold preoxygenated artificial CSF (aCSF) containing the following: 125 mm NaCl, 2.5 mm KCl, 1 mm MgCl2, 2 mm CaCl2, 25 mm NaHCO3, 1.25 mm NaH2PO4, and 25 mm glucose. Salts and reagents were from Fisher Scientific. Slices were then transferred to an incubating bath containing normal aCSF at room temperature and allowed to equilibrate for 20–40 min before being transferred to the recording chamber.
Electrophysiology.
Whole-cell patch-clamp recordings were executed in layer II/III pyramidal cells (PCs) from thalamocortical slices of mouse somatosensory cortex. Slices were constantly perfused (4 ml/min) with oxygenated aCSF while PCs in layer II/III were identified visually at high magnification (63×) with Kohler illumination using an upright microscope (Zeiss Axioskop 2). Whole-cell recordings in voltage-clamp and current-clamp mode were established in PC somas using pipettes (6–10 MΩ) filled with the following (in mm): 120 potassium gluconate, 2 KCl, 10 HEPES, 10 sodium phosphocreatine, 4 MgATP, 0.3 Na3GTP, and 25 QX314, adjusted to pH 7.4 with KOH. Experiments in which the transient outward K+ current was measured required the addition of 20 mm BAPTA to eliminate contamination with currents generated by Ca2+-activated K+ channels. The transient outward K+ current was measured using previously described protocols under voltage clamp (Eder and Heinemann, 1994). Measurements of miniature postsynaptic currents were performed using a modified internal pipette solution containing the following (in mm): 120 cesium gluconate, 2 CsCl, 10 HEPES, 10 sodium phosphocreatine, 4 MgATP, 0.3 Na3GTP, 25 QX314, and 20 mm BAPTA, adjusted to pH 7.4 with CsOH. Current and voltage recordings were obtained using a Multiclamp 700B amplifier (Molecular Devices) digitized at 10 kHz using aDigidata 1400 data acquisition interface. Currents in voltage clamp were filtered at 1 KHz and voltage traces were bandpass filtered in the frequency domain with a custom-made filter (bandpass, 0.05–300 Hz; stop band, 0–400 Hz). Experiments in voltage-clamp and current-clamp configuration were used to assess passive membrane properties. The neuronal input resistance was determined by stepping the membrane voltage across a range of potentials (−100 to −60 mV) for 500 ms in the voltage-clamp configuration and plotting the subsequent mean steady-state current against the holding potential. Using linear regression, we fit the resulting current–voltage (I–V) plot and obtained the input resistance by taking the inverse of the I–V slope. Membrane resistance and capacitance were obtained directly from the pClamp acquisition software (Molecular Devices) in voltage clamp at a holding potential of −65 mV. The membrane time constant, τ, was measured by first injecting a brief (100 ms) hyperpolarizing square current pulse (−250 pA) in the current-clamp configuration. The discharge of the membrane potential after current step termination was plotted on a semilog scale and the membrane τ was taken as the slope of the linear fit of the second slow phase of the membrane potential decay (Iansek and Redman, 1973). Firing frequency–input (F–I) current curves were generated by injecting 1 s current pulses ranging from 0 to 1000 pA in 30 pA increments. The total number of spikes at each current step was then plotted against the input current. Then the slope of the individual F–I curves were determined by a linear fit of the region between firing onset and maximal firing frequency. This region of the x-axis was defined as the input dynamic range. Averaged F–I curves were normalized along the x-axis to the input current that produced maximal firing rate (Imax). Ramp current injection in current clamp was used to assess (1) spike latency, defined as the time elapsed between onset of stimulation and the first action potential; (2) number of spikes per ramp; (3) the firing window, which is the time elapsed between the first and the last spike; and (4) the resting potential, which was taken as the membrane voltage preceding ramp current injection. Ramp velocity and duration were set at 225 pA/s and 2 s, respectively, injecting a total of 450 pA.
Recordings made in current-clamp mode were also used to assess spontaneous network activity. Gabazine (5 μm) was bath applied to elicit spontaneous network activity in the form of high-conductance events (HCEs; ∼10 nS). This activity is characterized by an initial plateau depolarization (∼60 mV from baseline) lasting ∼400 ms followed by decay (tail) of the membrane potential lasting ∼500 ms. The membrane voltage was then recorded for 10 min with no current injection. EPSPs were detected using the criterion that the rate of change of the membrane potential must be in the interval 0.05 < dV/dt (slope of membrane depolarization) <10 mV/s. We quantified and compared the number of EPSPs 2000 ms before and after burst onset (preburst and postburst EPSPs, respectively) between WT and CKO populations. Miniature EPSCs and IPSCs (mEPSCs and mIPSCs, respectively) were recorded under voltage clamp using cesium-modified internal solution and 1 μm tetrodotoxin in the extracellular solution. mEPSCs and mIPSCs were recorded at the reversal potentials of mIPSCs and mEPSCs, respectively (EIPSC, −80 mV; EEPSC, 15 mV), and detected using a custom algorithm written in Matlab (Mathworks). Drugs were obtained from Sigma-Aldrich.
Biocytin labeling and histology.
Layer II/III PCs were filled with 20 mm biocytin during patch-clamp experiments in thalamocortical slices (350 μm) of mouse somatosensory cortex. Slices were preserved in 0.1 m PBS containing 4% PFA over 24 h, then washed 3× in 0.1 m PBS containing 0.5% Triton X-100 for 15 min and left to incubate for 24 h in the same solution containing avidin-biotin complex (Elite ABC Kit, Vector Laboratories). Next, slices were washed 3× in PBS-Triton and stained with a diaminobenzedine (DAB Peroxidase Substrate Kit, Vector Laboratories) solution until desired staining intensity was achieved. A series of alcohol and xylene washes were then performed to dehydrate the tissue, after which it was kept in methyl salycilate. Stained neurons were visualized under brightfield illumination using a Zeiss 63× oil-immersion objective and reconstructed in 3D using Neurolucida software (MicroBrightField). Neurons with weak or nonuniform staining intensity were excluded from analysis.
Reconstruction analysis.
Sholl analysis of dendritic structures was performed automatically with NeuroExplorer software (MicroBrightField) as follows: (1) a series of concentric spheres with radii increasing at 10 μm intervals were drawn around the centroid of the soma at distances 5–165 μm away from the soma; (2) the number of dendritic intersections crossing the boundary of each sphere was quantified and was not cumulative (i.e., number of dendritic intersections in any given sphere did not include dendritic intersections contained within smaller spheres); (3) the number of dendritic intersections for WT and CKO mice was averaged and plotted as a function of distance away from soma; and (4) bootstrap statistical analysis (see Electrophysiology Methods) was performed to test for significant differences in the number of dendritic intersections at each concentric sphere boundary. Other morphological parameters, such as axon length, were automatically determined by NeuroExplorer software and analyzed using bootstrap methods.
Statistical analysis.
Miniature postsynaptic currents were analyzed using a two-sample Kolmogorov–Smirnov goodness-of-fit test to compare distributions of amplitude and interevent intervals of recorded events between WT and CKO groups. p Values <0.05 were considered to be significant. All other significance tests were run in Matlab (Version 2010a) using bootstrap analysis. Parametric (e.g., t tests) and nonparametric (e.g., Wilcoxon ranksum) tests were not applicable for our datasets, as the implicit assumptions of these tests were not satisfied. Bootstrap analysis was performed as follows. For given quantity (e.g., membrane resistance), we measured n values from WTs and m values from CKOs. We wanted to test whether the difference of the means of both groups was significantly different. To this end, we first gathered the n + m data points into one group and drew n points randomly to form a new group, allocating the remaining m data points to form a second group. This way we created random surrogate datasets from which the difference of the means was calculated. We then iterated this process at least one million times to build a probability distribution of the difference of the means for surrogate data. If the difference of the means from the actual data were larger than the 95th percentile of this distribution, then that value was considered to be statistically significant. The p value (p) was calculated as the integral of the distribution from left end (−∞) up to the actual value. Significant values were indicated in the figures with one asterisk if 0.01 < p < 0.05, and with two asterisks if p < 0.001. This method was applied for all parameters of interest and was the final measure of statistical significance.
Microscopy and image analysis.
Images were acquired with a Zeiss LSM 510 confocal laser microscope with argon and helium–neon lasers and analyzed with LCS confocal software, Prism and Photoshop (Adobe). Images were collected approximately at the midpoint between the top and bottom of the two planes of focus. Student's t test and one-way ANOVA with post hoc Tukey's test were used to establish statistical significance.
Results
Activity of ERK1 and ERK2 is confined to the VZ/SVZ of the developing cortex and mirrors the neurogenic gradient
To investigate the precise role of ERK1 and ERK2 during corticogenesis, we first evaluated ERK activity during crucial early stages of telencephalic development. We found that ERK activity in the embryonic cortex was confined to the proliferative zones with a low-medial to high-lateral expression pattern, mirroring the neurogenic gradient (Fig. 1a,a′). We detected phosphorylated, active ERK1 and ERK2 in apical and basal neural progenitors, but not in postmitotic neurons, suggesting that ERKs act selectively within neural progenitors (Fig. 1c–e). To test this, we used Emx1-cre to conditionally delete ERK2 (CKO) from the dorsal telencephalon at the beginning of the neurogenic period, E9.5 (Fig. 1a,b). To evaluate ERK1 contributions to corticogenesis, we bred the ERK2 CKO mice to ERK1-null mice of the same genetic background, thus generating DKO mice (Fig. 1a,b). Evaluation of CKO and DKO E14.5 embryos showed little ERK activity within the neurogenic region of the developing dorsal telencephalon (Fig. 1a–e), which we also quantified by Western analysis (Fig. 1b). Furthermore, we also examined the CKO mice for potential changes in other developmentally important pathways known to play a role in early cortical development and patterning. We did not see any significant changes in downstream elements of the Wnt or Notch pathways (data not shown).
Figure 1.
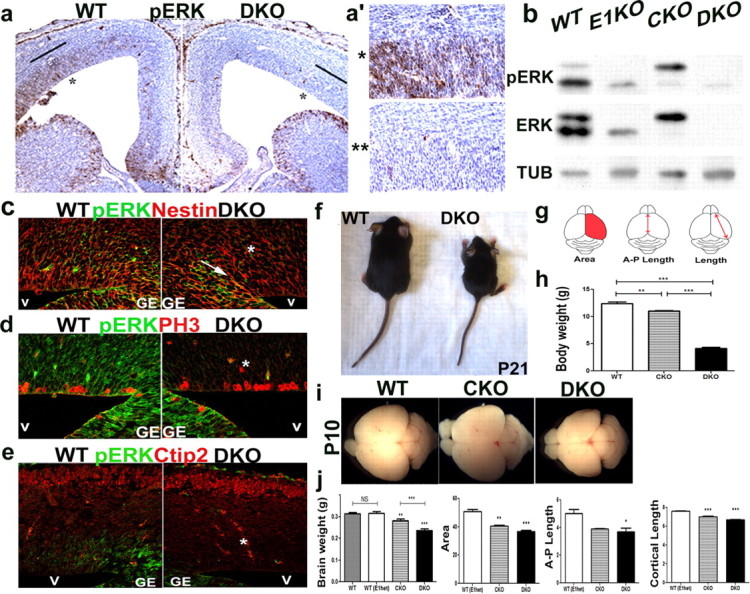
ERK activity is abrogated in the dorsal telencephalon of ERK1 and ERK2 DKO mice. ERK2 inactivation is driven by the Emx1-cre within the dorsal telencephalon beginning at E9.5 (Gorski et al., 2002). a, pERK activity in the developing WT cortex shows low-medial to high-later gradient in the dorsal telencephalon at E14.5. a,a′, ERK activity is lost in the DKO mice at E14.5 as shown by DAB staining, where a′ shows higher magnification of the telencephalon marked in a. b, Western blot analysis of cortical lysates at E14.5 shows absence of ERK1 and/or ERK2 protein in CKO and DKO mice, respectively. c–e, ERK activity was analyzed by immunohistochemical analysis of pERK expression (green) in DKO mice at E14.5. During midneurogenesis, pERK activity was detected within the proliferative zone of the lateral cortex, but not in the postmitotic neurons. Strong expression of ERK activity was detected in subpallial ventricular zone mitotic progenitors in both WT and DKO cortices, but absent from pallial mitotic PH3+(red) (d) and Nestin+(red) (c) progenitors (asterisk). A clear boundary of cre expression is observed in the DKO mice and marked by an arrow (c). v, ventricle; GE, ganglionic eminence. f–j, The cortical size and body weight is reduced in the ERK2 CKO and DKO mice. Dorsal view of WT and DKO mutant mice at P21 (f). Body weight was measured in CKO (n = 5; p ≤ 0.001) and DKO (n = 5; p ≤ 0.0001) mice and compared with WT (n = 11) (h). Schematic representation of cortical parameters measured: area size, A-P length and cortical length (g). Dorsal images of whole brains: WT (left), CKO (middle), and DKO (right) mice at P10 (i). Quantitative comparison of brain weight and cortical size between WT, CKO, and DKO mice at P10 (j). Measurements of cortical parameters (g) were obtained using ImageJ software. At least six brains were analyzed per genotype.
Cortical size and thickness is reduced in ERK2 CKO and DKO mice
Diminished ERK activity early in cortical development resulted in changes in brain size and cortical cytoarchitecture. The overall brain weight of mutant CKO mice at P2 and P10 was reduced by 11% when compared with WT littermate controls (data not shown; Fig. 1j). However, brain weight of DKO mice was reduced by 32% at P2 (data not shown) and 25% at P10 (Fig. 1j). Most DKO mice died within the first postnatal week. The few animals that survived to P21 exhibited even more severe brain weight reduction (38%) than those measured at earlier ages (data not shown), indicating that the loss of ERK1 and ERK2 within dorsal telencephalon is allele dose-dependent and critical for survival of these mice. In addition, we found that the CKO and DKO mice showed a significant decrease in cortical area, anterior-posterior length, and cortical length, when compared with WT littermate control mice (Fig. 1f–j), and that the severity of the cortical deficits correlated with the number of ERK alleles deleted. In addition, we measured the overall body weight of P21 CKO and DKO mice as compared to sex-matched, WT, littermate controls (Fig. 1f,h). We found an allele-dependent decrease in total body mass at P21 by 12% in CKO and 66% in DKO mice (Fig. 1f,h). At P21, DKO mice were not mobile or responsive when handled.
Loss of ERK1 and ERK2 leads to perturbations in the laminar composition and neuronal morphology of the postnatal murine cortex
To find out whether deletion of ERK1 and ERK2 alters the cellular composition of the postnatal cortex, we used lamina-specific markers to count neurons in the cortices of P2 and P10 mutant and WT mice (Fig. 2a,b; data not shown for P10). We divided the cortex into 10 equivalent bins and visualized neurons using the pan-neuronal marker, NeuN. We found a significant deficit in the number of neurons in bins 2–3, which correspond to the cortical layer II/III (Fig. 3a) and can be delineated by expression of Brn1. We then counted Brn1+ neurons in CKO and WT mice at P2 and observed a 35% loss of pyramidal neurons of layer II/III (Fig. 2a,b). This deficit was greater (58%) in the DKO mice (Fig. 2a,b). These pyramidal neurons are predominantly generated from SVZ progenitors during later stages of cortical development (Tarabykin et al., 2001; Wu et al., 2005). In addition, we counted the Satb2+ (layers II–V) and Cux1+ (layer II/III) neurons, which was decreased in CKO mice by 25% and 30%, respectively. Surprisingly, we observed an increase in NeuN+ neurons in bin 7, which corresponds to cortical layer V (Fig. 3b). CKO and DKO mice both showed a 28 and 29% increase, respectively, in layer V subcortical projection neurons, which express the transcription factor Ctip2 (Arlotta et al., 2005; Chen et al., 2005). These cells are derived mostly from VZ progenitors during early neurogenesis (Fig. 2a,b). Interestingly, the number of neurons in layer V/VI, as marked by Tbr1, remained unchanged (Fig. 2a,b).
Figure 2.
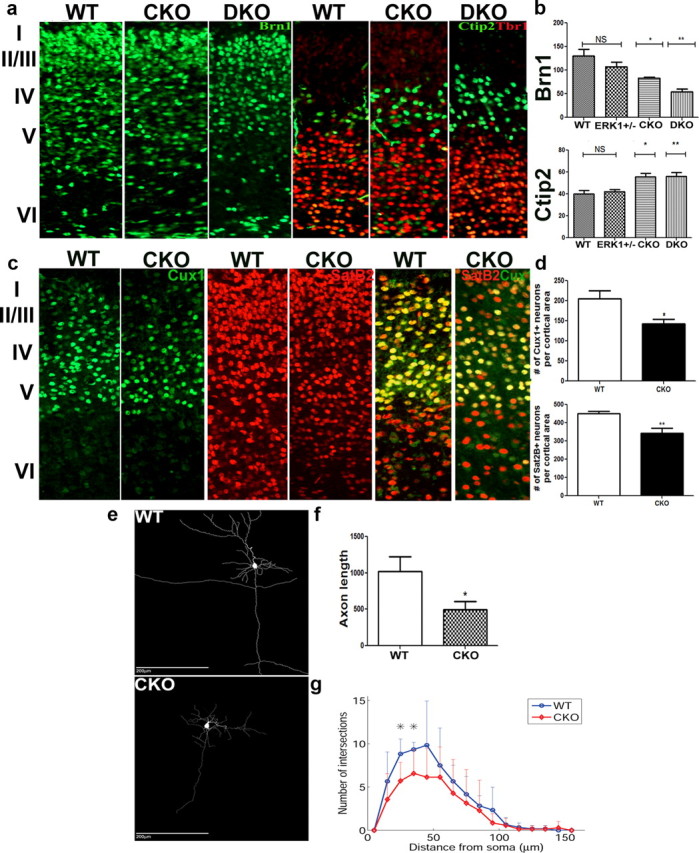
Loss of ERK1 and ERK2 leads to layer perturbations in the adult cortex. a, b, Coronal brain sections of WT, CKO, and DKO mice at P2 (a). Immunohistochemical analysis using layer-specific markers: Brn1, layers II–IV (green) used to quantify Brn1+ cells per cortical area (p = 0.0009); Ctip2+, layer V motor neurons (green), (p = 0.0021) (a, b). Tbr1 in layers V/VI expression (red) was unchanged (p = 0.7091) (a, b). c, d, SatB2, layers II–V to quantify colossal projections (p = 0.0042) (red) and Cux1 (green), marker for layers II-III neurons (p = 0.0304). e, Reconstructed layer II/III PCs from WT and CKO somatosensory cortex. f, Axon length (μm) from reconstructed PCs (WT, n = 6; CKO, n = 7; p < 0.05, bootstrap analysis). g, Sholl profile of basal dendrites plotted as mean number of dendritic intersections. Note the significant difference in number of dendritic intersections at 25 and 35 μm away from cell soma (WT, n = 6; CKO, n = 7; p < 0.05, bootstrap analysis). At minimum, six animals analyzed per group per genotype.
Figure 3.
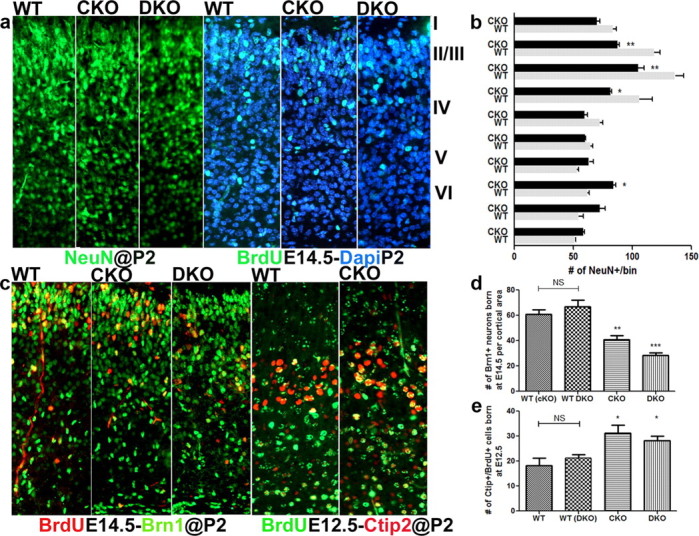
The frequency of neurons generated during midneurogenesis is altered in mutant mice lacking ERK1 and/or ERK2. a, b, The number of NeuN+ neurons (green) across 10 equally spaced cortical bins in WT and CKO mice (a) quantified at P2 (b). Bin 2–3 corresponds to supragranular neurons in layers II–IV and bin 7 corresponds to layer V (b). The frequency of neuronal birth was analyzed at P2 by examining the number of BrdU+/DAPI+ cells that were labeled with BrdU (green) at E14.5 (a). c–e, For layer II–IV analysis, mice were labeled with BrdU (red) at E14.5 and evaluated for Brn1 coexpression (green) at P2 (p ≤ 0.0001) (c, d). Layer V neurons were BrdU (green) labeled at E12.5 and coexpression with Ctip2 evaluated at P2 (red); (p = 0.0032) (c, e). Minimum of six mice evaluated per genotype.
Studies in several model systems demonstrated the importance of ERKs in neuritic development (Perron and Bixby, 1999; Karasewski and Ferreira, 2003; Xiao and Liu, 2003). We examined neuronal morphology in mice lacking ERK2 by generating 3-D reconstructions of DAB-labeled layer II/III PCs from cortical slices. Analysis of neuronal processes revealed a significant 50% reduction in the mean total axonal length in ERK2 CKO mice (WT, 1019 ± 507 μm, n = 6; CKO, 496 ± 304 μm, n = 7; p = 0.0244) (Fig. 2c,d) without significant changes in total number of axon collaterals (WT, 2.8 ± 2.2; CKO: 1.9 ± 1.9; p > 0.05). Additionally, Sholl analysis of basal dendrites revealed 35 and 30% fewer dendritic intersections at distances 25 and 35 μm away from the soma, respectively (Fig. 2c,e), suggesting abnormal dendritic ramification in CKO animals. Importantly, this spatial range includes a large proportion of synaptic contacts from neighboring layer II/III PCs (Shepherd et al., 2005; Feldmeyer et al., 2006; Hooks et al., 2011) and is therefore likely to affect network function within layer II/III.
To test whether the postnatal changes in layer composition are a consequence of developmental perturbations in progenitor proliferation, we determined the frequency of Brn1+ and Ctip2+ neurons born at E14.5 and E12.5, respectively (Fig. 3). In CKO mice, we found a 40% decrease in Brn1+ neurons pulsed with a single BrdU dose at E14.5 (Brn1+/BrdU+) and a more severe 53% reduction in DKO mice at P2 (Fig. 3c,d). In contrast, the number of Ctip2+ neurons colabeled with BrdU after a single pulse at E12.5 was increased by 26 and 30% in CKO and DKO mice, respectively (Fig. 3c,d). The Ctip2-labeled neurons in mutant mice appeared larger and more dispersed (Fig. 3c). However, no significant difference was observed in frequency of BrdU/Tbr1 double-labeled neurons (data not shown). Similar results were obtained when mice were analyzed at P10 (data not shown). These data demonstrate that early loss of ERK activity in the CKO and DKO mice leads to alterations in specific cortical lamina, which we directly link to perturbations of progenitor proliferation dynamics during cortical neurogenesis.
Apical and basal progenitor proliferation is altered in ERK2 mutant mice leading to premature progenitor pool depletion
To establish whether the perturbations in cortical cytoarchitecture are due to altered progenitor proliferation dynamics, we examined both apical progenitors (including neuroepithelial and radial glia) and basal progenitors. We identified radial glia by their expression of Pax6, a transcription factor that becomes downregulated in most basal progenitors expressing the T-domain transcription factor, Tbr2 (Englund et al., 2005). Postmitotic neurons were identified by Tbr1 expression (Götz et al., 1998; Bulfone et al., 1999; Englund et al., 2005). We first examined the mitotic index of apical and basal progenitors at E14.5 and found reduced frequency of basal mitoses and a small reduction of apical mitosis in CKO mice, an effect that was exaggerated in DKO mice (data not shown). In addition, the number of cells in S phase, marked by BrdU, was also reduced by 40% in the mutant animals (see Fig. 5c,d). Furthermore, in the CKO mice, the number of Pax6+ radial glia was reduced by 33% (Fig. 4a,c; p = 0.0002), whereas the number of mitotic radial glia was reduced by 44% (p = 0.0014; Fig. 4a,d). Moreover, the number of progenitors coexpressing Pax6+ and Tbr2+ (a marker of basal progenitors) was reduced by 49% in the CKO mice (Fig. 4b,e), suggesting mutant Pax6+ radial glia do not appropriately differentiate into basal progenitors. This effect was more pronounced in the embryonic lateral cortex but was still present in dorsomedial section of the developing cortex. We also noticed that the intensity of Pax6 expression was often diminished in mutant mice when compared with WT mice (Fig. 4A).
Figure 5.
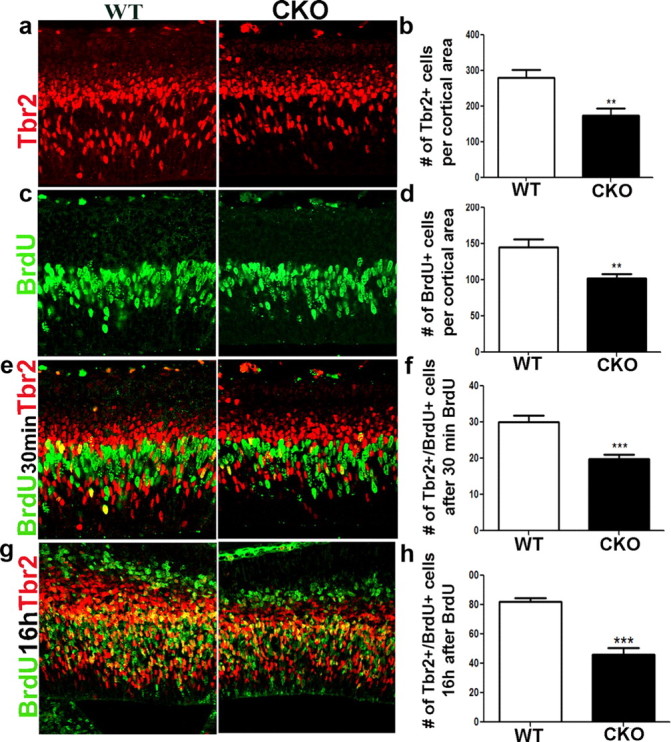
Loss of ERK2 disrupts basal progenitor frequency and generation, resulting in premature progenitor pool depletion. a, b, The number of intermediate progenitors was analyzed by immunohistochemical analysis with Tbr2 (red) at E14.5 (p = 0.0080). A short BrdU (50 ng/g) pulse was intraperitoneally injected 30 min before sacrificing the pregnant dam. c, d, The number of BrdU+ cells (green) was counted at E14.5. e, f, To analyze the frequency of cycling SVZ progenitors, we used a short-pulse BrdU labeling paradigm (green), to immunolabel Tbr2+ (red) progenitors in the S phase, Tbr2+/BrdU+ (n = 5; p = 0.0022). g, h, Basal progenitor generation from apical progenitors was assayed by colabeling of Tbr2+ cells with BrdU 16 h post-BrdU injection, allowing for some apical progenitors to migrate into the SVZ and express Tbr2 (red) (n = 5; p = 0.0001).
Figure 4.
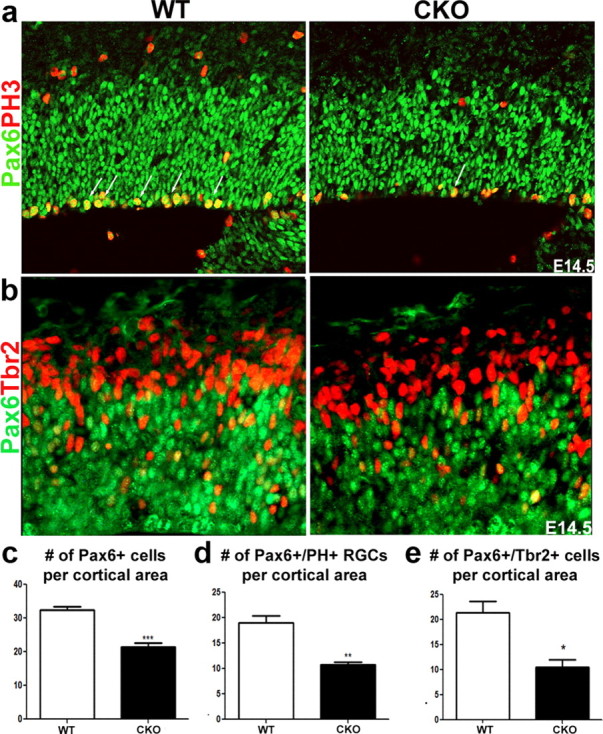
ERK2 CKO mice show reduction in Pax6+ progenitors, mitotic radial glia, and transition to intermediate progenitor cells. a–e, We evaluated the number of Pax6+ radial glia (p = 0.0002) (a, c). The number of mitotic radial glia was analyzed by colabeling with a mitotic marker, PH3 (red), at E14.5 (p = 0.0014) (a, d). In addition, we analyzed the number of transitioning progenitors by colabeling with the intermediate progenitor marker, Tbr2 (red) (b, e). At least five mice per genotype were evaluated.
Since the number of transitioning Pax6+/Tbr2+ progenitors was reduced, we reasoned that the number of basal progenitors may be affected. We found that the number of Tbr2+ basal progenitors was reduced by 30% in the CKO mice (Fig. 5a,b). Interestingly, the reduction in Tbr2+ cells was particularly evident in the cortical VZ, suggesting that the frequency of basal progenitor generation may be decreased when ERK2 is deleted. Therefore, we investigated the number of cycling basal progenitors by administering an acute BrdU pulse and counting the number of Tbr2+/BrdU+ double-labeled cells. We found that the number of cycling basal progenitors was reduced by >35% in the mutant mice (Fig. 5e,f). To further confirm the defect in basal progenitor generation, we colabeled BrdU+ cells with the basal progenitor marker Tbr2 16 h after BrdU injection at E13.5. Since this period allows for S-phase apical progenitors to acquire Tbr2 expression, the double-labeled cells represent newly generated basal progenitors. We found that in the ERK2 CKO mice the number of newly generated basal progenitors was decreased by 44% (Fig. 5g,h). Thus, the ERKs are important regulators of apical and basal progenitor dynamics in the developing cortex during neurogenesis.
Loss of ERK2 results in premature cell cycle exit, excessive neurogenesis, and elongated cell cycle length
One of the most likely explanations for the altered progenitor generation dynamics in the CKO mice is premature progenitor cell cycle withdrawal. This leads to an increase in the fraction of differentiated cells, coupled with a premature decrease in progenitor pool size. We examined the proportion of cells leaving the cell cycle by using a standard BrdU labeling protocol as previously described (Ormerod, 1997; Quinn et al., 2007). In the developing cortex, a single BrdU injection generates two distinctly labeled cell populations: (1) lightly labeled BrdU+ cells that reentered the cell cycle and subsequently divided, generating two daughter cells; and (2) heavily labeled cells that are in S phase during BrdU administration and subsequently undergo terminal division (del Rio and Soriano, 1989; Gillies and Price, 1993; Price et al., 1997; Roy et al., 2004; Cubelos et al., 2008). The lightly labeled population accumulates with increasing length of BrdU exposure until a maximum is reached, as some cells reenter S phase and subsequently incorporate more BrdU (Fig. 6a,b). We predicted that if more cells exit the cell cycle, then the proportion of heavily labeled cells would be greater in mutant mice 24 h after BrdU administration. We confirmed that there were significantly more darkly labeled cells throughout the mutant cortex (at least 85% of cells marked by BrdU) (Fig. 6a,b) when compared with WT controls. We also colabeled BrdU+ cells with the mitotic marker Ki67. The number of BrdU+/Ki67− cells was used to establish the leaving cell fraction. In the mutant embryos, the fraction of all BrdU+ progenitors that exited the cell cycle (BrdU+/Ki67−) was significantly (30%) greater when compared with wild-type controls (Fig. 6c,d). Thus, loss of ERK2 resulted in premature cell cycle withdrawal in the developing cortex.
Figure 6.
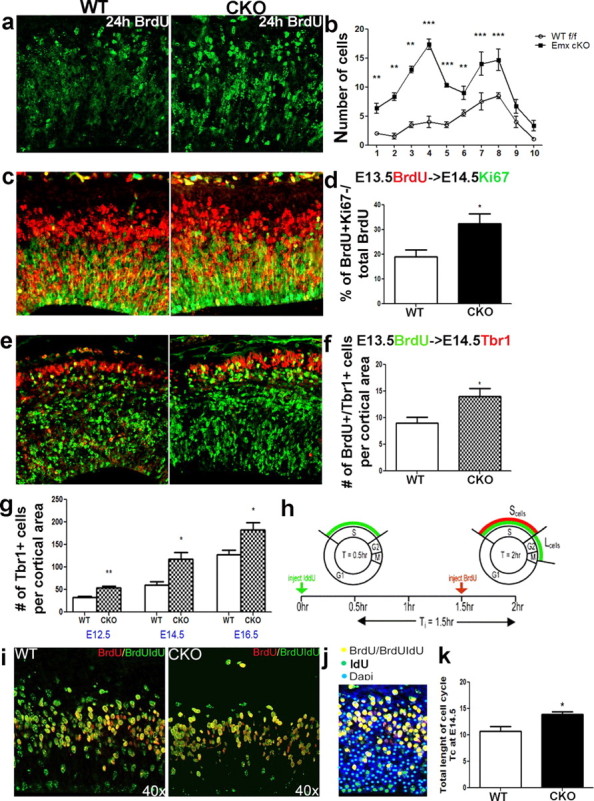
ERK2 CKO neural progenitors exhibit premature cell cycle exit and lengthening of the cell cycle during midneurogenesis. A single BrdU injection was administered at E13.5 and embryos were fixed 24 h later. Coronal sections were immunolabeled with BrdU (green). a, b, Cells that reenter the cell cycle show distinct puncta and are less intensely labeled, whereas cells that exited the cell cycle and become postmitotic are brightly labeled (a). Brightly labeled BrdU+ cells (at least 80% of cell covered) were counted across the cortical anlage (b). The cortical entity was divided into 10 vertical bins of equal thickness. The histogram shows a statistical analysis of the number of brightly labeled cells in each bin in CKO and WT cortex (a, b) (n = 3; p ≤ 0.001). c, d, Immunostaining with Ki67 (green) and BrdU (red) antibodies after 24 h BrdU pulse at E13.5. All cells that exited the cell cycle (BrdU+/Ki67−) were counted and their percentage of total BrdU+ cells evaluated 24 h postinjection was analyzed (d). e, f, To evaluate the fate of newly born cells, we colabeled with a postmitotic marker, Tbr1 (red) and BrdU (green), 24 h after injection (WT, n = 4; CKO, n = 5; p = 0.0383). g, The total number of Tbr1+ postmitotic neurons was also evaluated at E12.5 (p = 0.0034), E14.5 (p = 0.0007), and E16.5 (p = 0.0140). h, Cell cycle during midneurogenesis. Diagram adopted from Martynoga et al. (2005) showing a schematic of the double injection [iododeoxyuidine (IdU)/BrdU] paradigm. Pregnant dams were injected with IdU and BrdU 1.5 h apart and sacrificed 0.5 h later. i, Coronal sections were immunolabeled with IdU (green) and BrdU (red) at E14.5. k, Cells in the S phase by t = 2 h were labeled with both BrdU and IdU (S cells: yellow) (p < 0.05). j, Cells were counted in 100 μm-wide bins and are shown as colored dots.
The premature cell cycle exit of neuronal precursors raised the question regarding the fate of the exiting cells. The newly postmitotic cells could either differentiate into postmitotic neurons or undergo cell death. We did not observe changes in caspase-3 activity during corticogenesis and only a few apoptotic cells were observed postnatally (data not shown) but could not account for the much more substantial leaving fraction observed in CKO mice. Since many more cells were exiting the cell cycle, we predicted a corresponding increase in the proportion of differentiating neurons. To test this, we used the expression of the early neuronal marker, Tbr1 (Englund et al., 2005), which indeed was greater in the mutant mice in the period between E12.5 and E16.5 when compared with controls (Fig. 6g). To test our hypothesis that progenitor cells prematurely exit the cell cycle and become neurons due to defects in progenitor proliferation, we examined the birth frequency of Tbr1+ postmitotic neurons. We pulsed cycling progenitors with a single BrdU injection at E13.5 and examined their fate by colabeling with the postmitotic marker, Tbr1, 24 h later. During midneurogenesis, this period of time is sufficient for a fraction of the progenitors to undergo terminal division and differentiate (Takahashi et al., 1996; Englund et al., 2005). We found that the number of Tbr1+/BrdU+ neurons was increased by 35% in the mutant mice (Fig. 6e,f). In addition, we performed cell cycle analysis, as previously described by Martynoga et al. (2005), and found the length of total cell cycle significantly elongated in the CKO mice at E14.5 (Fig. 6h–k). Our findings suggest that altered cell cycle kinetics of the proliferating progenitors result in premature cell cycle exit, generating an abnormally elevated number of postmitotic neurons at the expense of basal progenitors. This ultimately results in premature progenitor pool depletion, reflecting postnatal deficits in cortical cytoarchitecture.
ERK2 regulates cell cycle progression through cyclin D1 and the cell cycle inhibitor, p27Kip1
Cell cycle regulators and transcription factors have been implicated in the control of cell cycle dynamics in the developing cortex (Calegari and Huttner, 2003; Roy et al., 2004). Cyclin D1 is expressed in the developing cortex and acts to regulate the G1/S cell cycle transition and thus the length of G1 (Lukas et al., 1996; Glickstein et al., 2007). Cyclin D1 is transcriptionally regulated by the ERKs. Cyclin D1 protein levels were significantly diminished at midneurogenesis in the cortical lysates evaluated by Western analysis (Fig. 7b) or immunohistochemistry (Fig. 7a) in mutant mice. The ERKs also regulate the levels of p27Kip1, a cyclin-dependent kinase inhibitor and a potent G1 to S checkpoint regulator. We found that p27Kip1 protein levels are elevated in the developing cortex of CKO mice (Fig. 7b). Specifically, we observed that p27Kip1 aberrantly accumulates in Tbr2+ basal progenitors as well as postmitotic Tbr1+ neurons (Fig. 7c–f) when compared with wild-type controls. We report a 36% increase in the number of basal progenitors that show accumulation of p27Kip1 when compared with controls (Fig. 7c,c′,f). Furthermore, the number of Tbr1+/p27Kip1+ postmitotic neurons was significantly increased in the CKO mice (Fig. 7d,e). Therefore, loss of ERK activity contributes to altered levels of these potent cell cycle regulators and provides a mechanistic explanation for perturbation of the cell cycle dynamics in cortical progenitors during the critical neurogenic period.
Figure 7.
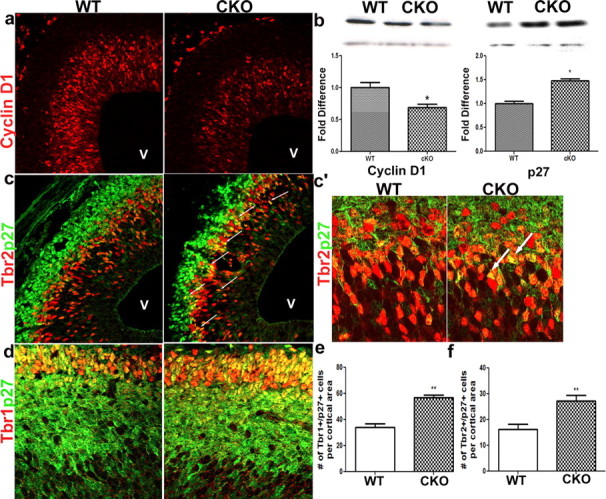
Loss of ERK2 alters expression of key cell cycle regulators cyclin D1 and p27Kip1 in the developing cortex. a, b, We evaluated cyclin D1 levels by immunohistochemical (red) (a) and Western analysis (WT, 1000 ± 0.08104, n = 6; CKO, 0.6873 ± 0.05215, n = 5; p < 0.05) (b). c, c′, d, Expression of p27Kip1 (green) is aberrantly upregulated, by immunohistochemistry, in intermediate progenitors marked by Tbr2 (red) as well as postmitotic neurons, marked by Tbr1 expression (red). e, f. Higher-magnification confocal images show an increase in Tbr2+/p27+ cells in CKO mice (c′). Arrows in c′ indicate aberrant accumulation of p27Kip1 in Tbr2+ progenitors. The number of Tbr2+/p27+ cells was quantified (WT, n = 4; CKO, n = 7 (f) and confirmed by Western analysis (p = 0.0202) (b). v, Ventricle.
Cell-intrinsic electrophysiological properties are altered in ERK2 mutant mice
Given the cortical abnormalities observed in the CKO mice, we hypothesized that single-cell and network excitability of cortical layer II/III PCs may be altered in ERK2-deficient mice. We performed whole-cell patch-clamp experiments in PCs from acute brain slices to examine cell-intrinsic measures of excitability. Examination of F–I curves revealed no difference between WT and CKO animals in sensitivity of neuronal firing to changes in input (gain) (Fig. 8a,b). Despite having similar input sensitivity, the maximal action potential (AP) firing rate was significantly lower in the CKO mice (Fig. 8c–e). Moreover, the range of input amplitudes able to change the neuronal firing rate (input dynamic range) was significantly reduced in CKOs (Fig. 8f). The diminished intrinsic neuronal excitability is further demonstrated by experiments in which ramp current injection into layer II/III PCs elicited firing with longer response latencies in the CKO mice (Fig. 8g–i). AP latency in response to current injection is in part regulated by the transient outward potassium current (A-current) (Hille, 2001). We found that despite some variability across cells, larger A-current values can be attributed to PCs from ERK2 CKO mice (Fig. 8j). This is consistent with previous work showing that ERK2 negatively regulates the A-current mediated by Kv4.2 channels (Schrader et al., 2006). It is likely that neurons lacking ERK2 may be compensating for the increase in response latency by broadening their firing window (defined as the time elapsed between onset and termination of firing) and maximizing the number of generated APs (Fig. 8k,l). In addition, deletion of ERK2 led to a significant reduction in membrane resistance, R, and an increase in the membrane time constant, τ, while leaving input resistance, membrane capacitance, AP threshold, and resting potential unchanged (Table 1). These data demonstrate that loss of ERK2 significantly alters the intrinsic excitability of cortical PCs.
Figure 8.
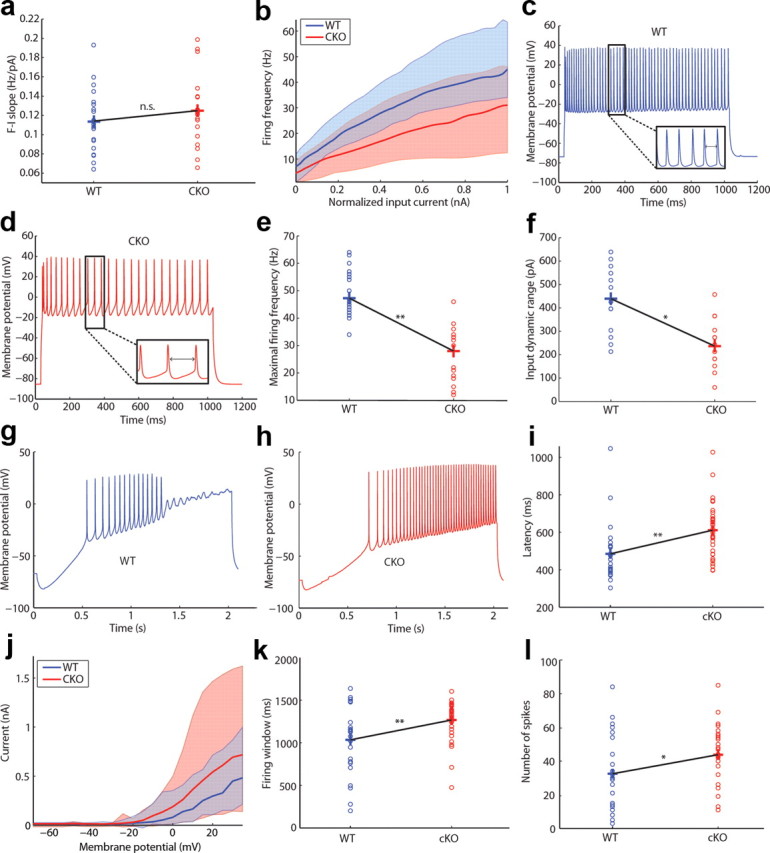
Cell-intrinsic electrophysiological parameters are altered in Erk2 mutant mice. a, F–I curve slope distributions from layer II/III PCs (WT, n = 21; CKO, n = 18; p > 0.05, bootstrap analysis). Crosses connected by black lines demarcate means of the distributions. b, Median firing F–I current curves with shaded regions representing the area between the 1 and 99% confidence levels. c, d, Examples of layer II/III PCs firing at maximal rates from WT (n = 21) (c) and ERK2 (n = 18) CKO (d) mice. e, Maximal firing frequency distributions (**p < 0.05, bootstrap analysis). Distributions of input dynamic range, defined as the range of input current values between firing onset and maximal firing frequency (*p < 0.05, bootstrap analysis). g, h, Examples of voltage responses to ramp current stimulation in layer II/III PCs from WT (n = 24) (g) and Erk2 (n = 35) CKO (h) mice. i, Latency to the first spike after stimulation with a ramp current (**p < 0.05, bootstrap analysis). j, Median transient outward K+ current with shaded regions representing the area between the 1 and 99% confidence levels (WT, n = 25; CKO, n = 31). k, Number of spikes fired per ramp (*p < 0.05, bootstrap analysis). l, Firing window, defined as time elapsed between first and last spike during ramp current stimulation (**p < 0.05, bootstrap analysis).
Table 1.
Cell-intrinsic measures of neuronal excitability in cortical layer II/III of WT and CKO mice
| Parameter | Mean ± SD |
p Value | |
|---|---|---|---|
| WT | ERK CKO | ||
| Input resistance (MΩ) | 126 ± 73 | 125 ± 102 | 0.61 |
| Membrane resistance (MΩ) | 222 ± 96 | 192 ± 86 | 0.031a |
| Membrane tau (ms) | 9.5 ± 4.5 | 11.3 ± 3.4 | 0.005a |
| Membrane capacitance (pF) | 43 ± 13 | 42 ± 13 | 0.38 |
| Spike threshold (mV) | −32 ± 9.1 | −30.0 ± 4.8 | 0.12 |
| Resting potential (mV) | −67 ± 14 | −70 ± 7.0 | 0.11 |
| Area of mean up-state (mV · s) | 1.3 ± 0.52 | 1.49 ± 0.49 | 0.13 |
Comparison of WT and CKO mice showing that deletion of ERK2 led to a significant reduction in membrane resistance and a significant increase in the membrane time constant, while leaving input resistance, membrane capacitance, AP threshold, and resting potential unchanged.
aStatistically significant.
Network-level electrophysiological properties are altered in ERK2 mutant mice
We hypothesized that the significant loss of PCs in layer II/III, altered cell morphology, and changes in intrinsic neuronal excitability may be associated with a change in network activity. Therefore, we compared network activity between WT and CKO mouse cortex in vitro. Spontaneous network events were elicited by disinhibiting slices with 5 μm gabazine, a GABAA receptor antagonist. Network bursts (HCEs) were less frequent in the CKO mice (Fig. 9a–c), demonstrating the loss of ERK2 dramatically affects overall network activity. We reasoned that diminished network activity could be explained in part by a reduction in recurrent excitability within the local circuit, which we tested by analyzing individual HCEs. The HCE has a characteristic shape consisting of an initial plateau depolarization lasting ∼400 ms with an average magnitude of 60 mV and a succeeding decay (tail) lasting ∼500 ms. Although the area under the HCE plateau shows no differences, the area under the tail is significantly reduced in CKO mice (Fig. 9d,e). We predicted that a decrease in recurrent network excitation in ERK CKO mice would result in a reduction of HCE tail area. We quantified recurrent excitation by comparing the number of EPSPs before and after HCE onset, motivated by the assumption that an HCE drives recurrent activity among neighboring layer II/III PCs. Indeed, we found that the EPSP count during the HCE tail was significantly higher than during a 2 s period preceding the HCE onset in both WT and CKO mice (Fig. 9f,g). Furthermore, the EPSP count in CKO mice was significantly lower during the pre-HCE and post-HCE periods as compared with that in WT mice. We ruled out the contribution of the membrane τ to tail area as it is two orders of magnitude lower than the HCE tail duration. The reduction in recurrent excitation may be attributed to a decreased number of functional connections resulting from the loss of layer II/III PCs or altered neuronal morphology. We therefore measured spontaneous miniature postsynaptic currents in the presence of tetrodotoxin and observed a decrease in the frequency, but not amplitude, of miniature EPSCs (Fig. 9h,i), suggesting a decrease in the total number of functional excitatory synapses. Interestingly, the inhibitory mIPSCs revealed a decrease in both frequency and amplitude (Fig. 9j,k), suggesting that the cortical network may be compensating for lack of excitation by reducing the quantal content of inhibitory synaptic vesicles and the total number of inhibitory synapses. These results demonstrate for the first time that eliminating ERK2 within the telencephalon effectively alters pyramidal cell excitability and network activity.
Figure 9.
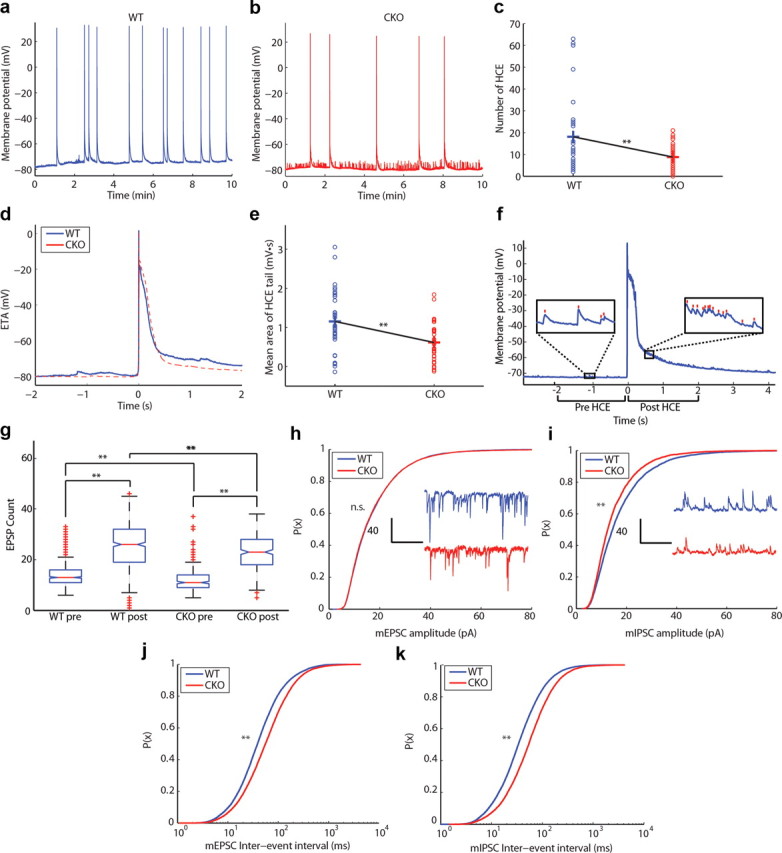
Network-level electrophysiological parameters are altered in ERK2 mutant mice. a, b, Examples of spontaneous network activity (i.e., HCEs) shown as voltage traces in (a) WT and (b) CKO disinhibited cortical slices. c, Number of spontaneous HCEs recorded during a 10 min interval (WT, n = 33; CKO, n = 32; **p < 0.05, bootstrap analysis). d, Event-triggered average (ETA) taken as the mean shape of the network burst. e, Mean area under the HCE tail in relation to the resting potential (**p < 0.05, bootstrap analysis). f, Example of a network HCE recorded in layer II/III PC from a cortical slice of a WT mouse. Note the difference in number of EPSPs 2 s before the HCE (pre-HCE) and 2 s after HCE onset (post-HCE). Insets show EPSPs detected using a custom detection algorithm. Red lines over the voltage trace represent detected EPSPs during the pre-HCE and post-HCE periods. g, Box plot of EPSPs detected during the pre-HCE and post-HCE periods in WT and CKO animals. Red lines and crosses on the box plots represent the distribution means and outliers, respectively. h, Cumulative distribution function of mEPSC amplitude with insets showing sample mEPSC traces (WT, n = 25; CKO, n = 23; p > 0.05, two-sample Kolmogorov–Smirnov test). i, Cumulative distribution function of mIPSC amplitude with insets showing sample mIPSC traces (p < 0.05, two-sample Kolmogorov–Smirnov test). j, Cumulative distribution function of mEPSC interevent interval (**p < 0.05, two-sample Kolmogorov–Smirnov test). k, Cumulative distribution function of mIPSC interevent interval (**p < 0.05, two-sample Kolmogorov–Smirnov test).
Deletion of ERK2 leads to behavioral deficits and cognitive impairment in adult mice
Individuals with NCFC syndromes and copy number variations of ERK1 and ERK2 exhibit cognitive impairment, a broad spectrum of behavioral abnormalities, and psychiatric disease. Therefore, we examined 3-month-old CKO male mice (DKO animals do not survive to this age) by implementing a battery of standardized behavioral tests. An important outcome of this analysis was the discovery that ERK2 CKO mice exhibited robust anxiety-like phenotypes with altered behavior on the elevated plus maze, light-dark exploration, and open field test (Fig. 10a–c), which is different from other ERK knockouts. In this latter test, general locomotor activity, measured by total distance traveled and velocity, was not affected (Fig. 10c).
Figure 10.

Loss of ERK2 leads to behavioral alterations and cognitive impairment in adult mice. a, Elevated plus maze: percentage of time spent in different arms during testing and number of head dips (*p < 0.05). b, Light/dark exploration (***p < 0.001). c, Open field (*p < 0.05). e, Continuous alteration and delayed T maze: percentage of alterations, time spent, and number of entrees into the novel arm (*p < 0.05). d, f, No significant differences observed with rotarod test (f) or pain sensitivity (d). We evaluated 3-month-old male CKO (n = 6) and WT (n = 7) mice.
We next evaluated CKO mice for deficits in working and hippocampus-dependent memory using continuous alteration and delayed T-maze tests, respectively. The delayed T-maze assay was used to circumvent the high levels of anxiety and freezing behavior seen in ERK2 CKO mice. The CKO mice spent less time in the novel arm and did not consistently pick the novel arm when compared with wild-type mice; however the total number of entries was not significantly altered, although there was a trend to explore less (Fig. 10e). We also tested the ERK2 CKO mice using contextual fear conditioning. However, due to the strong anxiety-like behavior, the animals continuously froze above normal threshold levels (data not shown). ERK2 CKO mice were indistinguishable from WT age-matched controls in measures of motor coordination and sensitivity to pain (Fig. 10d,f). In conclusion, deletion of ERK2 during early neurogenesis results in anxiety-like behavior with deficits in working and hippocampal memory components.
Discussion
The phenotypes of children with copy number variations of ERKs or NCFC syndromes clearly illustrate that dysregulation of ERK signaling dramatically affects CNS development and function. ERKs are uniquely positioned to influence the magnitude and timing of corticogenesis. The present study describes a mechanism by which ERKs, in a dose-dependent matter, act to regulate neural progenitor proliferation and, consequently, progenitor pool size. Furthermore, this study addresses the potential consequences of the embryonic deficit on postnatal brain cytoarchitecture, global cortical circuitry, and behavior. During a limited embryonic period, two mitotically active layers, the VZ and the SVZ, generate the complex cytoarchitecture and the ultimate size of the adult cortex across species (Götz and Huttner, 2005; Kriegstein et al., 2006). The progenitors undergo either proliferative or neurogenic (differentiative) divisions. Proliferative divisions maintain the size of the progenitor pools, determining the size of the cortex. Conversely, neurogenic divisions generate neurons determining cortical thickness (Pontious et al., 2008). Cell cycle dynamics are regulated by both the total length of the cell cycle and G1 phase (which increases as neurogenesis proceeds) (Caviness and Takahashi, 1995), as well as by the ratio of cells reentering or exiting the cell cycle. The molecular cues controlling proliferative versus neurogenic progenitor divisions are not well understood. We postulate that ERK1 and ERK2, influenced by global morphogens, maintain a crucial balance between proliferative and neurogenic divisions in the developing cortex through their downstream effectors p27Kip1 and cyclin D1. In support of this hypothesis, we show the following: (1) ERK1 and ERK2 activity mirrors the neurogenic gradient within the proliferative zones of the developing cortex and that the progressive loss of ERK1 and ERK2 results in a significantly smaller cortex in a gene dose-dependent manner; (2) significantly, both CKO and DKO mice show lamina-specific deficits with altered number of mature cortical neurons; (3) loss of ERK1 and ERK2 activity alters the progenitor pool size and cell cycle dynamics, resulting in prolonged cell cycle length, premature cell cycle exit, and progenitor pool depletion; (4) the cell cycle defects correlate with dysregulation of ERK-regulated potent cell cycle modulators: cyclin D1 and p27Kip1; and (5) these deficits may then alter the organization, composition, and functional output of the cortical circuitry, changing network dynamics, and may potentially be involved in behavioral deficits that phenocopy developmental disorders observed in individuals with copy number variations of the ERKs and NCFC syndromes. It is important to note that loss of ERKs at early stages of neurogenesis has a different spectrum of effects than when the genes are inactivated during later stages of neurogenesis (Samuels et al., 2008). This is due to the newly recognized capacity of the ERKs to regulate progenitor pool size and ultimately the number of neurons populating the cortical lamina.
Good evidence now supports the hypothesis that the length of the cell cycle is a critical determinant of cell fate. That is, an increase in G1 length allows enough time for neurogenic versus proliferative division (Calegari and Huttner, 2003; Dehay and Kennedy, 2007). Analyses on a population level confirm that neurogenic progenitors exhibit longer G1 than do coexisting proliferative ones (Lange et al., 2009). A reduction in cyclin D1 levels results in lengthened G1 and this alone is necessary and sufficient for a switch to neurogenic fate (Lange et al., 2009). The ERKs transcriptionally regulate the major G1-phase active cyclin D1, which is expressed specifically in the neural progenitors in the VZ (Glickstein et al., 2007) and its expression mirrors the neurogenic gradient, just like the activated ERK1 and ERK2. We show that in the absence of ERK1 and ERK2, levels of cyclin D1 are decreased, causing precocious elongation of G1-phase, favoring neurogenic divisions in the developing telencephalon. Conversely, overexpression of p27Kip1 in neural progenitors in midneurogenesis increases the proportion of exiting cells independently from the cell cycle (Tarui et al., 2005). Aberrant accumulation of p27Kip1 in Tbr2+ neural progenitors is likely to contribute to the increased cell cycle exit we observed in the CKO mice. We argue that in the absence of ERKs, the reduction in cyclin D1 levels, coupled with enhanced accumulation of p27Kip1, acts in parallel to force neural progenitors into premature cell cycle exit where the prolonged cell cycle promotes an aberrant neurogenic cell fate switch. Thus, ERK1 and ERK2 activity confined to the neurogenic hub, acting through cyclins and their inhibitors, modulate the cell cycle length and progenitor proliferation dynamics, precisely controlling the rate of neurogenesis in the developing cortex. This balance between neurogenic and proliferative divisions is crucial for normal brain development and function. Loss of ERK1 and ERK2 causes premature genesis of too many neurons at the expense of progenitors, resulting in premature depletion of progenitor pools. In mice, changes in progenitor number are associated with abnormal cortical thickness (Quinn et al., 2007; Sahara and O'Leary, 2009). Basal progenitors amplify neuronal output, divide away from the ventricle, and produce mostly neurons (Miyama et al., 1997; Haubensak et al., 2004; Noctor et al., 2007; Kowalczyk et al., 2009). Some evidence suggests that basal progenitors generate neurons destined for upper cortical layers (II–IV) (Tarabykin et al., 2001). However, they are present throughout all stages of cortical neurogenesis and contribute to all cortical layers (Smart, 1973; Miyama et al., 1997; Haubensak et al., 2004; Noctor et al., 2004; Shen et al., 2006; Kowalczyk et al., 2009). Our data show a deficit in progenitor number, as well as frequency of their generation, which we postulate is due to defects in apical and basal progenitor proliferation dynamics. As a consequence of these developmental perturbations, the CKO and DKO mice show altered number and frequency of projection neurons in cortical layers II–V. We attribute the laminar deficit in supragranular neurons in layers II–IV to premature depletion of intermediate progenitor cell pool. This view is corroborated by our BrdU birth dating study and is similar to results reported by others (Kriegstein et al., 2006; Arnold et al., 2008). Consistent with this hypothesis, we also report an increase in layer V neurons, presumably a result of premature neurogenesis. It is also worth noting that we did not observe any migration deficits within the mutant cortex (data not shown), a finding which differs from that of Imamura et al. (2010). We also conducted a series of neuronal reconstructions in layer II/III somatosensory cortex and found significant changes in axon length and dendritic arborization. A critical outcome of the present study demonstrates the cellular mechanism underlying ERK actions in corticogenesis, which centers on the importance of ERK regulation of cyclin D1 and p27Kip1 in governing the choice of neurogenic versus self-renewing divisions in the developing cortex.
Importantly, this study reveals that intrinsic electrophysiological properties of the projection neurons in layer II/III were altered in the absence of ERK2 activity, exhibiting decreased maximal firing rate and input dynamic range, as well as a longer response latency to depolarizing stimuli. Together, these results suggest that, in the absence of ERK2, principal layer II/III neurons will have a more restricted input and output range and will be less responsive to transient inputs. These defects are likely to impede their proper functioning within the cortical circuit. At the network level, alterations in cortical cytoarchitecture and neuronal morphology correspond to less recurrent excitation in layer II/III of the CKO cortex. The combination of altered cell-intrinsic and network properties is likely to account for profound deficits in global network activity where the excitability of the network is significantly diminished. It is possible that these changes may contribute to the behavioral deficits seen in these mice, specifically the anxiety phenotype, which has not been previously observed. In fact, in patients, microdeletion of 22q11.21–22, which encompasses the ERK2 gene, MAPK1 was found to be associated with developmental abnormalities and profound anxiety (Verhoeven et al., 2011). Significantly, copy number variations in ERK1 gene, MAPK3, have been genetically linked with autism and mental retardation (Sanders et al., 2011). It is also interesting to note that deletion to ERK2 at different times during cortical neurogenesis results in significantly different phenotypes. The present study provides novel insights into why the human brain is so sensitive to even minor dysregulation of the ERK MAP kinase pathway, which results in pathology associated with NCFC syndromes and related disorders.
Footnotes
This work was supported by The Mount Sinai Health Care Foundation and The Alfred P. Sloan Foundation (RFG). We thank Dr. Lynn Landmesser, Dr. Evan Deneris, Dr. Stephen Maricich, and Joseph Vithayathil for helpful suggestions, and Dr. Gemma Casadesus and the Rodent Behavior Core at Case Western Reserve University.
References
- Agmon A, Connors BW. Thalamocortical responses of mouse somatosensory (barrel) cortex in vitro. Neuroscience. 1991;41:365–379. doi: 10.1016/0306-4522(91)90333-j. [DOI] [PubMed] [Google Scholar]
- Arlotta P, Molyneaux BJ, Chen J, Inoue J, Kominami R, Macklis JD. Neuronal subtype-specific genes that control corticospinal motor neuron development in vivo. Neuron. 2005;45:207–221. doi: 10.1016/j.neuron.2004.12.036. [DOI] [PubMed] [Google Scholar]
- Arnold SJ, Huang GJ, Cheung AF, Era T, Nishikawa S, Bikoff EK, Molnár Z, Robertson EJ, Groszer M. The T-box transcription factor Eomes/Tbr2 regulates neurogenesis in the cortical subventricular zone. Genes Dev. 2008;22:2479–2484. doi: 10.1101/gad.475408. [DOI] [PMC free article] [PubMed] [Google Scholar]
- Bulfone A, Martinez S, Marigo V, Campanella M, Basile A, Quaderi N, Gattuso C, Rubenstein JL, Ballabio A. Expression pattern of the Tbr2 (Eomesodermin) gene during mouse and chick brain development. Mech Dev. 1999;84:133–138. doi: 10.1016/s0925-4773(99)00053-2. [DOI] [PubMed] [Google Scholar]
- Calegari F, Huttner WB. An inhibition of cyclin-dependent kinases that lengthens, but does not arrest, neuroepithelial cell cycle induces premature neurogenesis. J Cell Science. 2003;116:4947–4955. doi: 10.1242/jcs.00825. [DOI] [PubMed] [Google Scholar]
- Campbell DB, Li C, Sutcliffe JS, Persico AM, Levitt P. Genetic evidence implicating multiple genes in the MET receptor tyrosine kinase pathway in autism spectrum disorder. Autism Res. 2008;1:159–168. doi: 10.1002/aur.27. [DOI] [PMC free article] [PubMed] [Google Scholar]
- Caviness VS, Jr, Takahashi T. Proliferative events in the cerebral ventricular zone. Brain Dev. 1995;17:159–163. doi: 10.1016/0387-7604(95)00029-b. [DOI] [PubMed] [Google Scholar]
- Chen B, Schaevitz LR, McConnell SK. Fezl regulates the differentiation and axon targeting of layer 5 subcortical projection neurons in cerebral cortex. Proc Natl Acad Sci U S A. 2005;102:17184–17189. doi: 10.1073/pnas.0508732102. [DOI] [PMC free article] [PubMed] [Google Scholar]
- Cubelos B, Sebastián-Serrano A, Kim S, Moreno-Ortiz C, Redondo JM, Walsh CA, Nieto M. Cux-2 controls the proliferation of neuronal intermediate precursors of the cortical subventricular zone. Cereb Cortex. 2008;18:1758–1770. doi: 10.1093/cercor/bhm199. [DOI] [PubMed] [Google Scholar]
- Dehay C, Kennedy H. Cell-cycle control and cortical development. Nat Rev Neurosci. 2007;8:438–450. doi: 10.1038/nrn2097. [DOI] [PubMed] [Google Scholar]
- del Rio JA, Soriano E. Immunocytochemical detection of 5′-bromodeoxyuridine incorporation in the central nervous system of the mouse. Brain Res Dev Brain Res. 1989;49:311–317. doi: 10.1016/0165-3806(89)90033-3. [DOI] [PubMed] [Google Scholar]
- Eder C, Heinemann U. Current density analysis of outward currents in acutely isolated rat entorhinal cortex cells. Neurosci Lett. 1994;174:58–60. doi: 10.1016/0304-3940(94)90118-x. [DOI] [PubMed] [Google Scholar]
- Englund C, Fink A, Lau C, Pham D, Daza RAM, Bulfone A, Kowalczyk T, Hevner RF. Pax6, Tbr2, and Tbr1 are expressed sequentially by radial glia, intermediate progenitor cells, and postmitotic neurons in developing neocortex. J Neurosci. 2005;25:247–251. doi: 10.1523/JNEUROSCI.2899-04.2005. [DOI] [PMC free article] [PubMed] [Google Scholar]
- Feldmeyer D, Lübke J, Sakmann B. Efficacy and connectivity of intracolumnar pairs of layer 2/3 pyramidal cells in the barrel cortex of juvenile rats. J Physiol. 2006;575:583–602. doi: 10.1113/jphysiol.2006.105106. [DOI] [PMC free article] [PubMed] [Google Scholar]
- Fernandez BA, Roberts W, Chung B, Weksberg R, Meyn S, Szatmari P, Joseph-George AM, Mackay S, Whitten K, Noble B, Vardy C, Crosbie V, Luscombe S, Tucker E, Turner L, Marshall CR, Scherer SW. Phenotypic spectrum associated with de novo and inherited deletions and duplications at 16p11.2 in individuals ascertained for diagnosis of autism spectrum disorder. J Med Genet. 2010;47:195–203. doi: 10.1136/jmg.2009.069369. [DOI] [PubMed] [Google Scholar]
- Gillies K, Price DJ. The fates of cells in the developing cerebral cortex of normal and methylazoxymethanol acetate-lesioned mice. Eur J Neurosci. 1993;5:73–84. doi: 10.1111/j.1460-9568.1993.tb00207.x. [DOI] [PubMed] [Google Scholar]
- Glickstein SB, Alexander S, Ross ME. Differences in cyclin D2 and D1 protein expression distinguish forebrain progenitor subsets. Cereb Cortex. 2007;17:632–642. doi: 10.1093/cercor/bhk008. [DOI] [PubMed] [Google Scholar]
- Gorski JA, Talley T, Qiu M, Puelles L, Rubenstein JL, Jones KR. Cortical excitatory neurons and glia, but not GABAergic neurons, are produced in the Emx1-expressing lineage. J Neurosci. 2002;22:6309–6314. doi: 10.1523/JNEUROSCI.22-15-06309.2002. [DOI] [PMC free article] [PubMed] [Google Scholar]
- Götz M, Huttner WB. The cell biology of neurogenesis. Nat Rev Mol Cell Biol. 2005;6:777–788. doi: 10.1038/nrm1739. [DOI] [PubMed] [Google Scholar]
- Götz M, Stoykova A, Gruss P. Pax6 controls radial glia differentiation in the cerebral cortex. Neuron. 1998;21:1031–1044. doi: 10.1016/s0896-6273(00)80621-2. [DOI] [PubMed] [Google Scholar]
- Haubensak W, Attardo A, Denk W, Huttner WB. Neurons arise in the basal neuroepithelium of the early mammalian telencephalon: a major site of neurogenesis. Proc Natl Acad Sci U S A. 2004;101:3196–3201. doi: 10.1073/pnas.0308600100. [DOI] [PMC free article] [PubMed] [Google Scholar]
- Hille B. Ion channels of excitable membranes. Sunderland, MA: Sinauer; 2001. [Google Scholar]
- Hooks BM, Hires SA, Zhang YX, Huber D, Petreanu L, Svoboda K, Shepherd GM. Laminar analysis of excitatory local circuits in vibrissal motor and sensory cortical areas. Plos Biol. 2011;9:e1000572. doi: 10.1371/journal.pbio.1000572. [DOI] [PMC free article] [PubMed] [Google Scholar]
- Iansek R, Redman SJ. An analysis of the cable properties of spinal motoneurones using a brief intracellular current pulse. J Physiology. 1973;234:613–636. doi: 10.1113/jphysiol.1973.sp010364. [DOI] [PMC free article] [PubMed] [Google Scholar]
- Imamura O, Pagès G, Pouysségur J, Endo S, Takishima K. ERK1 and ERK2 are required for radial glial maintenance and cortical lamination. Genes Cells. 2010;15:1072–1088. doi: 10.1111/j.1365-2443.2010.01444.x. [DOI] [PubMed] [Google Scholar]
- Karasewski L, Ferreira A. MAPK signal transduction pathway mediates agrin effects on neurite elongation in cultured hippocampal neurons. J Neurobiol. 2003;55:14–24. doi: 10.1002/neu.10197. [DOI] [PubMed] [Google Scholar]
- Kowalczyk T, Pontious A, Englund C, Daza RA, Bedogni F, Hodge R, Attardo A, Bell C, Huttner WB, Hevner RF. Intermediate neuronal progenitors (basal progenitors) produce pyramidal-projection neurons for all layers of cerebral cortex. Cereb Cortex. 2009;19:2439–2450. doi: 10.1093/cercor/bhn260. [DOI] [PMC free article] [PubMed] [Google Scholar]
- Kriegstein A, Noctor S, Martínez-Cerdeño V. Patterns of neural stem and progenitor cell division may underlie evolutionary cortical expansion. Nat Rev Neurosci. 2006;7:883–890. doi: 10.1038/nrn2008. [DOI] [PubMed] [Google Scholar]
- Lange C, Huttner WB, Calegari F. Cdk4/cyclinD1 overexpression in neural stem cells shortens G1, delays neurogenesis, and promotes the generation and expansion of basal progenitors. Cell Stem Cell. 2009;5:320–331. doi: 10.1016/j.stem.2009.05.026. [DOI] [PubMed] [Google Scholar]
- Lukas J, Bartkova J, Bartek J. Convergence of mitogenic signalling cascades from diverse classes of receptors at the cyclin D-cyclin-dependent kinase-pRb-controlled G1 checkpoint. Mol Cell Biol. 1996;16:6917–6925. doi: 10.1128/mcb.16.12.6917. [DOI] [PMC free article] [PubMed] [Google Scholar]
- Martynoga B, Morrison H, Price DJ, Mason JO. Foxg1 is required for specification of ventral telencephalon and region-specific regulation of dorsal telencephalic precursor proliferation and apoptosis. Dev Biol. 2005;283:113–127. doi: 10.1016/j.ydbio.2005.04.005. [DOI] [PubMed] [Google Scholar]
- Miyama S, Takahashi T, Nowakowski RS, Caviness VS., Jr A gradient in the duration of the G1 phase in the murine neocortical proliferative epithelium. Cereb Cortex. 1997;7:678–689. doi: 10.1093/cercor/7.7.678. [DOI] [PubMed] [Google Scholar]
- Noctor SC, Martínez-Cerdeño V, Ivic L, Kriegstein AR. Cortical neurons arise in symmetric and asymmetric division zones and migrate through-specific phases. Nat Neurosci. 2004;7:136–144. doi: 10.1038/nn1172. [DOI] [PubMed] [Google Scholar]
- Noctor SC, Martínez-Cerdeño V, Kriegstein AR. Contribution of intermediate progenitor cells to cortical histogenesis. Arch Neurol. 2007;64:639–642. doi: 10.1001/archneur.64.5.639. [DOI] [PubMed] [Google Scholar]
- Ormerod MG. Analysis of cell proliferation using the bromodeoxyuridine/Hoechst-ethidium bromide method. Methods Mol Biol. 1997;75:357–365. doi: 10.1385/0-89603-441-0:357. [DOI] [PubMed] [Google Scholar]
- Perron JC, Bixby JL. Distinct neurite outgrowth signaling pathways converge on ERK activation. Mol Cell Neurosci. 1999;13:362–378. doi: 10.1006/mcne.1999.0753. [DOI] [PubMed] [Google Scholar]
- Pontious A, Kowalczyk T, Englund C, Hevner RF. Role of intermediate progenitor cells in cerebral cortex development. Dev Neurosci. 2008;30:24–32. doi: 10.1159/000109848. [DOI] [PubMed] [Google Scholar]
- Price DJ, Aslam S, Tasker L, Gillies K. Fates of the earliest generated cells in the developing murine neocortex. J Comp Neurol. 1997;377:414–422. [PubMed] [Google Scholar]
- Quinn JC, Molinek M, Martynoga BS, Zaki PA, Faedo A, Bulfone A, Hevner RF, West JD, Price DJ. Pax6 controls cerebral cortical cell number by regulating exit from the cell cycle and specifies cortical cell identity by a cell autonomous mechanism. Dev Biol. 2007;302:50–65. doi: 10.1016/j.ydbio.2006.08.035. [DOI] [PMC free article] [PubMed] [Google Scholar]
- Rakic P, Caviness VS., Jr Cortical development: view from neurological mutants two decades later. Neuron. 1995;14:1101–1104. doi: 10.1016/0896-6273(95)90258-9. [DOI] [PubMed] [Google Scholar]
- Roy K, Kuznicki K, Wu Q, Sun Z, Bock D, Schutz G, Vranich N, Monaghan AP. The Tlx gene regulates the timing of neurogenesis in the cortex. J Neurosci. 2004;24:8333–8345. doi: 10.1523/JNEUROSCI.1148-04.2004. [DOI] [PMC free article] [PubMed] [Google Scholar]
- Sahara S, O'Leary DD. Fgf10 regulates transition period of cortical stem cell differentiation to radial glia controlling generation of neurons and basal progenitors. Neuron. 2009;63:48–62. doi: 10.1016/j.neuron.2009.06.006. [DOI] [PMC free article] [PubMed] [Google Scholar]
- Saitta SC, Harris SE, McDonald-McGinn DM, Emanuel BS, Tonnesen MK, Zackai EH, Seitz SC, Driscoll DA. Independent de novo 22q11.2 deletions in first cousins with DiGeorge/velocardiofacial syndrome. Am J Med Genet A. 2004;124A:313–317. doi: 10.1002/ajmg.a.20421. [DOI] [PMC free article] [PubMed] [Google Scholar]
- Samuels IS, Karlo JC, Faruzzi AN, Pickering K, Herrup K, Sweatt JD, Saitta SC, Landreth GE. Deletion of ERK2 mitogen-activated protein kinase identifies its key roles in cortical neurogenesis and cognitive function. J Neurosci. 2008;28:6983–6995. doi: 10.1523/JNEUROSCI.0679-08.2008. [DOI] [PMC free article] [PubMed] [Google Scholar]
- Samuels IS, Saitta SC, Landreth GE. MAP'ing CNS development and cognition: an ERKsome process. Neuron. 2009;61:160–167. doi: 10.1016/j.neuron.2009.01.001. [DOI] [PMC free article] [PubMed] [Google Scholar]
- Sanders SJ, Ercan-Sencicek AG, Hus V, Luo R, Murtha MT, Moreno-De-Luca D, Chu SH, Moreau MP, Gupta AR, Thomson SA, Mason CE, Bilguvar LK, Celestino-Soper PB, Choi M, Crawford EL, Davis L, Wright NR, Dhodapkar RM, DiCola M, DiLullo NM, et al. Multiple Recurrent De Novo CNVs, Including Duplications of the 7q11.23 Williams Syndrome Region, Are Strongly Associated with Autism. Neuron. 2011;70:863–885. doi: 10.1016/j.neuron.2011.05.002. [DOI] [PMC free article] [PubMed] [Google Scholar]
- Schrader LA, Birnbaum SG, Nadin BM, Ren Y, Bui D, Anderson AE, Sweatt JD. ERK/MAPK regulates the Kv4.2 potassium channel by direct phosphorylation of the pore-forming subunit. Am J Physiol Cell Physiol. 2006;290:C852–C861. doi: 10.1152/ajpcell.00358.2005. [DOI] [PubMed] [Google Scholar]
- Shen Q, Wang Y, Dimos JT, Fasano CA, Phoenix TN, Lemischka IR, Ivanova NB, Stifani S, Morrisey EE, Temple S. The timing of cortical neurogenesis is encoded within lineages of individual progenitor cells. Nat Neurosci. 2006;9:743–751. doi: 10.1038/nn1694. [DOI] [PubMed] [Google Scholar]
- Shepherd GM, Stepanyants A, Bureau I, Chklovskii D, Svoboda K. Geometric and functional organization of cortical circuits. Nat Neurosci. 2005;8:782–790. doi: 10.1038/nn1447. [DOI] [PubMed] [Google Scholar]
- Sherr CJ, Roberts JM. CDK inhibitors: positive and negative regulators of G1-phase progression. Genes Dev. 1999;13:1501–1512. doi: 10.1101/gad.13.12.1501. [DOI] [PubMed] [Google Scholar]
- Smart IH. Proliferative characteristics of the ependymal layer during the early development of the mouse neocortex: a pilot study based on recording the number, location and plane of cleavage of mitotic figures. J Anatomy. 1973;116:67–91. [PMC free article] [PubMed] [Google Scholar]
- Takahashi T, Nowakowski RS, Caviness VS., Jr Interkinetic and migratory behavior of a cohort of neocortical neurons arising in the early embryonic murine cerebral wall. J Neurosci. 1996;16:5762–5776. doi: 10.1523/JNEUROSCI.16-18-05762.1996. [DOI] [PMC free article] [PubMed] [Google Scholar]
- Tarabykin V, Stoykova A, Usman N, Gruss P. Cortical upper layer neurons derive from the subventricular zone as indicated by Svet1 gene expression. Development. 2001;128:1983–1993. doi: 10.1242/dev.128.11.1983. [DOI] [PubMed] [Google Scholar]
- Tarui T, Takahashi T, Nowakowski RS, Hayes NL, Bhide PG, Caviness VS. Overexpression of p27 Kip 1, probability of cell cycle exit, and laminar destination of neocortical neurons. Cereb Cortex. 2005;15:1343–1355. doi: 10.1093/cercor/bhi017. [DOI] [PubMed] [Google Scholar]
- Tidyman WE, Rauen KA. Noonan, Costello and cardio-facio-cutaneous syndromes: dysregulation of the Ras-MAPK pathway. Expert Rev Mol Med. 2008;10:e37. doi: 10.1017/S1462399408000902. [DOI] [PubMed] [Google Scholar]
- Verhoeven W, Egger J, Brunner H, de Leeuw N. A patient with a de novo distal 22q11.2 microdeletion and anxiety disorder. Am J Med Genet A. 2011;155A:392–397. doi: 10.1002/ajmg.a.33802. [DOI] [PubMed] [Google Scholar]
- Wu SX, Goebbels S, Nakamura K, Nakamura K, Kometani K, Minato N, Kaneko T, Nave KA, Tamamaki N. Pyramidal neurons of upper cortical layers generated by NEX-positive progenitor cells in the subventricular zone. Proc Natl Acad Sci U S A. 2005;102:17172–17177. doi: 10.1073/pnas.0508560102. [DOI] [PMC free article] [PubMed] [Google Scholar]
- Xiao J, Liu Y. Differential roles of ERK and JNK in early and late stages of neuritogenesis: a study in a novel PC12 model system. J Neurochem. 2003;86:1516–1523. doi: 10.1046/j.1471-4159.2003.01961.x. [DOI] [PubMed] [Google Scholar]