

Abstract
Goal-oriented signals from the prefrontal cortex gate the selection of appropriate actions in the basal ganglia. Key nodes within this fronto-basal ganglia action regulation network are increasingly engaged when one anticipates the need to inhibit and override planned actions. Here, we ask how the advance preparation of action plans modulates the need for fronto-subcortical control when a planned action needs to be withdrawn. Functional magnetic resonance imaging data were collected while human participants performed a stop task with cues indicating the likelihood of a stop signal being sounded. Mathematical modeling of go trial responses suggested that participants attained a more cautious response strategy when the probability of a stop signal increased. Effective connectivity analysis indicated that, even in the absence of stop signals, the proactive engagement of the full control network is tailored to the likelihood of stop trial occurrence. Importantly, during actual stop trials, the strength of fronto-subcortical projections was stronger when stopping had to be engaged reactively compared with when it was proactively prepared in advance. These findings suggest that fronto-basal ganglia control is strongest in an unpredictable environment, where the prefrontal cortex plays an important role in the optimization of reactive control. Importantly, these results further indicate that the advance preparation of action plans reduces the need for reactive fronto-basal ganglia communication to gate voluntary actions.
Introduction
Our actions occasionally run into error, sometimes with dramatic consequences. Advance preparation helps optimize performance, but the mechanisms underlying this benefit remain elusive. Recent advances characterize the voluntary control over our actions in terms of the operation of action control networks in the brain, with goal-oriented signals from prefrontal cortex gating the selection of appropriate actions in the basal ganglia (Aron, 2011; Frank, 2011). The operation of top–down action control is most apparent when the need to override our planned actions occurs suddenly, sporadically, and unpredictably. In highly predictable situations, a set of proactively prepared action plans could help the basal ganglia select actions with less reliance on top–down control.
The dynamics of fronto-basal ganglia networks have been studied extensively in the field of response inhibition, in which incidental stop signals designate that a planned action needs to be withdrawn (Aron et al., 2007; Verbruggen et al., 2010). Key to efficient response inhibition is a fast hyperdirect pathway connecting right inferior frontal gyrus (rIFG) and presupplementary motor area (pre-SMA) with the subthalamic nucleus (STN), as well as an indirect pathway between rIFG/pre-SMA and the caudate nucleus (Duann et al., 2009; Jahfari et al., 2011; Swann et al., 2011). Interestingly, when stop signals occur frequently, action control nodes can be prepared proactively, even when the expected stop signal is not presented (Chikazoe et al., 2009; Jahfari et al., 2010; Braver, 2012). However, it is an open question whether the proactive preparation of action plans helps in reducing the role of top–down control in action selection.
Here, we tested whether cortico-subcortical connections important for control are modulated during proactive (prepared) and reactive response inhibition. A probabilistic stop task with cues indicating the likelihood of stop trials was used to manipulate proactive and reactive response strategies (Fig. 1A). To understand how response strategies are adjusted on go trials with the increasing likelihood of a stop trial, the linear ballistic accumulator (LBA) model was used. The LBA is a mathematical model that can account for latent cognitive processes such as strategic response adjustments (Fig. 1B) (Brown and Heathcote, 2008; Forstmann et al., 2011). Modulation of fronto-basal ganglia communication during reactive and proactive control was examined by modeling the fMRI data with a recently developed method called ancestral graphs (Waldorp et al., 2011). This method can identify functional or effective connectivity constrained by a model selection approach to identify the best model of observed brain dynamics (Fig. 2).
Figure 1.

Probabilistic stop task and LBA model. A, Each trial started with a cue indicating the probability that a stop signal would be presented. The cue was followed by a house or face stimulus, indicating a left (right-hand index finger) or right (right-hand middle finger) response. During stop trials, a tone was played at some delay (SSD) after the presentation of the go stimulus. The tone instructed participants to suppress the indicated response. The likelihood of a stop signal presentation was 25% in the low, 50% in the high, and 0% in the none cue blocks. B, The LBA model was used to examine strategic adjustments during go trials with increasing stop signal likelihood. Model selection was performed to identify the best model for representing the observed RT distributions (lowest BIC).
Figure 2.

Graphical representation of all ancestral graphs connectivity steps. (1) The event-related BOLD measurements are used as inputs to (2) the general linear model (GLM). (3) The seven structural fronto-basal ganglia ROIs (rIFG, pre-SMA, rSTN, rCaudate, rGPI, rGPE, rThalamus) determine the number of nodes in the ancestral graph and are used to determine the amplitudes for each trial separately for each region, such that (4) the covariance matrix for these regions can be determined based on single-trial data. (5) The data covariance matrix for each condition is then compared with all defined ancestral graph models, and each model obtains a BIC score. (6) The model with the lowest BIC values represents the group network best and is selected.
Using an anatomical region of interest (ROI) approach including the rIFG, pre-SMA, and basal ganglia nodes, we first aimed to replicate previous findings in the identification of the hyper-indirect model as best for explaining activation patterns on stop trials (Jahfari et al., 2011). We then verified the prediction that, with the increasing likelihood of a stop trial, participants should proactively recruit the same network used for stopping during go trials. On stop trials, top–down control of the basal ganglia was expected to be weaker when participants had already proactively recruited the stop network.
Materials and Methods
Participants.
A total of 16 adults (5 males; mean age, 24.1 years; range, 21–32 years) participated in this study. In accordance with the Declaration of Helsinki, all participants provided written consent before the scanning session. A local ethics committee approved the experiment, and all procedures complied with relevant laws and institutional guidelines. All participants were right-handed and had normal or corrected-to-normal vision.
Task and procedure.
In a probabilistic stop task (Fig. 1A), trials were divided into 18 mini-blocks of 20 trials with the same context. Before each mini-block, a context cue (none, low, or high) for the probability of stop trials was presented at the top of the screen for a period of 4000 ms. Each trial started with an jitter interval of 500, 1000, 1500, or 2000 ms to obtain an interpolated temporal resolution of 1000 ms. During this interval, a fixation cross was presented in the center of the screen. A house or face stimulus (go stimulus) then followed the fixation cross for 300 ms. On stop trials, the go stimulus was followed by a high tone (stop signal). In the low-probability context, 25% of the trials were stop trials, whereas in the high-probability context, 50% of the trials were stop trials. No stop signals occurred in the none context. The stop signal delay (SSD) between the go stimulus and the stop signal was adjusted separately for the low- and high-probability context trials according to standard staircase methods to ensure convergence to P(inhibit) of 0.5; SSD decreased by 50 ms after an unsuccessful stop but increased by 50 ms after a successful stop. Initial SSD was set to 250 ms for both low- and high-probability stop trials. Each trial had a fixed duration of 4000 ms. If participants had not responded within a time window of 1250 ms after go stimulus presentation, feedback stating “te langzaam” (“too slow” in Dutch) was presented for 2000 ms. To estimate the hemodynamic response per trial for each subject, all trials were followed by a null trial in which only the fixation cross was presented for 2000 ms. All stimuli were presented on a gray projection screen that was viewed via a mirror system attached to the magnetic resonance imaging (MRI) head coil. Before the MRI session, participants performed a practice block of 30 trials, with three mini-blocks of 10 trials, to familiarize with the task. In the MRI scanner, participants subsequently performed two experimental blocks, of each 9 mini-blocks, and a total of 270 go (120 none; 90 low; 60 high) and 90 stop trials (30 low; 60 high). Before each of the two experimental blocks, instructions on a computer screen indicated the response mapping for a house or face stimulus that was always given with the right index (left) or middle (right) finger of the right hand. For one-half of the participants, the response mapping started with “left” for a house stimulus and “right” for a face stimulus during the first 9 mini-blocks, and reversed afterward. The order of the mapping rule was reversed for the other one-half of the participants.
Behavioral analysis.
The percentage choice errors and median reaction times (RTs) were calculated separately for each context condition for go and failed stop trials. Stop signal reaction time (SSRT) was estimated separately for the low- and high-probability condition using the so-called “integration method” (Verbruggen and Logan, 2009a). Here, the relative finishing time of the stop process is modeled as the percentile of the go RT distribution equal to the probability of responding given a stop signal, P_resp. The efficiency of the stopping process, SSRT, is estimated by subtracting the average stop signal delay (SSD) from the go RT percentile matching P_resp. For example, when P_resp = 0.5, SSD would be subtracted from the median go RT to obtain an estimate of the time needed to withdraw a planned response (SSRT). Repeated-measures ANOVAs were used to test how the increasing likelihood of a stop signal affects performance on go and stop trials.
Linear ballistic accumulator model.
Based on go trial RT distributions of both correct responses and errors, the LBA model can disentangle the speed of evidence accumulation (v), the threshold for the amount of evidence to make a response (b), the start point of evidence accumulation (A), the variability of this starting point (s), and the nondecision time (t0). To gain a deeper insight into strategic response adjustments, a set of eight different models was investigated where three LBA parameters of interest were either fixed or varied across the three cue conditions: drift rate (v), response threshold (b), and starting point (A). A random-effects model was used to combine identical models across subjects and so compare models over the whole group. The best model to describe the slowing of responses over conditions was selected on the basis of the lowest total Bayesian information criterion (BIC).
Magnetic resonance imaging procedure and general analysis.
The fMRI data was acquired in a single scanning session with two runs on a 3T scanner (Philips). Each scanning run acquired 555 functional T2*-weighted echoplanar images (2202 mm FOV; 962 in-plane resolution; 3.3 mm slice thickness; 0.3 mm slice spacing; TR, 2000 ms; TE, 28 ms; FA, 90°, ascending orientation). For registration purposes, a three-dimensional T1 scan was acquired before the functional runs (T1; turbo field echo, 2202 mm FOV; 2562 in-plane resolution; 182 slices; 1.2 mm slice thickness; TR, 9.55 ms; TE, 4.6 ms; FA, 8; coronal orientation).
General analysis was performed using FEAT (FMRI Expert Analysis Tool), version 5.98, part of FSL (FMRIB's Software Library; www.fmrib.ox.ac.uk/fsl). The first six volumes were discarded to allow for T1 equilibrium effects. The remaining images were then realigned to compensate for small head movements. The data were filtered in a temporal domain using a high-pass filter with a cutoff frequency of 100 s to correct for baseline drifts in the signal. Finally, the functional data were prewhitened using FSL. All functional datasets were individually registered into 3D space using the participant's individual high-resolution anatomical images. The individual 3D was then used to normalize the functional data into Montreal Neurological Institute (MNI) space by linear scaling (affine transformation). The statistical evaluation was performed using the general linear model with separate regressors for face and house stimuli during go trials (“none,” “low,” “high”), successful stop trials (low, high), and failed stop trials (low, high). One regressor was defined for error or missed trials, and one for the null trials in which only the fixation cross was presented. The design matrix was generated with a hemodynamic response function and its first derivative with local autocorrelation correction (Woolrich et al., 2001). To replicate previous fMRI results using a probabilistic stop signal task, we computed the following contrasts: (1) successful stop (low, high)–go (none), (2) failed stop (low, high)–go (none), (3) go high–go none, (4) go low–go none. Higher-level analysis was performed using FLAME (FMRIB's Local Analysis of Mixed Effects) stage 1 and stage 2 with automatic outlier detection (Beckmann et al., 2003; Woolrich et al., 2004, 2009). For the whole-brain analysis Z (Gaussianized T/F) statistic images were thresholded using clusters determined by z > 3.1 (stop vs go), z > 2.3 (go low or high vs go none) with p = 0.05 (using Gaussian random field theory).
House and face stimuli were originally included for an explorative analysis on the potential effects of preparatory control on visual areas (Egner and Hirsch, 2005). However, because an initial analysis with the fusiform face area and the parahippocampal place area did not yield any clear effects of control on visual processing, these were not further investigated.
Ancestral graphs analysis of connectivity.
The graphical representation shown in Figure 2 portrays all steps taken for the computation of ancestral graphs connectivity and model comparisons. Ancestral graphs infer functional or effective connectivity by taking into account the distribution of BOLD activation per ROI over trials per subject, and so are not dependent on the low temporal resolution of the time series in fMRI. The causal interpretations of the connections from ancestral graphs can be described as follows:
A→B: A is a cause of B (effective connectivity).
A–B: A is a cause of B and/or B is cause of A (functional connectivity).
A↔B: There is a latent comman cause of A and B (unobserved systems).
A graphical model reflects the joint distribution of several neuronal systems with the assumption that for each individual the set of active regions is the same (as in any group analysis of connectivity). The joint distribution (graphical model) of two nodes is estimated from the replications of condition-specific trials (for example, successful stop trials), and not from the time series. Directed connections are regression parameters in the usual sense (denoted by β) and undirected connections are partial covariances (unscaled partial correlations; denoted by Λ). The bidirected connections refer to the covariance of the residuals from the regressions (denoted by Ω). These three types of connections can be identified by modeling the covariance matrix as follows:
 |
A random-effects model is used to combine models across participants to then compare different models over the whole group using BIC. The graph with the lowest BIC value will be selected. For the purpose of testing differences between connections, Waldorp et al. (2011) combined the estimation of ancestral graphs with a random-effects model in which the parameters (connections) of each subject are from a normal distribution with unknown mean and variance. The main assumption of the random effects model is that all participants are from the same population, but that they can differ in connection strength. The model is compared at the group level to other models and is tested for fit at the individual level. The resulting ancestral graph is the best representation at the group level and at least an adequate representation at the individual level.
The model selected by the BIC is the best group representation of the connections between ROIs. To assess relative fit between the selected model and saturated model, the ancestral graphs method makes use of a modified version of the likelihood ratio (LR) test. For ancestral graphs, the modified LR test is defined as the ratio of the model of interest (hypothesis) and the unrestricted (saturated) model. The test is corrected for being overly sensitive because the data can deviate from normality slightly (Yuan and Bentler, 1997). The corrected test, referred to as TA, has asymptotically a χ2 distribution with p(p + 1)/2 − q degrees of freedom, where p is the number of variables and q is the number of parameters. The test represents the relative difference in fit between the saturated model and the hypothesized model. Smaller values of TA indicate a good relative fit to the observed data, compared with the full-saturated model; that is, a small value of TA means that leaving out connections still corresponds well to the data. A significance level of α = 0.05 was used to reject models with a poor fit at the subject level. Please see Waldorp et al. (2011) for a more detailed description of the fit procedure and TA, or a more detailed description of the ancestral graphs method including comparisons with other methods like structural equation modeling or dynamic causal modeling.
To obtain the single-trial images for ancestral graph connectivity, fMRI data processing was performed using FEAT (FMRI Expert Analysis Tool), version 5.98, part of FSL (FMRIB's Software Library; www.fmrib.ox.ac.uk/fsl). Z (Gaussianized T/F) statistic images were thresholded at p = 0.01 (uncorrected). Based on previous findings (Jahfari et al., 2011), a set of seven right hemisphere anatomical ROIs were defined as key nodes for stop trials: rIFG [center of gravity (cog), 51, 19, 17], rPreSMA (cog, 9, 24, 50), rGPi (cog, 17, −6, −4), rGPe (cog, 20, −4, 0), rCaudate (cog, 13, 10, 10), rThalamus (cog, 11, −18, 7), and rSTN (cog, 8, −9, −11). The STN template in MNI space was derived from a previous study, using ultrahigh 7 tesla scanning (Forstmann et al., 2010). For each ROI, with the exception of the STN mask, the standardized amplitude parameters of only the active voxels (as identified with F tests) were obtained per subject, per trial, and per condition. When the likelihood of a stop signal presentation was low, the average number of parameters per ROI (i.e., the average number of trials per subject) was 13.4 (SD, 2.0) for successful stop trials and 16 (SD, 2.1) for failed stop trials. When the likelihood of a stop signal presentation was high, this average was 28.8 (SD, 2.5) for successful stop trials and 30.2 (SD, 2.9) during failed stop trials. During go trials, the average number of parameters per ROI for the index finger was 41.9 (SD, 1.8) for the low and 31.9 (SD, 1.3) for the high condition. When participants responded with their right-hand middle finger, this average was 43.8 (SD, 1.5) for the low and 25.7 (SD, 1.1) for the high condition. Error trials and misses were excluded from ancestral graphs analysis.
To examine how top–down control of the basal ganglia is modulated by proactive and reactive response inhibition, model fits were performed on the following trials: (1) successful stop low, (2) successful stop high, (3) failed stop low, (4) failed stop high, (5) correct go none, (6) correct go low, and (7) correct go high. A set of nine potential stop models containing the hyperdirect, indirect, or both pathways were tested to find the best model that can explain the pattern of activation in the predefined regions of interest during stop trials (see Table 1 for the specification of these models). In the current modeling setup, testing for direction between pre-SMA and rIFG is not possible because both project into the same basal ganglia nodes. As a result, introducing a direction here will not induce any colliding arrows, and so no other conditional independencies that are observable in the data [for a detailed technical description of colliders, see Waldorp et al. (2011)].
Table 1.
Models specified for ancestral graphs analysis
| Model | Specified path |
|---|---|
| Right hemisphere models | |
| Indirect | |
| 1 Cx = rIFG | Cx–rCaudate–rGPE–rGPI–rThalamus |
| 2 Cx = pre-SMA | |
| 3 Cx = rIFG and pre-SMA | |
| Hyperdirect | |
| 4 Cx = rIFG | Cx–rSTN–rGPI–rThalamus |
| 5 Cx = pre-SMA | |
| 6 Cx = rIFG and pre-SMA | |
| Hyperdirect + indirect | |
| 7 Cx = rIFG | Cx–rCaudate–rGPE–rGPI–rThalamus + Cx–rSTN–rGPI–rThalamus |
| 8 Cx = pre-SMA | |
| 9 Cx = rIFG and pre-SMA |
Cx = ROIs used as cortex areas with unique projections to the basal ganglia.
Results
Behavior
Table 2 gives an overview of the behavioral data. As expected, RTs became longer with the increasing likelihood of a stop trial (F(2,30) = 24.3; p < 0.001), while the percentage errors decreased (F(2,30) = 10.9; p < 0.001). Three participants did not have a sufficient number of error trials and were excluded from LBA analyses. Model selection indicated that the observed RT differences during go trials were best explained by a constrained LBA model, where only the threshold (b) for response caution was varied over the conditions (Table 3). Inspection of the threshold (b) parameters [none: mean (M), 277.5; SD, 72.1; low: M, 312.4; SD, 75.7; high: M, 376.4; SD, 124.6] suggested that participants became more cautious on go trials when the probability of a stop signal increased (F(2,24) = 22.4; p < 0.001) (Fig. 3). During stop trials, the high-probability stop condition prolonged RTs on failed stop trials (F(1,15) = 15.7; p < 0.01), and prolonged the SSD (F(1,15) = 26.5; p < 0.001). Complementing previous results, stopping performance (SSRT) was not influenced by stop signal probability (Logan and Burkell, 1986) or by proactive response strategy adjustments (Verbruggen and Logan, 2009b).
Table 2.
Behavioral data probabilistic stop task
| None (0% stop) | Low (25% stop) | High (50% stop) | |
|---|---|---|---|
| Go | |||
| Median RT (ms) | 505.3 (84.5) | 560.6 (86.6) | 643.6 (131.6) |
| Choice errors (%) | 4.7 (4.0) | 3.0 (1.8) | 1.5 (1.3) |
| Stop respond | |||
| Median RT (ms) | — | 525.8 (87.9) | 598.0 (139.0) |
| Stop inhibit | |||
| SSD (ms) | — | 315.9 (111.0) | 413.2 (162.1) |
| P_resp | — | 0.56 (0.01) | 0.52 (0.0) |
| SSRT (ms) | — | 256.8 (44.4) | 237.6 (47.3) |
Values in parentheses are SDs.
Table 3.
LBA model selection
| Model | Free parameters LBA | BIC |
|---|---|---|
| 1 | b | 14,672.4 |
| 2 | A and b | 14,729.8 |
| 3 | b and v | 14,730.4 |
| 4 | A | 14,779.3 |
| 5 | A and b and v | 14,831.4 |
| 6 | A and v | 14,908.0 |
| 7 | v | 15,037.0 |
| 8 | None | 15,159.0 |
Drift (v), starting point (A), threshold (b). The model with the lowest BIC was selected as the most representative model for go trials during the probabilistic stop paradigm.
Figure 3.

Participants become more cautious during go trials when the likelihood of stop signal presentation is increased. Error bars indicate SEM.
The hyperdirect and indirect pathways during reactive and proactive control
Complementing previous results, random-effects analysis across the whole group pointed toward a model that involved both the hyperdirect and indirect pathways during successful and failed stop trials (Jahfari et al., 2011). Note that this hyper-indirect model (Fig. 4A) had the lowest BIC values (indicating the best model) in all stop conditions and showed a good fit to the data (Table 4, left side). We then examined whether this same stop network is recruited during go trials. As displayed in Figure 4B, the relative fit of the hyper-indirect stop model improved (decreased TA) consistently across subjects (Fig. 5) during go trials, with the increasing likelihood of a stop signal. In line with this finding, the number of participants for whom the model showed a good fit to the observed go trial data was increased (Table 4, right side, or number above the bars in Fig. 4B).
Figure 4.
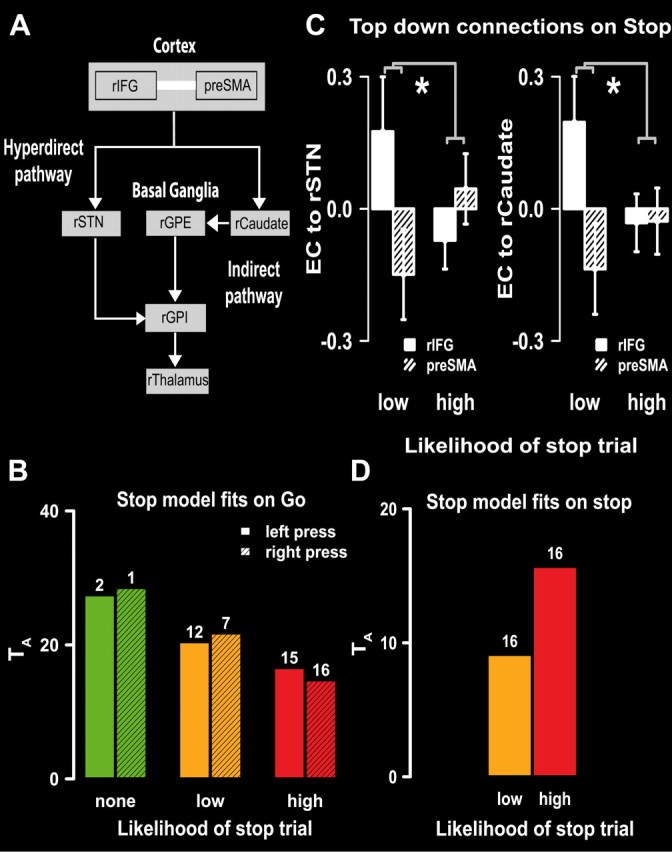
The hyper-indirect model during reactive and proactive control. A, The hyper-indirect model, with both the hyperdirect (left) and indirect pathway (right), was identified as the best model to represent the pattern of activation during all stop trials. The directed white arrows represent effective connectivity between two regions; the undirected white lines represent functional connectivity. Both the rIFG and pre-SMA projected into the rSTN and rCaudate. B, When the likelihood of a stop trial was high, the hyper-indirect model was fully recruited on go trials. With the increasing likelihood of stop signals, the relative fit of the hyper-indirect model to the data improved (smaller values of TA) when compared with the saturated model. Consistently, the number of subjects where the model showed a fit to the data (number above each bar) increased with the increasing likelihood of a stop signal. C, Strength and direction for top–down projections into the basal ganglia during proactive and reactive response inhibition. The asterisks (*) represent significant differences in absolute connection strengths between the high and low stop conditions. Effective connectivity (EC) was stronger but reversed in direction for the two PFC regions projecting into the rSTN (left panel) and rCaudate (right panel) when inhibitory control was unprepared and reactive. D, While the hyper-indirect model fitted for all participants during reactive and proactive stop trials, a better relative fit (lower TA) was found for reactive stopping, where the defined top–down connections were more strongly recruited.
Table 4.
Model fits for the indirect and hyperdirect pathways during proactive and reactive response inhibition (stop) and go
| Successful stop |
Failed stop |
Go none (0% stop) |
Go low (25% stop) |
Go high (50% stop) |
||||||||||||||||
|---|---|---|---|---|---|---|---|---|---|---|---|---|---|---|---|---|---|---|---|---|
| Low (25%) |
High (50%) |
Low (25%) |
High (50%) |
Left key |
Right key |
Left key |
Right key |
Left key |
Right key |
|||||||||||
| BIC | N | BIC | N | BIC | N | BIC | N | BIC | N | BIC | N | BIC | N | BIC | N | BIC | N | BIC | N | |
| Indirect | ||||||||||||||||||||
| rIFC | 1688.7 | 16 | 2310.7 | 16 | 1699.4 | 16 | 2481.4 | 16 | 3810.7 | 0 | 3834.0 | 0 | 3139.5 | 10 | 3158.3 | 5 | 2416.0 | 16 | 2158.5 | 16 |
| Pre-SMA | 1688.8 | 16 | 2320.1 | 16 | 1701.1 | 16 | 2499.4 | 16 | 3827.6 | 0 | 3837.0 | 0 | 3133.9 | 10 | 3174.8 | 6 | 2389.2 | 16 | 2161.0 | 16 |
| rIFC and pre-SMA | 1489.9 | 16 | 1960.4 | 16 | 1451.7 | 16 | 2112.9 | 16 | 3267.4 | 4 | 3246.9 | 0 | 2657.1 | 13 | 2660.5 | 13 | 2099.1 | 16 | 1841.8 | 16 |
| Hyperdirect | ||||||||||||||||||||
| rIFC | 1792.7 | 16 | 2601.1 | 16 | 1866.8 | 16 | 2782.6 | 16 | 4390.3 | 0 | 4392.5 | 0 | 3631.6 | 8 | 3667.9 | 1 | 2676.9 | 16 | 2390.5 | 16 |
| Pre-SMA | 1785.3 | 16 | 2609.1 | 16 | 1868.7 | 16 | 2786.1 | 16 | 4413.4 | 0 | 4407.9 | 0 | 3597.9 | 8 | 3654.2 | 0 | 2686.7 | 16 | 2398.1 | 16 |
| rIFC and pre-SMA | 1619.9 | 16 | 2254.1 | 16 | 1648.7 | 16 | 2438.4 | 16 | 3889.3 | 0 | 3845.7 | 1 | 3179.2 | 8 | 3207.5 | 4 | 2391.0 | 16 | 2113.7 | 16 |
| Hyper + indirect | ||||||||||||||||||||
| rIFC | 1655.4 | 16 | 2241.6 | 16 | 1654.1 | 16 | 2396.1 | 15 | 3726.0 | 0 | 3724.7 | 0 | 3108.0 | 5 | 3092.8 | 2 | 2344.9 | 16 | 2088.5 | 16 |
| Pre-SMA | 1628.1 | 16 | 2259.1 | 16 | 1657.7 | 16 | 2417.7 | 15 | 3766.0 | 0 | 3743.1 | 0 | 3068.8 | 8 | 3095.7 | 1 | 2327.9 | 16 | 2098.5 | 16 |
| rIFC and pre-SMA | 1426.3 | 16 | 1860.8 | 16 | 1387.7 | 16 | 2000.3 | 15 | 3170.5 | 2 | 3111.3 | 1 | 2580.9 | 12 | 2560.2 | 7 | 2006.3 | 15 | 1762.1 | 16 |
Lower BIC values indicate a better balance between the variance and bias of the estimated model connections. N, The number of subjects where the defined model actually fitted the activity pattern in the a priori anatomically defined ROIs. %, Likelihood of stop trial occurrence. The best model for each condition, on the basis of lowest BIC values, is marked in bold.
Figure 5.

Individual subject model fits on go trials. Consistent across participants, relative fits of the hyper-indirect model improved (decreased TA) with the increasing likelihood of stop-trial presentation (x-axis). The black bars represent trials in which a correct left response press was made, and the white bars indicate correct trials with a right response press.
In addition to the connectivity analyses, we also investigated a set of conventional contrasts reported in previous studies using the stop signal paradigm (Table 5). As expected, contrasting successful stop trials with go trials revealed activation in the rIFG, pre-SMA, left and right parietal lobe, left insula, left frontal pole, and left and right temporal lobe. Contrasting failed stops with go resulted in a similar set of clusters. In line with previous findings, the comparisons of proactive go trials (likelihood of stop is high) with pure go trials (likelihood of stop is none) activated nodes of the stop network including the rIFG, pre-SMA, the right inferior parietal lobe, and the left insula. No clusters were found when comparing the go low (likelihood of stop is low) with go none, or the go high with go low trials. Therefore, compared with traditional contrast analysis, changes in connectivity patterns seem more sensitive to gradual increases in the likelihood of stop trials.
Table 5.
Location of increased activation in general contrasts
| Anatomical area | Cluster size (mm2) | MNI coordinates (mm) |
Maximum effect size | ||
|---|---|---|---|---|---|
| x | y | z | |||
| Successful stop (high, low) > go none | |||||
| Inferior frontal gyrus | 137 | 46 | 23 | 35 | 3.92 |
| Pre-SMA | 1527 | 0 | 42 | 38 | 5.08 |
| Inferior parietal lobe | 1825 | −60 | −54 | 30 | 5.37 |
| Inferior parietal lobe | 2371 | 68 | −32 | −2 | 5.32 |
| Insula | 157 | −30 | 18 | −18 | 4.59 |
| Frontal pole | 167 | −54 | 32 | −10 | 3.76 |
| Temporal lobe | 587 | 50 | 20 | −16 | 4.26 |
| Temporal lobe | 561 | −68 | −38 | −2 | 4.65 |
| Failed stop (high, low) > go none | |||||
| Inferior frontal gyrus | 2486 | 32 | 22 | −8 | 7.06 |
| Pre-SMA | 2805 | 8 | 40 | 24 | 6.64 |
| Inferior parietal lobe | 1147 | −58 | −46 | 30 | 5.90 |
| Insula | 1042 | −36 | 20 | −12 | 6.84 |
| Frontal pole | 130 | −24 | 48 | 22 | 5.03 |
| Temporal lobe | 3510 | 68 | −34 | 0 | 7.13 |
| Thalamus | 820 | 8 | −6 | 2 | 5.01 |
| Cingulate gyrus posterior division | 464 | 0 | −18 | 26 | 5.98 |
| Go high > go none | |||||
| Inferior frontal gyrus | 3554 | 28 | 22 | −10 | 5.43 |
| Pre-SMA | 1450 | 6 | 34 | 30 | 4.64 |
| Inferior parietal lobe | 833 | 48 | −40 | 32 | 3.15 |
| Insula | 647 | −28 | 24 | −8 | 4.77 |
MNI coordinates are those of the gravity point of each cluster. Cluster thresholding with z > 3.1 (stop vs go) and z > 2.3 (go high vs go low) with p < 0.05, whole-brain corrected.
Previous work with proactive and reactive stop paradigms has shown that key areas important for stopping become more active during go trials, with the increasing likelihood of a stop trial (Chikazoe et al., 2009; Jahfari et al., 2010). The current findings complement this by showing that not only the same areas but also the full stop network (in terms of communication between these areas) is prepared in advance, when participants attain a proactive response strategy.
Top–down control of the basal ganglia
We hypothesized that when go is the default response (i.e., 25% stop trials), reactive stopping relies more on action override signals from the PFC into the basal ganglia. Hence, when go and stop responses are just as likely (i.e., 50% stop trials) and the stop network is already proactively recruited, the strengths of top–down projections for basal ganglia control should be weaker. Note that the ancestral graphs method defines effective connectivity as a regression (i.e., from A to B). Here, the direction of the connection (regression) is informative for the type of relationship, whereas the absolute regression value is an indication of connection strength. Therefore, to test our hypothesis, we compared the absolute normalized individual regression values (effective connectivity strength) from the four top–down connections (rIFG → rSTN, rIFG → rCaudate, pre-SMA → rSTN, pre-SMA → rCaudate) of the hyper-indirect model between the low- and high-probability stop conditions. As predicted, effective connectivity strengths were stronger for projections into both the rSTN (F(1,15) = 5.5; p < 0.05) and the rCaudate (F(1,15) = 6.4; p < 0.05) during low- compared with high-probability signal trials (Fig. 4C). Importantly, this effect was only present when participants successfully inhibited their response. On failed stop trials, there were no differences in top–down projection strengths between the high and low signal trials (all p > 0.05).
In line with our previous findings (Jahfari et al., 2011), inspection of the type of relationship indicated that, while all top–down projections were stronger for reactive stopping, the direction of projections (regressions) was more positive for rIFG into the basal ganglia while more negative for pre-SMA into the basal ganglia. That is, when inhibition was reactive, the directed relationship was stronger positive from the rIFG into the basal ganglia (i.e., higher activity rIFG → higher activity rSTN/rCaudate), while stronger negative from the pre-SMA into the basal ganglia (i.e., higher activity pre-SMA → lower activity rSTN/rCaudate). We will discuss the possible significance of the negative regression weights from the pre-SMA into the basal ganglia in the discussion. As shown in Figure 4D, the stronger top–down projections were further reflected in the comparison of relative fit between the low- and high-probability stop trials (i.e., lower TA indicates an improved relative fit). That is, consistent across subjects (Fig. 6), the hyper-indirect model provided a better representation of the activation patterns during stopping when top–down projections were strongest, that is, during reactive compared with proactive control.
Figure 6.

Individual subject plots of changes in relative fit (TA) during proactive and reactive stopping. The labels on the x-axis indicate the likelihood of stop signal presentation.
Discussion
The present study examined how proactive preparation of action plans impacts the level of top–down action control during response inhibition. Connectivity analyses indicated that the same network used for full stopping is also recruited during go trials with the increasing likelihood of a stop trial. Importantly, when stopping was proactively prepared, prefrontal cortex projections into the basal ganglia were weaker for successfully stopped trials. That is, when inhibition was unprepared, top–down control from the cortex into the basal ganglia was stronger for rejecting the default (go) (Fleming et al., 2010). These differences were not observed for failed stop trials.
Model-based connectivity comprises a novel but increasingly important approach in the neurosciences (Bressler and Menon, 2010; Smith et al., 2011). Therefore, replication studies are essential for reliability assessments and a firm interpretation of results. Here, we first replicated previous effective connectivity findings by showing that both the hyperdirect and indirect pathway combined best explain the pattern of activity during response inhibition (Jahfari et al., 2011). The dominance of this model relative to the indirect or the hyperdirect pathway by themselves was reflected in BIC values and model fits, for both proactive and reactive stop trials.
The observation that response strategies, during go trials, are adjusted parametrically with the increasing likelihood of stop trial presentation (as indicated by a cue) was reflected in increased levels of accuracy, reaction times, and response thresholds. These results support previous findings (Verbruggen and Logan, 2009b; Greenhouse et al., 2012) and suggest that the proactive preparation of action plans for the go, stop, or both responses is tailored to the level of information that is available. This interpretation was further corroborated by model fits of the stop network to go trials. When the likelihood of a stop trial was high, the hyper-indirect model was most representative and showed a good fit to the data across subjects. Notably, both the representation and model fits improved with an increasing likelihood of stop trial presentation, indicating that the proactive preparation of the action control network is tailored adaptively to the likelihood of stop signal occurrence.
Importantly, the proactive preparation to stop reduced the need for strong top–down projections to successfully inhibit a response. When the likelihood of a stop trial was small, stop trials were accompanied by stronger top–down projections from the rIFG and the pre-SMA into the rCaudate and rSTN, respectively, to accomplish successful response inhibition. These cortico-subcortical projections were weaker when participants were expecting stop trials, and had already prepared the action control network proactively. Although the hyper-indirect model was optimal for representing all stop trials, the top–down connections for action updating fit better for stopping in reactive compared with proactive contexts. Various studies have examined the role of the rIFG and the pre-SMA in response regulation (Forstmann et al., 2008, 2010; Mostofsky and Simmonds, 2008) and inhibition (Chambers et al., 2009; Sharp et al., 2010; Verbruggen et al., 2010; Zandbelt and Vink, 2010; Swann et al., 2012). The current study extends this literature by showing that the level of advance preparation modulates the strength and type of fronto-subcortical communication.
As shown in Table 4, proactive and reactive control both recruited the same network (best fits are found for the hyper-indirect model in all conditions). Notably, when the likelihood of stop trials was increased, model fits improved for go but worsened for stop trials. Although the stop network was more likely to be engaged during stop than go trials (i.e., overall BICs were smaller for stop trials), during high probability trials BIC fits were roughly the same for go and stop. So proactive control engaged the stop network to a similar extent regardless of whether a stop trial ended up occurring. When a stop trial occurred unexpectedly, the sudden urgency to stop, and possibly the unexpectedness of the stop signal itself enhanced the gain of the stop network (improved BICs during reactive stop). In other words, the reversal of fits by stop probability (i.e., low vs high) from go to stop trials is expected due to proactive versus reactive engagements of the stop network.
Complementing our previous connectivity findings, we observed strong but reversed (of opposite sign) connection strengths from the rIFG and pre-SMA into the basal gangtlia (Jahfari et al., 2011), especially when stopping was reactive and unprepared. A possible explanation might be that the unprepared reactive stop trials invoke more conflict (Yeung et al., 2004), leading to a more rapid communication between the pre-SMA and the basal ganglia (Hikosaka and Isoda, 2010). Specifically, the pre-SMA might detect conflict with the prepared default response (go), and send a fast signal to the basal ganglia to increase response thresholds (leading to decreased activation in the basal ganglia), and reactivity to updating (inhibitory) signals from the rIFG. Various findings in the literature are consistent with this interpretation. First, recent studies have linked the activity within the pre-SMA (and its connections with the striatum) to adjustments in response caution (Forstmann et al., 2008, 2010). Second, the literature seems to suggest that stimulation of the STN has differential effects on the interactions with rIFG (more efficient stopping) and pre-SMA (more impulsive behavior). Specifically, one recent study using direct recordings from the STN found fast diminishments in low-frequency power for high relative to low conflict (leading to decreased activation), followed by greater cue locked high-delta power at approximately the same time of pre-SMA activation (Cavanagh et al., 2011). Recent studies have further shown that deep-brain stimulation of the STN leads to increased cortical activation in the right frontal cortex (Swann et al., 2011) and improves the efficiency of stopping (van den Wildenberg et al., 2006; Wylie et al., 2010; Swann et al., 2012), while disrupting the positive correlation between pre-SMA activation and behavioral decision thresholds (Cavanagh et al., 2011). Finally, activity in the pre-SMA has been found to precede activity in the rIFG during outright stopping (Swann et al., 2012) and task switching (Neubert et al., 2010), where especially an inhibitory/updating role has been suggested for the rIFG. Together, the current findings indicate a fast conflict-detecting role for the pre-SMA that prepares the basal ganglia for the updating inhibitory commands from the rIFG. An alternative explanation could be that, on trials in which the rSTN is not recruited as much by the rIFG, the pre-SMA becomes more active to detect conflict (Wiecki and Frank, 2010).
Finally, we note that, as both the pre-SMA and the rIFG project into the same basal ganglia nodes, the current approach (with ancestral graphs) cannot informatively model a directed relationship between the two cortex areas [for a detailed technical explanation, see Waldorp et al. (2011)]. Therefore, although the hyper-indirect model indicates functional connectivity between the rIFG and pre-SMA, no inferences can be made about the direction of this relationship during proactive and/or reactive control. Therefore, future studies using high temporal resolution techniques are key to further understand cortico-cortico and cortico-subcortical interactions that underlie voluntary control (Cohen, 2011).
To summarize, when the likelihood of response inhibition was increased, participants proactively prepared a plan to stop even when the signal for response inhibition was omitted. Effective connectivity analyses indicate that proactive preparation of action plans in highly predictable situations reduces the reliance of the basal ganglia on the goal-oriented prefrontal cortex during response inhibition. These findings suggest that top–down control is strongest in an unpredictable environment, in which the PFC actively has to update the response gating basal ganglia.
Footnotes
This work was supported by Mozaiek (S.J.), VENI (B.U.F.), and VICI (K.R.R.) grants from the Netherlands Organization for Scientific Research.
References
- Aron AR. From reactive to proactive and selective control: developing a richer model for stopping inappropriate responses. Biol Psychiatry. 2011;69:e55–e68. doi: 10.1016/j.biopsych.2010.07.024. [DOI] [PMC free article] [PubMed] [Google Scholar]
- Aron AR, Behrens TE, Smith S, Frank MJ, Poldrack RA. Triangulating a cognitive control network using diffusion-weighted magnetic resonance imaging (MRI) and functional MRI. J Neurosci. 2007;27:3743–3752. doi: 10.1523/JNEUROSCI.0519-07.2007. [DOI] [PMC free article] [PubMed] [Google Scholar]
- Beckmann CF, Jenkinson M, Smith SM. General multilevel linear modeling for group analysis in FMRI. Neuroimage. 2003;20:1052–1063. doi: 10.1016/S1053-8119(03)00435-X. [DOI] [PubMed] [Google Scholar]
- Braver TS. The variable nature of cognitive control: a dual mechanisms framework. Trends Cogn Sci. 2012;16:106–113. doi: 10.1016/j.tics.2011.12.010. [DOI] [PMC free article] [PubMed] [Google Scholar]
- Bressler SL, Menon V. Large-scale brain networks in cognition: emerging methods and principles. Trends Cogn Sci. 2010;14:277–290. doi: 10.1016/j.tics.2010.04.004. [DOI] [PubMed] [Google Scholar]
- Brown SD, Heathcote A. The simplest complete model of choice response time: linear ballistic accumulation. Cogn Psychol. 2008;57:153–178. doi: 10.1016/j.cogpsych.2007.12.002. [DOI] [PubMed] [Google Scholar]
- Cavanagh JF, Wiecki TV, Cohen MX, Figueroa CM, Samanta J, Sherman SJ, Frank MJ. Subthalamic nucleus stimulation reverses mediofrontal influence over decision threshold. Nat Neurosci. 2011;14:1462–1467. doi: 10.1038/nn.2925. [DOI] [PMC free article] [PubMed] [Google Scholar]
- Chambers CD, Garavan H, Bellgrove MA. Insights into the neural basis of response inhibition from cognitive and clinical neuroscience. Neurosci Biobehav Rev. 2009;33:631–646. doi: 10.1016/j.neubiorev.2008.08.016. [DOI] [PubMed] [Google Scholar]
- Chikazoe J, Jimura K, Hirose S, Yamashita K, Miyashita Y, Konishi S. Preparation to inhibit a response complements response inhibition during performance of a stop-signal task. J Neurosci. 2009;29:15870–15877. doi: 10.1523/JNEUROSCI.3645-09.2009. [DOI] [PMC free article] [PubMed] [Google Scholar]
- Cohen MX. It's about Time. Front Hum Neurosci. 2011;5:2. doi: 10.3389/fnhum.2011.00002. [DOI] [PMC free article] [PubMed] [Google Scholar]
- Duann JR, Ide JS, Luo X, Li CS. Functional connectivity delineates distinct roles of the inferior frontal cortex and presupplementary motor area in stop signal inhibition. J Neurosci. 2009;29:10171–10179. doi: 10.1523/JNEUROSCI.1300-09.2009. [DOI] [PMC free article] [PubMed] [Google Scholar]
- Egner T, Hirsch J. Cognitive control mechanisms resolve conflict through cortical amplification of task-relevant information. Nat Neurosci. 2005;8:1784–1790. doi: 10.1038/nn1594. [DOI] [PubMed] [Google Scholar]
- Fleming SM, Thomas CL, Dolan RJ. Overcoming status quo bias in the human brain. Proc Natl Acad Sci U S A. 2010;107:6005–6009. doi: 10.1073/pnas.0910380107. [DOI] [PMC free article] [PubMed] [Google Scholar]
- Forstmann BU, Dutilh G, Brown S, Neumann J, von Cramon DY, Ridderinkhof KR, Wagenmakers EJ. Striatum and pre-SMA facilitate decision-making under time pressure. Proc Natl Acad Sci U S A. 2008;105:17538–17542. doi: 10.1073/pnas.0805903105. [DOI] [PMC free article] [PubMed] [Google Scholar]
- Forstmann BU, Anwander A, Schäfer A, Neumann J, Brown S, Wagenmakers EJ, Bogacz R, Turner R. Cortico-striatal connections predict control over speed and accuracy in perceptual decision making. Proc Natl Acad Sci U S A. 2010;107:15916–15920. doi: 10.1073/pnas.1004932107. [DOI] [PMC free article] [PubMed] [Google Scholar]
- Forstmann BU, Wagenmakers EJ, Eichele T, Brown S, Serences JT. Reciprocal relations between cognitive neuroscience and formal cognitive models: opposites attract? Trends Cogn Sci. 2011;15:272–279. doi: 10.1016/j.tics.2011.04.002. [DOI] [PMC free article] [PubMed] [Google Scholar]
- Frank MJ. Computational models of motivated action selection in corticostriatal circuits. Curr Opin Neurobiol. 2011;21:381–386. doi: 10.1016/j.conb.2011.02.013. [DOI] [PubMed] [Google Scholar]
- Greenhouse I, Oldenkamp CL, Aron AR. Stopping a response has global or nonglobal effects on the motor system depending on preparation. J Neurophysiol. 2012;107:384–392. doi: 10.1152/jn.00704.2011. [DOI] [PMC free article] [PubMed] [Google Scholar]
- Hikosaka O, Isoda M. Switching from automatic to controlled behavior: cortico-basal ganglia mechanisms. Trends Cogn Sci. 2010;14:154–161. doi: 10.1016/j.tics.2010.01.006. [DOI] [PMC free article] [PubMed] [Google Scholar]
- Jahfari S, Stinear CM, Claffey M, Verbruggen F, Aron AR. Responding with restraint: what are the neurocognitive mechanisms? J Cogn Neurosci. 2010;22:1479–1492. doi: 10.1162/jocn.2009.21307. [DOI] [PMC free article] [PubMed] [Google Scholar]
- Jahfari S, Waldorp L, van den Wildenberg WP, Scholte HS, Ridderinkhof KR, Forstmann BU. Effective connectivity reveals important roles for both the hyperdirect (fronto-subthalamic) and the indirect (fronto-striatal-pallidal) fronto-basal ganglia pathways during response inhibition. J Neurosci. 2011;31:6891–6899. doi: 10.1523/JNEUROSCI.5253-10.2011. [DOI] [PMC free article] [PubMed] [Google Scholar]
- Logan G, Burkell J. Dependence and Independence in responding to double stimulation: a comparison of stop, change, and dual-task paradigms. J Exp Psychol. 1986;12:549–563. [Google Scholar]
- Mostofsky SH, Simmonds DJ. Response inhibition and response selection: two sides of the same coin. J Cogn Neurosci. 2008;20:751–761. doi: 10.1162/jocn.2008.20500. [DOI] [PubMed] [Google Scholar]
- Neubert FX, Mars RB, Buch ER, Olivier E, Rushworth MF. Cortical and subcortical interactions during action reprogramming and their related white matter pathways. Proc Natl Acad Sci U S A. 2010;107:13240–13245. doi: 10.1073/pnas.1000674107. [DOI] [PMC free article] [PubMed] [Google Scholar]
- Sharp DJ, Bonnelle V, De Boissezon X, Beckmann CF, James SG, Patel MC, Mehta MA. Distinct frontal systems for response inhibition, attentional capture, and error processing. Proc Natl Acad Sci U S A. 2010;107:6106–6111. doi: 10.1073/pnas.1000175107. [DOI] [PMC free article] [PubMed] [Google Scholar]
- Smith SM, Miller KL, Salimi-Khorshidi G, Webster M, Beckmann CF, Nichols TE, Ramsey JD, Woolrich MW. Network modelling methods for FMRI. Neuroimage. 2011;54:875–891. doi: 10.1016/j.neuroimage.2010.08.063. [DOI] [PubMed] [Google Scholar]
- Swann N, Poizner H, Houser M, Gould S, Greenhouse I, Cai W, Strunk J, George J, Aron AR. Deep brain stimulation of the subthalamic nucleus alters the cortical profile of response inhibition in the beta frequency band: a scalp EEG study in Parkinson's disease. J Neurosci. 2011;31:5721–5729. doi: 10.1523/JNEUROSCI.6135-10.2011. [DOI] [PMC free article] [PubMed] [Google Scholar]
- Swann NC, Cai W, Conner CR, Pieters TA, Claffey MP, George JS, Aron AR, Tandon N. Roles for the pre-supplementary motor area and the right inferior frontal gyrus in stopping action: electrophysiological responses and functional and structural connectivity. Neuroimage. 2012;59:2860–2870. doi: 10.1016/j.neuroimage.2011.09.049. [DOI] [PMC free article] [PubMed] [Google Scholar]
- van den Wildenberg WP, van Boxtel GJ, van der Molen MW, Bosch DA, Speelman JD, Brunia CH. Stimulation of the subthalamic region facilitates the selection and inhibition of motor responses in Parkinson's disease. J Cogn Neurosci. 2006;18:626–636. doi: 10.1162/jocn.2006.18.4.626. [DOI] [PubMed] [Google Scholar]
- Verbruggen F, Logan GD. Models of response inhibition in the stop-signal and stop-change paradigms. Neurosci Biobehav Rev. 2009a;33:647–661. doi: 10.1016/j.neubiorev.2008.08.014. [DOI] [PMC free article] [PubMed] [Google Scholar]
- Verbruggen F, Logan GD. Proactive adjustments of response strategies in the stop-signal paradigm. J Exp Psychol Hum Percept Perform. 2009b;35:835–854. doi: 10.1037/a0012726. [DOI] [PMC free article] [PubMed] [Google Scholar]
- Verbruggen F, Aron AR, Stevens MA, Chambers CD. Theta burst stimulation dissociates attention and action updating in human inferior frontal cortex. Proc Natl Acad Sci U S A. 2010;107:13966–13971. doi: 10.1073/pnas.1001957107. [DOI] [PMC free article] [PubMed] [Google Scholar]
- Waldorp L, Christoffels I, van de Ven V. Effective connectivity of fMRI data using ancestral graph theory: dealing with missing regions. Neuroimage. 2011;54:2695–2705. doi: 10.1016/j.neuroimage.2010.10.054. [DOI] [PubMed] [Google Scholar]
- Wiecki TV, Frank MJ. Neurocomputational models of motor and cognitive deficits in Parkinson's disease. Prog Brain Res. 2010;183:275–297. doi: 10.1016/S0079-6123(10)83014-6. [DOI] [PubMed] [Google Scholar]
- Woolrich MW, Ripley BD, Brady M, Smith SM. Temporal autocorrelation in univariate linear modeling of FMRI data. Neuroimage. 2001;14:1370–1386. doi: 10.1006/nimg.2001.0931. [DOI] [PubMed] [Google Scholar]
- Woolrich MW, Behrens TE, Beckmann CF, Jenkinson M, Smith SM. Multilevel linear modelling for FMRI group analysis using Bayesian inference. Neuroimage. 2004;21:1732–1747. doi: 10.1016/j.neuroimage.2003.12.023. [DOI] [PubMed] [Google Scholar]
- Woolrich MW, Jbabdi S, Patenaude B, Chappell M, Makni S, Behrens T, Beckmann C, Jenkinson M, Smith SM. Bayesian analysis of neuroimaging data in FSL. Neuroimage. 2009;45(1 Suppl):S173–S186. doi: 10.1016/j.neuroimage.2008.10.055. [DOI] [PubMed] [Google Scholar]
- Wylie SA, Ridderinkhof KR, Elias WJ, Frysinger RC, Bashore TR, Downs KE, van Wouwe NC, van den Wildenberg WP. STN stimulation influences expression and suppression of impulsive behavior in Parkinson's disease. Brain. 2010;133:3611–3624. doi: 10.1093/brain/awq239. [DOI] [PMC free article] [PubMed] [Google Scholar]
- Yeung N, Botvinick MM, Cohen J. The neural basis of error detection: conflict monitoring and the error-related negativity. Psychol Rev. 2004;111:931–959. doi: 10.1037/0033-295x.111.4.939. [DOI] [PubMed] [Google Scholar]
- Yuan K-H, Bentler P. Mean and covariance structure analysis: theoretical and practical improvements. J Am Stat Assoc. 1997;92:767–774. [Google Scholar]
- Zandbelt BB, Vink M. On the role of the striatum in response inhibition. PLoS One. 2010;5:e13848. doi: 10.1371/journal.pone.0013848. [DOI] [PMC free article] [PubMed] [Google Scholar]