

Abstract
An object that differs markedly from its surrounding—for example, a red cherry among green leaves—seems to pop out effortlessly in our visual experience. The rapid detection of salient targets, independently of the number of other items in the scene, is thought to be mediated by efficient search brain mechanisms. It is not clear, however, whether efficient search is actually an “effortless” bottom-up process or whether it also involves regions of the prefrontal cortex generally associated with top-down sustained attention. We addressed this question with intracranial EEG (iEEG) recordings designed to identify brain regions underlying a classic visual search task and correlate neural activity with target detection latencies on a trial-by-trial basis with high temporal precision recordings of these regions in epileptic patients. The spatio-temporal dynamics of single-trial spectral analysis of iEEG recordings revealed sustained energy increases in a broad gamma band (50–150 Hz) throughout the duration of the search process in the entire dorsal attention network both in efficient and inefficient search conditions. By contrast to extensive theoretical and experimental indications that efficient search relies exclusively on transient bottom-up processes in visual areas, we found that efficient search is mediated by sustained gamma activity in the dorsal lateral prefrontal cortex and the anterior cingulate cortex, alongside the superior parietal cortex and the frontal eye field. Our findings support the hypothesis that active visual search systematically involves the frontal-parietal attention network and therefore, executive attention resources, regardless of target saliency.
Introduction
When searching for a specific object in a crowded visual scene, search duration depends on the dissimilarity between that object and its surroundings. Current theories distinguish between efficient search, when the target spontaneously captures attention because it differs from its background along a simple dimension (e.g., a red cherry “pops out” among green leaves) and inefficient search, when the search requires attention to be shifted serially across the entire display to recognize the target (Wolfe, 2003; Wolfe et al., 2011). A frontal-parietal network, comprising the frontal eye fields (FEFs) and the superior parietal lobule (SPL), drive those attentional shifts exerting a continuous top-down influence on the visual cortex (Bisley and Goldberg, 2003, 2010; Moore and Armstrong, 2003; Buschman and Miller, 2007; Bressler et al., 2008). Both regions contain priority maps that guide attention toward task-relevant and/or salient items (Shulman et al., 2002; Bichot et al., 2005; Buschman and Miller, 2007; Kalla et al., 2008; Zhou and Desimone, 2011). The action of the FEF and SPL is guided by the dorsal lateral prefrontal cortex (DLPFC) and the dorsal anterior cingulate cortex (dACC). The DLPFC is actively involved in executive aspects of working memory, attention and decision making (Barceló et al., 2000; Rowe et al., 2000; Procyk and Goldman-Rakic, 2006; Heekeren et al., 2008; Kalla et al., 2009), which are crucial to identify and discard nonrelevant distractors when compared with the memorized target template (Duncan and Humphreys, 1989). The dACC is thought to control the general engagement of attention in the task until the target has been found (Cole and Schneider, 2007). However, while those four regions have been identified to participate of inefficient search, their role during efficient “pop-out” search remains controversial. Predominant views suggest that the capture of attention by targets that pop-out is mainly a bottom-up process (Treisman and Gelade, 1980; Desimone and Duncan, 1995; Corbetta and Shulman, 2002) with little or no involvement of the aforementioned network. Indeed, theories on saliency maps have provided efficient and purely bottom-up models solving efficient search (Itti and Koch, 2001). However, alternative models suggest the need for top-down processes to guide attention toward the target and perform categorical decision-making, even during efficient search (Joseph et al., 1997; Cole and Schneider, 2007). Therefore, current theories suggest two alternatives scenarios: (1) efficient search might rely exclusively on transient bottom-up processes mediating the capture of attention by salient targets, with no top-down contributions from frontal cortical areas, or (2) efficient and inefficient search would both require the continuous action of the same frontoparietal attentional network, presumably facilitated by bottom-up capture processes during efficient search. To dissociate between those two scenarios, we compared the timing of neural activation with search duration on a trial-by-trial basis during efficient vs inefficient search in key structures of the human frontoparietal network: FEF, SPL, DLPFC and dACC.
In line with previous visual attention studies in primates and humans (Fries et al., 2001; Vidal et al., 2006; Buschman and Miller, 2007; Wyart and Tallon-Baudry, 2008), we found that deployment of visual attention is concomitant with sustained energy increase of local field potentials in the high-frequency band (50–150 Hz): broadband gamma activity was observed in the DLPFC, FEF, SPL and dACC and were sustained throughout the search process at the single-trial level, during both efficient and inefficient search. Altogether, our results support the view that both efficient and inefficient search require active top-down processes from frontal executive regions.
Materials and Methods
Stimuli and experimental design.
Stimuli and paradigm were adapted from Treisman and Gelade (1980). Each stimulus consisted of an array of 36 letters (6 × 6 square array with 35 distractors “Ls” and one target “T” randomly arranged) and participants were instructed to find a target (present in all trials) as fast as possible (Fig. 1A). To dissociate correct from incorrect responses, subjects indicated whether the target was located in the upper or lower half of the display by pressing on a control pad, with their right index (upper button) or middle finger (lower button) respectively. The initial experimental design consisted of 6 conditions with varying distractor layout (contrast and quantity) in the displays. Eleven of 24 subjects performed this experiment, while the remaining 13 subjects performed a simplified design consisting of only two of the six conditions. In this study we focus on two conditions, efficient and inefficient visual search, defined as follows: in the efficient condition a gray target was presented among black distractors while in the inefficient condition, all letters were gray (Fig. 1A). Both conditions were presented randomly for a fixed duration of 3 s and with an interstimulus interval of 1 s. The stimuli were displayed on a 19 inch computer screen located at 60 cm away from the subject. Only data from trials with correct target detection were analyzed. Each experimental block lasted 5 min, interleaved with short interblock pauses.
Figure 1.

Experimental conditions, behavior, and time-frequency responses. A, The experimental design. After a 1000 ms interstimulus interval, a visual array is presented for 3000 ms. When the target is detected, subjects press a button to indicate in which quadrant of the array (upper or lower) it is located. In the inefficient search condition (in red), target and distractors have the same color. In the efficient search condition (in blue), the target has a different contrast than the distractors. B, Reaction time distribution for efficient (blue) and inefficient visual search (red). C, Statistical time-frequency maps (Wilcoxon Z, FDR corrected) for efficient (left) and inefficient (right) visual search from a recording site (patient 10; Talairach coordinates: [−43 −3 34]), located in dorsolateral prefrontal cortex.
Participants.
Intracranial recordings were obtained from 24 neurosurgical patients with intractable epilepsy (16 female, mean age: 34 ± 12 years) at the Epilepsy Department of the Grenoble University Hospital. All subjects were stereotactically implanted with multilead EEG depth electrodes simultaneously sampling lateral, intermediate and medial wall structures. Electrode implantation was performed according to routine procedures and all target structures for the presurgical evaluation were selected strictly according to clinical considerations with no reference to the current study. All recorded electrophysiological data exhibiting pathological activity were discarded from the present study. All participants provided written informed consent and the experimental procedures were approved by the Institutional Review Board and by the National French Science Ethical Committee (CPPRB). All participants had normal or corrected to normal vision.
Electrode implantation.
Eleven to 15 semirigid multilead electrodes were stereotactically implanted in the brain of each patient. These stereotactic-EEG electrodes have a diameter of 0.8 mm and, depending on the target structure, consist of 10–15 contact leads 2 mm wide and 1.5 mm apart (DIXI Medical). Electrode contacts were identified on the patient's individual stereotactic implantation scheme, and were anatomically localized using Talairach and Tournoux's (1993) proportional atlas. Computer-assisted matching between a postimplantation CT-scan and a preimplantation 3-D MRI dataset (VOXIM R, IVS Solutions) allowed for direct visualization of the electrode contacts on the patient's brain anatomy using the ACTIVIS (Aguera et al., 2011).
Intracranial EEG recordings.
Intracranial EEG (iEEG) recordings were conducted using a video-iEEG monitoring system (Micromed), which allowed the simultaneous data recording from 128 depth-EEG electrode sites. The data were bandpass-filtered online from 0.1 to 200 Hz and sampled at 512 Hz in 22 subjects and 1024 Hz in the remaining two. During the acquisition the data were recorded using a reference electrode located in white matter. For subsequent analyses, each electrode trace was referenced with respect to its direct neighbor by bipolar derivation. This final electrode montage eliminates signal artifacts common to adjacent recording sites (such as the 50 Hz power supply artifact or distant physiological artifacts) and achieves a high local specificity by canceling out effects of distant sources that equally spread to both adjacent sites through volume conduction (Lachaux et al., 2003; Jerbi et al., 2009a,b). The spatial resolution achieved by this bipolar iEEG montage is on the order of 3 mm. Eye movements were monitored by recording the EOG in all sessions.
Spectral analysis and statistical measures.
We used two analysis techniques to assess spectral responses from neural recordings. Initially, we computed a standard time-frequency (TF) wavelet decomposition, which allows identifying major TF components of interest across all trials at each recording site. This was performed with the software package for electrophysiological analysis (ELAN-pack) developed at the laboratory INSERM U1028 (Aguera et al., 2011). The frequency range extended from 1 to 200 Hz and the time interval included a 300 ms prestimulus baseline, from −400 to −100 ms, and lasted until stimulus offset (3000 ms). We estimated significant power responses compared with average baseline with the Wilcoxon signed rank test (Fig. 1C). Based on these results we determined a frequency range of interest which was used to compute the Hilbert transform, to evaluate the significance of this neural response with a lower degree of complexity and thus with a higher statistical power. Applying the Hilbert transform to the continuous recordings splits the data into instantaneous amplitude (i.e., envelope) and phase components in a given frequency interval (Le Van Quyen et al., 2001). In addition to being a convenient measure of instantaneous amplitude modulations in a frequency range of interest, performing spectral analysis using the Hilbert transform was also used to confirm the TF results obtained independently by wavelet analysis. These comparisons provided an additional level of confidence in the results of spectral analysis reported throughout this study. Hilbert transform and subsequent envelope calculations were done with Matlab software (MathWorks).
Continuous iEEG signals were first bandpass filtered in multiple successive 10-Hz-wide frequency bands (e.g., 10 bands, beginning with 50–60 Hz up to 140–150 Hz). Next, for each bandpass filtered signal we computed the envelope using standard Hilbert transform. The obtained envelope had a time resolution of 15.625 ms. Again, for each band, this envelope signal (i.e., time-varying amplitude) was divided by its mean across the entire recording session and multiplied by 100. This yields instantaneous envelope values expressed as percent of the mean. Finally, the envelope signals computed for each consecutive frequency bands (e.g., 10 bands of 10 Hz intervals between 50 and 150 Hz) were averaged together, to provide one single time-series (the high gamma-band envelope) across the entire session. By construction, the mean value of that time-series across the recording session is equal to 100.
To estimate the significance of the amplitude responses across time (poststimulus) we compared each poststimulus time-bin (0–3000 ms) to an average prestimulus baseline amplitude value (−400 to −100 ms) with a Wilcoxon signed rank test followed by false discovery rate (FDR) correction (Genovese et al., 2002) across all time samples. We used a nonparametric Kruskal–Wallis test to compare baseline-corrected poststimulus amplitude responses between efficient and inefficient search followed by FDR correction across all time samples.
Mapping intracranial EEG data to standard MNI brain.
The anatomical representation of all significant amplitude modulations for a given frequency band were obtained by pooling data from all subjects and mapping it onto a standard Montreal Neurological Institute (MNI) brain based on the localization of each electrode. The value assigned to each node of the MNI brain represents the average of data from all recording sites located within a distance maximum 15 mm from the node. The individual data averaged in this study represents the change in amplitude (in %) compared with prestimulus baseline period (more detailed methods described by Vidal et al., 2010; Ossandón et al., 2011). This data mapping procedure allows visualizing intracranial EEG data from all subjects on a common MNI brain and is used to identify anatomo-functional regions of interest for further detailed analyses.
Results
Behavioral results
Reaction times (RTs) in participants were shorter and performance was higher during efficient compared with inefficient search (±SEM; RT: efficient, 1003 ± 70 ms; inefficient: 1705 ± 138 ms; t = 17.05, p < 0.001, Fig. 1B; performance: efficient, 95.3% correct; inefficient 84.3% correct; t = 5.66, p < 0.001).
Three distinct temporal profiles in the gamma band
iEEG data were collected from a total of 2413 intracranial recording sites across 24 patients. TF statistical analysis revealed a significant poststimulus spectral power increase in a broad frequency range covering the low and high gamma-bands (50–150 Hz) in 352 sites (14.6% of all sites). This frequency range of interest (50–150 Hz) was used to compute the Hilbert transform (see Materials and Methods for details; Wilcoxon test vs baseline after Hilbert transformation, p < 0.05, corrected for multiple comparisons). A preliminary analysis separating between low (40–70 Hz) and high (80–150 Hz) gamma amplitude revealed only little and inconsistent difference between frequency bands (spatial distribution, effect of task, latency and duration).
Among the significant sites, the poststimulus broadband gamma activity (BGA) amplitude was significant either for (1) the efficient search (16 sites), (2) the inefficient search (25 sites), or for both conditions (309 sites; Fig. 1B). Visual inspection of those broadband gamma responses revealed a dissociation between short transient responses time-locked to stimulus onset (type I), sustained energy increases lasting the entire search process (type II) and late energy increases time-locked to the motor response (type III) (Fig. 2B). Our main question was whether type II responses could be observed during efficient search and if so, in which brain structures. To address this question, we defined this response type more precisely as follows: any significant poststimulus energy increase between 50 Hz and 150 Hz, sustained throughout the trial and which duration was correlated with reaction time on a single-trial basis; p < 0.05, Spearman correlation, corrected). The duration of the increase was defined as the number of samples during the 3 s following stimulus onset (the time of the stimuli presentation) with an energy value higher than baseline (p < 0.05, Wilcoxon test, corrected). Trials in which responses occurred after 3 s were not analyzed (<1% of trials). Such type II responses, called task-related BGA thereafter, were found in 112 sites overall, mostly located in the frontal lobes (Fig. 2B). Of the remaining 240 responsive sites, 72 had responses time-locked to the motor response (i.e., a significant correlation between the latency of the response maximum and the reaction time on a single-trial basis, Spearman correlation, corrected p < 0.01; Fig. 2B) located principally along the precentral and postcentral gyrus.
Figure 2.
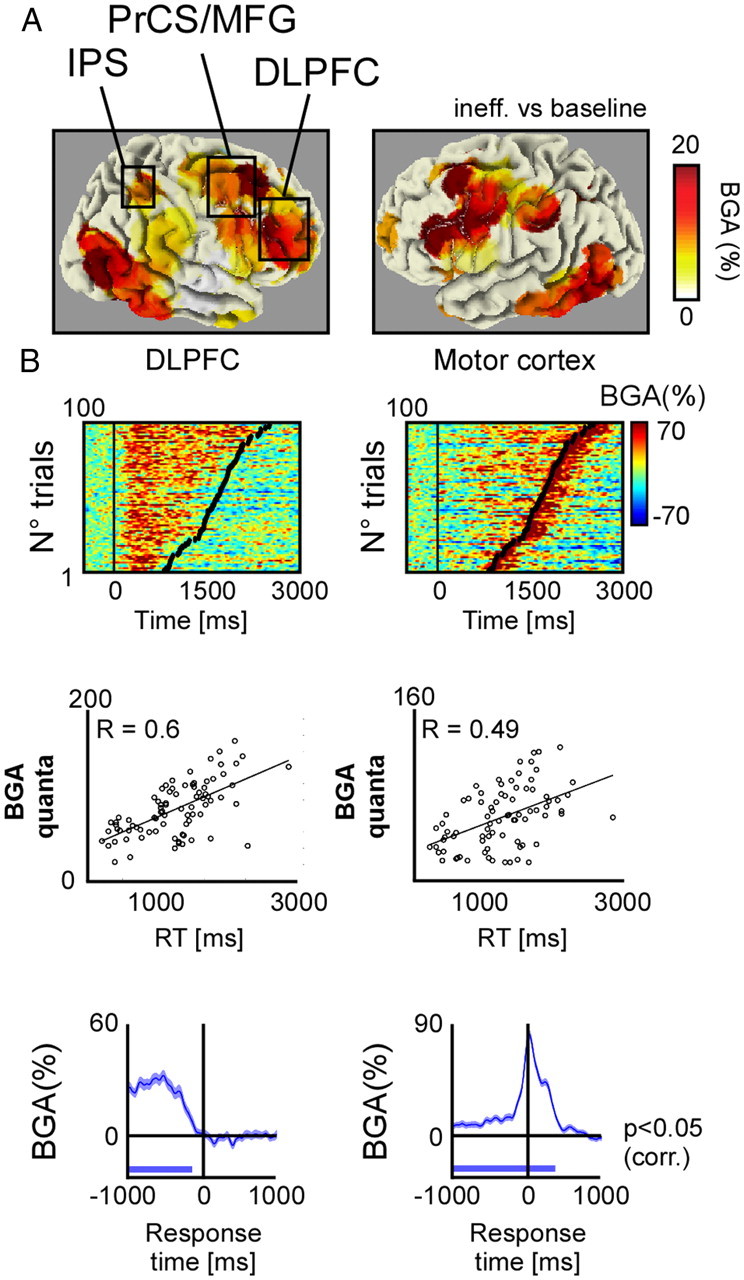
Broadband gamma activity response patterns during visual search. A, Grand average broadband gamma response topography across all recording sites and all patients, plotted on a “glass brain” in MNI coordinates. B, Top, Single-trial BGA responses recorded from DLPFC (left, Talairach coordinates [−37 17 27]) and primary motor cortex (right, Talairach coordinates [−57 −28 48]) from patient 23 in the inefficient search condition. Middle, Scatter plot of single-trial BGA quanta versus reaction times. A BGA quantum is a significant time-sample of BGA response versus baseline power evaluated between stimulus onset and offset (Wilcoxon test, FDR corrected). Left and right panels correspond to upper BGA responses. C, Average BGA responses aligned to the response (button-press). Left and right panels correspond to top panel BGA responses.
Finally, 123 sites had transient responses time-locked to stimulus onset, in which the duration of BGA was completely independent of reaction times across the trials (90 of which were located in the temporal lobes). An additional 45 sites (13% overall) were responsive but could not be categorized as type I, II, or III.
Task effects
Within the dorsal attention network, iEEG gamma-band responses were mostly found in four anatomical ROIs (Fig. 2A): DLPFC (bilateral, center coordinates: [43, 39, 22] and [−39, 28, 25], Talairach space), dACC (center coordinate: [−4, 16, 44]), SPL (bilateral, center coordinates: [32, −50, 46] and [−36, −56, 45])—and right and left intersection line between precentral sulcus and middle frontal gyrus (PrCS/MFG, center coordinates [44, −1, 39] and [−42, −2, 43]), including the proposed location of the human FEF (Blanke et al., 2000; Lobel et al., 2001).
A total of 63 of the 112 task-related BGA (type II) were located in one of these four ROIs (Fig. 3A): 19 in the DLPFC (7 patients), 20 in the PrCS/MFG (7 patients), 12 in the SPL (6 patients), and 12 in the dACC (4 patients). The majority of the 49 remaining sites were in the occipital (9) and temporal lobes (24), or in the premotor cortex (8), that is outside the primary regions of interest of our study: top-down control frontal sites. All other excluded sites were widely distributed in frontal regions where we could not record from at least three different patients.
Figure 3.
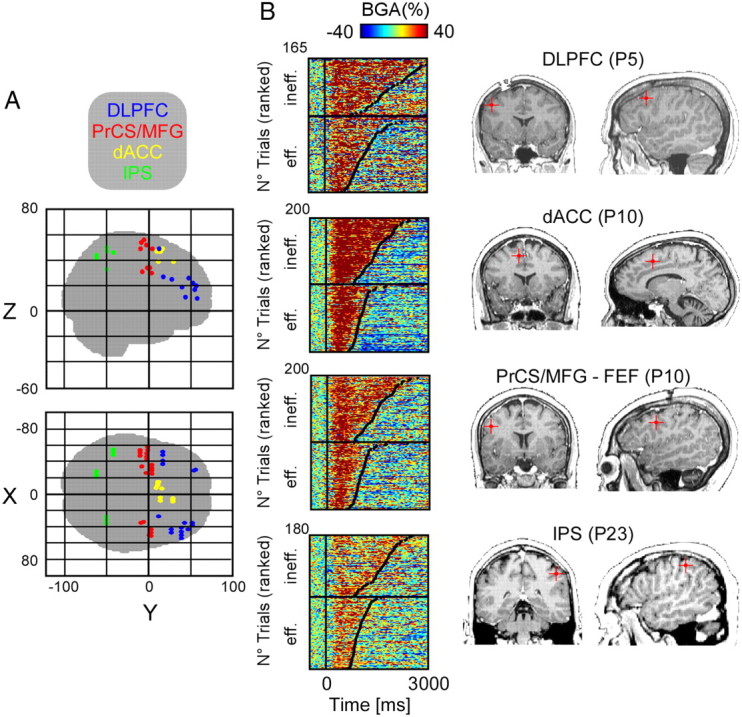
Single-trial gamma-band responses to efficient and inefficient visual search from frontal-parietal recording sites. A, All recording sites with a transient gamma-band response (see Materials and Methods) located in glass brain (Talairach). B, Four illustrative examples (MRI, right) of single-trial gamma-band responses to efficient (eff) and inefficient (ineff) visual search (left) recorded within 4 regions of interest of the frontal-parietal network: DLPFC (patient 5, Talairach coordinates [−58 −1 34]), dACC (patient 10, Talairach coordinates [−12 11 47]), PrCS/MFG putative FEF (patient 10, Talairach coordinates [−46 −2 34]), and IPS (patient 23, Talairach coordinates [−52 −42 46]).
In the four ROIs, the majority of BGA responses (85%) had no significant amplitude difference between the efficient and inefficient search conditions (Fig. 3B, time windows: 100–600 ms after stimulus presentation; p > 0.05, Kruskal–Wallis test, FDR corrected) (DLPFC: 17 of 19; PrCS/MFG: 14 of 20; SPL: 11 of 12; dACC: 11 of 12).
The overall energy of the BGA was higher in the inefficient than in the efficient search condition, but mostly because of longer reaction times, yielding longer responses in the former condition (3 s; Figs. 1C, 3A). When considering only trials with equivalent reaction time distributions (i.e., shortest inefficient search vs longest efficient search trials), we found that most (53 of 63) recording sites produced BGA responses with equivalent energy (Kruskal–Wallis test, FDR corrected, p > 0.05. At least 27 trials by condition were compared). In half of the 10 remaining sites, the energy of the average response over trials with matched duration was higher in the efficient search condition. Overall, all four ROIs were characterized by increases in broadband gamma activity that were sustained throughout the duration of each trial, from stimulus onset to target detection. Most importantly this was observed both for the pop-out (efficient search) and the more complex (inefficient search) tasks with no significant difference in mean energy between the two conditions.
Finally, 112 of 123 electrodes with a short transient response time-locked to stimulus onset (type I) were located in the temporal and occipital lobes (the remaining 11 in the parietal lobes) (Fig. 4A). The majority of these contacts (90 of 112; 80.3%) had no significant amplitude difference between the efficient and inefficient search conditions (Fig. 4A; time windows: 100–500 ms after stimulus presentation; p > 0.05, Kruskal–Wallis test, FDR corrected). Eighteen of the remaining 22 sites, in the temporal or occipital lobes, had stronger response in the efficient search condition (10 of which in the left fusiform gyrus). In all sites but one (17 of 18), the response duration, while transient, was nevertheless correlated with reaction time on a single-trial basis (p < 0.05, Spearman correlation, corrected). In addition, four sites (4 of 22) had stronger response in the inefficient search condition.
Figure 4.

Single-trial gamma-band responses (Transient,Type 1) during efficient and inefficient visual search. A, Recording sites located in glass brain (Talairach). In blue: contacts with a stronger response during efficient vs inefficient search (Kruskal-Wallis, FDR corrected). B, Two illustrative examples of single-trial gamma-band responses during efficient (eff) and inefficient (ineff) search in the right and left fusiform gyrus: (patient 6, Talairach coordinates [36 −52 −12] and patient 20 [−30 −41 −16]). Bottom, Profile of gamma-band responses aligned to stimuli onset. Left and right panels correspond to top panel responses.
Discussion
To the best of our knowledge, this study is the first to reveal a significant trial-by-trial correlation between neuronal activity and behavioral parameters during a visual search task in humans. Significant correlations between reaction times and the duration of sustained gamma-band responses provide clear evidence that the dorsal attention network supported by the dorsal ACC and the DLPFC in the frontal lobe, and by the SPL is equally active during efficient and inefficient visual search. Differences in search duration across the two conditions accounted for longer neural responses during inefficient search, but onset latencies and response amplitudes were similar in both types of search in the majority of frontal and parietal recording sites.
Sustained frontal activation during efficient visual search
Our results support the view that efficient and inefficient visual search rely on the same network, despite previous models showing that salient targets can be detected by purely bottom-up processes in the visual cortex (Treisman and Gelade, 1980; Itti and Koch, 2001). In fact, the temporal dynamics of sustained BGA increases accompanying efficient search is more compatible with top-down influences than with bottom-up processes, which are usually characterized by early and transient neural responses following stimulus onset.
Such transient responses were observed predominantly in the occipital and temporal lobes, and were stronger, in most cases, in the efficient search condition. We propose that they mediate a capture process by salient targets; however, our results show that this putative capture mechanism should not be thought of as purely bottom-up: it is mediated by a transient neural response which latency is relatively late, between 250 and 400 ms, unlike typical fast bottom-up processes, and variable across trials, with a strong predictive effect on reaction time as illustrated by Figure 4B.
The sustained activations we report during both efficient and inefficient search conditions need to be considered and incorporated into the previous literature that supports the view that prefrontal areas, and especially the DLPFC, are not necessary for efficient search. For instance, in an fMRI study, Leonards et al. (2000) found that although the networks underlying efficient and inefficient search overlapped almost completely, the DLPFC was active only during inefficient search. This was later confirmed by Anderson et al. (2007), who reported no fMRI activation in the DLPFC when participants searched for singletons—a typical efficient search condition. One possible explanation might be that search durations are too short in the efficient condition to elicit a BOLD response in the DLPFC that is sufficiently long to be detected with fMRI. This would amount to a simple technical limitation of fMRI, which is its low temporal resolution compared with electrophysiological recordings such intracranial EEG. However, the failure to detect prefrontal activations during efficient search is not unique to fMRI studies. Kalla et al. (2009) reached similar conclusions with Transcranial Magnetic Stimulation: TMS pulses delivered to the DLPFC did not impair the participants' ability to detect the presence of singletons in a crowded display (but see Iba and Sawaguchi, 2003) for evidence that reversible muscimol inactivation of monkey DLPFC affects efficient search performance). This led them to conclude that this region is not necessary for efficient search (Kalla et al., 2009). As recently summarized, and in fact questioned by Wardak et al. (2010) in a monkey study, the classical view remains that efficient search involves solely, or mainly, low-level preattentive processes.
Yet, there are reasons to believe that the DLPFC should be active during any kind of visual search, be it efficient or inefficient. Several functions have been attributed to the DLPFC: not only the guidance, control and monitoring of spatial attention but also decision-making and response selection processes (Heekeren et al., 2004, 2008), and working-memory, including the maintenance of a memory trace of the task-set and the attention-set which define the task-at-hand (Corbetta and Shulman, 2002; Sakai, 2008). In direct contradiction with the previously mentioned fMRI and TMS studies, our results support the view that at least a subset of those processes also occurs during efficient search, in parallel with low-level detection processes. This finding might be explained by the fact that our “efficient search” condition required that participants actually find the target and identify its spatial location, which clearly involves decision-making and a working memory component, to maintain the attention-set which defines the target.
In the three studies previously mentioned (Leonards et al., 2000; Anderson et al., 2007; Kalla et al., 2009), participants simply had to report whether a singleton was present or absent in the visual display. This might constitute an exceptionally easy task for the visual system, which can be performed without any memory requirement. The perceptual decision might amount to a simple low-level categorical scene interpretation (Hochstein and Ahissar, 2002) discriminating between two general configurations of displays: spatially homogeneous vs inhomogeneous. Therefore, their task would not necessarily require an actual search process per se, that is, the localization of a pre-identified item embedded within a crowded visual environment, but simply the detection that “the display looks odd and inhomogeneous”. When the search is, indeed, a search, we argue that the prefrontal cortex is actively involved even when the target is a salient target. This view is reminiscent of earlier claims by Joseph et al. (1997) that even simple search tasks, including searching for simple features, require central attentional resources and are disrupted when attention is diverted away by a secondary task. Indeed, this interpretation has received support from a scalp-ERP study showing that the lateralized N2pc, indicative of shifts of attentive visual selection (Luck and Hillyard, 1994), is also present during efficient search (Leonards et al., 2003).
We propose that, during efficient search, bottom-up influences act in parallel with top-down search processes to orient attention to the salient target and terminate the search early. During the search process, sustained neural activity in the DLPFC, the FEF and the SPL might reflect top-down influences from frontal areas to continuously update saliency/priority maps in the parietal lobe (Bisley and Goldberg, 2010). We further propose that top-down influences guide attention deployment as soon as participants search for a prespecified target, be it salient or not. In addition, the dorsal ACC would drive and sustain the attentional effort until task-completion, again independently of search condition (Dosenbach et al., 2006).
Gamma-band activity in the DLPFC, dACC and to a lesser extent the FEF would therefore be characteristic of “active vision”: the search for task-relevant information in a visual scene (Henderson, 2003). Therefore, we suggest that any search condition necessarily activates the frontal executive system, as soon as search instructions define that some items are “task-relevant,” which must then be maintained in an attention-set and searched for. In other words, “searching” inevitably contains an active component that would be indissociable from active top-down frontal control, in direct agreement with recent models of visual search (Wolfe, 2003). Purely bottom-up attentional capture—free of frontal influences—would only occur in passive viewing conditions, with no prespecified target or when participants make an explicit effort to adopt a passive cognitive strategy and let the target pop-out. In fact, a recent eye-tracking study (Watson et al., 2010) showed that during an easy visual search, participants had the natural tendency to react to the display onset with an immediate and active visual exploration. However, it was possible to instruct participants to hold their exploratory behavior and let the target pop-out, before making their first saccade. This more passive strategy proved to be a more efficient extraction of visual information. The study by Watson et al. (2010) is not in contradiction with the results we report here. It rather indicates that “active search”—involving the dorsal attention network—might be just one option during efficient search, the most natural but not necessarily the most efficient one, and another example that participants do not spontaneously use the most efficient attentional strategy to perform easy tasks, as suggested by several recent studies (Slagter et al., 2007, 2009).
Sustained gamma-band responses during attentive search
That BGA increases during “active vision” is an observation reminiscent of earlier proposals that neural synchronization in the gamma-band might mediate attentional selection (Murthy and Fetz, 1996; Fries, 2005, 2009). However, the frequency bandwidth of the iEEG gamma-band responses reported here extends well beyond the narrow frequency band found in monkey studies (Fries et al., 2001; Buschman and Miller, 2007) and might therefore correspond to a different mechanism. An alternative, and possibly nonexclusive, interpretation, is that broadband gamma responses reflect a global enhancement of the firing rate of the underlying neural population, observed as a “spike bleed-through” in the field power spectra (Manning et al., 2009; Ray and Maunsell, 2011). Indeed, recent studies combining multiunit recordings with iEEG in humans (Manning et al., 2009) or LFP in macaque monkeys (Ray and Maunsell, 2011) have clearly demonstrated strong positive correlations between BGA and co-occurring spike rates at the population level. Based on those studies, we support the view that BGA can, at least, be understood as a proxy of the global discharge rate—and therefore activity level—of the neural populations recorded with iEEG, which is consistent with the tight relationship between BGA and the BOLD signals measured with fMRI (Logothetis et al., 2001; Mukamel et al., 2005; Niessing et al., 2005; Lachaux et al., 2007; Nir et al., 2007; Conner et al., 2011). Interestingly, this putative relationship between BOLD and high-frequency power modulations in the electrophysiological signals is also supported by reports that default-mode network areas, which are known to display negative BOLD responses during attention-demanding behavior, also show a reduction of broadband gamma power (Jerbi et al., 2010; Ossandón et al., 2011).
Together, our findings support the view that active visual search systematically involves the frontal-parietal attention network and therefore, executive attention resources, regardless of target saliency. While intracranially recorded trial-by-trial broadband gamma power appears to be a reliable marker of the neural processes that mediate efficient search, more studies will be needed to examine to what extent such signals can be reliably obtained from noninvasive techniques and also to resolve possible discrepancies between electrophysiological and fMRI studies of efficient versus inefficient search.
Footnotes
Funding was provided by the Fondation pour la Recherche Médicale, by the BrainSync FP7 European Project (Grant HEALTH-F2-2008-200728); by the Millenium Center for the Neuroscience of Memory, NC10-001-F, the Fondecyt No. 3120134, and the ECOS-Sud CONICYT C08S02, Chile; and by the Agence Nationale de la Recherche (CONTINT “OpenVibe2”; ANR blanc “MLA”). We thank all patients for their participation; the staff of the Grenoble Neurological Hospital Epilepsy Unit; and Dominique Hoffmann, Patricia Boschetti, Carole Chatelard, Véronique Dorlin, and Martine Juillard for their support.
The authors declare no competing financial interests.
References
- Aguera PE, Jerbi K, Caclin A, Bertrand O. ELAN: a software package for analysis and visualization of MEG, EEG, and LFP signals. Comput Intell Neurosci. 2011;2011:158970. doi: 10.1155/2011/158970. [DOI] [PMC free article] [PubMed] [Google Scholar]
- Anderson EJ, Mannan SK, Husain M, Rees G, Sumner P, Mort DJ, McRobbie D, Kennard C. Involvement of prefrontal cortex in visual search. Exp Brain Res. 2007;180:289–302. doi: 10.1007/s00221-007-0860-0. [DOI] [PubMed] [Google Scholar]
- Barceló F, Suwazono S, Knight RT. Prefrontal modulation of visual processing in humans. Nat Neurosci. 2000;3:399–403. doi: 10.1038/73975. [DOI] [PubMed] [Google Scholar]
- Bichot NP, Rossi AF, Desimone R. Parallel and serial neural mechanisms for visual search in macaque area V4. Science. 2005;308:529–534. doi: 10.1126/science.1109676. [DOI] [PubMed] [Google Scholar]
- Bisley JW, Goldberg ME. Neuronal activity in the lateral intraparietal area and spatial attention. Science. 2003;299:81–86. doi: 10.1126/science.1077395. [DOI] [PubMed] [Google Scholar]
- Bisley JW, Goldberg ME. Attention, intention, and priority in the parietal lobe. Annu Rev Neurosci. 2010;33:1–21. doi: 10.1146/annurev-neuro-060909-152823. [DOI] [PMC free article] [PubMed] [Google Scholar]
- Blanke O, Spinelli L, Thut G, Michel CM, Perrig S, Landis T, Seeck M. Location of the human frontal eye field as defined by electrical cortical stimulation: anatomical, functional and electrophysiological characteristics. Neuroreport. 2000;11:1907–1913. doi: 10.1097/00001756-200006260-00021. [DOI] [PubMed] [Google Scholar]
- Bressler SL, Tang W, Sylvester CM, Shulman GL, Corbetta M. Top-down control of human visual cortex by frontal and parietal cortex in anticipatory visual spatial attention. J Neurosci. 2008;28:10056–10061. doi: 10.1523/JNEUROSCI.1776-08.2008. [DOI] [PMC free article] [PubMed] [Google Scholar]
- Buschman TJ, Miller EK. Top-down versus bottom-up control of attention in the prefrontal and posterior parietal cortices. Science. 2007;315:1860–1862. doi: 10.1126/science.1138071. [DOI] [PubMed] [Google Scholar]
- Cole MW, Schneider W. The cognitive control network: integrated cortical regions with dissociable functions. Neuroimage. 2007;37:343–360. doi: 10.1016/j.neuroimage.2007.03.071. [DOI] [PubMed] [Google Scholar]
- Conner CR, Ellmore TM, Pieters TA, DiSano MA, Tandon N. Variability of the relationship between electrophysiology and BOLD-fMRI across cortical regions in humans. J Neurosci. 2011;31:12855–12865. doi: 10.1523/JNEUROSCI.1457-11.2011. [DOI] [PMC free article] [PubMed] [Google Scholar]
- Corbetta M, Shulman GL. Control of goal-directed and stimulus-driven attention in the brain. Nat Rev Neurosci. 2002;3:201–215. doi: 10.1038/nrn755. [DOI] [PubMed] [Google Scholar]
- Desimone R, Duncan J. Neural mechanisms of selective visual attention. Annu Rev Neurosci. 1995;18:193–222. doi: 10.1146/annurev.ne.18.030195.001205. [DOI] [PubMed] [Google Scholar]
- Dosenbach NU, Visscher KM, Palmer ED, Miezin FM, Wenger KK, Kang HC, Burgund ED, Grimes AL, Schlaggar BL, Petersen SE. A core system for the implementation of task sets. Neuron. 2006;50:799–812. doi: 10.1016/j.neuron.2006.04.031. [DOI] [PMC free article] [PubMed] [Google Scholar]
- Duncan J, Humphreys GW. Visual search and stimulus similarity. Psychol Rev. 1989;96:433–458. doi: 10.1037/0033-295x.96.3.433. [DOI] [PubMed] [Google Scholar]
- Fries P. A mechanism for cognitive dynamics: neuronal communication through neuronal coherence. Trends Cogn Sci. 2005;9:474–480. doi: 10.1016/j.tics.2005.08.011. [DOI] [PubMed] [Google Scholar]
- Fries P. Neuronal gamma-band synchronization as a fundamental process in cortical computation. Annu Rev Neurosci. 2009;32:209–224. doi: 10.1146/annurev.neuro.051508.135603. [DOI] [PubMed] [Google Scholar]
- Fries P, Reynolds JH, Rorie AE, Desimone R. Modulation of oscillatory neuronal synchronization by selective visual attention. Science. 2001;291:1560–1563. doi: 10.1126/science.1055465. [DOI] [PubMed] [Google Scholar]
- Genovese CR, Lazar NA, Nichols T. Thresholding of statistical maps in functional neuroimaging using the false discovery rate. Neuroimage. 2002;15:870–878. doi: 10.1006/nimg.2001.1037. [DOI] [PubMed] [Google Scholar]
- Heekeren HR, Marrett S, Bandettini PA, Ungerleider LG. A general mechanism for perceptual decision-making in the human brain. Nature. 2004;431:859–862. doi: 10.1038/nature02966. [DOI] [PubMed] [Google Scholar]
- Heekeren HR, Marrett S, Ungerleider LG. The neural systems that mediate human perceptual decision making. Nat Rev Neurosci. 2008;9:467–479. doi: 10.1038/nrn2374. [DOI] [PubMed] [Google Scholar]
- Henderson JM. Human gaze control during real-world scene perception. Trends Cogn Sci. 2003;7:498–504. doi: 10.1016/j.tics.2003.09.006. [DOI] [PubMed] [Google Scholar]
- Hochstein S, Ahissar M. View from the top: hierarchies and reverse hierarchies in the visual system. Neuron. 2002;36:791–804. doi: 10.1016/s0896-6273(02)01091-7. [DOI] [PubMed] [Google Scholar]
- Iba M, Sawaguchi T. Involvement of the dorsolateral prefrontal cortex of monkeys in visuospatial target selection. J Neurophysiol. 2003;89:587–599. doi: 10.1152/jn.00148.2002. [DOI] [PubMed] [Google Scholar]
- Itti L, Koch C. Computational modelling of visual attention. Nat Rev Neurosci. 2001;2:194–203. doi: 10.1038/35058500. [DOI] [PubMed] [Google Scholar]
- Jerbi K, Ossandón T, Hamamé CM, Senova S, Dalal SS, Jung J, Minotti L, Bertrand O, Berthoz A, Kahane P, Lachaux JP. Task-related gamma-band dynamics from an intracerebral perspective: review and implications for surface EEG and MEG. Hum Brain Mapp. 2009a;30:1758–1771. doi: 10.1002/hbm.20750. [DOI] [PMC free article] [PubMed] [Google Scholar]
- Jerbi K, Freyermuth S, Dalal S, Kahane P, Bertrand O, Berthoz A, Lachaux JP. Saccade related gamma-band activity in intracerebral EEG: dissociating neural from ocular muscle activity. Brain Topogr. 2009b;22:18–23. doi: 10.1007/s10548-009-0078-5. [DOI] [PubMed] [Google Scholar]
- Jerbi K, Vidal JR, Ossandon T, Dalal SS, Jung J, Hoffmann D, Minotti L, Bertrand O, Kahane P, Lachaux JP. Exploring the electrophysiological correlates of the default-mode network with intracerebral EEG. Front Syst Neurosci. 2010;4:27. doi: 10.3389/fnsys.2010.00027. [DOI] [PMC free article] [PubMed] [Google Scholar]
- Joseph JS, Chun MM, Nakayama K. Attentional requirements in a ‘preattentive’ feature search task. Nature. 1997;387:805–807. doi: 10.1038/42940. [DOI] [PubMed] [Google Scholar]
- Kalla R, Muggleton NG, Juan CH, Cowey A, Walsh V. The timing of the involvement of the frontal eye fields and posterior parietal cortex in visual search. Neuroreport. 2008;19:1067–1071. doi: 10.1097/WNR.0b013e328304d9c4. [DOI] [PubMed] [Google Scholar]
- Kalla R, Muggleton NG, Cowey A, Walsh V. Human dorsolateral prefrontal cortex is involved in visual search for conjunctions but not features: a theta TMS study. Cortex. 2009;45:1085–1090. doi: 10.1016/j.cortex.2009.01.005. [DOI] [PubMed] [Google Scholar]
- Lachaux JP, Rudrauf D, Kahane P. Intracranial EEG and human brain mapping. J Physiol Paris. 2003;97:613–628. doi: 10.1016/j.jphysparis.2004.01.018. [DOI] [PubMed] [Google Scholar]
- Lachaux JP, Fonlupt P, Kahane P, Minotti L, Hoffmann D, Bertrand O, Baciu M. Relationship between task-related gamma oscillations and BOLD signal: new digits from combined fMRI and intracranial EEG. Hum Brain Mapp. 2007;28:1368–1375. doi: 10.1002/hbm.20352. [DOI] [PMC free article] [PubMed] [Google Scholar]
- Le Van Quyen M, Foucher J, Lachaux J, Rodriguez E, Lutz A, Martinerie J, Varela FJ. Comparison of Hilbert transform and wavelet methods for the analysis of neuronal synchrony. J Neurosci Methods. 2001;111:83–98. doi: 10.1016/s0165-0270(01)00372-7. [DOI] [PubMed] [Google Scholar]
- Leonards U, Sunaert S, Van Hecke P, Orban GA. Attention mechanisms in visual search—an fMRI study. J Cogn Neurosci. 2000;12(Suppl 2):61–75. doi: 10.1162/089892900564073. [DOI] [PubMed] [Google Scholar]
- Leonards U, Palix J, Michel C, Ibanez V. Comparison of early cortical networks in efficient and inefficient visual search: an event-related potential study. J Cogn Neurosci. 2003;15:1039–1051. doi: 10.1162/089892903770007425. [DOI] [PubMed] [Google Scholar]
- Lobel E, Kahane P, Leonards U, Grosbras M, Lehéricy S, Le Bihan D, Berthoz A. Localization of human frontal eye fields: anatomical and functional findings of functional magnetic resonance imaging and intracerebral electrical stimulation. J Neurosurg. 2001;95:804–815. doi: 10.3171/jns.2001.95.5.0804. [DOI] [PubMed] [Google Scholar]
- Logothetis NK, Pauls J, Augath M, Trinath T, Oeltermann A. Neurophysiological investigation of the basis of the fMRI signal. Nature. 2001;412:150–157. doi: 10.1038/35084005. [DOI] [PubMed] [Google Scholar]
- Manning JR, Jacobs J, Fried I, Kahana MJ. Broadband shifts in local field potential power spectra are correlated with single-neuron spiking in humans. J Neurosci. 2009;29:13613–13620. doi: 10.1523/JNEUROSCI.2041-09.2009. [DOI] [PMC free article] [PubMed] [Google Scholar]
- Moore T, Armstrong KM. Selective gating of visual signals by microstimulation of frontal cortex. Nature. 2003;421:370–373. doi: 10.1038/nature01341. [DOI] [PubMed] [Google Scholar]
- Mukamel R, Gelbard H, Arieli A, Hasson U, Fried I, Malach R. Coupling between neuronal firing, field potentials, and FMRI in human auditory cortex. Science. 2005;309:951–954. doi: 10.1126/science.1110913. [DOI] [PubMed] [Google Scholar]
- Murthy VN, Fetz EE. Synchronization of neurons during local field potential oscillations in sensorimotor cortex of awake monkeys. J Neurophysiol. 1996;76:3968–3982. doi: 10.1152/jn.1996.76.6.3968. [DOI] [PubMed] [Google Scholar]
- Niessing J, Ebisch B, Schmidt KE, Niessing M, Singer W, Galuske RA. Hemodynamic signals correlate tightly with synchronized gamma oscillations. Science. 2005;309:948–951. doi: 10.1126/science.1110948. [DOI] [PubMed] [Google Scholar]
- Nir Y, Fisch L, Mukamel R, Gelbard-Sagiv H, Arieli A, Fried I, Malach R. Coupling between neuronal firing rate, gamma LFP, and BOLD fMRI is related to interneuronal correlations. Curr Biol. 2007;17:1275–1285. doi: 10.1016/j.cub.2007.06.066. [DOI] [PubMed] [Google Scholar]
- Ossandón T, Jerbi K, Vidal JR, Bayle DJ, Henaff MA, Jung J, Minotti L, Bertrand O, Kahane P, Lachaux JP. Transient suppression of broadband gamma power in the default-mode network is correlated with task complexity and subject performance. J Neurosci. 2011;31:14521–14530. doi: 10.1523/JNEUROSCI.2483-11.2011. [DOI] [PMC free article] [PubMed] [Google Scholar]
- Procyk E, Goldman-Rakic PS. Modulation of dorsolateral prefrontal delay activity during self-organized behavior. J Neurosci. 2006;26:11313–11323. doi: 10.1523/JNEUROSCI.2157-06.2006. [DOI] [PMC free article] [PubMed] [Google Scholar]
- Ray S, Maunsell JH. Different origins of gamma rhythm and high-gamma activity in macaque visual cortex. PLoS Biol. 2011;9:e1000610. doi: 10.1371/journal.pbio.1000610. [DOI] [PMC free article] [PubMed] [Google Scholar]
- Rowe JB, Toni I, Josephs O, Frackowiak RS, Passingham RE. The prefrontal cortex: response selection or maintenance within working memory? Science. 2000;288:1656–1660. doi: 10.1126/science.288.5471.1656. [DOI] [PubMed] [Google Scholar]
- Sakai K. Task set and prefrontal cortex. Annu Rev Neurosci. 2008;31:219–245. doi: 10.1146/annurev.neuro.31.060407.125642. [DOI] [PubMed] [Google Scholar]
- Shulman GL, Tansy AP, Kincade M, Petersen SE, McAvoy MP, Corbetta M. Reactivation of networks involved in preparatory states. Cereb Cortex. 2002;12:590–600. doi: 10.1093/cercor/12.6.590. [DOI] [PubMed] [Google Scholar]
- Slagter HA, Lutz A, Greischar LL, Francis AD, Nieuwenhuis S, Davis JM, Davidson RJ. Mental training affects distribution of limited brain resources. PLoS Biol. 2007;5:e138. doi: 10.1371/journal.pbio.0050138. [DOI] [PMC free article] [PubMed] [Google Scholar]
- Slagter HA, Lutz A, Greischar LL, Nieuwenhuis S, Davidson RJ. Theta phase synchrony and conscious target perception: impact of intensive mental training. J Cogn Neurosci. 2009;21:1536–1549. doi: 10.1162/jocn.2009.21125. [DOI] [PMC free article] [PubMed] [Google Scholar]
- Talairach J, Tounoux P. Referentially oriented cerebral MRI anatomy: an atlas of stereotaxic anatomical correlations for gray and white matter. New York: Thieme; 1993. [Google Scholar]
- Treisman AM, Gelade G. Feature-integration theory of attention. Cogn Psychol. 1980;12:97–136. doi: 10.1016/0010-0285(80)90005-5. [DOI] [PubMed] [Google Scholar]
- Vidal JR, Chaumon M, O'Regan JK, Tallon-Baudry C. Visual grouping and the focusing of attention induce gamma-band oscillations at different frequencies in human magnetoencephalogram signals. J Cogn Neurosci. 2006;18:1850–1862. doi: 10.1162/jocn.2006.18.11.1850. [DOI] [PubMed] [Google Scholar]
- Vidal JR, Ossandón T, Jerbi K, Dalal SS, Minotti L, Ryvlin P, Kahane P, Lachaux JP. Category-specific visual responses: an intracranial study comparing gamma, beta, alpha, and ERP response selectivity. Front Hum Neurosci. 2010;4:195. doi: 10.3389/fnhum.2010.00195. [DOI] [PMC free article] [PubMed] [Google Scholar]
- Wardak C, Vanduffel W, Orban GA. Searching for a salient target involves frontal regions. Cereb Cortex. 2010;20:2464–2477. doi: 10.1093/cercor/bhp315. [DOI] [PubMed] [Google Scholar]
- Watson MR, Brennan AA, Kingstone A, Enns JT. Looking versus seeing: strategies alter eye movements during visual search. Psychon Bull Rev. 2010;17:543–549. doi: 10.3758/PBR.17.4.543. [DOI] [PubMed] [Google Scholar]
- Wolfe JM. Moving towards solutions to some enduring controversies in visual search. Trends Cogn Sci. 2003;7:70–76. doi: 10.1016/s1364-6613(02)00024-4. [DOI] [PubMed] [Google Scholar]
- Wolfe JM, Võ ML, Evans KK, Greene MR. Visual search in scenes involves selective and nonselective pathways. Trends Cogn Sci. 2011;15:77–84. doi: 10.1016/j.tics.2010.12.001. [DOI] [PMC free article] [PubMed] [Google Scholar]
- Wyart V, Tallon-Baudry C. Neural dissociation between visual awareness and spatial attention. J Neurosci. 2008;28:2667–2679. doi: 10.1523/JNEUROSCI.4748-07.2008. [DOI] [PMC free article] [PubMed] [Google Scholar]
- Zhou H, Desimone R. Feature-based attention in the frontal eye field and area V4 during visual search. Neuron. 2011;70:1205–1217. doi: 10.1016/j.neuron.2011.04.032. [DOI] [PMC free article] [PubMed] [Google Scholar]