

Abstract
Humans are able to use knowledge of previous events to estimate the probability of future actions. Consequently, an unexpected event will elicit a prediction error as the prepared action has to be replaced by an unprepared option in a process known as “action reprogramming” (AR). Here we show that people with Parkinson's disease (PD) have a dopamine-sensitive deficit in AR that is proportional to the size of the prediction error. Participants performed a probabilistic reaction time (RT) task in the context of either a predictable or unpredictable environment. For an overall predictable sequence, PD patients, on and off dopamine medication, and healthy controls showed similar improvements in RT. However, in the context of a generally predictable sequence, PD patients off medication were impaired in reacting to unexpected events that elicit large prediction errors and require AR. Critically, this deficit in AR was modulated by the prediction error associated with the upcoming event. The prolongation of RT was not observed during an overall unpredictable sequence, in which relatively unexpected events evoke little prediction error and the requirement for AR should be minimal, given the context. The data are compatible with recent theoretical accounts suggesting that levels of dopamine encode the reliability, i.e., precision, of sensory information. In this scheme, PD patients off medication have low dopamine levels and may therefore be less confident about incoming sensory information and more reliant on top-down predictions. Consequently, when these internal predictions are incorrect, PD patients take longer to respond appropriately to unexpected sensory information.
Introduction
Anticipatory knowledge of an impending action improves the speed and accuracy of its performance (Requin and Granjon, 1969). Work using probabilistic reaction time (RT) cues has shown that the motor system uses past experience to prepare motor output by an amount that is proportional to the probability of a future event (Bestmann et al., 2008). Such preparation is advantageous when a predictable event occurs. However, when an unexpected event happens, RTs suffer because the prepared response has to be replaced by an unprepared option. We can say that the sensorimotor system has made a “prediction error,” and the greater the error, the greater the effect on RT (Bestmann et al., 2008). Here we refer to the process of switching from an expected to less expected movement as “action reprogramming” (AR) (Neubert et al., 2010).
The dopamine-rich basal ganglia (BG) are considered to play a major role in prediction error and AR. In monkeys, AR of saccadic eye movements is associated with neural activity in presupplementary motor area (preSMA) and subthalamic nucleus (Isoda and Hikosaka, 2008); in humans, the BG mediate the interactions between preSMA and motor cortex during AR; and in the striatum, the blood oxygenated level-dependent signal is modulated by prediction error (den Ouden et al., 2010). BG involvement is also evident from clinical studies. Patients with Parkinson's disease (PD), a disorder associated with nigrostriatal dopamine depletion, are well known to have deficits in tests of cognitive set shifting, such as the Wisconsin card sorting test (Beatty and Monson, 1990). When tested off dopamine medication, PD patients are also impaired in simpler, non-rule-based versions of set shifting similar to AR as defined here, and treatment with dopamine restores performance (Cools et al., 2001a).
The latter result implies that the behavioral consequences of a prediction error, i.e., increased RT during AR, can be modulated by dopamine, which is strikingly similar to the theoretical consequences of the “active inference” framework of Friston et al. (2010, 2012). This proposes that actions are performed in response to sensory prediction errors and that dopamine levels encode the reliability or precision of sensory information. In the present context, a deficit in dopamine should reduce the perceived value of the prediction error and thus slow AR.
We tested this idea by examining AR during a probabilistic RT task in patients with PD assessed on and off dopaminergic therapy. We quantified the unexpectedness of the stimulus using the information theory measure of surprise (Harrison et al., 2006) and tested whether this provided a quantitative measure of the AR deficit in PD. Our prediction was that unmedicated PD patients would be impaired in reacting to surprising events in the context of a generally predictable environment. Importantly, the more unexpected the event, the greater should be the AR deficit. In contrast, in unpredictable environments, surprising events occur but against an overall low expectation for any event. In such a case, a deficit in dopamine should not significantly impair performance because there should be little prediction error and consequently minimal requirement for AR.
Materials and Methods
Participants.
Ten patients with PD and 12 healthy controls participated in the study. The study was approved by the joint research ethics committee of the National Hospital for Neurology and Neurosurgery and the Institute of Neurology at University College London. Written, informed consent was obtained from all participants.
PD patients.
Ten PD patients (eight males, nine right-handed) aged between 45 and 85 years old (69 ± 3 years) participated in the study. All patients met the United Kingdom Brain Bank criteria for idiopathic PD (Hughes et al., 1992). For all patients, there was no history of any other neurological disease, head injury, psychiatric illness, or drug/alcohol abuse. The demographic and clinical details of the patients are provided in Table 1. Duration of PD varied between 4 and 16 years (mean: 7 ± 1.1 years) from the initial diagnosis. All patients were treated with levodopa and assessed twice, one on normal medication (PD-on) and also after overnight withdrawal of dopamine medication (PD-off). The average duration of medication withdrawal was 14.2 ± 2.5 hours. Patients were in the mild to moderate stages of the disease, with average scores on the Hoehn and Yahr (1967) scale of 1.4 ± 0.2 when assessed on and 2.6 ± 0.3 when assessed off dopamine medication (p = 0.03). In addition, the motor section of the unified Parkinson's disease rating scale (UPDRS) (Fahn and Elton, 1987) yielded an average score of 21 ± 3 for PD-on and 34 ± 5 for PD-off (p = 0.004; Table 1). Therefore, clinical symptoms were significantly worsened after the withdrawal of dopamine medication. However, for PD-on and PD-off, similar scores were obtained on the Mini-Mental State Examination (MMSE; p = 0.7) (Folstein et al., 1975), the Beck Depression Inventory (BDI; p = 0.8) (Beck et al., 1961), and the digit-span subtest of the Wechsler adult intelligence scale (WAISIII) (Cools et al., 2010) (p = 0.1). This indicated that all patients were non-demented (MMSE score > 26), did not suffer from clinical depression (BDI score < 15), and that short-term memory was similar between on and off medication states.
Table 1.
Demographic and clinical characteristics of the PD and control groups
| Age | Schooling | Attention | Fatigue | Hours of sleep | Quality of sleep | Digit span | MMSE | BDI | Disease duration | UPDRS III | Hoehn and Yahr score | |
|---|---|---|---|---|---|---|---|---|---|---|---|---|
| PD-on (n = 10) | 69 ± 3 | 13 ± 0.4 | 5 ± 0.5 | 3 ± 0.6 | 5 ± 0.4 | 5 ± 0.6 | 20 ± 1.5 | 29 ± 0.4 | 7 ± 1.1 | 7 ± 1.1 | 21 ± 3 | 1.4 ± 0.2 |
| PD-off (n = 10) | 69 ± 3 | 13 ± 0.4 | 6 ± 0.2 | 3 ± 0.6 | 5 ± 0.6 | 4 ± 0.4 | 19 ± 3.3 | 29 ± 0.9 | 7 ± 2.4 | 7 ± 1.1 | 34 ± 5 | 2.6 ± 0.3 |
| Controls (n = 12) | 68 ± 2 | 14 ± 0.7 | 6 ± 0.3 | 2 ± 0.3 | 7 ± 0.2 | 5 ± 0.5 | 24 ± 0.8 | 30 ± 0.1 | 4 ± 0.5 |
All data are mean ± SEM.
Healthy controls.
Twelve control subjects (seven males, 10 right-handed) aged between 50 and 84 years old (68 ± 2 years) with no current health problems or history of neurological/psychiatric illness participated in the study. Details of the controls are presented in Table 1. PD patients and controls did not differ significantly in age (p = 0.8), years of education (p = 0.1), or the MMSE (p = 0.2). In contrast, the control group had a significantly lower mean depression score than PD patients on the BDI (p < 0.01) and a significantly higher short-term memory score on the digit-span task (p < 0.05).
Finally, participants reported their attention, fatigue, and quality and amount of sleep for the previous night using a self-scored visual analog scale in which 1 represented poorest attention, quality of sleep, and maximal fatigue, and 7 represented maximal attention, quality of sleep, and least fatigue (Stefan et al., 2005). For all ratings, there was no significant difference between PD-on and PD-off (p > 0.1; Table 1). The only significant difference between controls and PD patients was for hours of sleep in which controls reported to have an additional 2 h compared with both PD-on and PD-off (p < 0.04; Table 1).
General procedure.
PD patients completed two test sessions: once after they had taken their regular dopaminergic medication (PD-on), and once after overnight withdrawal from dopaminergic medication (PD-off). The session order was counterbalanced across patients, and the two sessions were separated by at least 7 d. Control participants completed one session (control). In all sessions, participants performed the probabilistic task first and then all other tests and questionnaires subsequently.
Probabilistic RT task.
Participants sat in front of a computer screen ∼30 cm away. A custom button box with four buttons was placed in front of the dominant hand. The participants were instructed to place each one of their fingers on each of the four buttons and to maintain this position throughout the task.
Events on a single trial were then demonstrated to the participant (Fig. 1a). Initially, an un-informative warning cue (“!”) was displayed for 250 ms. After a fixation cross was presented for 1000 ms, one of the four imperative stimuli (IS) was shown in the center of the screen for 250 ms (Fig. 1a). The fixation cross then reappeared during the response period (2500 ms). During this time, the participant was required to respond to the IS as fast as possible but not at the expense of accuracy. Each IS image was associated with pressing a specific button. The stimulus–response mapping was acquired through trial and error. During this training period of 200 trials, participants received error feedback as to whether their response was correct. Importantly, by the end of the training period, all participants had successfully learned the correct stimulus–response associations (see below, error section of Results).
Figure 1.

Experimental design. a, Schematic representation of a single trial. A visual warning signal was followed by one of four novel IS. Participants were told to react as fast as possible to the IS. The order of the visual stimuli could either be unpredictable (b; blocks 1, 4) or predictable (c; blocks 2, 3). Predictable sequences were generated from a first-order Markov sequence in which there were 16 combinations that determined the relationship between the IS on trial t and on trial t − 1. Numbers within the probability matrices represent the transition probabilities. The overall probability of each IS on trial t was equal across all blocks.
During the main experiment, error feedback was removed, and participants conducted four blocks of 100 trials with short rest periods between blocks. In the first and last blocks, stimulus sequences were unpredictable, with a 0.25 probability of each IS being presented on trial t (Fig. 1b). In contrast, in the middle two blocks, the IS was drawn from a predictable first-order Markov sequence. This created a sequence with a simple structure in which the current stimulus on trial t was conditionally dependent on the stimulus of the previous trial, t − 1. Therefore, there were 16 possible combinations (events) that determined the relationship between the IS on trial t and on trial t − 1. Specifically, sampling from the distribution specified in the transition matrix, which quantified the dependence among consecutive stimuli, generated predictable sequences in which the IS order 1-2-3-4 occurred with high probability (Fig. 1c). Importantly, the overall probability of each IS was equal across all blocks.
This design created a probabilistic context that allowed participants to reduce the uncertainty about events before they occurred (Harrison et al., 2006). Moreover, because of the probabilistic nature of these sequences, occasional violations occurred in the form of surprising or unexpected stimuli that were not anticipated by the predictability of the sequence. When these unexpected or surprising events occurred, participants had to respond against their prior expectation about the forthcoming stimulus. In contrast, in the unpredictable sequences of blocks 1 and 4, specific stimuli would be surprising because of the random sampling, but these will occur against an overall low prior expectation for any stimulus. Importantly, no explicit information about the underlying patterns in each block was provided to participants. Participants were simply instructed to react with speed and accuracy.
Behavioral analysis and statistics.
For all correct responses, RT was calculated as the time between IS onset and the subsequent button press. Initially, we sought to quantify the average RT for each group during unpredictable and predictable sequence blocks. Therefore, an average RT was calculated across the two blocks of unpredictable sequence performance. Because there were clear differences between PD patients and controls (see Fig. 3a), this average was subtracted from both probable and improbable responses during the predictable sequence blocks, resulting in a difference RT (ΔRT) for both trial types. This allowed a simple comparison between groups for the highly probable (>0.75) and improbable (<0.11) trial types during the predictable sequence (Fig. 1b) and enabled us to quantify the cost of a violation of the predictable sequence. Remember that participants responded against their prior expectation about the forthcoming stimulus for improbable trial types. Therefore, for each participant, an average ΔRT was calculated for probable and improbable trial types during the predictable sequence.
Figure 3.

PD-off show a prolongation of RTs to improbable trial types occurring within a predictable sequence. a, Average ± SEM RTs (milliseconds) for controls (green), PD-on (red), and PD-off (blue) during unpredictable sequences. b, Difference between RTs during unpredictable versus predictable sequences (ΔRT). The probable and improbable trial types (events) within the first and second block of the predictable sequence are shown.
Statistically, we compared the percentage of incorrect button responses (error), average RT during the unpredictable sequence, and average ΔRT for probable and improbable trial types during the predictable sequence. Importantly, we compared the groups in a pairwise manner because the PD (on vs off) comparison was a within-subject design, whereas control versus PD was a between-subject design. Therefore, repeated-measures ANOVAs (ANOVA-rm) compared medication (within-subject design: PD-on vs PD-off) or group (between subject design: PD-on/PD-off vs controls). Because the error data were not normally distributed, we used nonparametric equivalents. Estimates of effect size are given as η2, with 0 shown if η2 < 0.05. Post hoc paired (within-subject) or independent (between-subject) t tests explored significant effects, with two-tailed scores being presented unless otherwise specified. The threshold for all statistical comparisons was p < 0.05.
Estimating surprise and mutual information.
In the current task, participants were required to respond as fast as possible but would always have some degree of uncertainty about the upcoming IS. This uncertainty could be reduced with new observations, and learning would lead to the establishment of prior expectations about upcoming IS. Because of the probabilistic nature of the sequences, occasional violations would occur in the form of unexpected IS. For these surprising IS, participants had to respond against their prior expectation. Change of RTs to such surprising IS correspond to the magnitude of the prediction error during predictable sequences. In contrast, during unpredictable sequences, when prior expectations would be overall small, occasionally more surprising IS occur against an overall unpredictable context, with little or no prediction error.
We quantified the surprise enacted by a particular IS on a trial-by-trial basis, using the assumption of an “ideal” observer. Several studies have shown previously that human observers can compute the predictability of sensory events and perform close to the performance of an ideal observer (Carpenter and Williams, 1995; Reddi et al., 2003; Carpenter, 2004; Najemnik and Geisler, 2005; Behrens et al., 2007). Therefore, we estimated the conditional probability using a Bayesian update scheme (Strange et al., 2005; Harrison et al., 2006) in which we assumed that, at the beginning of each block, participants started with the prior expectation of all IS being equally likely, as in previous work (Strange et al., 2005; Harrison et al., 2006).
For each trial (t), there were four possible IS. Therefore, the conditional probability of IS E at trial t, p(Et), was estimated from the number of occurrences of IS i up to trial t (written as nit, where i indexes the current IS type and t the trial number). Thus, the estimate at trial t is given by the following:
 |
As a result of the first-order Markov sequence, the IS occurring on the previous trial, E(t − 1), could be used to form predictions for the IS on trial t (Fig. 1c). An approximation of the joint probability distribution can be estimated from a count of IS pairs up to trial t (written as nijt, where i and j index the current and previous IS type) and is given by the following:
 |
The degree of surprise conveyed by a particular IS pair is then quantified as follows:
The surprise (S) of observing IS type i on trial t after experiencing IS type j on trial t − 1 is given by the negative log of its predicted joint probability. Therefore, surprise is a stimulus-specific measure that reflects the unexpectedness of the current IS, given the previous IS, i.e., prediction error. The amount of surprise conveyed by the occurrence of an IS is high when an IS pair is infrequent. Accordingly, during predictable sequence blocks, surprise will be overall low, but occasional violations occur in the form of highly surprising infrequent IS pairs (see Fig. 4a). Surprising trials also occur in the unpredictable sequence blocks, but in this case, such IS appear in the context of an overall absence of predictability (see Fig. 4a). We anticipated that PD patients off dopamine medication may have particular problems with surprise during predictable but not unpredictable sequence blocks.
Figure 4.
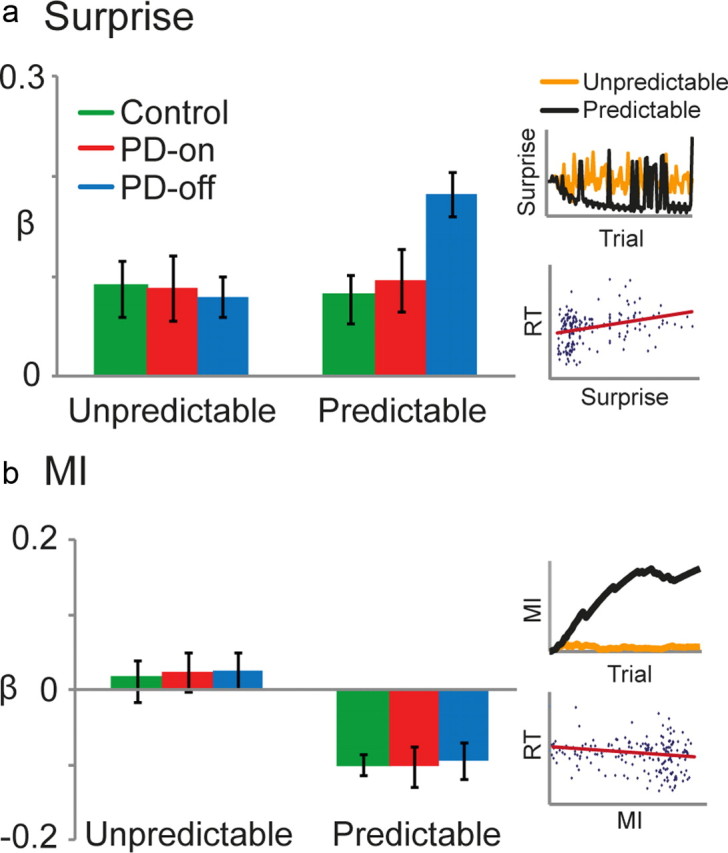
PD-off display greater RT prolongation to surprising (unexpected) IS during a predictable sequence. For each block, surprise (a) and MI (b) were regressed against RT. The β values were then averaged across the unpredictable and predictable blocks and compared between control (green), PD-on (red), and PD-off (blue). For surprise, a positive β value indicated that RT was positively correlated with surprise. For MI, a negative β value indicated that RT was negatively correlated with MI. a, Inset, Trial-by-trial surprise (bits) was modeled for unpredictable (orange) and predictable (black) sequences. The amount of surprise conveyed by the occurrence of an IS is high when an IS pair is infrequent. Accordingly, during predictable sequence blocks, surprise will be overall low, but occasional violations occur in the form of highly surprising infrequent IS pairs. Surprising trials also occur in the unpredictable sequence blocks, but, in this case, such events appear against an overall absence of predictability. Therefore, during predictable sequences, surprise represented the size of the prediction error, whereas it simply represented the rarity of stimuli during unpredictable sequences. Scatter plot of RT against surprise in the predictable blocks for a representative participant in PD-off. b, Inset, Trial-by-trial MI (bits) was modeled for the unpredictable (orange) and predictable (black) sequences. For all blocks, MI is the reduction in uncertainty of the IS on the current trial t attributable to the knowledge of the IS on the previous trial t − 1. To clarify, surprise is a stimulus-specific measure that reflects the unexpectedness of the current IS, given the previous IS (i.e., prediction error). Although MI is a measure of uncertainty that pertains to the overall context established by the sequence (Harrison et al., 2006), during the predictable sequences, MI will gradually increase as the observer learns and becomes more confident about the conditional dependencies among pairs of IS. In contrast, MI will remain low for unpredictable sequences because, even with increased sampling, participants will not gain any confidence about the forthcoming stimulus, given the previous one. Scatter plot of RT against MI in the predictable blocks for a representative participant in PD-off.
We also quantified the predictability of the current trial, ti, based on the IS presented on the previous trial, ti − 1, given by the mutual information (MI) between consecutive IS (Harrison et al., 2006). MI is the reduction in uncertainty of the IS on the current trial t as a result of the knowledge of the IS on the previous trial t − 1. Therefore, MI is a measure of uncertainty that pertains to the overall context established by the sequence (Harrison et al., 2006):
 |
During the predictable blocks, MI steadily increases as the uncertainty of IS type i on trial t, which is afforded by IS type j on trial t − 1, decreases (see Fig. 4b). In contrast, during the unpredictable blocks, MI remains low (see Fig. 4b). Therefore, with increased sampling during a predictable sequence, an observer will learn and become more confident about the conditional dependencies among pairs of IS. In contrast, MI will remain low for unpredictable sequences because even with increased sampling, participants will not gain any confidence about the forthcoming IS, given the previous one.
Data analysis.
To assess how RT was associated with MI and surprise on a trial-by-trial basis, a robust multiple regression was performed with RT as the dependent variable and MI and surprise as independent variables. For each participant, independent regressions were performed on each of the four blocks. The β values were then averaged across predictable and unpredictable blocks. Note that PD patients performance on and off medication remained separate. Again, we compared the groups in a pairwise manner because the PD (on vs off) comparison was a within-subject design, whereas control versus PD was a between-subject design. Therefore, ANOVA-rm compared β values across block type (unpredictable, predictable) and either medication (within subject design: PD-on vs PD-off) or group (between-subject design: PD-on/PD-off vs controls). Estimates of effect size are given as η2. Post hoc paired (within-subject) or independent (between-subject) t tests explored significant effects, with two-tailed scores being presented unless otherwise specified. The threshold for all statistical comparisons was p < 0.05. All data presented represent mean ± SEM.
Results
Behavioral results
All groups were able to perform the task without difficulty, with low error rates observed for the entire experiment. Across all trial types, the percentage of errors did not significantly differ between medication state (PD-on vs PD-off: Friedman's test, χ2 = 8, df = 5, p = 0.2) or group (PD-on/PD-off vs control: Kruskal–Wallis test, χ2 < 0.6, df = 1, p > 0.4) and were <6% (Table 2).
Table 2.
Percentage of error (incorrect button responses) for probable (Prob) and improbable (Improb) trial types during the predictable sequence and for the unpredictable (Unpred) sequence
| Control |
PD-on |
PD-off |
||||||
|---|---|---|---|---|---|---|---|---|
| Prob | Improb | Unpred | Prob | Improb | Unpred | Prob | Improb | Unpred |
| 0.8 ± 0:3 | 2.6 ± 0:8 | 3.5 ± 0:8.5 | 0.8 ± 0:1 | 2.2 ± 0:20 | 4 ± 0:15 | 1 ± 0:15 | 4.8 ± 0:9 | 2 ± 0:14 |
All data are median ± range.
Figure 2 shows the average RT for each of the 16 possible combinations of IS on the previous and the current trial, during predictable blocks. It is clear that participants were able to learn the relative probabilities between consecutive IS, as shown by faster RTs to the highly probable combinations (gray boxes). However, we were unable to perform statistics on these data because the probabilistic nature of the task meant that participants often did not experience all 16 combinations. At a purely observationally basis, there is a general RT difference between controls and PD patients (Fig. 2). In addition, the differences between PD-on and PD-off appear greater for the improbable combinations (Fig. 2b).
Figure 2.

Faster RT for predictable stimuli. Average ± SEM group RT for each of the 16 possible combinations between the IS on trial t and t − 1 for control (a) and PD patients (b) on (black) and off (gray) dopamine medication. Gray boxes indicate IS combinations with a high transition probability.
To explore these results, we created average RTs for unpredictable and predictable blocks. Therefore, for each participant, an average RT was calculated for their performance during the two unpredictable blocks. RT was similar for PD-on and PD-off, but controls were on average faster (Fig. 3a). This is represented by the nonsignificant difference between PD-on (956 ± 76 ms) and PD-off (975 ± 77 ms; paired t test, t(9) = 0.5, p = 0.7, Bonferroni's corrected). In contrast, controls were on average faster (814 ± 27 ms) compared with PD patients both on (independent t test, t(20) = 1.7, p = 0.05) and off (t(20) = 2, p = 0.03; Fig. 3a) medication. Consequently, to compensate for this general slowing of responses in PD and to allow the comparison between PD patients and controls, we subtracted this value from all RTs during the two blocks of predictable sequences (ΔRT).
During predictable sequences, there were highly probable (>0.75; Fig. 2, gray boxes) and improbable (<0.11; Fig. 2, no markers) IS combinations for trial t and t − 1. Therefore, an average ΔRT was calculated for probable and improbable trial types for each block of the predictable sequence. We found that PD-off and PD-on showed similar improvements in RT for probable trial types. In contrast, PD-off displayed a selective slowing in RT to improbable trials (Fig. 3b). We compared ΔRT across medication (PD-on, PD-off), trial type (probable, improbable), and block (two). There was no main effect of medication (ANOVA-rm, F(1,9) = 5, p = 0.054, η2 = 0.08) or block (F(1,9) = 1, p = 0.3, η2 = 0.02). However, the main effect of trial type (F(1,9) = 82, p = 0.0005, η2 = 0.67; Fig. 3b) and the interaction between medication and trial type (F(1,9) = 5, p = 0.048, η2 = 0.10) were significant. Because the interaction between medication, block, and trial type was not significant (F(1,9) = 0.02, p = 0.8, η2 = 0), data were collapsed across blocks. For both PD-on and PD-off, ΔRTs for probable trial types were significantly faster than for improbable trial types (PD-on probable, −60 ± 9 ms; improbable, 3 ± 16, t(9) = 6, p = 0.0005; PD-off: probable, −54 ± 20; improbable, 62 ± 14, t(9) = 5, p = 0.0005). Patients responded equally well to probable trials (t(9) = 0.3, p = 0.7) but showed a selective slowing of RTs to improbable trials when off medication (t(9) = 3, p = 0.015; Fig. 3b).
A comparison between PD-on and control showed that performance was similar across probable and improbable trial types (Fig. 3b). We compared the ΔRT of the group across trial type (probable, improbable) and block (2). The main effect of group (ANOVA-rm, F(1,20) = 0.03, p = 0.8, η2 = 0) was not significant, but there was a significant main effect for both block (F(1,20) = 9, p = 0.007, η2 = 0.10) and trial type (F(1,20) = 57, p = 0.0005, η2 = 0.55; Fig. 3b). Importantly, all interactions were nonsignificant (F(1,20) < 0.4, p > 0.06, η2 <0.04).
Finally, PD-off showed similar RT improvements as control during probable trial types but were slower to respond to improbable trials (Fig. 3b). We compared ΔRT between the PD-off and control groups across trial type (probable, improbable) and block (two). The main effect of group (ANOVA-rm, F(1,20) = 5, p = 0.04, η2 = 0.2) and trial type (F(1,20) = 10, p = 0.0005, η2 = 0.7; Fig. 3b) was significant, whereas the main effect of block was not significant (F(1,20) = 0.9, p = 0.3, η2 = 0.01). In contrast to PD-on versus control, the interaction between group, trial type, and block was significant (F(1,20) = 4.8, p = 0.04, η2 = 0.03). Independent t tests showed that, for both blocks 1 and 2, PD-off responded similarly to control participants for probable trial types (PD-off: block 1 = −35 ± 15 ms; block 2 = −74 ± 26; control: block 1 = −48 ± 10; block 2 = −66 ± 10; t(20) < 0.7, p > 0.5; Fig. 3b). In contrast and as predicted, for improbable trial types, patients off medication were slower to respond (block 1: PD-off = 48 ± 18 ms; control = 6 ± 13; t(20) = 1.8, p = 0.08; block 2: PD-off = 75 ± 22; control = −16 ± 12; t(20) = 3.6, p = 0.002; Fig. 3b).
Model-based trial-by-trial analysis
These results suggest that PD-off have a specific deficit, evident as a significant prolongation of RTs on trials that require AR. However, this analysis does not assess the effect of trial-by-trial changes in the surprise (unexpectedness) of events, nor the possible differences between predictable and unpredictable environments. Therefore, we quantified the degree to which an IS violated participants' expectations (surprise) and the extent to which an IS on the current trial could be predicted based on the IS of the previous trial (MI) (Strange et al., 2005; Harrison et al., 2006; Bestmann et al., 2008; Mars et al., 2008). To clarify, here surprise is a stimulus-specific measure that reflects the unexpectedness of the current IS, given the previous IS (i.e., prediction error). In contrast, here MI quantifies the uncertainty that relates to the overall context established by the sequence (Harrison et al., 2006). We obtained β values by regressing surprise and MI against RT for each participant, separately for predictable and unpredictable blocks.
Across all participants, increasing surprise was related to slower RT in both predictable and unpredictable blocks. PD patients, on and off medication, and controls displayed a similar RT deficit to surprise during the unpredictable sequence (β value: control = 0.09 ± 0.03; PD-on = 0.09 ± 0.03; PD-off = 0.08 ± 0.02). In contrast, PD-off showed an enhanced RT response to surprise during the predictable sequence (control = 0.08 ± 0.02; PD-on = 0.10 ± 0.03; PD-off = 0.18 ± 0.02; Fig. 4a,c). There was no significant within-subject effect of medication between PD-off and PD-on (ANOVA-rm, F(1,9) = 4.5, p = 0.06, η2 = 0.18) or between-subject group effect for PD-off and control (F(1,20) = 4.1, p = 0.056, η2 = 0.17). However, the interaction between medication and block-type (F(1,9) = 11.8, p = 0.007, η2 = 0.26) as well as group (PD-off vs control) and block type (F(1,20) = 4.4, p = 0.049, η2 = 0.16) were significant. A paired post hoc t test revealed a significant difference between PD-off and PD-on for predictable blocks (t(9) = 4.6, p = 0.001). In addition, an independent t test showed a similar difference between PD-off and control (t(20) = 3, p = 0.007; Fig. 4a). Given that the degree of dopamine depletion is strongly correlated with disease severity, we investigated whether the change in PD patient UPDRS score was correlated with the altered response to surprise (β values) during a predictable sequence from on to off medication. However, the correlation was not significant (r = 0.2, n = 10, p = 0.5). This result may be attributable to the homogeneity of our PD patients; the range of disease severity was restricted because patients were required to press four buttons in a timely manner while off dopamine medication. The main effect of group between PD-on and control (F(1,20) = 0.1, p = 0.7, η2 = 0) and the interaction between group and trial-type (F(1,20) = 0.08, p = 0.8, η2 = 0.04) were both nonsignificant. Because of the relatively small number of participants, we performed a power analysis on this critical result. With a partial η2 value of 0.004 and effect size of 0.08, power equates to 0.09. Importantly, adding an additional 100 participants would only increase the power to 0.2, suggesting that the nonsignificant result between PD-on and control is reliable. Note that this power analysis can be generalized to all null results with similar η2 and effect size values.
Conversely, increasing MI was associated with faster RTs across all participants for predictable blocks. Such a relationship was not expected for unpredictable blocks, in which MI was minimal. Therefore, β values were negative during predictable blocks (control = −0.1 ± 0.01; PD-on = −0.1 ± 0.03; PD-off = −0.09 ± 0.02) and near 0 for unpredictable blocks (control = 0.01 ± 0.03; PD-on = 0.02 ± 0.03; PD-off = −0.03 ± 0.02; Fig. 4b,c). This shows that all three groups displayed faster RTs during the predictable sequence by learning the predictable relationship between consecutive IS. There was no significant main effect of medication (ANOVA-rm, F(1,9) = 0.01, p = 0.9, η2 = 0) or group (F(1,20) < 0.1, p > 0.7, η2 = 0), and the interaction between medication and block type (F(1,9) = 0.01, p = 0.9, η2 = 0) and group and block type (F(1,20) < 0.08, p > 0.7, η2 = 0) were nonsignificant. However, for all comparisons, there was a significant main effect of block type (F(1,9)|(1,20) > 22, p < 0.0005, η2 > 0.55; Fig. 4b).
Model assumptions and model comparison
Our main result was the differential effect surprise had on RT during the predictable sequence across the three groups. We note that our analysis made several untested assumptions: first, that participants act as an ideal observer who perfectly integrate past observations within a block, with recent IS pairs having the same influence on surprise as earlier observations (Strange et al., 2005; Harrison et al., 2006; Bestmann et al., 2008; Mars et al., 2008). To reiterate, several studies have shown previously that such ideal observer models can provide accurate estimates about the responses of human observers to sensory events (Carpenter and Williams, 1995; Reddi et al., 2003; Carpenter, 2004; Najemnik and Geisler, 2005; Behrens et al., 2007). However, discarding distant information can be useful and release, for example, working memory resources. Recent work suggests that primary and executive brain regions can be distinguished by the number of past observations they represent (Harrison et al., 2011).
Based on such considerations, we explored whether our assumptions could indeed be adapted, by focusing on four models that included the extreme scenarios of no forgetting across the 100 trials of a predictable block (mforget_100), near-maximal forgetting with the memory of previous events lasting four trials (mforget_4), and two intermediate stages in which the memory of previous events lasted either 16 (mforget_16) or 32 trials (mforget_32). This is similar to previously used approaches to model the impact of surprise on corticospinal excitability during action selection (Bestmann et al., 2008). This allowed us to assess whether the differences found in our initial analysis were still present when considering a model that evokes little or no surprise (mforget_4) and also when the magnitude of surprise evoked by the stimulus series is changed by integrating over more or less trials.
Figure 5a shows an example of the trial-by-trial surprise obtained from each of these four forgetting scenarios. For each group, we performed a formal model comparison between forgetting scenarios using Bayesian model selection (Stephan et al., 2009). Initially, for each participant and model, a parametric empirical Bayes estimate of the log evidence, p(y|m), was calculated (Dempster et al., 1981). In short, given these log evidences from all subjects, we treated each model as a random variable and estimated the parameters of a Dirichlet distribution, which describes the probabilities for all models considered (Stephan et al., 2009), which then defines a multinomial distribution over the model space. This allows for computing how likely it is that a specific model caused the observed data of a randomly chosen subject and, furthermore, the exceedance probability of one model being more likely than any other model (Stephan et al., 2009). Put simply, this approach can be viewed as a random-effects analysis in which a (potentially different) model is assigned to each member of the group (Rosa et al., 2010). We used the conditional model probability to quantify an exceedance probability, i.e., our belief that a particular model is more likely than any other model, given the data from all participants (Stephan et al., 2009; Rosa et al., 2010).
Figure 5.

The influence of forgetting. a, Examples of trial-by-trial surprise (bits) obtained from a model without forgetting across the 100 trials of a predictable block (mforget_100), near-maximal forgetting with the memory of previous events lasting four trials (mforget_4), and two intermediate stages in which the memory of previous events lasted either 16 (mforget_16) or 32 (mforget_32) trials. b, For each group, we performed a formal model comparison between forgetting scenarios using Bayesian model selection: control (green), PD-on (red), and PD-off (blue). Given log evidences, p(y|m), from all subjects, we treated each model as a random variable and estimated the parameters of a Dirichlet distribution that describes the probabilities for all models considered. We used the conditional model probability to quantify an exceedance probability, p(ri|yi), i.e., our belief that a particular model is more likely than any other model. c, Distribution of differences in log-evidence for models mforget_4 and mforget_100, for each participant and all three groups. Positive values indicate stronger evidence, given the data, for mforget_100.
For control, PD-on, and PD-off, the exceedance probabilities, p(ri|yi), show that mforget_100 provides the most parsimonious explanation of the data (control = 0.83; PD-on = 0.92; PD-off = 0.88; Fig. 5b) relative to the other three models (control = mforget_32: 0.16, mforget_16: 0.005, mforget_4: 0.005; PD-on = mforget_32: 0.05, mforget_16: 0.01, mforget_4: 0.008; PD-off = mforget_32: 0.008, mforget_16: 0.05, mforget_4: 0.06). In Figure 5c, we illustrate the distribution of log-evidence differences for models mforget_4 and mforget_100. Positive values indicate stronger evidence for mforget_100 compared with the alternative model, here shown for each participant. Therefore, Figure 5c shows that, given the data, there was consistently more evidence for mforget_100, regardless of experimental group. Importantly, this analysis provides credence to our model assumptions that participants act as ideal observers across a single block.
A second assumption was uniform priors, i.e., the prior expectation of all events being equally likely, at the beginning of each block. However, carryover effects are observed in the form of larger RT improvements in the second predictable block (Fig. 3b). Therefore, surprise and MI were estimated by integrating across the 200 trials of the predictable blocks. Once again, we observed similar results in which all groups showed a comparable RT response to MI (β value: control = −0.09 ± 0.02; PD-on = −0.1 ± 0.07; PD-off = −0.11 ± 0.04), but PD-off displayed an enhanced RT response to surprise (control = 0.09 ± 0.03; PD-on = 0.11 ± 0.03; PD-off = 0.19 ± 0.02). There was no significant difference for the β values obtained for MI across medication or group (t tests; t(9|20) < 0.5, p > 0.6, Bonferroni's corrected). In contrast, there was a significant difference for surprise between PD-off and either PD-on (paired t test, t(9) = 3, p = 0.015) or control (independent t test, t(20) = 2.1, p = 0.05).
Finally, we compared responses to surprise in the first unpredictable and second predictable block. These could be regarded as measures of unpredictable and predictable performance that were uncontaminated by carryover effects. Interestingly, the differences among groups were enhanced by this analysis. Although the regression of surprise against RT obtained similar β values in block 1 (unpredictable: control = 0.1 ± 0.04; PD-on = 0.06 ± 0.04; PD-off = 0.06 ± 0.03), PD-off had greater β values in block 3 (predictable: control = 0.1 ± 0.04; PD-on = 0.1 ± 0.03; PD-off = 0.27 ± 0.05). There was a significant interaction between group/medication and block for PD-off and either PD-on (F(1,9) = 5.7, p = 0.04, η2 = 0.4) or control (F(1,20) = 10, p = 0.005, η2 = 0.3). t tests revealed, specifically in block 3, a significant difference between PD-off and either PD-on (paired t test, t(9) = 3.4, p = 0.008) or control (independent t test, t(20) = 2.5, p = 0.019). Importantly, these additional results are similar to the original analysis and suggest that the assumption of uniform priors (i.e., the prior expectation of all events being equally likely) at the beginning of each block did not spuriously cause our observed results.
Discussion
In an informative environment, such as a predictable sequence, PD patients off dopaminergic medication were able to learn the overall predictability of events but were impaired in reacting to violations of their predictions that required AR. In contrast, when having overall low expectations for any event, as in the unpredictable sequence, rare and surprising events did not involve AR, and unmedicated PD patients did not show a behavioral deficit compared with medicated PD patients and healthy controls. This suggests that PD patients off dopaminergic medication displayed a specific deficit in AR that was driven by the prediction error (unexpectedness) of the upcoming action.
Although previous research has investigated the role of dopamine in reward prediction error (Schultz, 1997), probabilistic sequence learning (Seo et al., 2010), and unexpected set shifting (Cools et al., 2001b), there is little work on the contribution of dopamine to prediction error during predictable and unpredictable sequences. It has been shown that PD patients have difficulty in changing motor or cognitive “set” (Cools et al., 1984, 2001b; Brown and Marsden, 1988) and that dopaminergic medication remediates impairments in task switching (Cools et al., 2001a). These results were explained by the role dopamine plays in facilitating the “focusing function” of the BG (Redgrave et al., 1999; Cools et al., 2001b; Frank, 2005). Specifically, during behavioral switching, dopamine facilitates the initiation of the unexpected action and suppresses the unwanted expected action (Gerfen and Engber, 1992; Cohen and Servan-Schreiber, 1993; Mirenowicz and Schultz, 1996; Cools et al., 2001b; Frank, 2005; Isoda and Hikosaka, 2007; Hikosaka and Isoda, 2010). However, the BG appears to be more involved when switching from an automatic to a more difficult task than vice versa (Cameron et al., 2009). This suggests that it may have a specific role in boosting weaker response signals to override dominant response signals (Cameron et al., 2009). Therefore, the relative weighting of these signals could be important in terms of the switching cost. In fact, our results support this view because both healthy controls and PD patients exhibit an AR deficit that was modulated by the unexpectedness of the upcoming action. Interestingly, this impairment is enhanced in PD patients off medication.
The active inference model, proposed by Friston et al. (2006, 2010), provides a possible explanation for these effects. Within this framework, dopamine is important for balancing bottom-up sensory information with top-down prior beliefs when making inferences about sensory cues that have affordance. In other words, dopamine encodes the value of the sensory prediction error (Krugel et al., 2009; Friston et al., 2010, 2012). Therefore, when we experience unexpected sensory information with high precision, we are prepared to make fast corrections of the pre-potent but incorrect action. In contrast, low precision of sensory information causes slower responses to prediction error and an increased requirement for sensory information. This is an intuitive consequence of decreasing precision, which causes the inference to be over-reliant on incorrect top-down predictions and less confident about correct sensory information.
Reduced dopamine, as in unmedicated PD patients, would result in low precision of sensory information (Friston et al., 2010). This could explain the specific deficit to surprising events that occur within an overall predictable environment. First, when a violation occurs in such an environment, it causes a sensory prediction error. To respond to this prediction error, one has to reprogram the selected action based on the correct sensory information. With low precision, the value of this is diminished and so it will take longer for AR to occur because there is a need for a greater accumulation of sensory information before bottom-up information overcomes top-down predictions. As the sensory prediction error increases with the surprise of the upcoming action, so would the action selection deficit associated with low precision. Second, in an unpredictable environment, surprising events occur but against an overall low expectation for any event. In this case, there is little sensory prediction and consequently minimal AR. Therefore, the reduced value of sensory information, originating from low precision, should have a reduced influence on action selection in an overall unpredictable context because strong top-down predictions would not exist.
The established view of dopamine is that its activity represents reward prediction error (Schultz, 1998). This is in contrast to our current hypothesis that states that dopamine encodes the reliability of the prediction error rather than the prediction error itself (Friston et al., 2010).The critical difference between these hypotheses is that, if dopamine codes reward prediction error, then the prediction itself will be lost. In contrast, if dopamine encodes reliability or precision, then the prediction error will be intact, but its reliability will be diminished. If the actual prediction error is lost, then one may predict that PD patients would never respond to an unexpected event but continue with the expected action, i.e., produce an error. However, this is not the case because error rates were similar; it simply took longer for patients to respond to the unexpected event. We suggest that the present results provide evidence that dopamine may encode the precision of the sensory prediction error rather than the prediction error itself.
Physiologically, this scheme is compatible with the current notion that dopamine bursts in the BG are not related solely to unexpected rewards but also occur at short latency after any salient event, whether rewarding or not (Redgrave et al., 1999; Redgrave and Gurney, 2006). In the present experiments, we propose that bursts would occur in response to unexpected visual cues and that the size of the burst would be proportional to the prediction error. Animal experiments show that high levels of dopamine shift striatal neurons into an “up state” in which they respond more readily to corticostriatal inputs (Plotkin et al., 2011). We suggest that this is a way in which the system can highlight the relevance of the cortical inputs that occur during surprising events.
In the active interference framework, these bursts could represent the high levels of dopamine and would effectively be according high precision to incoming information. When patients are off levodopa therapy, dopamine bursts are reduced and saliency information is lost; administration of levodopa, which is a precursor to dopamine, increases presynaptic and extrasynaptic dopamine levels and restores phasic dopaminergic activity (Fox et al., 2006; Voon et al., 2010). It is important to note that the restoration of phasic dopamine with levodopa in PD patients is only possible if there are surviving dopamine neurons whose phasic release can be enhanced. This scenario could exist in the present study because the patients were mild/moderate and able to complete the task, suggesting that at least some remaining dopamine innervation existed. Alternatively, patients off medication could have reduced tonic levels of dopamine that were restored with medication. Once again, high levels of dopamine may represent increased precision. However, it is unclear how the fast-acting but long-lasting changes observed with tonic dopamine could underlie such a trial-by-trial behavioral effect observed in the present study.
Importantly for this task, PD patients, on and off dopaminergic medication, were able to learn the stimulus–response associations. Recently, it has been suggested that the ventral striatum is important for the general learning of stimulus–response associations, whereas the dorsal striatum promotes integration of various influences on action selection (MacDonald et al., 2011). Because dopamine depletion is not uniform but more pronounced in the dorsal striatum compared with the ventral striatum in the early stages of PD (Bernheimer et al., 1973; Frey et al., 1996; Kwak et al., 2010), it may not be surprising that we specifically observed a deficit in trial-by-trial AR that was ameliorated by dopamine medication. In addition, the clear separation between the ability of PD patients off medication to learn the predictable information and inability to appropriately react to violations of this prediction suggests that distinct brain regions were involved. Previous research suggests that learning such structure or regularities is hippocampal dependent (Strange et al., 2005; Harrison et al., 2006), whereas responding to violations or prediction errors appear to involve the striatum (McClure et al., 2003; den Ouden et al., 2010).
In conclusion, PD patients off medication showed an enhanced action selection deficit to unexpected events that evoked a prediction error and required AR. To our knowledge, this study is the first to demonstrate that prediction error modulates the AR impairment observed in PD patients. We propose that dopamine encodes the reliability, or precision, of sensory information. In this framework, PD patients off medication have low dopamine levels and are therefore less confident about incoming sensory information and more reliant on top-down predictions. As a consequence, when these internal predictions are incorrect, i.e., prediction error, PD patients take longer to respond appropriately to the unexpected but correct sensory information.
Footnotes
This work was supported by the European Union Framework 7 Initiative REPLACES (J.M.G., J.C.R.), the Biotechnology and Biological Sciences Research Council (S.B.), the European Research Council (S.B.), and an ESRC/MRC 3+1 PhD studentship (M.B.). We thank the patients for their willing participation and Karl Friston for helpful discussion.
References
- Beatty WW, Monson N. Problem solving in Parkinson's disease: comparison of performance on the Wisconsin and California Card Sorting Tests. J Geriatr Psychiatry Neurol. 1990;3:163–171. doi: 10.1177/089198879000300308. [DOI] [PubMed] [Google Scholar]
- Beck AT, Ward CH, Mendelson M, Mock J, Erbaugh J. An inventory for measuring depression. Arch Gen Psychiatry. 1961;4:561–571. doi: 10.1001/archpsyc.1961.01710120031004. [DOI] [PubMed] [Google Scholar]
- Behrens TE, Woolrich MW, Walton ME, Rushworth MF. Learning the value of information in an uncertain world. Nat Neurosci. 2007;10:1214–1221. doi: 10.1038/nn1954. [DOI] [PubMed] [Google Scholar]
- Bernheimer H, Birkmayer W, Hornykiewicz O, Jellinger K, Seitelberger F. Brain dopamine and the syndromes of Parkinson and Huntington. Clinical, morphological and neurochemical correlations. J Neurol Sci. 1973;20:415–455. doi: 10.1016/0022-510x(73)90175-5. [DOI] [PubMed] [Google Scholar]
- Bestmann S, Harrison LM, Blankenburg F, Mars RB, Haggard P, Friston KJ, Rothwell JC. Influence of uncertainty and surprise on human corticospinal excitability during preparation for action. Curr Biol. 2008;18:775–780. doi: 10.1016/j.cub.2008.04.051. [DOI] [PMC free article] [PubMed] [Google Scholar]
- Brown RG, Marsden CD. An investigation of the phenomenon of “set” in Parkinson's disease. Mov Disord. 1988;3:152–161. doi: 10.1002/mds.870030207. [DOI] [PubMed] [Google Scholar]
- Cameron IG, Coe BC, Watanabe M, Stroman PW, Munoz DP. Role of the basal ganglia in switching a planned response. Eur J Neurosci. 2009;29:2413–2425. doi: 10.1111/j.1460-9568.2009.06776.x. [DOI] [PubMed] [Google Scholar]
- Carpenter RH. Contrast, probability, and saccadic latency; evidence for independence of detection and decision. Curr Biol. 2004;14:1576–1580. doi: 10.1016/j.cub.2004.08.058. [DOI] [PubMed] [Google Scholar]
- Carpenter RH, Williams ML. Neural computation of log likelihood in control of saccadic eye movements. Nature. 1995;377:59–62. doi: 10.1038/377059a0. [DOI] [PubMed] [Google Scholar]
- Cohen JD, Servan-Schreiber D. A theory of dopamine function and its role in cognitive deficits in schizophrenia. Schizophr Bull. 1993;19:85–104. doi: 10.1093/schbul/19.1.85. [DOI] [PubMed] [Google Scholar]
- Cools AR, van den Bercken JH, Horstink MW, van Spaendonck KP, Berger HJ. Cognitive and motor shifting aptitude disorder in Parkinson's disease. J Neurol Neurosurg Psychiatry. 1984;47:443–453. doi: 10.1136/jnnp.47.5.443. [DOI] [PMC free article] [PubMed] [Google Scholar]
- Cools R, Barker RA, Sahakian BJ, Robbins TW. Enhanced or impaired cognitive function in Parkinson's disease as a function of dopaminergic medication and task demands. Cereb Cortex. 2001a;11:1136–1143. doi: 10.1093/cercor/11.12.1136. [DOI] [PubMed] [Google Scholar]
- Cools R, Barker RA, Sahakian BJ, Robbins TW. Mechanisms of cognitive set flexibility in Parkinson's disease. Brain. 2001b;124:2503–2512. doi: 10.1093/brain/124.12.2503. [DOI] [PubMed] [Google Scholar]
- Cools R, Miyakawa A, Sheridan M, D'Esposito M. Enhanced frontal function in Parkinson's disease. Brain. 2010;133:225–233. doi: 10.1093/brain/awp301. [DOI] [PMC free article] [PubMed] [Google Scholar]
- Dempster AP, Rubin DB, Tsutakawa RK. Estimation in covariance component models. J Am Stat Assoc. 1981;76:341–353. [Google Scholar]
- den Ouden HE, Daunizeau J, Roiser J, Friston KJ, Stephan KE. Striatal prediction error modulates cortical coupling. J Neurosci. 2010;30:3210–3219. doi: 10.1523/JNEUROSCI.4458-09.2010. [DOI] [PMC free article] [PubMed] [Google Scholar]
- Fahn S, Elton RL . Members of the UPDRS Development Committee. Unified Parkinson's disease rating scale. In: Fahn S, Marsden CD, Caine D, Goldstein M, editors. Recent developments in Parkinson's disease. Florham Park, NJ: McMillian Health Care Information; 1987. [Google Scholar]
- Folstein MF, Folstein SE, McHugh PR. “Mini-mental state.” A practical method for grading the cognitive state of patients for the clinician. J Psychiatr Res. 1975;12:189–198. doi: 10.1016/0022-3956(75)90026-6. [DOI] [PubMed] [Google Scholar]
- Fox SH, Visanji NP, Johnston TH, Gomez-Ramirez J, Voon V, Brotchie JM. Dopamine receptor agonists and levodopa and inducing psychosis-like behavior in the MPTP primate model of Parkinson disease. Arch Neurol. 2006;63:1343–1344. doi: 10.1001/archneur.63.9.1343. [DOI] [PubMed] [Google Scholar]
- Frank MJ. Dynamic dopamine modulation in the basal ganglia: a neurocomputational account of cognitive deficits in medicated and nonmedicated Parkinsonism. J Cogn Neurosci. 2005;17:51–72. doi: 10.1162/0898929052880093. [DOI] [PubMed] [Google Scholar]
- Frey KA, Koeppe RA, Kilbourn MR, Vander Borght TM, Albin RL, Gilman S, Kuhl DE. Presynaptic monoaminergic vesicles in Parkinson's disease and normal aging. Ann Neurol. 1996;40:873–884. doi: 10.1002/ana.410400609. [DOI] [PubMed] [Google Scholar]
- Friston KJ, Daunizeau J, Kilner J, Kiebel SJ. Action and behavior: a free-energy formulation. Biol Cybern. 2010;102:227–260. doi: 10.1007/s00422-010-0364-z. [DOI] [PubMed] [Google Scholar]
- Friston K, Kilner J, Harrison L. A free energy principle for the brain. J Physiol Paris. 2006;100:70–87. doi: 10.1016/j.jphysparis.2006.10.001. [DOI] [PubMed] [Google Scholar]
- Friston K, Shiner T, Fitzger T, Galea JM, Adams R, Brown H, Dolan R, Moran R, Stephan K, Bestmann S. Dopamine, precision and affordance in active inference. PLoS Comp Biol. 2012 doi: 10.1371/journal.pcbi.1002327. In press. [DOI] [PMC free article] [PubMed] [Google Scholar]
- Gerfen CR, Engber TM. Molecular neuroanatomic mechanisms of Parkinson's disease: a proposed therapeutic approach. Neurol Clin. 1992;10:435–449. [PubMed] [Google Scholar]
- Harrison LM, Duggins A, Friston KJ. Encoding uncertainty in the hippocampus. Neural Netw. 2006;19:535–546. doi: 10.1016/j.neunet.2005.11.002. [DOI] [PMC free article] [PubMed] [Google Scholar]
- Harrison LM, Bestmann S, Rosa MJ, Penny W, Green GG. Time scales of representation in the human brain: weighing past information to predict future events. Front Hum Neurosci. 2011;5:37. doi: 10.3389/fnhum.2011.00037. [DOI] [PMC free article] [PubMed] [Google Scholar]
- Hikosaka O, Isoda M. Switching from automatic to controlled behavior: cortico-basal ganglia mechanisms. Trends Cogn Sci. 2010;14:154–161. doi: 10.1016/j.tics.2010.01.006. [DOI] [PMC free article] [PubMed] [Google Scholar]
- Hoehn MM, Yahr MD. Parkinsonism: onset, progression and mortality. Neurology. 1967;17:427–442. doi: 10.1212/wnl.17.5.427. [DOI] [PubMed] [Google Scholar]
- Hughes AJ, Daniel SE, Kilford L, Lees AJ. Accuracy of clinical diagnosis of idiopathic Parkinson's disease: a clinico-pathological study of 100 cases. J Neurol Neurosurg Psychiatry. 1992;55:181–184. doi: 10.1136/jnnp.55.3.181. [DOI] [PMC free article] [PubMed] [Google Scholar]
- Isoda M, Hikosaka O. Switching from automatic to controlled action by monkey medial frontal cortex. Nat Neurosci. 2007;10:240–248. doi: 10.1038/nn1830. [DOI] [PubMed] [Google Scholar]
- Isoda M, Hikosaka O. Role for subthalamic nucleus neurons in switching from automatic to controlled eye movement. J Neurosci. 2008;28:7209–7218. doi: 10.1523/JNEUROSCI.0487-08.2008. [DOI] [PMC free article] [PubMed] [Google Scholar]
- Krugel LK, Biele G, Mohr PN, Li SC, Heekeren HR. Genetic variation in dopaminergic neuromodulation influences the ability to rapidly and flexibly adapt decisions. Proc Natl Acad Sci U S A. 2009;106:17951–17956. doi: 10.1073/pnas.0905191106. [DOI] [PMC free article] [PubMed] [Google Scholar]
- Kwak Y, Müller ML, Bohnen NI, Dayalu P, Seidler RD. Effect of dopaminergic medications on the time course of explicit motor sequence learning in Parkinson's disease. J Neurophysiol. 2010;103:942–949. doi: 10.1152/jn.00197.2009. [DOI] [PubMed] [Google Scholar]
- MacDonald PA, MacDonald AA, Seergobin KN, Tamjeedi R, Ganjavi H, Provost JS, Monchi O. The effect of dopamine therapy on ventral and dorsal striatum-mediated cognition in Parkinson's disease: support from functional MRI. Brain. 2011;134:1447–1463. doi: 10.1093/brain/awr075. [DOI] [PubMed] [Google Scholar]
- Mars RB, Debener S, Gladwin TE, Harrison LM, Haggard P, Rothwell JC, Bestmann S. Trial-by-trial fluctuations in the event-related electroencephalogram reflect dynamic changes in the degree of surprise. J Neurosci. 2008;28:12539–12545. doi: 10.1523/JNEUROSCI.2925-08.2008. [DOI] [PMC free article] [PubMed] [Google Scholar]
- McClure SM, Berns GS, Montague PR. Temporal prediction errors in a passive learning task activate human striatum. Neuron. 2003;38:339–346. doi: 10.1016/s0896-6273(03)00154-5. [DOI] [PubMed] [Google Scholar]
- Mirenowicz J, Schultz W. Preferential activation of midbrain dopamine neurons by appetitive rather than aversive stimuli. Nature. 1996;379:449–451. doi: 10.1038/379449a0. [DOI] [PubMed] [Google Scholar]
- Najemnik J, Geisler WS. Optimal eye movement strategies in visual search. Nature. 2005;434:387–391. doi: 10.1038/nature03390. [DOI] [PubMed] [Google Scholar]
- Neubert FX, Mars RB, Buch ER, Olivier E, Rushworth MF. Cortical and subcortical interactions during action reprogramming and their related white matter pathways. Proc Natl Acad Sci U S A. 2010;107:13240–13245. doi: 10.1073/pnas.1000674107. [DOI] [PMC free article] [PubMed] [Google Scholar]
- Plotkin JL, Day M, Surmeier DJ. Synaptically driven state transitions in distal dendrites of striatal spiny neurons. Nat Neurosci. 2011;14:881–888. doi: 10.1038/nn.2848. [DOI] [PMC free article] [PubMed] [Google Scholar]
- Reddi BA, Asrress KN, Carpenter RH. Accuracy, information, and response time in a saccadic decision task. J Neurophysiol. 2003;90:3538–3546. doi: 10.1152/jn.00689.2002. [DOI] [PubMed] [Google Scholar]
- Redgrave P, Gurney K. The short-latency dopamine signal: a role in discovering novel actions? Nat Rev Neurosci. 2006;7:967–975. doi: 10.1038/nrn2022. [DOI] [PubMed] [Google Scholar]
- Redgrave P, Prescott TJ, Gurney K. Is the short-latency dopamine response too short to signal reward error? Trends Neurosci. 1999;22:146–151. doi: 10.1016/s0166-2236(98)01373-3. [DOI] [PubMed] [Google Scholar]
- Requin J, Granjon M. The effect of conditional probability of the response signal on the simple reaction time. Acta Psychol (Amst) 1969;31:129–144. doi: 10.1016/0001-6918(69)90074-2. [DOI] [PubMed] [Google Scholar]
- Rosa MJ, Bestmann S, Harrison L, Penny W. Bayesian model selection maps for group studies. Neuroimage. 2010;49:217–224. doi: 10.1016/j.neuroimage.2009.08.051. [DOI] [PMC free article] [PubMed] [Google Scholar]
- Schultz W. Dopamine neurons and their role in reward mechanisms. Curr Opin Neurobiol. 1997;7:191–197. doi: 10.1016/s0959-4388(97)80007-4. [DOI] [PubMed] [Google Scholar]
- Schultz W. Predictive reward signal of dopamine neurons. J Neurophysiol. 1998;80:1–27. doi: 10.1152/jn.1998.80.1.1. [DOI] [PubMed] [Google Scholar]
- Seo M, Beigi M, Jahanshahi M, Averbeck BB. Effects of dopamine medication on sequence learning with stochastic feedback in Parkinson's disease. Front Syst Neurosci. 2010;4:pii–36. doi: 10.3389/fnsys.2010.00036. [DOI] [PMC free article] [PubMed] [Google Scholar]
- Stefan K, Cohen LG, Duque J, Mazzocchio R, Celnik P, Sawaki L, Ungerleider L, Classen J. Formation of a motor memory by action observation. Neurosci. 2005;25:9339–9346. doi: 10.1523/JNEUROSCI.2282-05.2005. [DOI] [PMC free article] [PubMed] [Google Scholar]
- Stephan KE, Penny WD, Daunizeau J, Moran RJ, Friston KJ. Bayesian model selection for group studies. Neuroimage. 2009;46:1004–1017. doi: 10.1016/j.neuroimage.2009.03.025. [DOI] [PMC free article] [PubMed] [Google Scholar]
- Strange BA, Duggins A, Penny W, Dolan RJ, Friston KJ. Information theory, novelty and hippocampal responses: unpredicted or unpredictable? Neural Netw. 2005;18:225–230. doi: 10.1016/j.neunet.2004.12.004. [DOI] [PubMed] [Google Scholar]
- Voon V, Pessiglione M, Brezing C, Gallea C, Fernandez HH, Dolan RJ, Hallett M. Mechanisms underlying dopamine-mediated reward bias in compulsive behaviors. Neuron. 2010;65:135–142. doi: 10.1016/j.neuron.2009.12.027. [DOI] [PMC free article] [PubMed] [Google Scholar]